Idiographic complexity and the common personality ... · According to the classic dictum of...
27
Idiographic Complexity and the Common Personality Dimensions Insensitivity, Extraversion, Neuroticism, and Orderliness D. VAN KAMPEN* Department of Clinical Psychology, Vrije Universiteit, Amsterdam, The Netherlands Abstract This paper reports on an attempt to investigate empirically whether the common personality dimensions S or Insensitivity, E or Extraversion, N or Neuroticism, and G or Orderliness, as postulated in Van Kampen’s modification of Eysenck’s PEN model, would in principle give rise to the same level of predictive accuracy as a set of personal traits obtained in each of a series of assessments of separate individuals. Using a special methodology to ‘convert’ the nomothetic dimensions into factors that are of idiographic relevance, (within-person) correlations and multiple correlations between the idio- graphic traits and the nomothetic dimensions S, E, N, and G (predictors) were com- puted in a sample of 83 subjects. Results showed that the idiographic traits could be expressed in most cases as linear combinations of the four idiographically converted nomothetic factors, and that the degree to which an individual’s idiographic data could be explained nomothetically was unrelated to this individual’s conformity to the nomothetic zero-correlational structure of the four dimensions. Copyright # 2000 John Wiley & Sons, Ltd. INTRODUCTION According to the classic dictum of Kluckhohn and Murray (1953), ‘Every man is in certain respects (a) like all other men, (b) like some other men, (c) like no other man’ (p. 53). Although this dictum seems necessarily true, there is substantial controversy in personality psychology about the ‘best’ level on which man should be studied. According to Allport’s (1937) primarily idiographic orientation, ‘The outstanding characteristic of man is his individuality’ (p. 3). Instead of seeking characteristics that may be applied to all persons, or at least to a group of persons, one must give priority to those features that are only applicable to the single individual. Although Allport Copyright # 2000 John Wiley & Sons, Ltd. Received 3 March 1999 Accepted 22 October 1999 European Journal of Personality Eur. J. Pers. 14: 217–243 (2000) *Correspondence to: Dr D. van Kampen, Department of Clinical Psychology, Vrije Universiteit, De Boelelaan 1109, 1081 HV Amsterdam, The Netherlands. E-mail address: [email protected]
-
Upload
nguyenkhuong -
Category
Documents
-
view
213 -
download
0
Transcript of Idiographic complexity and the common personality ... · According to the classic dictum of...

Idiographic Complexity and theCommon Personality Dimensions
Insensitivity, Extraversion,Neuroticism, and Orderliness
D. VAN KAMPEN*
Department of Clinical Psychology, Vrije Universiteit,
Amsterdam, The Netherlands
Abstract
This paper reports on an attempt to investigate empirically whether the commonpersonality dimensions S or Insensitivity, E or Extraversion, N or Neuroticism, and Gor Orderliness, as postulated in Van Kampen's modi®cation of Eysenck's PEN model,would in principle give rise to the same level of predictive accuracy as a set of personaltraits obtained in each of a series of assessments of separate individuals. Using a specialmethodology to `convert' the nomothetic dimensions into factors that are of idiographicrelevance, (within-person) correlations and multiple correlations between the idio-graphic traits and the nomothetic dimensions S, E, N, and G (predictors) were com-puted in a sample of 83 subjects. Results showed that the idiographic traits could beexpressed in most cases as linear combinations of the four idiographically convertednomothetic factors, and that the degree to which an individual's idiographic data couldbe explained nomothetically was unrelated to this individual's conformity to thenomothetic zero-correlational structure of the four dimensions. Copyright # 2000 JohnWiley & Sons, Ltd.
INTRODUCTION
According to the classic dictum of Kluckhohn and Murray (1953), `Every man is incertain respects (a) like all other men, (b) like some other men, (c) like no other man'(p. 53). Although this dictum seems necessarily true, there is substantial controversyin personality psychology about the `best' level on which man should be studied.According to Allport's (1937) primarily idiographic orientation, `The outstandingcharacteristic of man is his individuality' (p. 3). Instead of seeking characteristics thatmay be applied to all persons, or at least to a group of persons, one must give priorityto those features that are only applicable to the single individual. Although Allport
Copyright # 2000 John Wiley & Sons, Ltd. Received 3 March 1999Accepted 22 October 1999
European Journal of PersonalityEur. J. Pers. 14: 217±243 (2000)
*Correspondence to: Dr D. van Kampen, Department of Clinical Psychology, Vrije Universiteit,De Boelelaan 1109, 1081 HVAmsterdam, The Netherlands. E-mail address: [email protected]

(1961) considers it possible to de®ne a common (or nomothetic) trait as `a categoryfor classifying functionally equivalent forms of behavior in a general population ofpeople' (p. 349), such a trait can only be seen as an approximation of a `real' trait orpersonal disposition. In deriving common dimensions by means of factor analysis, forinstance, `An entire population (the larger the better) is put into the grinder, and themixing is so expert that what comes through is a link of factors in which everyindividual has lost his identity . . . Whether a factor is really an organic disposition inany one individual life is not demonstrated. All one can say for certain is that a factoris an empirically derived component of the average personality, and that the averagepersonality is a complete abstraction' (Allport, 1937, p. 244; see also Bonarius, 1969).Furthermore, Allport (1937, 1962) has argued that the individuality of a person maybe found in the unique patterning or organization of variables within the single case,the study of which he has called `morphogenic' (Allport, 1962). Even if we start withcommon traits or generalized dimensions, every single person weaves these attributesinto a unique idiomatic system, in which these common dimensions probably arerelated in ways that are dissimilar to the relationships that can be observed nomo-thetically. However, as these common dimensions are always imposed on theindividual, and as individuality is not considered to be `the residual ragbag left overafter general dimensions have been exhausted' (Allport, 1962, p. 410), a trulymorphogenic psychology starts with those features that seem to be directly relevant toa certain case, studying, for instance, the unique thought structure of an individual asrevealed in a series of personal letters (Baldwin, 1942; see also Allport, 1965). Also inthe ®eld of predictionÐ`which, we are told, is the acid test of a valid science' (Allport,1962, p. 411)Ðemphasis on data about the single case is expected to cause higherlevels of predictive accuracy than merely relying on a nomothetic framework ofactuarial prediction. The ®nding, for instance, that boys with a certain `negative'family background have a 70 per cent chance of starting a criminal career, impliesnothing, according to Allport, with respect to the chance of a particular boy with asimilar background doing the same. This particular boy's `unique world containsin¯uences unknown to the statistician: perhaps an a�ectionate relation with a certainteacher, or a wise word once spoken by a neighbor. Such factors may be decisive andmay o�set all average probabilities' (Allport, 1962, p. 411). Hence, personalitypsychology, as seen from a strictly idiographic point of view, must be able to portrayboth the uniqueness and the complexity of the individual case. By using methodscapable of revealing personal dispositions and their patterned relationships within theindividual, a truly morphogenic personality psychology aims at the in-depth under-standing of unique persons. In a more liberal sense, however, the term `idiographic'can also be used to denote procedures that concern the application of common traits,but in which these traits are only applied if they are relevant to a particular individual(Allport, 1962; Runyan, 1983).
Notwithstanding the possible merits of the idiographic approach (see, e.g., Pelham,1993), most personality psychologists maintain that in order to study behaviourscienti®cally, one has to generalize from the individual case, for, although the singlecase must indeed be recognized as `a useful source of hunches' (Allport, 1962, p. 406),science has always to do with replicable phenomena that can be accounted for interms of adequate common or general principles. That is, to endorse that the ultimategoal of science is to ®nd unity in diversity. In order to abstract from the individualcase, the individual data must, of course, be postulated to have at least something in
218 D. van Kampen
Copyright # 2000 John Wiley & Sons, Ltd. Eur. J. Pers. 14: 217±243 (2000)

common. In Eysenck's nomothetic personality theory, for instance, these commonfeatures are already assumed to be present at what Eysenck considers the lowest levelof personality organization, because the habitual responses at that level are believedto correlate in the population, giving rise to primary traits which are considered to beof a higher level (see, e.g., Eysenck, 1947). In a similar vein, Holt (1962) has postu-lated that individual data usually refer to variations above or below the mean of someattribute. According to him, `It is a mistake to focus personology on just those aspectsof a person that are unique', for leaving out everything a person has in common withother people results precisely in the `residual ragbag' that Allport (1962) consideredimpossible (see Holt, 1962, p. 398). Moreover, as Holt (1962) points out, `If everypersonality structure were as much a law unto itself as Allport implies, . . . there wouldbe no transfer from one case study to another. As anyone knows who has tried it,there is a great deal' (p. 398). Therefore, in keeping with these considerationsnomothetically oriented personality psychologists have argued that the mainobjective in personality psychology is the isolation of those (presumably few)personality factors that are not only applicable to people in general, but that are alsonecessary and su�cient to describe the personality of any given individual (see alsoLamiell, 1981). Since in his view the idiographic approach as a separate methodologyin personality psychology can be dismissed, Holt (1962) considers both the terms`idiographic' and `nomothetic' as super¯uous. To him, there can be only onemethodology in personality psychology as a science (without the need to call thismethodology `nomothetic'), because, in his opinion, it should be taken for grantedthat the laws that govern individual variation are just as abstract as the laws that coverthe general case.
In a way, the distinction between the idiographic (or individualizing) and thenomothetic (or generalizing) approach refers to a pseudo-problem. For if we want todescribe an individual trait, `we have to take one of two courses: either we create aunique word (or neologism) for each unique trait, or we use a unique con®guration ofexisting words. The ®rst approach is clearly impossible for communication, let alonescience; personology would be a complete Babel. The second solution, however, turnsout to be a concealed form of nomothesis, for what is a unique con®guration ofexisting worlds but a ``fallacious attempt to capture something ine�ably individual bya complex net of general concepts''?' (Holt, 1962, p. 391). Indeed, every so-calledindividual trait is in fact nomothetic, for the words we use to describe such a trait arealways applicable to more than one person (De Groot, 1966, p. 363). On the otherhand, however, creating concepts and categories that do justice to the behaviour ofspeci®c individuals is certainly what Allport meant by idiographic, and, therefore, thereal di�erence between the idiographic and the nomothetic approach may be found inthe question `whether the individual will be studied in enough detail to permit theformulation of idiographic traits and classes of behavior, or whether the individualwill be described solely in terms of a prior set of nomothetic categories' (Runyan,1983, p. 420). In fact, as Bem and Allen (1974) have pointed out, the idiographicapproach resembles that used by the layman: `When we are asked to characterize afriend, we do not invoke some a priori set of ®xed dimensions which we apply toeveryone. Rather, we permit ourselves to select a small subset of traits which strike usas pertinent and to discard as irrelevant the other 17,993 trait terms in the lexicon'(p. 510). Despite the fact that the idiographic approach thus de®ned makes use ofcommon trait terms, and that Allport's (1937) contention that a common trait `is not
Common personality dimensions 219
Copyright # 2000 John Wiley & Sons, Ltd. Eur. J. Pers. 14: 217±243 (2000)

a true trait at all, but is merely a measurable aspect of complex individual traits'(p. 299) is now dismissed, the problem still remains that a di�erent set of terms wouldbe required for each individual, leading, of course, to the uneasy situation that theterms used for one person cannot be related to the terms used for another person.Moreover, as Levy (1970) has noted, although `There is no reason to object onprinciple to the suggestion by Rosenzweig that the individual may be conceived of``as a world of events constituting a population, subject to both statistical analysisand dynamic conceptualization'' (1951, p. 213)', and, therefore, that the structuralanalysis of within-person phenomena, by means of, for instance, Kelly's (1955) RoleConstruct Repertory Test or Cattell's P-technique of factor analysis (see, e.g., Cattell,1966), seems to be wholly appropriate if we want to study a particular person, both`the value and meaning of data collected by these methods can only be found withinthe context of laws that hold for all individuals. The identity of the individual withwhich we are concerned in the study of personality is accounted for by the particularvalues obtained by him on the variables contained in these laws and by the postulatesthat state the ways in which these will interact with each other. It is not possible to gobeyond this and remain within the con®nes of science' (Levy, 1970, p. 76). Lastly,Allport's (1962) objection to the use of a `rigid' nomothetic framework in actuarialprediction cannot be taken seriously, for as his own example (see above) clearlydemonstrates, it seems that precisely the addition of one or more common factorsÐinthe example, for instance, `social support' and `a�ection'Ðis needed to improve thepredictive accuracy. Although in practice it is sometimes necessary to combine ourheads with our models in prediction (e.g., Kleinmuntz, 1990), it seems far moreimportant to use our heads to improve our models (cf. Dawes, Faust and Meehl,1993, p. 364).
Granted, then, that the ®nal way to study personality is certainly nomothetic, andthat, sooner or later, we will have to opt for a ®xed set of common personalitydimensions, there are at least three problems left. In the ®rst place, in selecting somepersonality factors as being `basic', `major' or `fundamental', di�erent guidelines havebeen followed by di�erent investigators (see, e.g., Costa and McCrae, 1992; Eysenck,1992, 1994a, b; Goldberg, 1993; Saucier and Goldberg, 1996). According to Eysenck(1994b), for instance, in order to qualify a personality factor as basic, the factor mustform part of a general nomological network that has been tested bymaking deductionsfrom it `as to how people at various positions on the relevant personality dimensionswould behave in carefully designed experimental situations' (p. 8). In the case ofEysenck's P or Psychoticism dimension, for instance, testable predictions have beenmade by stating that di�erences in scores between schizophrenics and normals onmeasures theoretically related to schizophrenia (e.g., eye-tracking behaviour or latentinhibition) should be paralleled by similar score di�erences between high and low Pscorers (see for a summary, e.g., Eysenck, 1994a). In contradistinction to this, the(lexical) Big Five notion of what constitutes a major factor of personality (see, e.g.,Goldberg, 1993) has not been guided by psychological theory, but by the so-calledlexical hypothesis which states that the most salient or socially relevant personalitycharacteristics that are observed in the process of human interaction have at a timebeen encoded as single terms in natural languages, and that, thus, the establishment ofa truly comprehensive taxonomy of basic personality factors could proceed from athorough examinationÐby means of synonym ratings, cluster analysis and factoranalysisÐof all personality-descriptive terms contained in a dictionary. It has been
220 D. van Kampen
Copyright # 2000 John Wiley & Sons, Ltd. Eur. J. Pers. 14: 217±243 (2000)

argued, however, both by Eysenck (1994b) and McCrae and Costa (1985a), that theresulting lexical model might perhaps be more concerned with the structure oflanguage than with the structure of personality, notwithstanding the fact that two ofthe Big Five factorsÐSurgency and Emotional StabilityÐare clearly similar to thedimensions Extraversion and Neuroticism (reversed) postulated by Eysenck (seeMcCrae and Costa, 1985b; Goldberg and Rosolack, 1994). Moreover, the use oflaypersons in the lexical approach as the ultimate `experts' in de®ning the basicvariables of personality has also been questioned (Block, 1995). Therefore, in our ownresearch (Van Kampen, 1993, 1996, 1997), we, too, have opted for a theory-basedapproach in the selection of basic personality dimensions. Starting with Eysenck'sPENmodel, and criticizing Eysenck's P theory, we postulated four major dimensions,namely Insensitivity (S), Extraversion (E), Neuroticism (N), and Orderliness (G).Because it was found that our factors S and G, which took the place of Eysenck's Pdimension, correlated with the Big Five dimensions Agreeableness (reversed) andConscientiousness (Van Kampen, 1996), the conclusion was drawn that, even fromdi�erent perspectives, the dimensions S, E, N, and G must be considered basicdimensions of personality. However, with so many di�erent viewpoints, and alsonoting that some investigators (see, e.g., Moosbrugger and Fischbach, 1999; Ortet,Iba nÄ ez, Moro, Silva and Boyle, 1999; Gibbons and Rammsayer, 1999) still adhere toEysenck's Psychoticism dimension, in the research reported in this article the factorsInsensitivity, Extraversion, Neuroticism, and Orderliness are merely selected torepresent our preferredÐand not the only possibleÐnomothetic model.
A second problem associated with the need to opt for a ®xed set of commonpersonality factors is related to the idiographic notion that the correlations (betweenhabitual responses or primary traits) that underlie these common dimensions may bedi�erent for di�erent persons. That is, if we follow the (now-preferred) nomotheticapproach, the resulting common dimensionsÐand their loadings, referring to the`relevance' of the de®ning variables (cf. Lamiell, 1981, p. 277)Ðmay in fact be con-sidered to apply to `people in general', but not necessarily to each particular person,despite the assertion of most nomotheticists that these common factors areappropriate for the personality description of any given individual. Indeed, asBakan (1969) has argued, it seems wise to distinguish in psychology between `general-type' and `aggregate-type' propositions, because whereas general-type propositionshold for each member of a prede®ned class of people, aggregate-type propositionsapply only to a class of people as a group (see also Lamiell, 1990). Of course, thedilemma stemming from this distinction is real, but, as yet preferring the nomotheticapproach, at least a reasonable solution can be acquired if we realize that there is noneed to assume that the correlations mentioned above are always the same for di�erentgroups of individuals. In this respect, the recognition of Kluckhohn and Murray(1953) that `Every man is in certain respects . . . like some other man', and thus thatsome generalizations are merely group speci®c, is important. What is being assertedhere is that di�erent correlations may be found when total groups are subdividedaccording to sex or age or personality characteristics, and that these parameterstherefore may be seen as moderator variables. Indeed, as has been stated by Eysenck(1967), `What is true of experimental and applied psychology is equally true ofcorrelational psychology . . . Here too it might be suggested that correlational psych-ology, just like experimental psychology, is subject to typological troubles anderroneously makes the same assumptions of lack of individual di�erencesÐeven when
Common personality dimensions 221
Copyright # 2000 John Wiley & Sons, Ltd. Eur. J. Pers. 14: 217±243 (2000)

investigating individual di�erences!' (p. 26). Hence, in factor analytic personalitystudies common dimensions may be accepted, provided that the invariance of thesefactors `with change in sample along such parameters as sex, age, class, and educationmust be rigorously demonstrated. No claims for the ``existence'' of a factor can beentertained seriously until and unless such proof of invariance is given, or until theexact rules of change of factor composition with change of parameters are established'(Eysenck and Eysenck, 1969, p. 326). Although Eysenck himself has studied theinvariance of his P, E, andN factors with respect to only one single parameter (sex), theinvariance of the factors S, E, N, and G was investigated by us, on our part, withchange in sample along a more extended set of parameters, consisting of two `external'parameters, viz. sex and age (sometimes adding a third one, intelligence), and four`internal' parameters, viz. the dimensions S, E, N, andG themselves (see VanKampen,1993, 1997). Starting each study in a series of factor analytic investigations with a set ofpotential S, E, N, and G items, and replacing in each subsequent investigation thoseitems that did not load on an `intended' factor in at least one of the subgroups formedon the basis of the selected parameters (e.g., a subgroup of females or a subgroup ofintrovert subjects), we eventually obtained four factors that proved to be highlyinvariant (all Phi coe�cients of factor similarity were greater than 0.90; see Tucker,1951) and that were clearly interpretable as Insensitivity, Extraversion, Neuroticism,and Orderliness. Thus, it can be stated that the de®nition and meaning of these factorsis almost identical for di�erent (groups of) people, irrespective of their sex, age, and/orposition on the four factors. Elsewhere, we have typi®ed this approach as semi-idiographic (VanKampen, 1981), but the term `super-nomothetic' might be applied aswell. The four invariant factors can be measured by means of Van Kampen's (1997)4DPT or Four-Dimensional Personality Test.
The third and last problem that will be discussed here is whether the chosen set ofcommon personality factorsÐin our case S, E, N, and GÐmight indeed be used asan alternative to the idiographic approach, given for instance Allport's (1962) claimthat `Only a complete understanding of [an individual's] personality will give us abasis for sure prediction' (p. 412). Of course, it cannot be denied that an idiographicanalysis of a particular individual might result in a far more complex or richerdescription of his or her personality than is possible on the basis of a (relatively small)set of nomothetic dimensions, whether `semi-idiographically' de®ned or not. It is true,for instance, that individual traits, if formulated in much detail, are likely to remainrelatively uninformative if they are applied to other persons (see Allport, 1937, p. 302;Runyan, 1983, p. 421), although it might be added that in most of these cases the`uninformativeness' seems to stem primarily from the intermingling of di�erentpersonality features, not from the features themselves. However, it is equally true, asLevy (1970) has argued, that in science complexity has no value in and of itself.`Indeed, the history of the law of parsimony suggests that the opposite is the case.What we seek in a theory is minimum complexity for any given degree of explanatorypower. Thus, if one personality theory contained only two factors and the other,sixteen, the former would be preferred, provided it did as good a job in explaining andpredicting behavior' (Levy, 1970, p. 77). From a nomothetic point of view, therefore,it seems not even desirable to construct a theory that will portray a person in all hiscomplexity, not to speak of the fact already mentioned that the additional informa-tionÐand thus the additional complexity the theory deals withÐthat might enhancethe predictive accuracy, can achieve this only if it is de®ned nomothetically and set in
222 D. van Kampen
Copyright # 2000 John Wiley & Sons, Ltd. Eur. J. Pers. 14: 217±243 (2000)

a framework of actuarial prediction. Hence, to investigate whether our ®xed set ofcommon personality dimensions does enough justice to the idiographic complexity ofthe individual case, we have to demonstrate that our set of common factors might inprinciple give rise to the same level of predictive accuracy as a set of personal traitsobtained in each of a series of assessments of separate individuals. To accomplish this,it seems su�cient to correlate the individual traits obtained for each person with thedimensions Insensitivity, Extraversion, Neuroticism, and Orderliness, for if thesecorrelations prove to be high, other variables of interest may be predicted withcorresponding levels of predictive accuracy. In this paper we will present such acorrelational study. However, as it is not possible to derive the usual (nomothetic)matrix of correlations between idiographic and nomothetic traits, a methodologysuggested by Kelly's (1955) personal construct psychology has been applied in orderto `convert' the dimensions S, E, N, and G into `pseudo-individual' traits (see below),after which within-person correlations were calculated between the two sets ofpersonality dimensions. Furthermore, in this article we will consider the additionalmorphogenic issue of the patterning or organization of variables within the singlecase, although we will do this merely from an `idiographically-converted' nomotheticperspective by paying attention only to the organization of the pseudo-individualfactors. This part of the study was carried out in order to investigate whethermorphogenic deviations from the nomothetic pattern of zero correlations between thedimensions S, E, N, and G (see Van Kampen, 1997) have any in¯uence on the degreeof explanation of the idiographic traits by the pseudo-individual factors that representthe common dimensions.
METHOD
Subjects
The subjects who participated in this study are 83 individuals who responded to awritten request from their family doctors in the towns of Kampen and Almelo (in theprovince of Overijssel, The Netherlands) to complete a test booklet containing thetwo inventories described below. Altogether, we contacted three general practitionerswho were all willing to co-operate in this study. The inventories were sent to 500 oftheir patients (250 males and 250 females, aged 20 to 50 years), resulting in a responserate of 16.6 per cent, which appears to be rather low (see also below). However, thisrate can perhaps be explained in the light of the extensive amount of time required to®ll in the ®rst of the two inventories. Of the 83 subjects 53 are inhabitants of Kampenand 30 of Almelo. The total group consists of 25 male and 58 female subjects with amean age of 35.96 years and a standard deviation of 7.67.
Instruments
All participants were sent two inventories, the INI or Idio-Nomo Inventory and the4DPT or Four-Dimensional Personality Test. The INI, which was speci®cally con-structed for this investigation, consists of two parts, the `idio-part' and the `nomo-part'. In the idio-part of the INI, the subjects were ®rst of all requested to list thenames of ten persons, beginning with their own name, and subsequently listing thenames of nine other persons that they knew closely. In case they did not want to
Common personality dimensions 223
Copyright # 2000 John Wiley & Sons, Ltd. Eur. J. Pers. 14: 217±243 (2000)

mention the full names of their relatives and friends, subjects were allowed to mentiononly ®rst names or the initials of their ®rst or last names. Next, the participants wererequested to describe themselves as accurately as possible in free format using at mostten adjective terms or separate sentences. Finally in responding to the INI, they hadto rate themselves and the other nine persons previously listed on each of these (self-descriptive) idiographic terms or sentences as well as on 48 (4� 12) short statements(e.g., likes to meet people; see also Table 1) that together constitute the `nomo-part' ofthe INI and that are believed to represent the same four common and invariantpersonality factors as measured by means of the 4DPT. In fact, these statements wereoften shortened versions of more complex 4DPT items. All ratings were made on a®ve-point Likert scale ranging from 1 (`not applicable at all') to 5 (`wholly applic-able'). Altogether, therefore, each participant had to rate in principle ten individualson (at most) 58 personality characteristics, resulting in 580 ratings. It was expected, ofcourse, that the traits generated to describe oneself would be evaluated mostly as`wholly applicable'. After completing the INI, the participants had to ®ll in the 4DPT,a questionnaire consisting of 64 items (to be answered with `yes' or `no') for themeasurement of the dimensions Insensitivity (S), Extraversion (E), Neuroticism (N),and Orderliness (G). Both Cronbach's a coe�cients and the test±retest reliabilities ofthe 4DPT scales have been found to be quite satisfactory, with indices ranging from alowest value of 0.78 for S to a highest value of 0.90 for N with respect to a (VanKampen, 1997) and from 0.75 for G to 0.90 for E for the stability coe�cients with anintra-test interval of ®ve weeks (Van Kampen, unpublished data). As alreadyindicated above, the 4DPT scales also proved to be practically uncorrelated, with nocorrelations exceeding 0.25 in a `total' sample of about 550 subjects, although in asubsample of roughly 275 female subjects a somewhat larger correlation of ÿ0.34(p5 0.001) was found between E and N (Van Kampen, 1997). As for the validity ofthe 4DPT scales, expected convergence (`high') and discriminant (`low' or `zero')correlations were obtained between these scales and, for instance, the NEO-PI scalesby Costa and McCrae (1985), the FFPI scales by Hendriks (1997), andÐmore tellingfrom a theoretical perspectiveÐthe scales of our SSV or Schizotypic SyndromeQuestionnaire (Van Kampen, 1997; Van Kampen, unpublished data; Van Kampen,1999, `The SSV model: a LISREL supported description of the unfolding of theschizophrenic prodrome', in preparation).
Data analysis
In order to relate the idiographic terms or sentences to the nomothetic dimensionsInsensitivity, Extraversion, Neuroticism, and Orderliness, ®rst of all a principal com-ponents analysis was carried out on the self- and other-ratings, using as variables the48 items contained in the nomo-part of the INI that were believed to represent thesefactors. As these ratings were obtained for 83 persons that were instructed to ratethemselves and nine others, the principal components analysis is based in principle ona sample of 830 subjects. However, due to the fact that three participants had listedonly nine persons and that on some items no ratings were given for some of theremaining 827 subjects, the actual number of subjects in the sample (after listwisedeletion of missing data) was 804. Four principal components were extracted, followedby a normalized varimax rotation to simple structure. This number was primarilydictated by the expectation that the factors would represent the above-mentioned
224 D. van Kampen
Copyright # 2000 John Wiley & Sons, Ltd. Eur. J. Pers. 14: 217±243 (2000)

dimensions, but proved also correct after applying Cattell's scree-test to theeigenvalues associated with all 48 components. Of course, the actual interpretationof the INI factors were based on inspection of the item loadings. As a second step in themethodology here described, for each of the 804 subjects we calculated the factorscores on each of the four rotated factors, together with the scores on four INI scalesconstructed on the basis of the nomo-part items that loaded 0.35 or higher on a givenfactor. As the ®rst person rated by each of the participants in this study is theparticipant himself or herself, we might expectÐgiven our assumption that the INIfactors re¯ect the dimensions S, E, N, and GÐthat the factor and scale scorescalculated for the ®rst-rated persons are correlated with the participants' 4DPT scores.These correlations (whether disattenuated or not), therefore, will give us someadditional information on how to interpret the INI factors. Most important in thisinvestigation was, however, the re-arranging of the factor scores derived in the totalgroup of 804 rated subjects in such a form that for each of the 83 participants a separatematrix of factor scores was obtained in which the rows represented the four INI factorsand the columns the ten rated individuals. These matricesÐthat are similar to ®xedconstruct matrices in the sense of Kelly (1955) with the ten rated individuals regardedas elementsÐwere used to relate the four common INI factors to the idiographic termsand sentences obtained in the idio-part of the INI, for if a certain row of factor scorescalculated for one of the 83 participants actually correlates with a certain pattern ofratings associated with a given idiographic traitÐa pattern similar to a personalconstruct vector as de®ned by Kelly (1955)Ðthe nomothetic and the idiographic traitmust have something in common, at least for the participant who has mentioned thatindividual trait. Thus, for this participant, the individuals rated with high factor scoreson a common trait will tend to have also high ratings on an individual trait that wasapplied to them, and vice versa. Multiple correlations between the (dependent)idiographic variablesÐstill expressed in the form of personal construct vectorsÐandthe four rows of factor scores (predictors) were also calculated. As the separate rows offactor scores are each related to a common personality factor, but at the same timemimic the patterns of scores or ratings that are associated with individual traits, theconstructs or dispositions that can be assumed to lie behind those rows of factor scoreswill here be denoted pseudo-individual factors. The term `pseudo-individual' is meantto underline that these dispositions are not real in the sense of Allport, i.e., they cannotbe considered an `organic disposition' in someone's individual life (see theIntroduction). Moreover, the marking `pseudo-individual' reminds us that thesefactors still refer to nomothetic dimensions. However, their idiographic relevance isclearly illustrated by the fact that they are only applicable to the single case and thattheir correlations and multiple correlations with any vector of ratings associated withan idiographic trait are within-person, not between-person correlations. It is this dualnature that makes these pseudo-individual factors appropriate to address the issue ofthe coverage of the individual traits by a set of common dimensions. An extraadvantage of the use of these `idiographically converted' personality dimensionsconsists of the possibility of investigating the exact relationships between these factorsat the individual level, instead of assuming that the intercorrelations associated withthese relationships are always identical to the nomothetic correlations that existbetween the personality factors after which the pseudo-individual factors have beenmodelled. Regarding, therefore, the nomothetic correlations as average tendencies thatmight not hold for separate individuals, the question of the patterning of the
Common personality dimensions 225
Copyright # 2000 John Wiley & Sons, Ltd. Eur. J. Pers. 14: 217±243 (2000)

pseudo-individual factors has also been addressed in this article. This was doneespecially to ®nd out whether the degree of coverage of the idiographic traits by thepseudo-individual factors variesÐin whatever directionÐwith the level of corre-lations actually found between the four rows of factor scores associated with thesepseudo-individual factors. For each of the 83 participants the degree of coverage wasde®ned in terms of the median value obtained for the above-mentioned multiplecorrelations between the four rows of factor scores and each of the vectors of ratingsassociated with a particular idiographic trait, after which these median values werecorrelated with the values of the (six) within-person correlationsÐboth taken asobserved and converted to absolute valuesÐbetween the pseudo-individual factors,which were also calculated for each of the 83 participants. The median values obtainedfor the multiple correlations were also correlated with other variables, such as the4DPT scores for S, E, N, and G.Moreover, the average values of the six within-personcorrelations between the four pseudo-individual dispositions were computed toexamine whether the nomothetically demonstrated independence of the 4DPTscalesÐand the expected corresponding independence of the four INI scalesÐcould also be observed from an idiographic, or, more precisely, from an`idiographically converted' nomothetic perspective. In this context, it was alsodetermined for how many of the participating subjects this independence holds (bothfor each pair of factors and with respect to the number of zero correlations), whende®ning a zero correlation between two pseudo-individual factors as a correlationbetween ÿ0.35 and 0.35.
RESULTS
Before providing the results proper, it seems meaningful to inform the reader aboutthe means and standard deviations of the 4DPT scales obtained in this investigation.For despite the low response rate of 16.6 per cent mentioned earlier, the means andstandard deviations of these scales are almost the same as those obtained previouslyin a sample of 1263 addressees (aged 20 to 60 years) with a response percentage of49.6 (see Van Kampen, 1997, Table 5). In fact, using t-tests no signi®cant di�erenceswere observed between the means obtained in both samples, either before (n � 624)or after (n � 487) deleting all subjects of 50 years and over in the larger sample tomake the two samples more comparable in age. Hence, there seems no reason todoubt the representativeness of the results found in this study.
Table 1 mentions the loadings of the 48 items of the nomo-part of the INI that werefound after varimax rotating the ®rst four principal components. The rotated factorsF1, F2, F3, and F4 explain 13.0, 12.5, 10.3, and 11.7 per cent of the total variance,respectively, mounting up to 47.5 per cent collectively. To facilitate the interpretationof the factors, the itemsÐtranslated into EnglishÐare also listed in Table 1, togetherwith an indication of on which factor they were expected to load. As can be seen, allINI items except oneÐitem No. 39Ðloaded according to their postulated nature,given our criterion that to be regarded as salient a factor loading must be at least0.35. The four factors, therefore, are clearly interpretable as Extraversion (F1),Insensitivy (F2), (low) Orderliness (F3), and Neuroticism (F4). Even the higherthan expected loading of item 39 on F2 seems to make sense, because one ofthe characteristics associated with high Insensitivity is the conviction of being
226 D. van Kampen
Copyright # 2000 John Wiley & Sons, Ltd. Eur. J. Pers. 14: 217±243 (2000)
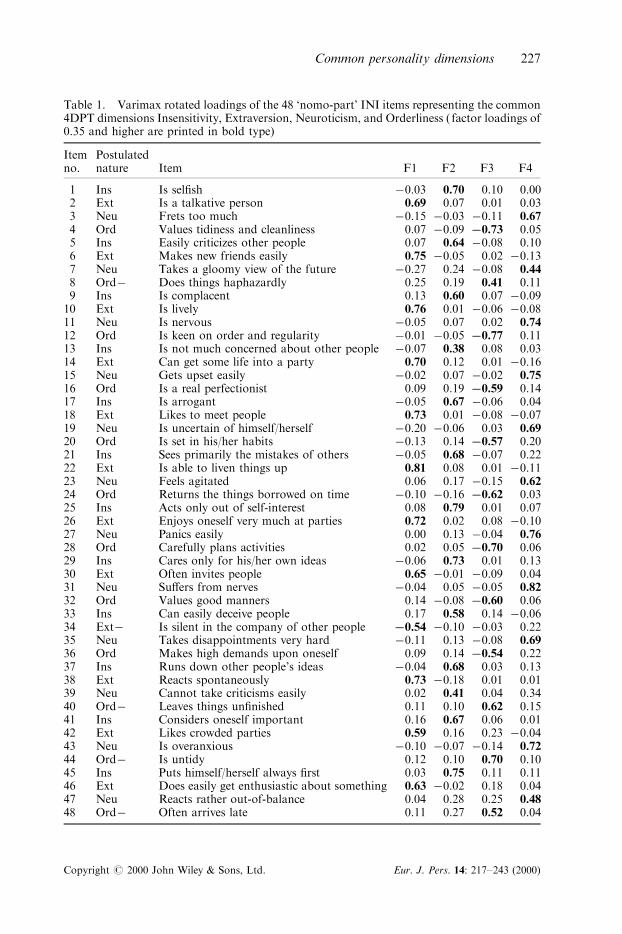
Table 1. Varimax rotated loadings of the 48 `nomo-part' INI items representing the common4DPT dimensions Insensitivity, Extraversion, Neuroticism, and Orderliness ( factor loadings of0.35 and higher are printed in bold type)
Itemno.
Postulatednature Item F1 F2 F3 F4
1 Ins Is sel®sh ÿ0.03 0.70 0.10 0.002 Ext Is a talkative person 0.69 0.07 0.01 0.033 Neu Frets too much ÿ0.15 ÿ0.03 ÿ0.11 0.674 Ord Values tidiness and cleanliness 0.07 ÿ0.09 ÿ0.73 0.055 Ins Easily criticizes other people 0.07 0.64 ÿ0.08 0.106 Ext Makes new friends easily 0.75 ÿ0.05 0.02 ÿ0.137 Neu Takes a gloomy view of the future ÿ0.27 0.24 ÿ0.08 0.448 Ordÿ Does things haphazardly 0.25 0.19 0.41 0.119 Ins Is complacent 0.13 0.60 0.07 ÿ0.0910 Ext Is lively 0.76 0.01 ÿ0.06 ÿ0.0811 Neu Is nervous ÿ0.05 0.07 0.02 0.7412 Ord Is keen on order and regularity ÿ0.01 ÿ0.05 ÿ0.77 0.1113 Ins Is not much concerned about other people ÿ0.07 0.38 0.08 0.0314 Ext Can get some life into a party 0.70 0.12 0.01 ÿ0.1615 Neu Gets upset easily ÿ0.02 0.07 ÿ0.02 0.7516 Ord Is a real perfectionist 0.09 0.19 ÿ0.59 0.1417 Ins Is arrogant ÿ0.05 0.67 ÿ0.06 0.0418 Ext Likes to meet people 0.73 0.01 ÿ0.08 ÿ0.0719 Neu Is uncertain of himself/herself ÿ0.20 ÿ0.06 0.03 0.6920 Ord Is set in his/her habits ÿ0.13 0.14 ÿ0.57 0.2021 Ins Sees primarily the mistakes of others ÿ0.05 0.68 ÿ0.07 0.2222 Ext Is able to liven things up 0.81 0.08 0.01 ÿ0.1123 Neu Feels agitated 0.06 0.17 ÿ0.15 0.6224 Ord Returns the things borrowed on time ÿ0.10 ÿ0.16 ÿ0.62 0.0325 Ins Acts only out of self-interest 0.08 0.79 0.01 0.0726 Ext Enjoys oneself very much at parties 0.72 0.02 0.08 ÿ0.1027 Neu Panics easily 0.00 0.13 ÿ0.04 0.7628 Ord Carefully plans activities 0.02 0.05 ÿ0.70 0.0629 Ins Cares only for his/her own ideas ÿ0.06 0.73 0.01 0.1330 Ext Often invites people 0.65 ÿ0.01 ÿ0.09 0.0431 Neu Su�ers from nerves ÿ0.04 0.05 ÿ0.05 0.8232 Ord Values good manners 0.14 ÿ0.08 ÿ0.60 0.0633 Ins Can easily deceive people 0.17 0.58 0.14 ÿ0.0634 Extÿ Is silent in the company of other people ÿ0.54 ÿ0.10 ÿ0.03 0.2235 Neu Takes disappointments very hard ÿ0.11 0.13 ÿ0.08 0.6936 Ord Makes high demands upon oneself 0.09 0.14 ÿ0.54 0.2237 Ins Runs down other people's ideas ÿ0.04 0.68 0.03 0.1338 Ext Reacts spontaneously 0.73 ÿ0.18 0.01 0.0139 Neu Cannot take criticisms easily 0.02 0.41 0.04 0.3440 Ordÿ Leaves things un®nished 0.11 0.10 0.62 0.1541 Ins Considers oneself important 0.16 0.67 0.06 0.0142 Ext Likes crowded parties 0.59 0.16 0.23 ÿ0.0443 Neu Is overanxious ÿ0.10 ÿ0.07 ÿ0.14 0.7244 Ordÿ Is untidy 0.12 0.10 0.70 0.1045 Ins Puts himself/herself always ®rst 0.03 0.75 0.11 0.1146 Ext Does easily get enthusiastic about something 0.63 ÿ0.02 0.18 0.0447 Neu Reacts rather out-of-balance 0.04 0.28 0.25 0.4848 Ordÿ Often arrives late 0.11 0.27 0.52 0.04
Common personality dimensions 227
Copyright # 2000 John Wiley & Sons, Ltd. Eur. J. Pers. 14: 217±243 (2000)

superior to other personsÐas witnessed, for instance, by the loadings of the INI items17, 29, and 41Ðwhich would explain why persons scoring high on F2 `cannot takecriticisms easily'.
To measure the four INI factors, four scales were constructed, that were denotedEXT, INS, ORD, and NEU, respectively. All INI scales, except the NEU scale,consisted of the 12 items originally postulated to load on one of the factors. Thus item39, despite its loading of 0.42 on F2, was not added to the INS scale. In the NEU scaleitem 39 was omitted, leaving only 11 items in this scale for the measurement of F4. Inthe third column of Table 2, the internal consistencies (Cronbach's a) for these scalesare listed, together with the a coe�cients for the 4DPT scales. Both sets of values werecalculated in our sample of participants, and notÐas is not even possible with respectto the 4DPTÐin our sample of rated subjects. It is evident that both the INI and the4DPT scales are su�ciently reliable. Moreover, the a values obtained here for the4DPT are nearly the same as previously reported in a relatively large sample ofroughly 530 subjects (Van Kampen, 1997).
Beside scores on the four INI scales, for each rated subject the factor scores on F1,F2, F3, and F4 were calculated. In Table 2, the correlations between the INI factorscores and the INI scale scores are given, both for the `total' sample of rated subjectsand for the much smaller sample of persons who had responded to the written requestof their family doctor. It can be seen that for both samples the factor scores and scalescores are very highly correlated, as was, of course, expected. In addition, Table 2shows that the intercorrelations between the four INI scales are all lower than 0.35(and most of them even much lower), although in the sample of rated subjects, due toits large size, some small correlations were found to di�er signi®cantly from zero. Ofcourse, this too is as expected, not only because the INI factors are varimax factors(and thus by de®nition orthogonal), but also because the INI scales must be regardedas congruent measures of the (nearly uncorrelated) 4DPT scales. In the presentsample of participants, the correlations between the 4DPT scales also prove to bealmost zero (see Table 2). Only the correlation between E and G is somewhat largerthan previously found (see Van Kampen, 1997), but even this correlation (r � ÿ0.34,p5 0.01) cannot be considered to deviate much from zero. Perhaps most important inTable 2, it can be seen that in the group of participants relatively high correlationswere found between the 4DPT scales on the one hand, and the INI factors and INIscales on the other hand. After correcting the 4DPT and INI scales for their unreli-abilities (expressed by 1ÿ a), the convergence correlations between both instrumentsproved to be as high as 0.78 for S/INS, 0.91 for E/EXT, 0.85 for N/NEU, and 1.00 forG/ORD, in fact demonstrating that the above-mentioned interpretation of the factorsF1, F2, F3, and F4 is not without further support. The 4DPT and INI factors,therefore, largely seem to re¯ect the same fundamental dimensions of personality.
Altogether, on the idio-part of the INI, the participants ®lled in 759 adjective termsand/or short phrases to describe themselves, ranging from a lowest number of four to ahighest one of ten, the maximum number allowed in the INI. In 61 of the 83 cases thenumber of idiographic descriptions was found to be ten, resulting in a mean number of9.15 self-descriptions with a standard deviation of 1.64. After correlating the numberof self-descriptions with the 4DPT scales and sex and age, a signi®cant positivecorrelation of 0.36 (p5 0.01, n � 80) was found between this number and E. Thus,extravert subjects use slightly more terms to describe their own personality thanintrovert subjects. All other correlations were both not signi®cant and practically zero.
228 D. van Kampen
Copyright # 2000 John Wiley & Sons, Ltd. Eur. J. Pers. 14: 217±243 (2000)

Table 2. Correlations between the INI factors and INI scales for A: the sample of rated subjects (n � 804±826) and B: the sample of participants(n � 81±83). For the sample of participants the correlations between the 4DPT scales, the INI factors, and the INI scales are also given (n � 79±82) aswell as the a coe�cients (n � 73±83) for the 4DPT and INI scales and the correlations between the 4DPT and INI scales corrected for attenuation(correlations for corresponding variables are printed in bold type; corrected correlations are printed in brackets)
Sample Factor/scale a F1 F2 F3 F4 EXT INS ORD NEU E S G N
A F1 ÐF2 ÿ0.00 ÐF3 ÿ0.00 0.00 ÐF4 ÿ0.00 ÿ0.00 0.00 Ð
EXT 0.99*** 0.04 0.04 ÿ0.10** ÐINS 0.05 0.99*** 0.05 0.09* 0.08* ÐORD ÿ0.06 ÿ0.07* ÿ0.99*** 0.06 ÿ0.11** ÿ0.12** ÐNEU ÿ0.11** 0.13*** ÿ0.05 0.98*** ÿ0.20*** 0.20*** 0.10** Ð
B F1 ÐF2 ÿ0.06 ÐF3 0.02 0.21 ÐF4 ÿ0.07 ÿ0.07 ÿ0.01 Ð
EXT 0.89 0.99*** ÿ0.01 0.06 ÿ0.16 ± (0.91)INS 0.85 0.01 0.98*** 0.27* 0.04 0.03 Ð (0.78)ORD 0.81 ÿ0.09 ÿ0.27* ÿ0.98*** 0.12 ÿ0.13 ÿ0.33** Ð (1.00)NEU 0.91 ÿ0.16 0.02 ÿ0.04 0.99*** ÿ0.26* 0.12 0.14 Ð (0.85)
E 0.87 0.78*** 0.21 0.19 ÿ0.08 0.80*** 0.25* ÿ0.25* ÿ0.12 ÐS 0.78 0.00 0.65*** 0.18 ÿ0.06 0.01 0.63*** ÿ0.23* 0.01 0.11 ÐG 0.78 ÿ0.21 ÿ0.20 ÿ0.83*** 0.07 ÿ0.24* ÿ0.24* 0.86*** 0.10 ÿ0.34** ÿ0.18 ÐN 0.89 ÿ0.11 ÿ0.21 ÿ0.14 0.76*** ÿ0.19 ÿ0.15 0.24* 0.76*** ÿ0.28* 0.00 0.24* Ð
*p5 0.05; **p5 0.01; ***p5 0.001.
Commonperso
nality
dim
ensio
ns
229
Copyrig
ht#
2000JohnWiley
&Sons,Ltd.
Eur.J.Pers.
14:217±243(2000)

Compared with the ratings of the other nine subjects, most self-ratings in the idio-part of the INI were found to deviate substantially from the midpoint (3) of the ®ve-point scales used, as was, of course, expected. Actually, the means of the absolutevalues of these deviation scores proved to be 1.74 (with a standard deviation of 0.51)for the self-ratingsÐin this case indicating that most participants evaluated their ownself-generated traits as `wholly applicable'Ðand 1.17 (SD � 0.78) for the ratings ofthe nine other subjects. For the ratings on the 48 ®ve-point scales in the nomo-part ofthe INI, no such distributional asymmetry was observed, ®nding that the means (andstandard deviations) of the absolute values of the deviation scores were 1.12(SD � 0.78) for the self-ratings and 1.05 (SD � 0.77) for the other-ratings.
For 728 of the 759 individual traits, (within-person) correlations and multiplecorrelations (R) could be calculated between the vectors of ratings for these traits forthe (usually) ten individualsÐthe participants themselves and their nine relatives/friendsÐlisted in the INI on the one hand, and the rows of factor scores for F1, F2,F3, and F4, representing the pseudo-individual factors on the other hand. In Table 3,the means and standard deviations of these 728 correlationsÐnow converted toabsolute valuesÐand multiple correlations are given, together with the minima andmaxima of these correlations and multiple correlations. The pseudo-individualfactors, associated with the nomothetic factors F1, F2, F3, and F4, are here denotedPF1, PF2, PF3, and PF4. Although, in principle, the above-mentioned distributionalasymmetry should have an impact on these correlations, we decided to calculate these®gures on the full `ten-element vectors' of ratings and factor scores, for thesecorrelations seemed to us somewhat more dependable than the correlations calculatedafter considering only nine individuals (that is, after excluding the self-ratings) (see,however, the Discussion). As Table 3 clearly illustrates, on average the four pseudo-individual factors correlate nearly to the same extent with the individual traits.Furthermore, the ranges of these correlations, both expressed by the four standarddeviations and the minimum and maximum values, are almost identical. The sameimpression results from inspecting Figure 1, in which the correlations (absolutevalues) and multiple correlations of the pseudo-individual factors PF1, PF2, PF3, andPF4 with each individual traitÐafter categorizing them into the classes 1±10 (with1 � r or R5 0.10; 2 � 0.10±0.19; 3 � 0.20±0.29; etc)Ðare graphically displayed,providing for each class the frequencies and percentages associated with them. Itis clear from Table 3 and especially from Figure 1 that most within-person Rvalues are relatively high, with only 11.1 per cent of all multiple correlationslower than R � 0.60. The coverage, therefore, of the idiographic traits by the fourpseudo-individual factors, when taken collectively, seems highly remarkable. The
Table 3. Means, standard deviations, and minimum and maximum values of the correlations(r, absolute values) and multiple correlations (R) between all idiographic traits (I, n � 728) andthe pseudo-individual factors PF1 (Ext), PF2 (Ins), PF3 (Ordÿ), and PF4 (Neu)
r I/PF1 r I/PF2 r I/PF3 r I/PF4 R I/PF
Mean 0.38 0.40 0.39 0.38 0.80SD 0.25 0.25 0.25 0.26 0.15Minimum 0.00 0.00 0.00 0.00 0.13Maximum 0.96 0.98 0.96 0.97 1.00
230 D. van Kampen
Copyright # 2000 John Wiley & Sons, Ltd. Eur. J. Pers. 14: 217±243 (2000)

Figure 1. Frequencies, percentages, and corresponding bar graphs of categorized (r or R class)correlations (r) and multiple correlations (R) between idiographic traits and pseudo-individual factors (PF)
Common personality dimensions 231
Copyright # 2000 John Wiley & Sons, Ltd. Eur. J. Pers. 14: 217±243 (2000)

within-person correlations between the idiographic variables and the separate rows offactor scores are (much) lower on the average.
Although the coverage of the individual traits was found to be rather extensive, theabove-mentioned R values refer only to the 728 idiographic traits taken as a group ofvariables. That is, the mean value of R (Table 3) is rather uninformative with respectto the coverage of the individual traits mentioned by each particular subject. Toindex, therefore, the individual coverage of the idiographic traits, the median of theR values obtained for each participant's idiographic traitsÐhere denoted medRÐwas calculated, after which the mean (and standard deviation) of this median valuewas computed to ®nd out whether the individual coverage was substantial or not.The medR values (n � 81) were found to have a mean of 0.82 and a standarddeviation of (only) 0.08, evidently signifying that the coverage of the idiographictraits by the four pseudo-individual factors was also very extensive for most personsindividually. The minimum and maximum values of medR proved to be 0.54 and0.98, respectively.
Given our ®nding that the INI factors F1, F2, F3, and F4 could be interpreted asExtraversion, Insensitivity, (low) Orderliness, and Neuroticism, respectively, the sameinterpretation might be expected to hold for the pseudo-individual factors PF1, PF2,PF3, and PF4. However, in order to examine the validity of this statement speci®callyfrom an idiographically converted nomothetic perspective, the prediction was madethat among the idiographic traits that were found to correlate to a high degree with apseudo-individual factor, many would seem to be related as regards content to theINI or 4DPT factor after which that pseudo-individual factor was modelled. There-fore, selecting the 20 individual traits that correlated the highest with PF1, PF2, PF3,or PF4, we inspected their contents. As may be concluded from Table 4Ðin whichthe 4� 20 selected terms or sentences are translated into EnglishÐthese contents areusually very similar to the contents of the 4DPT or INI items loading on the factors Eor F1, S or F2, G or F3, and N or F4, respectively. Hence, both the nomothetic 4DPTor INI factors and the pseudo-individual traits stemming from them clearly refer tothe same basic personality factors.
Altogether we found 28 idiographic trait terms or sentences (see Table 5) thatcorrelated less than 0.30 with any of the four pseudo-individual factors andthat, therefore, are evidently not covered by these factors. Although many of theseindividual trait terms as regards content seem to be related to the 4DPT or INIdimensions as well, the almost `zero' correlations now obtained for them clearlysuggest that the meaning of these terms deviates from the meaning usually attributedto them, at least for the participants that have mentioned these 28 terms to describetheir personality. We will return to this subject in the Discussion.
Table 6 mentions the means and standard deviations, together with the minimumand maximum values, of the correlations between each pair of pseudo-individualfactors computed for each of the participants in this study. This table clearly showsthat the means of these correlations are near to zero, which is very much as wasexpected. However, it is also clear that the ranges of these correlations, re¯ected bythe standard deviations and the minimum and maximum values, are rather wide,which suggests that the nomothetic independence of the 4DPT factors S, E, N, andGÐhere `translated' ultimately into the independence of the pseudo-individualfactors PF1, PF2, PF3, and PF4Ðdoes not hold for all individuals. De®ning a `zero'correlation between two pseudo-individual factors as a correlation between ÿ0.35
232 D. van Kampen
Copyright # 2000 John Wiley & Sons, Ltd. Eur. J. Pers. 14: 217±243 (2000)

Table 4. The 4� 20 idiographic self-descriptions with the highest (positive or negative)correlations with the pseudo-individual factors PF1, PF2, PF3, or PF4
PF1 PF2
1 Spontaneous, pleasant 0.96 1 Kind ÿ0.982 Extravert, outgoing 0.95 2 Amicable ÿ0.963 Mixing well with others 0.93 3 Interested in other people ÿ0.964 Pacemaker at parties 0.92 4 Frank ÿ0.935 Uncertain ÿ0.92 5 Easy (indolent) ÿ0.926 Socially skilled 0.91 6 Dutiful ÿ0.927 Likes to pry into everything 0.91 7 Home-loving ÿ0.928 Neatness ÿ0.89 8 Sometimes aware of
sel®shness0.91
9 Sociability 0.88 9 Ready to help ÿ0.9110 Does not show feelings
easilyÿ0.88 10 Masking his/her true
feelingsÿ0.91
11 Quiet ÿ0.88 11 Pliable ÿ0.9012 Has the gift of the gab 0.87 12 Companionable ÿ0.9013 Spontaneous 0.87 13 Helping other people,
responsibleÿ0.89
14 Professionally skilled ÿ0.87 14 Is afraid of rows ÿ0.8915 Home-loving ÿ0.87 15 Committed ÿ0.8816 Quiet ÿ0.87 16 Warm-hearted ÿ0.8717 Headstrong 0.86 17 Gets easily enthusiastic ÿ0.8718 Shy ÿ0.86 18 Cheerful ÿ0.8719 Lively 0.85 19 Good listener ÿ0.8720 Sociable, to be sure 0.85 20 Pleasant ÿ0.87
PF3 PF4
1 Tidy ÿ0.96 1 Disappointed 0.972 Dainty ÿ0.95 2 Not afraid to say things
to othersÿ0.96
3 Purposeful ÿ0.93 3 Often seeing danger 0.954 Orderly/punctual ÿ0.93 4 Tense 0.945 Optimistic 0.92 5 Feels uncomfortable in
company0.93
6 Perfectionist ÿ0.92 6 Quickly anxious 0.937 Likes tidying up ÿ0.92 7 Order � regularity 0.938 Precise in doing his job ÿ0.92 8 Shy 0.929 Slovenly 0.91 9 Uncertain in his job 0.9210 Not giving up ÿ0.91 10 Restless 0.9211 Responsive to other people ÿ0.91 11 Sensible ÿ0.9212 Careful ÿ0.90 12 Does not express oneself 0.9113 Neat ÿ0.89 13 Easily worried about
family0.91
14 Precise ÿ0.89 14 Little self-con®dence 0.9115 Precise ÿ0.89 15 Flexible ÿ0.9116 Busy 0.88 16 Down-to-earth ÿ0.9117 Hard-working ÿ0.88 17 Always very thoughtful 0.9018 Not afraid to say things
to othersÿ0.88 18 Afraid of certain people 0.90
19 Sometimes quiet (hesitant) ÿ0.88 19 Nervous 0.9020 Careless (not clearing
things away)0.87 20 Not giving up ÿ0.90
Common personality dimensions 233
Copyright # 2000 John Wiley & Sons, Ltd. Eur. J. Pers. 14: 217±243 (2000)

and 0.35, Table 6 lists the percentages of subjects (participants) for which a correla-tion is `zero'. These percentages, with a mean of 55.6 per cent, imply that for 50 to60 per cent the correlation between any two pseudo-individual factors is `zero', andfor 40 to 50 per cent deviating from `zero'. Of course, it may occur that thecorrelations between more than two pseudo-individual factors are `non-zero'. In fact,of the 81 participants for which these correlations could be calculated only two(2.5 per cent) did show a pattern of all six within-person correlations between the fourpseudo-individual factors lying between ÿ0.35 and 0.35. For 13 participants (16.0 per
Table 5. Twenty-eight idiographic self-descriptionswith correlations5 0.30 with PF1, PF2, PF3, and PF4
Self-con®dentImpatientMakes too high demands on oneselfObstinateEngaged in othersLiving regularlyForgetfulWanting to do too muchFairI regard myself as uglyLate riserSociability/keeping social contactsFanaticalUncertainWaiting to see which way the cat jumpsProfoundSkilfulFairCreative in searching for solutionsIs sometimes unable to delegate thingsImpulsiveResponsibleEnjoying lifeVery sweetReliableAlways busyInquiringAfraid of dying
Table 6. Means, standard deviations, and minimum and maximum values of the within-person correlations (n � 81) between the pseudo-individual factors PF1 (Ext), PF2 (Ins), PF3(Ordÿ), and PF4 (Neu). In the bottom row the percentages of `zero' correlations are listed,de®ning a `zero' correlation as a correlation between ÿ0.35 and 0.35
r PF1/PF2 r PF1/PF3 r PF1/PF4 r PF2/PF3 r PF2/PF4 r PF3/PF4
Mean 0.05 0.17 ÿ0.02 ÿ0.06 ÿ0.20 ÿ0.03SD 0.41 0.37 0.41 0.38 0.40 0.41Minimum ÿ0.73 ÿ0.69 ÿ0.84 ÿ0.90 ÿ0.92 ÿ0.94Maximum 0.84 0.84 0.83 0.75 0.61 0.93
% r � `0' 59.26 54.32 60.49 58.02 49.38 51.85
234 D. van Kampen
Copyright # 2000 John Wiley & Sons, Ltd. Eur. J. Pers. 14: 217±243 (2000)

cent) the number of `zero' correlations proved to be ®ve, for 22 subjects (27.2 per cent)four, for 24 (29.6 per cent) three, for 14 (17.3 per cent) two, for ®ve (6.2 per cent) one,whereas for only one participant (1.2 per cent) all six factor correlations were found todeviate from `zero'. We might conclude, therefore, that the patterning of the factorsPF1, PF2, PF3, and PF4 is often dissimilar to the orthogonal pattern associated withthe 4DPT dimensions S, E, N, and G.
Given this ®ndings, the question was addressed of whether these deviations from`zero' have any in¯uence on the degree of coverage of the idiographic traits for eachseparate individual. In Table 7 the correlations are shown between the value ofmedR, obtained for each participant, and the values of the six correlations (r)between the pseudo-individual factors, also obtained for each participant. The lattervalues were taken both as they were observed and according to their absolute values.Moreover, in Table 7 the correlations are presented between the values of medR andeach participant's scores on the S, E, N, and G scales of the 4DPT, and his or her ageand sex. As can be seen from this table, of the correlations with the 12 r values onlyone is signi®cant (the correlation with the correlation between PF1 (�Ext) and PF4(�Neu)), although relatively low (ÿ0.34; p5 0.01). It seems, therefore, that thedegree of coverage of the idiographic traits for each separate individual is practicallyunrelated to their morphogenic pattern of correlations between the pseudo-individual factors. This conclusion holds also with respect to the correlationsfound for the 4DPT scales and for sex and age, notwithstanding the fact that thecoverage of the idiographic traits was found to be signi®cantly correlated (p5 0.05)with the 4DPT scores S (ÿ0.28), E (ÿ0.23), and G (0.23). However, the multiple
Table 7. Correlations of medR with the valuescalculated for each participant of the correlations (asobserved and taken absolutely) between the pseudo-individual factors (n � 81) and with the 4DPT scales S,E, N, and G, and sex and age (n � 79±81)
medR
r PF1/PF2 ÿ0.07r PF1/PF3 0.08r PF1/PF4 ÿ0.34**r PF2/PF3 0.01r PF2/PF4 ÿ0.07r PF3/PF4 ÿ0.03r(abs) PF1/PF2 0.13r(abs) PF1/PF3 0.10r(abs) PF1/PF4 0.05r(abs) PF2/PF3 0.18r(abs) PF2/PF4 0.02r(abs) PF3/PF4 0.05
S ÿ0.28*E ÿ0.23*N 0.12G 0.23*Sex 0.13Age 0.15
*p5 0.05; **p5 0.01.
Common personality dimensions 235
Copyright # 2000 John Wiley & Sons, Ltd. Eur. J. Pers. 14: 217±243 (2000)

correlation between these 4DPT scores and medR proved to be somewhat higher(0.38; p5 0.001), implying that the individual coverage of the idiographic traits issomewhat greater for subjects low on Insensitivity and Extraversion, and high onOrderliness.
DISCUSSION
The most important result of this investigation is, without any doubt, the high degreeof coverage of the idiographic traitsÐboth as a group of variables and with respect tothe traits mentioned by each individual participant in this studyÐby the fournomothetic dimensions Insensitivity (S), Extraversion (E), Neuroticism (N), andOrderliness (G) that we have postulated in our model of personality (Van Kampen,1993, 1996, 1997). In this investigation these personality dimensions have beenmeasured by a speci®cally constructed inventoryÐthe INI or Idio-Nomo Inven-toryÐin order to convert the nomothetic dimensionsÐnormally measured by meansof the 4DPT or Four-Dimensional Personality Test (Van Kampen, 1997)Ðinto four`pseudo-individual' or `idiographically converted' factors, thereby making itpossibleÐas was at least expectedÐto relate (with the aid of within-person correla-tions and multiple correlations) the idiographic variables to the nomothetic dimen-sions. It was found that only 11.1 per cent of the multiple correlations (R) betweeneach individual trait and the four pseudo-individual dimensions proved to be lowerthan R � 0.60, while the mean of each participant's median value of R (medR),representing the coverage for each separate subject, was as high as 0.82, with astandard deviation of only 0.08. The correlations of the individual traits with thepseudo-individual factors, each considered separately, were much lower on theaverage (means: 0.38±0.40), although also some very high correlations were observed.Furthermore, it could be demonstrated that the conversion of the nomotheticdimensions into pseudo-individual factors does indeed make sense, for the idio-graphic descriptions correlating highest with the four pseudo-individual factorsproved to be very similar with regard to their contents to the items contained in the4DPT scales, which implies that the nomothetic dimensions and the pseudo-individual factors basically refer to the same personality constructs. Also, the meansof the correlations between the pseudo-individual factors calculated for each subjectseparately were found to be almost `zero' (the highest mean correlation was ÿ0.20),re¯ecting that the (nomothetic) independence of the 4DPT dimensions could also beobserved after converting them into pseudo-individual factors. The conclusion,therefore, seems wholly warranted that most idiographic traits, although in factresulting in a far more complex or richer description of anyone's individual person-ality, can be simply located in the nomothetic framework of the four personalitydimensions mentioned above. Especially if we realize that complexity has no value inscience in and of itself, and that the law of parsimony dictates that we must strive atscienti®c theories with minimum complexity for any given degree of explanatorypower (Levy, 1970), it seems clear that our chosen set of four common and invariant4DPT factors might indeed be used as an alternative to the idiographic approach. Thesame conclusion can be drawn when taking into account that the independence of theidiographically converted factors certainly does not hold for all individuals. In fact, ofthe 83 participants in this study only two individuals were found with all six
236 D. van Kampen
Copyright # 2000 John Wiley & Sons, Ltd. Eur. J. Pers. 14: 217±243 (2000)

intercorrelations for the pseudo-individual factors lying between ÿ0.35 and 0.35,i.e., the range of values supposed in this investigation to denote a `zero' correlation,while a correlation of this magnitude between any two pseudo-individual factorscould be observed only for about 50 to 60 per cent of the participants. Despite this®nding, which is in line with Loevinger's (1994) criticism of the ®xed correlational(zero) structure that is assumed to apply to all people in nomothetic models, theindividual coverage of the idiographic traitsÐindexed by medRÐproved to bepractically independent from the values of the intercorrelations of the pseudo-individual factors that could be calculated for each separate participant. Likewise, theindividual coverage was not found to be in¯uenced to any practically signi®cantdegree by each participant's (now independent) 4DPT scores (and by his or her sexand age). Therefore, the nomothetic assumption of the orthogonality of thedimensions Insensitivity, Extraversion, Neuroticism, and Orderliness, although infact only valid as an aggregate-type proposition and not as a general-type proposition(Bakan, 1969), has no consequences with respect to the degree of coverage by thesedimensions. However, the multiple correlation between medR and the 4DPT scoresfor S, E, and G, being 0.38 (p5 0.001), was found to be somewhat more deviatingfrom zero, indicating on the basis of the separate correlations for these three scales(that were all signi®cant at the 0.05 level, but very low) that the individual coverage issomewhat higher for subjects scoring low on Insensitivity and Extraversion, and highon Orderliness.
The above-mentioned conclusion that most idiographic traits can be simply locatedin the nomothetic framework of the 4DPT dimensions might be challenged by theobservation that in 61 of the 83 cases the number of idiographic descriptions wasfound to be equal to the maximum number (ten) allowed in the INI, for thisobservation seems to indicate that the mean number of 9.15 descriptors now obtainedin the study is actually much lower than the mean number of traits that could bearrived at if the participants were left completely free to ®ll in as many terms orsentences as they deemed necessary. Arguing, therefore, that ten idiographic traits arefar from being most idiographic traits, this observation would even suggest that otherresults might have been found in this study, although not necessarily implying a lower(or higher) degree of coverage of idiographic traits. However, according to Allport(1955), the number of dispositions that are necessary to describe the essentialcharacteristics of an individualÐexactly the type of disposition that is asked for inthe INIÐnormally varies between ®ve and ten, with an average number of seven. Itseems clear, therefore, that most of the idiographic traits generated by the presentprocedure refer to these essential characteristics, and that the relatively high numberof idiographic terms or sentences ®lled in in this instrument is simply due to the factthat the INI format (in this case, the available space for noting responses) seems veryinviting to write down such a large number.
One other problem perhaps challenging our conclusion that idiographic traits canbe expressed in most cases as linear combinations of the idiographically convertednomothetic factors S, E, N, and G, relates to the above-mentioned distributionalasymmetry with respect to the values of self-ratings as opposed to the values of other-ratings in the idio-part of the INI, for it seems clear that this asymmetry, at least inprinciple, must have some impact on the magnitude of the within-person correlationsand multiple correlations. Moreover, in rating, for instance, 20 subjects (including`self' and 19 others) instead of ten, the e�ect of this asymmetry on the magnitude of
Common personality dimensions 237
Copyright # 2000 John Wiley & Sons, Ltd. Eur. J. Pers. 14: 217±243 (2000)

the correlations would seem to lessen, which might even suggest that the proper valuesof the within-person correlations and multiple correlations can only be obtained afterexcluding self-ratings. Although the respective correlations reported in the Resultssection considered all rated subjects (self and up-to-nine others), actually the sameanalyses were also conducted after discarding the self-ratings in the vectors of ratingand factor scores. Fortunately, a comparison of both investigations showed theirresults to be only very slightly a�ected (although always in the direction of a greaterdegree of coverage in the latter case). For instance, instead of a mean R of 0.80 with astandard deviation of 0.15, the `without self' mean R proved to be 0.82 with an SD of0.14. Likewise, the mean medR, originally found to be 0.82 (SD � 0.08), was nowfound to be 0.85 with an SD of 0.07. Finally, instead of ®nding only 11.1 per cent ofall R values lower than R � 0.60 originally, the corresponding ®gure now proved tobe 8.4 per cent.
The fact that most idiographic traits are found to be strongly related to thenomothetic dimensions Insensitivity, Extraversion, Neuroticism, and Orderliness(if used in combination and converted into pseudo-individual factors), seems to besubstantially corroborated by the results of a study by Schiller, Tellegen and Evens(1995). In their study, 12 individuals were invited to generate the terms or sentencesthey use in describing 100 acquaintances, to sort these terms or sentences into groupsof highly similar trait descriptors, and to use the two or three trait descriptors thatthey believed to be most representative for each separate group to rate eachacquaintance on each of these summary terms or phrases. This was followed by theextraction and varimax rotation of the principal components with eigenvaluesgreater than or equal to 1 from each matrix of within-person correlations betweenthe summary descriptors, after which the 92 (out of the 112) rotated factors that werefound to have at least three loadings exceeding 0.35 were rated by 23 judges for theirdegree of similarity with nine sets of selected adjectives representing the nomotheticdimensions of the Big FiveÐincluding three di�erent sets of adjectives for the ®fthBig Five factor, alternately interpreted as Intellect (e.g., Goldberg, 1992), Opennessto Experience (McCrae and Costa, 1985a), or Conventionality (Tellegen and Waller,1987)Ðand the dimensions Positive Evaluation and Negative Evaluation introducedby Tellegen and Waller (1987). Using the average ratings (which were found to behighly reliable) to evaluate the strength of the relationship of each of these ninedimensions with each subject's set of intra-individual factors, it could bedemonstrated that the Big Five dimensions Extraversion, Agreeableness, Conscien-tiousness, and Neuroticism emerged with at least `some resemblance' to one or moreintra-individual factors in at least 50 per cent of the individual data sets. The othernomothetic dimensions were apparently not as salient. As the four Big Five dimen-sions mentioned are more or less congruent with the 4DPT dimensions Extraversion,Insensitivity (reversed), Orderliness, and Neuroticism, respectively (Van Kampen,1996), these results evidently con®rm the results found in the present investigation.However, unlike the procedure that we have followed, the idiographic descriptors inthe study by Schiller et al. (1995) were not related to the nomothetic factors by the12 participants themselves, but by a group of raters. That such a content ratingstudy might result in the incorrect alignment of idiographic factors (or separatedescriptors) with nomothetic dimensions can be seen in Table 5, in which some ofthe idiographic terms or sentences mentioned by some participants in our study, suchas `obstinate', `keeping social contacts', `uncertain', and `living regularly' seem to be
238 D. van Kampen
Copyright # 2000 John Wiley & Sons, Ltd. Eur. J. Pers. 14: 217±243 (2000)

clearly related to the 4DPT dimensions S, E, N, and G, respectively, but neverthelesshave been found to correlate less than 0.30 with the idiographically convertedequivalents of these dimensions. The strength of our own investigation, therefore,seems to be that the placement of the idiographic descriptors into our four-dimensional nomothetic framework is always dependent on the judgement of thesubjects themselves by ®lling in the Idio-Nomo Inventory, which guarantees that the`translation' of the idiographic traits into nomothetic factors is based on idiographicprinciples.
The ascertainment that the nomothetic dimensions Insensitivity, Extraversion,Neuroticism, and Orderliness determine a useful framework for the coverage ofidiographic descriptors naturally evokes the question of whether this frameworkmust be extended with one or more other factors in order to result in an even higherdegree of coverage, both with respect to the relative frequency in which theseidiographic traits are covered and with respect to the number of subjects for whomthis coverage holds. Of course, the (lexical) Big Five or the (nonlexical) Five FactorModel (FFM) (see for this distinction John and Robins, 1993) suggests a ®fthdimension, variously interpreted as, for instance, Intellect, Imagination, Autonomy,Creativity, or Openness to Experience (see, e.g., Costa and McCrae, 1985; Goldberg,1992; Hendriks, 1997; Johnson, 1994; Saucier, 1992). Moreover, some other factorsbeyond the Big Five have also been claimed to exist, although in this case thesefactors largely seem to lie outside the domain of personality traits as conventionallyde®ned (Saucier and Goldberg, 1998). At the same time, however, the above-mentioned study by Schiller et al. (1995) suggests that the addition of a pseudo-individual factor, modelled after one of the interpretations of the ®fth Big Five orFFM dimension cannot be expected to be of much importance, because in this studyit was found that the sets of adjectives selected to represent the nomotheticdimensions Conventionality, Intellect, and Openness to Experience emerged in,respectively, three, ®ve, or two of the 12 data sets, if the intraindividual factors wererated on average to bear at least `some resemblance' to a comparison set. Our ownTable 5 is also illustrative in this respect, for if in our study many descriptors hadbeen found with a content exclusively related to `factor 5', the measurement of onlythe pseudo-individual factors PF1, PF2, PF3, and PF4 would have resulted in thelisting in this table of those descriptors. However, Table 5 mentions only 28 of the759 adjective terms or phrases that were found to correlate less than 0.30 with thesepseudo-individual factors, and of these 28 descriptors only threeÐ`profound',`creative in searching for solutions', and `inquiring'Ðseem to be related as regardscontent with the ®fth Big Five dimension. Thus we may conclude that theidiographic traits in our study do not primarily refer to, among others, Intellect orOpenness to Experience. However, if many (S, E, N, and G related) descriptors ®lledin in the INI were also to be at least marginally related to `factor 5', the addition of a®fth pseudo-individual factor that represents this nomothetic dimension wouldcertainly enhance the level of the multiple correlations found between the idiographictraits and the pseudo-individual factors, if compared to the level now obtained. Toshed at least some light upon this issue, the rater-based VZM or `Free Self-Description Method' quotations (SPOLAP, 1987b) were consulted for thedimensions Education (EDU) and Creativity (CRE)Ðboth assumed by us to re¯ect`factor 5'Ðfor the idiographic trait descriptors generated in a Dutch and Flemishsample of more than 3000 subjects (SPOLAP, 1987a) using a method similar to the
Common personality dimensions 239
Copyright # 2000 John Wiley & Sons, Ltd. Eur. J. Pers. 14: 217±243 (2000)

free-response description approach introduced by Pervin (1976) and Turner andGilliland (1979). After coding the idiographic terms or phrases in our own study withthe quotation values available in the VZM listÐthis proved to be possible for 566 ofthe 759 descriptorsÐwe ®rst of all calculated scores for EDU and CRE for eachparticipant by summing up the quotation values obtained for each idiographic traitand multiplying these sums by 10/q, in which q is the number of descriptions forwhich a quotation has been found in the VZM list. The scores for EDU and CREwere found to correlate 0.56 (p5 0.001), indeed demonstrating that the dimensionsEducation and Creativity are (modestly) related. However, signi®cant but lowercorrelations were also found between EDU and N (ÿ0.34) and between CRE and N(ÿ0.24), CRE and E (0.42), and CRE and EXT (0.34), indicating that the variablesselected here to represent `factor 5' are not completely independent from the(nomothetic) 4DPT or INI structure. Of the 566 adjective terms and sentences forwhich quotation values were available, 42 (�7.4 per cent) were found to be at least`slightly related' (�quotations between ÿ20 and ÿ10 and between 10 and 20) toEducation, and 37 (�6.5 per cent) to Creativity. Because these ®gures are relativelysmall, it seems safe to conclude that the representation in the INI of a pseudo-individual factor re¯ecting, for instance, Intellect or Openness to Experience wouldhardly lead to the demonstration of higher multiple correlations with idiographictraits. The necessity, therefore, of an extension of the present 4DPT with a ®fthinvariant scale for the measurement of such a Big Five or Five Factor Modeldimension does not seem to hold, at least if the inventory is used to measure thepersonality variations most often associated with the idiographic self-descriptionsfound in a normal population. However, from a clinical perspective, the addition of a®fth invariant scale, speci®cally measuring Openness to Experience (or some otherdimension conceptually related to this construct), might be investigated, for there areseveral indications (see, e.g., Rawlings and Freeman, 1997; Lynn and Rhue, 1988;Allen and Coyne, 1995) that high positions on such a dimension are related toschizotypy and vulnerability to psychotic experience. We might conclude, therefore,that although (a dimension linked up with) Openness to Experience does not seem tobe an important factor for most normal subjects, the same dimension might beregarded as a factor of clinical relevance.
ACKNOWLEDGEMENTS
We would like to thank the general practitioners T. Annema (Kampen) andC. H. Bernsen and K. P. Boonstra (Almelo) for their willingness to co-operate in thisstudy. Thanks are also due to Miss Fraukje Koster for her help in collecting the data.
REFERENCES
Allen JG, Coyne L. 1995. Dissociation and vulnerability to psychotic experience. Journal ofNervous and Mental Disease 183: 615±622.
Allport GW. 1937. Personality: A Psychological Interpretation. Holt: New York.Allport GW. 1955. Becoming: Basic Considerations for a Psychology of Personality. YaleUniversity Press: New Haven.
240 D. van Kampen
Copyright # 2000 John Wiley & Sons, Ltd. Eur. J. Pers. 14: 217±243 (2000)

Allport GW. 1961. Pattern and Growth in Personality. Rinehart and Winston: New York.Allport GW. 1962. The general and the unique in psychological science. Journal of Personality30: 405±422.
Allport GW. 1965. Letters from Jenny. Harcourt, Brace and World: New York.Bakan D. 1969. On Method: Toward a Reconstruction of Psychological Investigation. Jossey-Bass: San Francisco.
Baldwin AL. 1942. Personal structure analysis: a statistical method for investigation of thesingle personality. Journal of Abnormal and Social Psychology 37: 163±183.
Bem DJ, Allen A. 1974. On predicting some of the people some of the time: the search forcross-situational consistencies in behavior. Psychological Review 81: 506±520.
Block J. 1995. A contrarian view of the ®ve-factor approach to personality description.Psychological Bulletin 117: 187±215.
Bonarius JC. 1969. De eksperimentele benadering van de individuele klieÈ nt [`The experimentalapproach to the individual client']. Nederlands Tijdschrift voor de Psychologie 24: 569±579.
Cattell RB (Ed.). 1966. Handbook of Multivariate Experimental Psychology. Rand McNally:Chicago.
Costa PT Jr, McCrae RR. 1985. The NEO Personality Inventory Manual. PsychologicalAssessment Resources: Odessa, FL.
Costa PT Jr, McCrae RR. 1992. Four ways ®ve factors are basic. Personality and IndividualDi�erences 13: 653±665.
Dawes RM, Faust D, Meehl PE. 1993. Statistical prediction versus clinical prediction:improving what works. In A Handbook for Data Analysis in the Behavioral Sciences:Methodological Issues, Keren G, Lewis C (eds). Erlbaum: Hillsdale, NJ; 351±367.
De Groot AD. 1966. Methodologie: Grondslagen van Onderzoek en Denken in de Gedrags-wetenschappen. [Methodology: Foundations of Research and Theory in the BehaviouralSciences]. Mouton: Den Haag.
Eysenck HJ. 1947. Dimensions of Personality. Routledge & Kegan Paul: London.Eysenck HJ. 1967. The Biological Basis of Personality. Thomas: Spring®eld.Eysenck HJ. 1992. Four ways ®ve factors are not basic. Personality and Individual Di�erences13: 667±673.
Eysenck HJ. 1994a. The Big Five or Giant Three: criteria for a paradigm. In The DevelopingStructure of Temperament and Personality from Infancy to Adulthood, Halverson CF,Kohnstamm GA, Martin RP (eds). Erlbaum: Hillsdale, NJ; 37±51.
Eysenck HJ. 1994b. The importance of theory in the taxonomy of personality. In PersonalityPsychology in Europe, Vol. 5, De Raad B, Hofstee WKB, Van Heck GL (eds). TilburgUniversity Press: Tilburg; 6±13.
Eysenck HJ, Eysenck SBG. 1969. Personality Structure and Measurement. Routledge & KeganPaul: London.
Gibbons H, Rammsayer TH. 1999. Di�erential e�ects of personality traits related to theP-ImpUSS dimension on latent inhibition in healthy female subjects. Personality andIndividual Di�erences 27: 1157±1166.
Goldberg LR. 1992. The development of markers for the Big-Five factor structure. Psycho-logical Assessment 4: 26±42.
Goldberg LR. 1993. The structure of phenotypic personality traits. American Psychologist 48:26±34.
Goldberg LR, Rosolack TK. 1994. The Big Five factor structure as an integrative framework:an empirical comparison with Eysenck's P±E±N model. In The Developing Structure ofTemperament and Personality from Infancy to Adulthood, Halverson CF, Kohnstamm GA,Martin RP (eds). Erlbaum: Hillsdale, NJ; 7±35.
Hendriks AAJ. 1997. The construction of the Five-Factor Personality Inventory (FFPI).Dissertation, Rijksuniversiteit Groningen, Netherlands.
Holt RR. 1962. Individuality and generalization in the psychology of personality. Journal ofPersonality 30: 377±404.
John OP, Robins RW. 1993. Gordon Allport: father and critic of the Five-Factor model. InFifty Years of Personality Psychology, Craik KH, Hogan R, Wolfe RN (eds). Plenum: NewYork; 215±236.
Common personality dimensions 241
Copyright # 2000 John Wiley & Sons, Ltd. Eur. J. Pers. 14: 217±243 (2000)

Johnson JA. 1994. Clari®cation of factor ®ve with the help of the AB5C model. EuropeanJournal of Personality 8: 311±334.
Kelly GA. 1955. The Psychology of Personal Constructs. Norton: New York.Kleinmuntz B. 1990. Why we still use our heads instead of the formulas: toward an integrativeapproach. Psychological Bulletin 107: 296±310.
Kluckhohn CM, Murray HA. 1953. Personality formation: the determinants. In Personality inNature, Society, and Culture, Kluckhohn CM, Murray HA, Schneider DM (eds). Knopf:New York; 53±67.
Lamiell JT. 1981. Toward an idiothetic psychology of personality. American Psychologist 36:276±289.
Lamiell JT. 1990. Explanation in the psychology of personality. In Annals of TheoreticalPsychology, Vol. 6, Robinson DN, Mos LP (eds). Plenum: New York; 153±192.
Levy LH. 1970. Conceptions of Personality: Theories and Research. Random: New York.Loevinger J. 1994. Has psychology lost its conscience? Journal of Personality Assessment 62:2±8.
Lynn SJ, Rhue JW. 1988. Fantasy proneness: hypnosis, developmental antecedents andpsychopathology. American Psychologist 43: 35±44.
McCrae RR, Costa PT Jr. 1985a. Updating Norman's ``adequate taxonomy'': intelligence andpersonality dimensions in natural language and in questionnaires. Journal of Personality andSocial Psychology 49: 710±721.
McCrae RR, Costa PT Jr. 1985b. Comparison of EPI and Psychoticism scales with measuresof the Five-Factor model of personality. Personality and Individual Di�erences 6: 587±597.
Moosbrugger H, Fischbach A. 1999. `Evaluation of the dimensionality of the EysenckPersonality Pro®lerÐGerman version: a contribution to the ``Super Three'' vs. ``Big Five''discussion'. Arbeiten aus dem Institut fuÈr Psychologie, No. 7, Goethe University, Frankfurtam Main.
Ortet G, Iba nÄ ez MI, Moro M, Silva F, Boyle GJ. 1999. Psychometric appraisal of Eysenck'srevised Psychoticism scale: a cross-cultural study. Personality and Individual Di�erences 27:1209±1219.
Pelham BW. 1993. The idiographic nature of human personality: examples of the idiographicself-concept. Journal of Personality and Social Psychology 64: 665±677.
Pervin LA. 1976. A free-response description approach to the analysis of person±situationinteraction. Journal of Personality and Social Psychology 34: 465±474.
Rawlings D, Freeman JL. 1997. Measuring paranoia/suspiciousness. In Schizotypy: Implica-tions for Illness and Health, Claridge G (ed.). Oxford University Press: Oxford; 38±60.
Rosenzweig S. 1951. Idiodynamics in personality theory with special reference to projectivemethods. Psychological Review 58: 213±223.
Runyan WM. 1983. Idiographic goals and methods in the study of lives. Journal of Personality51: 413±437.
Saucier G. 1992. Openness versus Intellect: much ado about nothing? European Journal ofPersonality 6: 381±386.
Saucier G, Goldberg LR. 1996. The language of personality: lexical perspectives on theFive-Factor model. In The Five-Factor Model of Personality: Theoretical Perspectives,Wiggins JS (ed.). Guilford: New York; 21±50.
Saucier G, Goldberg LR. 1998. What is beyond the Big Five? Journal of Personality 66:495±524.
Schiller R, Tellegen A, Evens J. 1995. An idiographic and nomothetic study of personalitydescription. In Advances in Personality Assessment, Vol. 10, Butcher JN, Spielberger CD(eds). Erlbaum: Hillsdale, NJ; 1±23.
Sectie voor Psychologisch Onderzoek van het Belgisch Leger, Brussel, en Laboratorium voorPersoonlijkheidsonderzoek, Leuven (SPOLAP). 1987a. Handleiding Vrije Zelfbeschrijvings-methode VZM. [Manual of the Free Self-Description Method VZM]. Swets and Zeitlinger:Lisse, Netherlands.
Sectie voor Psychologisch Onderzoek van het Belgisch Leger, Brussel, en Laboratorium voorPersoonlijkheidsonderzoek, Leuven (SPOLAP). 1987b. Quotatielijst voor UitdrukkingenVrije Zelfbeschrijvingsmethode VZM. [Quotation List for Expressions Free Self-DescriptionMethod VZM]. Swets and Zeitlinger: Lisse, Netherlands.
242 D. van Kampen
Copyright # 2000 John Wiley & Sons, Ltd. Eur. J. Pers. 14: 217±243 (2000)
Tellegen A, Waller NG. 1987. Re-examining basic dimensions of natural language traitdescriptors. Paper presented at the 95th Annual Convention of the American PsychologicalAssociation, New York, August.
Tucker LR. 1951. A method for synthesis of factor analysis studies. Personnel ResearchSection Report No. 984, Department of the Army, Washington, DC.
Turner RG, Gilliland L. 1979. The comparative relevance and predictive validity of subjectgenerated trait descriptions. Journal of Personality 47: 230±244.
Van Kampen D. 1981. Theorie van klinische assessment [Theory of clinical asssessment]. InInleiding in de Klinische Psychologie [Introduction to Clinical Psychology], Cassee AP,HoÈ weler M, Janssen RHC (eds). Van Loghum Slaterus: Deventer, Netherlands; 69±111.
Van Kampen D. 1993. The 3DPT dimensions S, E, and N: a critical evaluation of Eysenck'sPsychoticism model. European Journal of Personality 7: 65±105.
Van Kampen D. 1996. The theory behind Psychoticism: a reply to Eysenck. European Journalof Personality 10: 57±60.
Van Kampen D. 1997. Orderliness as a major dimension of personality: from 3DPT to 4DPT.European Journal of Personality 11: 211±242.
Common personality dimensions 243
Copyright # 2000 John Wiley & Sons, Ltd. Eur. J. Pers. 14: 217±243 (2000)