IDFC Infrastructure Index Top 10 & Bottom 10 - Combined Index Top 10 States Rank Base Year - 2006...
40
1 1 Townhall Presentation
-
Upload
truongxuyen -
Category
Documents
-
view
215 -
download
0
Transcript of IDFC Infrastructure Index Top 10 & Bottom 10 - Combined Index Top 10 States Rank Base Year - 2006...

11
Townhall Presentation

IDFC Infrastructure Index
2

Indices
• National infrastructure index which includes power, telecom, roads, ports and airport
• State infrastructure index which includes power, telecom and roads
• Sectoral indices (power, telecom, roads, ports and airports)
Time period: 2006-10

Methodology
• A. Normalize variables
Step 1: Obtain the maximum value (across states) for each of the variables in the base year
Max (Cs,t=2006)
Step 2: Normalize the value of each of the variables (across states and years) by dividing the actual values by the corresponding maximum value from step 1
Vs,t = Cs,t/Max(Cs,t=2006)
• B. Combine variables and normalize
Step 3: Combine the normalized value of all the variables through appropriate weights to get the sub-index or overall index
Is,t = ∑wiVi,s,t

Sectoral Representation in National Index
• State sectors
Power
Telecom
Roads
• National
Ports
Airports

6
National Index
100
200
300
400
500
600
2006 2007 2008 2009 2010
Power
Telecom
Road
Port
Airport
Combined

7
State-wise Combined Index
Variables
• Power Index (1/3rd
weight)
• Telecom Index (1/3rd
weight)
• Road Index (1/3rd
weight)

8
State-wise Combined Index Values
100 10096 95
9185
77
70 69 68 67 66 66 66 64 63 62 62 62 61 60 59 59 57 56 55 55
43
2006

State-wise Combined Index Values
9
190
165 163 162157 157
134129 128 128 124
116 114 114 111 109 109 108 107 107 106102 101 101 98 97 97
93
2010
Combined infrastructure index for states has grown between 57% (Goa) to
126% (Arunachal Pradesh). Average for country is 78% growth between
2006-10

Regional trends
10
10091
77 70
165 162
128 124
Kerala Tamil Nadu Karnataka Andhra Pradesh
South
2006 2010
63 62 64 59 60 57 6243
111 109 109 108 107 101 101 98
North East – Closing the Gap within the region
2006 2010
61 66 6255
128116
10293
Rajasthan Uttar Pradesh Bihar Madhya Pradesh
BIMARU - Galloping Rajasthan
2006 2010
6655 59
10697 97
Uttarakhand Chattisgarh Jharkhand
New states have lagged their parents except Chattisgarh
2006 2010

Key insights – Combined Index
• Dispersion among states has increased
• Himachal has moved from 3rd place to 1st (largely due to telecom)
• Among the “developed” states, during 2006-10,
Karnataka & Andhra Pradesh have moved three places down (due to Telecom) Maharashtra & Gujarat have moved two places up (largely driven by Power & Telecom)
• Among “less developed” states, during 2006-10
Rajasthan has moved from 20th to 9th place Bihar has moved down (Largely due to Telecom) All North Eastern states have moved up on the Combined Index with the exception of Assam. They have been propelled by the Telecom Index.

12
Top Movers on Combined Index
These states have move >1 place up or down
State Rank Change State Rank Change
Rajasthan 11 Uttarakhand -8
Jammu & Kashmir 5 Assam -6
Meghalaya 5 Goa -5
Nagaland 3 Jharkhand -5
Arunachal Pradesh 3 Bihar -5
Himachal Pradesh 2 Karnataka -3
Gujarat 2 Andhra Pradesh -3
Maharashtra 2 West Bengal -2
Manipur 2 Sikkim -2

13
Fastest & Slowest Growers - Combined Index
Fastest Growers Slowest Growers
State CAGR State CAGR
Arunachal Pradesh 23% Goa 12%
Rajasthan 20% Assam 13%
Himachal Pradesh 19% Uttarakhand 13%
Gujarat 18% Bihar 13%
Maharashtra 17% Jharkhand 13%

14
Top 10 & Bottom 10 - Combined Index
Top 10 States
Rank Base Year - 2006 Last Year - 2010
1 Goa Himachal Pradesh
2 Kerala Kerala
3 Himachal Pradesh Punjab
4 Punjab Tamil Nadu
5 Tamil Nadu Haryana
6 Haryana Goa
7 Karnataka Gujarat
8 Andhra Pradesh Maharashtra
9 Gujarat Rajasthan
10 Maharashtra Karnataka
Bottom 10 States
Rank Base Year - 2006 Last Year - 2010
28 Arunachal Pradesh Madhya Pradesh
27 Madhya Pradesh Jharkhand
26 Chattisgarh Chattisgarh
25 Jammu & Kashmir Arunachal Pradesh
24 Mizoram Assam
23 Meghalaya Mizoram
22 Jharkhand Bihar
21 Manipur Uttarakhand
20 Rajasthan Jammu & Kashmir
19 Nagaland Manipur

15
Power Index
Variables
• Per Capita Input Energy Index (1/3rd
weight)
• Villages Electrified % (1/6th
weight)
• BPL Households Electrified % (1/6th
weight)
• Peak Deficit (1/6th
weight)
• Energy Deficit (1/6th
weight)

State-wise Power Index Values
16
100
84
78 77 7572 71 70 69
65 63 63 62 62 60 59 59 58 58 57 57 56 55 55 5451 49 47
2006

State-wise Power Index Values
17
100
87 85 8481 80 78 76 74 73 73 72 72 72 71 68 66 65 62 61 61 58 58 57 56 54 53 52
2010

Regional Trends – Power
18
5660
49 51
6662 61
57
Rajasthan Madhya Pradesh Uttar Pradesh Bihar
BIMARU - lighting up
2006 2010
-40
-20
0
20
40
60
80
100
120
140
Rajasthan Madhya Pradesh Uttar Pradesh Bihar
Rural is driving the growth for BIMARU except in M.P.
Deficits Input energy per capita
% villages electrified % rural BPL households electrified

19
Top Movers on Power Index
These states have move >1 place up or down
Improvement Decline
State Rank Change State Rank Change
Andhra Pradesh 8 Mizoram -11
Chattisgarh 7 Sikkim -7
Uttar Pradesh 7 Jammu & Kashmir -5
Gujarat 5 Kerala -5
Rajasthan 5 Nagaland -4
Arunachal Pradesh 4 Madhya Pradesh -4
Haryana 2 Tripura -3
West Bengal 2 Uttarakhand -3
Bihar 2 Manipur -2
Jharkhand 2

20
Fastest & Slowest Growers - Power Index
Fastest Growers Slowest Growers
State CAGR State CAGR
Andhra Pradesh 6.6% Mizoram -2.9%
Uttar Pradesh 5.9% Manipur -0.5%
Chattisgarh 5.8% Nagaland -0.5%
Gujarat 5.5% Tripura 0.0%
Arunachal Pradesh 4.7% Goa 0.1%
21
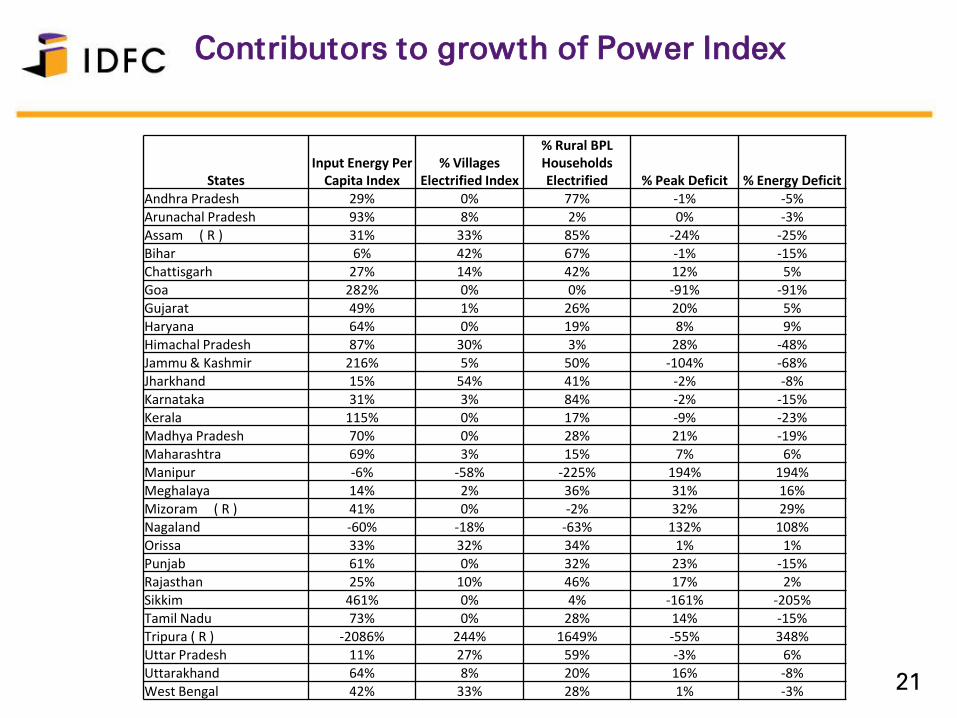
Contributors to growth of Power Index
StatesInput Energy Per
Capita Index% Villages
Electrified Index
% Rural BPL Households Electrified % Peak Deficit % Energy Deficit
Andhra Pradesh 29% 0% 77% -1% -5%Arunachal Pradesh 93% 8% 2% 0% -3%Assam ( R ) 31% 33% 85% -24% -25%Bihar 6% 42% 67% -1% -15%Chattisgarh 27% 14% 42% 12% 5%Goa 282% 0% 0% -91% -91%Gujarat 49% 1% 26% 20% 5%Haryana 64% 0% 19% 8% 9%Himachal Pradesh 87% 30% 3% 28% -48%Jammu & Kashmir 216% 5% 50% -104% -68%Jharkhand 15% 54% 41% -2% -8%Karnataka 31% 3% 84% -2% -15%Kerala 115% 0% 17% -9% -23%Madhya Pradesh 70% 0% 28% 21% -19%Maharashtra 69% 3% 15% 7% 6%Manipur -6% -58% -225% 194% 194%Meghalaya 14% 2% 36% 31% 16%Mizoram ( R ) 41% 0% -2% 32% 29%Nagaland -60% -18% -63% 132% 108%Orissa 33% 32% 34% 1% 1%Punjab 61% 0% 32% 23% -15%Rajasthan 25% 10% 46% 17% 2%Sikkim 461% 0% 4% -161% -205%Tamil Nadu 73% 0% 28% 14% -15%Tripura ( R ) -2086% 244% 1649% -55% 348%Uttar Pradesh 11% 27% 59% -3% 6%Uttarakhand 64% 8% 20% 16% -8%West Bengal 42% 33% 28% 1% -3%
22
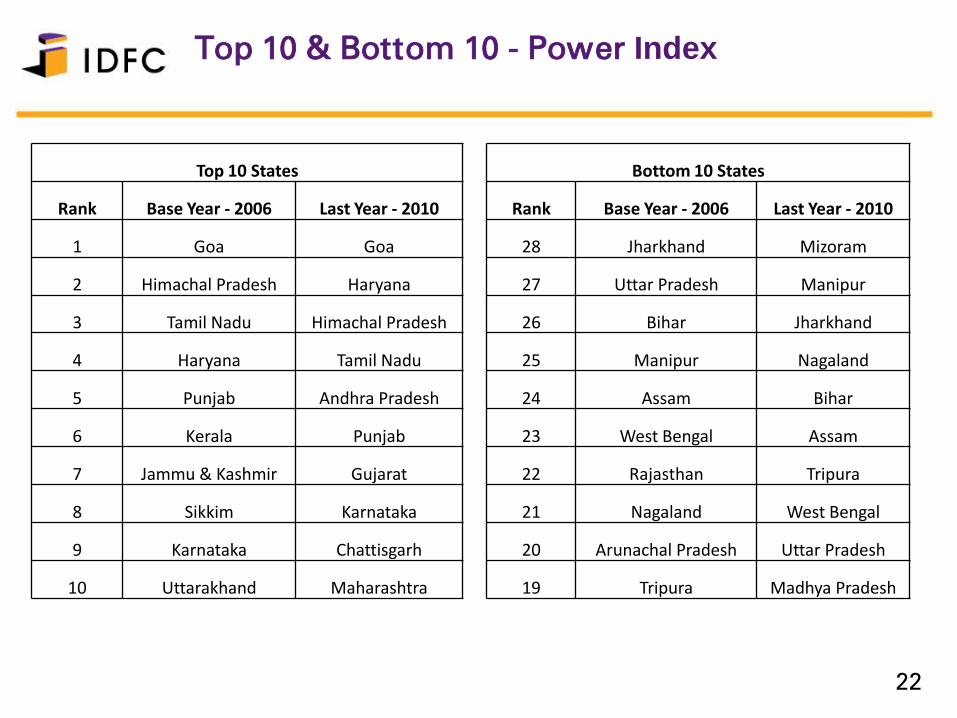
Top 10 & Bottom 10 - Power Index
Top 10 States
Rank Base Year - 2006 Last Year - 2010
1 Goa Goa
2 Himachal Pradesh Haryana
3 Tamil Nadu Himachal Pradesh
4 Haryana Tamil Nadu
5 Punjab Andhra Pradesh
6 Kerala Punjab
7 Jammu & Kashmir Gujarat
8 Sikkim Karnataka
9 Karnataka Chattisgarh
10 Uttarakhand Maharashtra
Bottom 10 States
Rank Base Year - 2006 Last Year - 2010
28 Jharkhand Mizoram
27 Uttar Pradesh Manipur
26 Bihar Jharkhand
25 Manipur Nagaland
24 Assam Bihar
23 West Bengal Assam
22 Rajasthan Tripura
21 Nagaland West Bengal
20 Arunachal Pradesh Uttar Pradesh
19 Tripura Madhya Pradesh

23
Key Observations – Power Index
• Goa ranks first in the base as well as last year though the index value has
remained unchanged
• 6 of the top ten states still remain in the top ten (J&K, Kerala, Sikkim and
Uttarakhand being replaced by Andhra, Gujarat, Maharashtra and Chattisgarh)
• Performance of BIMARU States has improved. Except Madhya Pradesh, all
have gained ranks.
•In terms of CAGR ranks, BIMARU states figure in the top half of the table with
Uttar Pradesh being the best performer and Madhya Pradesh being the only state
to figure in the bottom half of this table
• Performance of North-Eastern states has been disappointing. Exceptions are
Arunachal Pradesh and Meghalaya (to some extent). All figure in the bottom half
of the rank table in 2010
• Performance of Southern States has been mixed. Andhra Pradesh gained 8
ranks, Kerala lost 5 ranks. Karnataka and Tamil Nadu have gained and dropped 1
rank respectively. Andhra Pradesh tops the CAGR rank table in the Power Index
whereas the other three figure in the middle

24
Telecom Index
Variables
• Urban Teledensity (1/3rd
weight)
• Rural Teledensity (1/3rd
weight)
• VPTs/No. of Villages (1/3rd
weight)

Telecom index - 2006
25
100 100
77
61 60 58 56 5653
49 48 47 47 46 46 4539
32
2006

Telecom Index - 2010
26
331
262
236
216 214199 196 192
172 169 168155 151 148
136 133 130122
2010
Index has grown between 4.7 times (North East) and 2.63 times (Kerala).
Average for India is 3.33 times.

Contribution to growth in telecom index
27
-20%
0%
20%
40%
60%
80%
100%
120%
Telecom growth is now rural driven
% of villages with VPTs Urban Teledensity Rural Teledensity
Rural teledensity in India is 24 (ranges from while the urban teledensity is 120.
Urban teledensity ranges from 91 in M.P. to 298 in H.P. The rural teledensity
range is between 15 (Bihar) to 52 in H.P.

28
Top Movers on Telecom Index
These states have move >1 place up or down
Improvement Decline
State Rank Change State Rank Change
Rajasthan 6 Assam -4
J & K 5 Karnataka -3
North East 4 Andhra Pradesh -3
Bihar -3
West Bengal -2
Orissa -2

29
Fastest Growers - Telecom Index
0%
5%
10%
15%
20%
25%
30%
35%
40%
45%
50%
North East Rajasthan J & K Maharashtra Haryana
The Fast Five

Key insights – Telecom Index
• The North Eastern group of states has been an outperformer on this index recording thehighest CAGR of 47% and improving by 4 positions from 18 to 14
• The growth in the BIMARU States has been largely driven by the Rural Teledensity Sub-index which has contributed anywhere between 62% (in case of Bihar) to 74% (in case ofRajasthan)
Rajasthan has gained 6 places, the most among all circles and is 7th in 2010. It wasalso the second fastest CAGR grower among all circles at 43% Uttar Pradesh has gained 1 place whereas Madhya Pradesh and Bihar have bothdropped by 1 and 3 places respectively and are at the 18th and 17th position respectivelyin 2010. All of these states grew between 30-33% CAGR Dispersion from Himachal Pradesh (top state in the base year) has widened in case ofall states
• Southern states have given mixed performance Kerala and Tamil Nadu have maintained their places at 2 and 4 respectivelywhereas, Andhra Pradesh and Karnataka have lost 3 places each and appear at place 11and 9 respectively The Index is driven by the Rural Teledensity which has contributed anywhere between70% (for Karnataka) to 85% (for Tamil Nadu) Dispersion from Himachal Pradesh (top state in the base year) has widened in case ofall states. Kerala in the base year had an index value equivalent to Himachal Pradesh buthas it lower by one-fifth that of Himachal Pradesh in the last year
•With the exception of Tamil Nadu (which occupies the 6th position in CAGR ranks growing at37%), all Southern States figure in the bottom half of the CAGR rank table

31
Road Index
Variables
• Lane Length of National Highways per unit of Geographical
Area (1/3rd
weight)
• Length of Rural Roads per unit of Geographical Area
(1/3rd
weight)
• Habitations Coverage in % (1/3rd
weight)

32
Road Index Values
100
9087
8178
7369 68 67 66 65
61 59 58 58 56 56 56 55 55 55 54 52
4340 39
2521
2006

33
108103
96 95 95
83
75 74 72 71 71 7065 65 64 64 62 60 60 60 60 59
56
49 49 48
3128
2010
Road Index Values

34
Contribution to Growth of Road Index
-20%
0%
20%
40%
60%
80%
100%
120%
Rural roads are driving the growth in rural states
% of habitations connected Rural roads by population NH-LaneKm by population
Note: In above figure, rural states refer to those with 75% or more
rural population

35
Top Movers on Road Index
These states have move >1 place up or down
Improvement Decline
State Rank Change State Rank Change
Rajasthan 5 Meghalaya -7
Gujarat 4 Jharkhand -5
Assam 3 Kerala -2
Uttar Pradesh 2 Nagaland -2
West Bengal 2 Manipur -2
Himachal Pradesh 2

36
Fastest & Slowest Growers - Road Index
Fastest Growers Slowest Growers
State CAGR State CAGR
Arunachal Pradesh 10% Kerala 1%
Uttar Pradesh 7% Meghalaya 1%
Madhya Pradesh 6% Goa 1%
Haryana 5% Mizoram 1%
Chattisgarh 5% Nagaland 1%

37
Top 10 & Bottom 10 - Road Index
Top 10 States
Rank Base Year - 2006 Last Year - 2010
1 Goa Tamil Nadu
2 Tamil Nadu Goa
3 Punjab Punjab
4 Kerala Uttar Pradesh
5 Haryana Haryana
6 Uttar Pradesh Kerala
7 Tripura Tripura
8 Nagaland Karnataka
9 Karnataka West Bengal
10 Manipur Nagaland
Bottom 10 States
Rank Base Year - 2006 Last Year - 2010
28 Arunachal Pradesh Jammu & Kashmir
27 Jammu & Kashmir Arunachal Pradesh
26 Madhya Pradesh Chattisgarh
25 Chattisgarh Sikkim
24 Sikkim Madhya Pradesh
23 Rajasthan Mizoram
22 Mizoram Jharkhand
21 Gujarat Meghalaya
20 Maharashtra Maharashtra
19 Assam Uttarakhand

38
Key insights – Road Index
• Barring Arunachal Pradesh and Assam, the North Eastern States have not done so well. Both Arunachal Pradesh and Assam have gained in ranks and are the 1st and 9thfastest growers in CAGR. All other states in this basket appear in the last 8 in terms ofCAGR ranks Arunachal Pradesh and Meghalaya’s growth has been driven by the NationalHighways sub-index whereas, in all the other states, the rural sub-indices have drivengrowth Dispersion from Goa (top state in the base year) has widened in the case ofMeghalaya and Mizoram, remained constant in the case of Nagaland and narrowed in allother cases
• The performance of BIMARU States has been good with each of the states having moved upin ranks. Rajasthan moved up the most i.e. 5 places and Bihar the least by 1 place
All four states figure in the top eight states in ranking the CAGR growth, with UttarPradesh being the best performer within the pack The contribution to growth in Uttar Pradesh and Bihar has come equally from theNational Highways Index as well as the Rural Indices, whereas in the case of MadhyaPradesh and Rajasthan, the rural indices have been the bigger contributors (60% forRajasthan and 70% for Madhya Pradesh)
• The performance of Southern States has been mixed with Tamil Nadu topping the road indexin 2010 gaining 1 rank over the period. Karnataka too gained 1 rank but on the otherhand, Andhra Pradesh has dropped 1 rank and Kerala has dropped 2
Kerala is at the bottom in CAGR rank and Tamil Nadu (the best performer in this packis at 6th position) With the exception of Kerala, all other states derive majority (close to 70%) of theirgrowth from the contribution of National HighwaysDispersion from Goa (top state in the base year) has narrowed in all states exceptKerala where it has increased by 1 point. Tamil Nadu has been an exception.

39
Port Index
100
120
140
160
180
2006 2007 2008 2009 2010
Major Ports
Non-Major Ports
Total Ports
Non-Major Ports have clearly dominated the growth of the sector

40
Airport Index
100
110
120
130
140
150
2006 2007 2008 2009 2010
Airport Index