IDFC Factsheet Complete - IDFC Mutual Funds · On the positive front if FII's bring in esh money...
36
February 2010
-
Upload
nguyendien -
Category
Documents
-
view
215 -
download
0
Transcript of IDFC Factsheet Complete - IDFC Mutual Funds · On the positive front if FII's bring in esh money...

February 2010

3.00%
4.00%
5.00%
6.00%
7.00%
8.00%
9.00%
1 5 10 30
Yield Curve31st January 2009
31st December 2009
1
Equity Commentary
Risk appetite is waning and markets have taken a breather in January. We saw a 6% correction in the large cap indices – Sensex and Nifty – while the broader indices – BSE200 and BSE500 – were down 5%. Midcaps outperformed. This correction is on the back of global markets which have also corrected in January. Three factors have been responsible for this - a) China increasing reserve requirement and attempting to curb rampant bank lending, signalling the beginning of the withdrawal of a loose monetary policy, b) rising fears of sovereign debt defaults going forward especially in some of the Euro Zone countries and c) lesser faith in the strength of the economic recovery in the developed markets as recovery is still dependent on continued stimulus.
Q3FY10 corporate results season has been mixed. While earnings reported have been broadly in line with expectation, the results have not been decisive as they have not led to any upgrade in earnings growth forecasts. Sales growth for Sensex companies was around 26% (skewed mainly by Reliance) and net profit growth was 18%. As expected top line has shown resurgence after flat growth in earlier two quarters. This was partly due to base effect and partly due to the ongoing economic recovery showing up. IT services was the only major sector which beat expectations handsomely. Auto, IT services, FMCG, Pharma have been the leaders in this results season. Cement, Capital goods, Telecom have been laggards, while Oil&Gas and Banks have been just in line.
RBI chose to raise CRR by 75 bps and left rates untouched, signalling its desire not to tamper with the ongoing economic recovery at this stage.
With the market at one year forward P/E ratio of around 15,5X, which is the same as last 15 year average level, there is no longer much scope for any immediate upside in valuations. Continued economic recovery and a resultant upgrade in corporate earnings forecast can be the only driver for now. Actual delivery of growth will be key and flows will continue to be diverted towards fundamentally sound companies which are able to keep faith of the investors in term of sustained operational performance. We maintain that there will be increasing dispersion and diversion in performances between sectors and between companies within a sector.
Meanwhile, the upcoming Annual Budget will be important to watch from a fiscal consolidation point of view.
Debt Commentary
Liquidity, Union Budget for fiscal 2010-11 and current state of government finances will weigh on the fixed income markets in February 2010. The market will have to factor in tighter liquidity conditions, a potential large borrowing program for fiscal 2010-11 and higher than scheduled government bond supply for the current fiscal. If the negatives do play out bond yields are likely to trend higher across the curve.
The CRR (Cash Reserve Ratio) hike of 75bps by the RBI in their monetary policy review in January 2010 will impact liquidity in February. The 75bps CRR hike will suck out Rs 36,000 crores of liquidity from the system. The system has already seen a dip in liquidity with banks parking an average of Rs 75,000 crores with the RBI on a daily against an average of Rs 100,000 crores seen a couple of months back. The fall in rate of growth in bank deposits from 19% levels to 17.5% levels is also seen as a negative for liquidity. Equity disinvestments of Rs 15,000 to Rs 20,000 crores from the government if subscribed to by domestic investors could further strain liquidity. On the positive front if FII's bring in fresh money for the IPO's and banks increase deposit growth rate liquidity will increase in the system.
The Union Budget for fiscal 2010-11 is likely to see the government unveiling a gross borrowing program of similar or slightly less in proportion to fiscal 2009-10 borrowing of Rs 450,000 crores. Market sentiments could weaken on account of front loading of the borrowing program. The budget may turn positive for markets if the government shows a lower than expected borrowing program.
The current state of government finances is uncertain with expected revenues in the form of taxes and 3G disinvestment not meeting budget estimates to the extent of over Rs 60,000 crores. The government is trying to make up the shortfall through disinvestments of around Rs 25,000 crores and increased efforts in tax collections but if revenues fail to meet targets the government may have to borrow more to meet the shortfall.
The RBI has raised inflation forecast for end March 2010. Inflation as measured by the WPI (Wholesale Price Index) is expected to come in at 8.5% against earlier estimates of 6.5%. RBI has raised GDP growth estimates to 7.5% from earlier estimates of 6%. The rise in inflation and growth estimates suggest that RBI will embark on raising reverse repo and repo rates.
Liquidity was comfortable in January with banks parking around Rs 75,000 crores on a daily basis with the RBI at 3.25% which is the reverse repo rate. Liquidity is likely to tighten this month as CRR hike takes effect. .
Market Indicators
Security 31st January 31st December Month on
2010 2009 Month
Change Basis
Points (bps).
Yield % Yield %
Policy Rates
Reverse Repo Rate 3.25 3.25 0
Repo Rate 4.75 4.75 0
Cash Reserve Ratio (CRR) 5.75 5.00 75
Liquidty
Average Reverse Repo Rs Crores 77347 73000 0
Average Repo Rs crores 52 52 0
Average Call Rate % 3.26 3.27 -1
Governemnt Securities
91 Day T-Bill 4.00 3.75 25
364 Day T-Bill 4.70 4.70 0
Five Year Benchmark 7.17 7.27 -10
Ten Year Benchmark 7.59 7.67 -8
Currency
USD/INR Rs 46.18 46.52 1%
Inflation (% Change Month Month
Year on Year) Ended Ended
31st Dec 2009 30th Nov 2009
WPI 7.31 4.78
Corporate Bonds
5 Year AAA Benchmark 8.35 8.00 35
3 Month CD Benchmark 4.50 3.50 100
1 Year CD Benchmark 6.00 5.25 75
Interest Rate Swaps
1 Year OIS* 5.02 5.07 -5
5 Year OIS* 6.90 6.90 0
Source : CCIL, Bloomberg
-600.0
-400.0
-200.0
0.0
200.0
400.0
600.0
800.0
1000.0
1200.0
4-J
an-1
0
5-J
an-1
0
6-J
an-1
0
7-J
an-1
0
8-J
an-1
0
11-J
an-1
0
12-J
an-1
0
13-J
an-1
0
14-J
an-1
0
15-J
an-1
0
18-J
an-1
0
19-J
an-1
0
20-J
an-1
0
21-J
an-1
0
22-J
an-1
0
25-J
an-1
0
27-J
an-1
0
28-J
an-1
0
29-J
an-1
0
15500
16000
16500
17000
17500
18000
Net Equity Investments by FII & MFs (US $ Million for the month)
FII MF SensexSource -SEBI

2
IDFC Classic Equity Fund(IDFC - CEF)An open-ended equity fund Data as of 29 January 2010
Portfolio as of 29 January 2010
Asset Allocation
Marketvalue in % of
Name Lac (Rs.) NAV
Bajaj Auto Ltd. 762.43 2.70Mahindra & Mahindra Ltd. 508.78 1.80
Amara Raja Batteries Ltd. 322.92 1.14
ICICI Bank Ltd. 1617.52 5.74Axis Bank Ltd. 1292.38 4.58Bank Of Baroda 1040.98 3.69Canara Bank 805.62 2.86Federal Bank Ltd. 703.94 2.50Ing Vysya Bank Ltd. 344.62 1.22
Ultratech Cement Ltd. 544.05 1.93Madras Cements Ltd. 390.37 1.38Grasim Industries Ltd. 389.88 1.38
United Spirits Ltd. 851.13 3.02Balrampur Chini Mills Ltd. 709.77 2.52ITC Ltd 638.88 2.27Asian Paints Ltd. 611.23 2.17
Housing Development Finance Cor Ltd 538.75 1.91
Bharat Heavy Electricals Ltd. 1162.96 4.12Crompton Greaves Ltd. 969.88 3.44
DB Corp Ltd. 669.49 2.37
Sterlite Industries Ltd. 685.32 2.43
Oil & Natural Gas Corporation Ltd. 383.74 1.36
United Phosphorus Ltd. 418.03 1.48
Reliance Industries Ltd. 1512.81 5.36Hindustan Petroleum Corporation Ltd. 939.65 3.33Bharat Petroleum Corporation Ltd. 555.27 1.97
Dishman Pharmaceuticals & Chemicals Ltd. 579.61 2.06Biocon Ltd. 564.59 2.00Piramal Healthcare Ltd. 523.43 1.86
NTPC Ltd. 792.91 2.81GVK Power & Infrastructure Ltd 387.00 1.37Tata Power Co. Ltd. 383.64 1.36
Pantaloon Retail (India) Ltd. 788.27 2.79
Infosys Technologies Ltd. 997.63 3.54Satyam Computers Ltd. 906.98 3.22Educomp Solutions Ltd. 523.05 1.85Tata Consultancy Services Ltd. 449.08 1.59
Cox And Kings India Ltd. 574.03 2.04
Grand Total 28203.16 100.00
Auto Total 1271.21 4.51
Auto Ancillaries Total 322.92 1.14
Banks Total 5805.06 20.58
Cement Total 1324.30 4.70
Consumer Non Durables Total 2811.01 9.97
Finance Total 538.75 1.91
Industrial Capital Goods Total 2132.84 7.56
Media & Entertainment Total 669.49 2.37
Non-Ferrous Metals Total 685.32 2.43
Oil Total 383.74 1.36
Pesticides Total 418.03 1.48
Petroleum Products Total 3007.73 10.66
Pharmaceuticals Total 1667.63 5.91
Power Total 1563.55 5.54
Retailing Total 788.27 2.79
Software Total 2876.74 10.20
Transportation Total 574.03 2.04Others Total 273.75 0.97Call / Reverse Repo/ CBLO Total 660.03 2.34Net Current Asset 428.79 1.52
Fund features
Fund performance
Nature : EquityAverage AUM : Rs. 295.62 CroreFund Manager : Tridib PathakInvestment objective : The investment objective of the scheme is to seek to generate long term capital growth from a diversified portfolio of predominantly equity and equity related instruments.However there is no assurance that the investment objective of the scheme will be realized.Investment style : The Scheme seeks to achieve out performance through sector rotation, theme selection, market cap bias and bottom up stock picking.Ideal investment horizon : 3 years or moreEntry load : (Plan A & Plan B) : Nil (w.e.f. August 01, 2009)Exit load: (Plan A & Plan B): All Investment including SIP/Micro SIP/STP/FOF if redeemed / switched out within 365 days from the date of allotment - 1%. No Exit Loads / CDSC will be chargeable in case of switches made between different options of the Scheme. (w.e.f. September 01, 2009)In case of Switches, Exit load shall be NIL for all switch transactions between equity schemes of IDFC Mutual Fund . (w.e.f. October 12, 2009.)Options available: Growth, Dividend. Reinvestment facility is available under the Dividend Option.Minimum investment amount ( Plan A & Plan B): Rs. 5,000 & in multiples of Re. 1 Additional investment amount : Re.1SIP (minimum amount) ( Plan A & Plan B): Rs. 1000 Inception Date (Plan A) : 9 August 2005Inception Date (Plan B) : 2 April 2009Statistical Measures : Beta 0.86R Square 0.95Standard deviation 8.76%Last 3 dividends (Rs./ unit) :22 August 2006 1.50 NAV 11.558028 May 2007 1.50 NAV 13.265922 Oct 2007 1.50 NAV 15.2703NAV (Rs.):Growth (A) 18.9884 (B) 15.0969Dividend (A) 13.7399 (B) 12.1836Face value (Rs. / unit) : 10Asset allocation (equity / debt / cash) : 96.14% /2.34% / 1.52%Fund manager’s commentRun as a well-diversified portfolio, the opportunity for the fund is to capture the breadth of the market across sectors, market capitalizations, styles and themes. The fund has maintained around 35% exposure to midcaps, and has maintained higher diversification across sectors.
Past performance may or may not be sustained in future.Benchmark : BSE 200
Data as of 29 January 2010under the IDFC-CEF-Growth as of 01029 January 2
IDFC-CEF - Growth BSE200
CAGR - Compounded Annualised Growth Rate
3 Month
(Absolute)6 Month
(Absolute)Last 1 Year
CAGR
Last 2 YearsCAGR
Last 3 YearsCAGR
Since InceptionCAGR
20.58%
10.66%10.20%
9.97%
7.56%5.91%
5.54%4.70%4.51%
2.79%2.43%2.37%1.91%1.48%1.36%1.14%0.97%2.04%
Banks
Petr
ole
um
Pro
duct
s
Softw
are
Co
nsu
mer
Non
Dura
ble
s
Ind
ust
rial C
apita
lG
oods
Ph
arm
ace
utic
als
Pow
er
Cem
ent
Auto
Reta
iling
No
n -
Ferr
ous
Meta
ls
Media
&E
nte
rtain
ment
Tra
nsp
ort
atio
n
Fin
ance
Pest
icid
es
Oil
Au
to A
nci
llaries
Gas
4.55%9.06%
64.87%
-6.46%
5.33%
15.40%
5.21% 8.15%
86.87%
-3.78%
6.89%
17.92%

3
IDFC Imperial Equity Fund(IDFC - IEF)An open-ended equity fund Data as of 29 January 2010
Marketvalue in % of
Name Lac (Rs.) NAV
Bajaj Auto Ltd. 1401.66 3.17Mahindra & Mahindra Ltd. 1119.31 2.53
Axis Bank Ltd. 2748.88 6.22Bank Of Baroda 1909.69 4.32ICICI Bank Ltd. 1904.28 4.31Canara Bank 1600.64 3.62HDFC Bank Ltd. 668.73 1.51
ACC Ltd 1141.93 2.58Ambuja Cements Ltd. 1029.88 2.33
ITC Ltd 2056.23 4.65United Spirits Ltd. 1358.45 3.07Nestle India Ltd. 1203.18 2.72
Housing Development Finance Cor Ltd 1346.88 3.05
GAIL (India) Ltd. 1018.62 2.30
Bharat Heavy Electricals Ltd. 2453.30 5.55
Sterlite Industries Ltd. 1852.63 4.19
Oil & Natural Gas Corporation Ltd. 1754.24 3.97
Reliance Industries Ltd. 2973.72 6.73Indian Oil Corporation Ltd. 1919.00 4.34
Cipla Ltd. 1506.70 3.41Biocon Ltd. 846.88 1.92Glaxosmithkline Pharmaceuticals Ltd. 599.51 1.36
Tata Power Co. Ltd. 1252.21 2.83NTPC Ltd. 1178.65 2.67
Infosys Technologies Ltd. 1708.10 3.86Tata Consultancy Services Ltd. 1170.56 2.65Wipro Ltd. 1059.40 2.40HCL Technologies Ltd. 884.34 2.00Oracle Financial Serv Software Ltd 458.17 1.04
Grand Total 44205.22 100.00
Auto Total 2520.96 5.70
Banks Total 8832.22 19.98
Cement Total 2171.81 4.91
Consumer Non Durables Total 4617.85 10.45
Finance Total 1346.88 3.05
Gas Total 1018.62 2.30
Industrial Capital Goods Total 2453.30 5.55
Non - Ferrous Metals Total 1852.63 4.19
Oil Total 1754.24 3.97
Petroleum Products Total 4892.72 11.07
Pharmaceuticals Total 2953.09 6.68
Power Total 2430.86 5.50
Software Total 5280.57 11.95Call / Reverse Repo/ CBLO Total 2429.80 5.50Net Current Asset -350.32 -0.79
Fund features
Fund performance
Nature : EquityAverage AUM : Rs. 451.23 CroreFund Manager : Kenneth Andrade Investment objective : The investment objective of the Scheme is to seek to generate capital appreciation and/or provide income distribution from a portfolio of predominantly equity and equity related instruments. There is no assurance or gurantee that the objectives of the scheme will be realized. Investment style : The Scheme seeks to invest predominantly in companies based on the potential value unlocking (subsidiary listing), strong growth in domestic demand and emerging sectors in the Indian economy. Ideal investment horizon : 3 years or moreEntry load : (Plan A & Plan B) : Nil (w.e.f. August 01, 2009)Exit load: (Plan A & Plan B) : All Investment including SIP/Micro SIP/STP/FOF if redeemed / switched out within 365 days from the date of allotment - 1%. No Exit Loads / CDSC will be chargeable in case of switches made between different options of the Scheme. (w.e.f. September 01, 2009). In case of Switches, Exit load shall be NIL for all switch transactions between equity schemes of IDFC Mutual Fund . (w.e.f. October 12, 2009.)Options available: Growth, Dividend. Reinvestment facility is available under the Dividend Option.Minimum investment amount (Plan A & Plan B): Rs. 5,000 Additional investment amount : Re.1SIP (minimum amount) (Plan A & Plan B): Rs. 1,000 Inception Date (Plan A) : 16 March 2006Inception Date (Plan B) : 2 April 2009Statistical measures : Beta 0.89R Square 0.94Standard deviation 8.76%Last dividends (Rs./ unit) :8 June 2009 1.20 NAV 12.4523 Plan A15 June 2009 1.20 NAV 12.0942 Plan B14 May 2008 1.50 NAV 13.9431NAV (Rs.):Growth (A) 17.1337 (B) 14.7650Dividend (A) 14.1629 (B) 13.6282Face value (Rs. / unit) : 10Asset allocation (equity / debt / cash / Derivative Option) : 95.30% / 5.50% / -0.79% / NilFund manager’s commentImperial fund is a diversified large cap biased fund. The portfolio construction has revolved around selecting well established companies which have high capital efficiency or are moving towards improving their capital efficiency further and are available at reasonable valuations.
Past performance may or may not be sustained in future.Benchmark : S&P CNX Nifty
under the IDFC-IEF-Growth as of 01029 January 2
Portfolio as of 01029 January 2
Asset AllocationData as of 29 January 2010
IDFC-IEF - Growth S&P CNX Nifty
CAGR - Compounded Annualised Growth Rate
Rating & Rankings
Value Research RatingICRA Rating
3 Month (Absolute)
6 Month (Absolute)
Since Inception CAGR
Last 3 Years CAGR
Last 1 Year CAGR
Morningstar Rating
Past performance is no guarantee of future results.For Methodology of Ranking Please refer Page No. 32.
19.98%
11.95%11.07%
10.45%
6.68%5.70%5.55%5.50%4.91%
4.19%3.97%3.05%
2.30%
Banks
Softw
are
Petr
ole
um
Pro
duct
s
Consu
mer
Non
Dura
ble
s
Pharm
ace
utic
als
Auto
Indust
rial C
apita
lG
oods
Pow
er
Cem
ent
Non -
Ferr
ous
Meta
lsOil
Fin
ance
Gas
4.23% 5.86%
63.09%
5.12%
11.96%14.90%
3.62% 5.30%
70.07%
-2.52%
6.15%11.27%

IDFC Premier Equity Fund(IDFC - PEF)An open-ended equity fund Data as of 29 January 2010
4
Asset Allocation
Marketvalue in % of
Name Lac (Rs.) NAV
Motherson Sumi Systems Ltd. 4761.01 3.88
Shree Cement Ltd. 5464.32 4.45
Bajaj Electricals Ltd. 3826.62 3.12
Asian Paints Ltd. 4978.82 4.05Shree Renuka Sugars Ltd 4881.37 3.98GlaxoSmithkline Consumer Healthcare Ltd. 4571.08 3.72Karuturi Global Ltd. 3234.46 2.63Kaveri Seed Company Ltd. 2991.81 2.44Bata India Ltd. 2571.93 2.09Lakshmi Energy And Foods Ltd 2380.35 1.94United Spirits Ltd. 2217.97 1.81Emami Ltd. 2153.23 1.75Raj Oil Mills Ltd. 1771.42 1.44Globus Spirits Ltd 1603.85 1.31Ruchi Soya Industries Ltd. 1528.61 1.24KS Oil Ltd. 1432.48 1.17
Coromandel International Ltd. 5577.47 4.54
Shriram Transport Finance Co Ltd. 7346.93 5.98SREI Infrastructure Finance Ltd. 2067.00 1.68
Petronet LNG Ltd 3344.75 2.72Deep Industries Ltd. 1767.23 1.44
Pipavav Shipyard Ltd. 2685.00 2.19
Biocon Ltd. 3305.24 2.69
PTC India Ltd. 3294.00 2.68Torrent Power Ltd. 2633.68 2.14
Pantaloon Retail (India) Ltd. 5329.08 4.34
Page Industries Ltd. 4187.46 3.41
IRB Infrastructure Developers Ltd 6201.25 5.05Spicejet Ltd. 4376.39 3.56Blue Dart Express Ltd. 2526.39 2.06Cox and Kings India Ltd. 1994.45 1.62
Grand Total 122794.72 100.00
Auto Ancillaries Total 4761.01 3.88
Cement Total 5464.32 4.45
Consumer Durables Total 3826.62 3.12
Consumer Non Durables Total 36317.37 29.58
Fertilisers Total 5577.47 4.54
Finance Total 9413.93 7.67
Gas Total 5111.98 4.16
Miscellaneous Total 2685.00 2.19
Pharmaceuticals Total 3305.24 2.69
Power Total 5927.68 4.83
Retailing Total 5329.08 4.34
Textile Products Total 4187.46 3.41
Transportation Total 15098.48 12.30Others Total 3412.10 2.78Derivative Total 464.33 0.38Money Market Instrument Total 5005.37 4.08Call / Reverse Repo/ CBLO Total 5290.27 4.31Net Current Asset 1617.00 1.32
Future Total 929.33 0.76
Fund features
Fund performance
Nature : EquityAverage AUM : Rs. 1,249.71 CroreFund Manager : Kenneth AndradeInvestment objective : The Scheme shall seek to generate long-term capital growth from an actively managed portfolio of predominantly equity and equity related instruments. However there is no assurance that the investment objective of the scheme will be realized.Investment style : Focus on buying great companies at low valuation with a longer term perspective. The scheme portfolio would seek to acquire, inter alia, small and medium size business with good long term potential, which are available at cheap valuation. Such securities would be identified through disciplined fundamental research keeping in view medium to long term trends in the business environment. The Scheme shall endeavor to accumulate long term investor wealth by opening subscriptions to units during periods when stocks are available at reasonable valuations. By doing so, the Fund managers would endeavor to prevent short term money from flowing into the fund which can prove detrimental to the interest of long term investors.Ideal investment horizon : 3 years or moreEntry load : (Plan A & Plan B) :Nil (w.e.f. August 01, 2009)Exit load: (Plan A & Plan B): All Investment including SIP/Micro SIP/STP/FOF if redeemed / switched out within 365 days from the date of allotment - 1%. No Exit Loads / CDSC will be chargeable in case of switches made between different options of the Scheme. (w.e.f. September 01, 2009)In case of Switches, Exit load shall be NIL for all switch transactions between equity schemes of IDFC Mutual Fund . (w.e.f. October 12, 2009.)Options available: Growth, Dividend. Reinvestment facility is available under the Dividend Option.Minimum investment amount (Plan A & Plan B): Rs. 25,000Additional investment amount : Re.1SIP (minimum amount) (Plan A & Plan B): Rs. 2000Inception Date (Plan A) : 28 September 2005Inception Date (Plan B) : 2 April 2009Statistical measures : Beta 0.90R Square 0.87Standard deviation 9.77%Last dividends (Rs./ unit) : 28 April 2009 1.50 NAV 13.1031NAV (Rs.):Growth (A) 26.3901 (B) 19.4607Dividend (A) 23.6823 (B) 19.5930Face value (Rs. / unit) : 10Asset allocation (equity / debt / cash / derivative option) : 89.92% / 8.38% / 1.32% / 0.38%Fund manager’s comment :The portfolio has attempted to identify emerging themes & segment leaders which have a strong correlation to the growth of the economy. The fund is invested close to 90% with the balance in cash. The investment process & the diversification have not undergone any radical shift. The focus remains on buying into emerging business & taking a call on the entrepreneur /organization to ride through successfully the growth curve of the business cycle.
Past performance may or may not be sustained in future.Benchmark : BSE 500
Data as of 29 January 2010
under the IDFC-PEF-Growth as of 01029 January 2
Portfolio as of 01029 January 2
IDFC-PEF - Growth BSE500
CAGR - Compounded Annualised Growth Rate
3 Month
(Absolute)
6 Month
(Absolute)
Last 1 Year CAGR
Last 2 Years
CAGR
Last 3 Years
CAGR
Since Inception
CAGR
Rating & Rankings
Value Research RatingICRA Rating
Past performance is no guarantee of future results.For Methodology of Ranking Please refer Page No. 32.
Morningstar Rating
29.58%
12.30%
7.67%
4.83%4.54%4.45%4.34%4.16%3.88%3.41%3.12%3.12%0.93%0.91%
2.69%
Consu
mer
No
n D
ura
ble
s
Tra
nsp
ort
atio
n
Fin
ance
Pow
er
Fert
ilise
rs
Cem
ent
Reta
iling
Gas
Au
to A
nci
llaries
Text
ile P
roduct
s
Mis
cella
neous
Consu
mer
Dura
ble
s
Ph
arm
ace
utic
als
Tele
com
E
quip
ment
& A
ccess
ories
Media
&
En
tert
ain
ment
13.88%
22.93%
114.16%
5.43%
24.35% 25.06%
5.98% 9.59%
90.31%
-4.65%
6.38%15.19%

MarketValue in % of Value of
Name Lac (Rs.) NAV Futures
Jindal Saw Ltd. 2307.50 4.70 -2320.50Cairn India Limited 2035.93 4.15 -2045.12Welspun Guj Stahl Rohren Ltd 1482.32 3.02 -1485.14Unitech Ltd. 1467.80 2.99 -1473.72Reliance Industries Ltd. 1365.29 2.78 -1367.64Century Textiles & Industries Ltd. 1273.38 2.60 -1280.83Balrampur Chini Mills Ltd. 1273.26 2.60 -1275.37GTL Ltd 1176.80 2.40 -1179.83United Spirits Ltd. 1163.94 2.37 -1167.85India Cements Ltd. 1096.84 2.24 -1095.37IVRCL Infrastructures & Projects Ltd. 1037.79 2.12 -1041.50Suzlon Energy Ltd. 957.13 1.95 -958.37Jaiprakash Associates Ltd. 902.51 1.84 -906.12Housing Development & Infrastr Ltd 890.48 1.82 -891.96DLF Limited 755.38 1.54 -756.52Lanco Infratech Limited 708.35 1.44 -711.39IFCI Limited 692.57 1.41 -695.92Reliance Natural Resources Ltd 691.57 1.41 -694.26Lupin Ltd. 662.24 1.35 -664.50Orchid Chemicals & Pharmaceuticals Ltd. 638.35 1.30 -641.36Ispat Industries Ltd 626.28 1.28 -629.47Firstsource Solutions Limited 613.52 1.25 -616.46India Infoline Ltd. 609.50 1.24 -611.82Indiabulls Real Estate Limited 578.35 1.18 -581.81ICSA India Ltd 569.76 1.16 -572.24Bombay Rayon Fashions Ltd. 550.04 1.12 -552.87Hindustan Petroleum Corporation Ltd. 533.59 1.09 -533.75Praj Industries Limited 517.37 1.05 -518.86Larsen & Toubro Ltd. 515.43 1.05 -516.56Moser Baer India Limited 484.39 0.99 -486.86Dena Bank 468.21 0.95 -470.02Tata Teleservices (Mah) Limited 417.73 0.85 -419.38Mercator Lines Limited 381.61 0.78 -384.18Oracle Financial Serv Software Ltd 350.11 0.71 -350.87Vijaya Bank 346.73 0.71 -347.76NTPC Ltd. 316.90 0.65 -312.83Essar Oil Ltd 314.07 0.64 -314.75Cipla Ltd. 309.27 0.63 -310.10Reliance Mediaworks Ltd. 289.52 0.59 -290.37Reliance Communications Ltd 223.46 0.46 -223.33Triveni Engeering And Industries Ltd. 215.97 0.44 -216.50Noida Toll Bridge Co. ltd. 178.76 0.36 -180.46Punj Lloyd Ltd. 171.47 0.35 -171.93Aditya Birla Nuvo LTD. 166.04 0.34 -166.66Television Eighteen India Ltd. 139.89 0.29 -140.25GMR Infrastructure Limited 125.90 0.26 -126.42Mangalore Refinery & Petrochemicals Ltd. 100.59 0.21 -100.79Hindustan Construction Co. Ltd. 84.45 0.17 -84.83Bharat Petroleum Corporation Ltd. 77.34 0.16 -77.41Nagarjuna Fertilizers & Chemicals Ltd. 72.97 0.15 -73.19Hotel Leela Venture Ltd. 72.00 0.15 -72.38Bajaj Hindustan Ltd. 54.83 0.11 -54.96Kingfisher Airlines Ltd 48.60 0.10 -48.78Oriental Bank of Commerce 38.28 0.08 -38.32Rolta India Ltd. 7.37 0.02 -7.39Mphasis Limited 5.43 0.01 -5.41
Grand Total 49059.15 100.00
Total 33155.16 67.58 -33263.20Call / Reverse Repo/ CBLO Total 10698.39 21.81Bank Deposit Total 8500.00 17.33Net Current Asset -3294.40 -6.72
IDFC Arbitrage Fund(IDFC - AF)An open-ended equity fund
Fund features Portfolio as of 029 January 201
Data as of 29 January 2010
5
Fund performance
Past performance may or may not be sustained in future.Benchmark : Crisil Liquid Fund Index
under the IDFC-AF-Growth as of 029 January 201
Nature : Equity & Equity DerivativesAverage AUM : Rs. 508.43 CroreFund Manager : Ashwin Patni & Arjun ParthasarathyInvestment objective : The investment objective of the Scheme is to generate capital appreciation and income by predominantly investing in arbitrage opportunity in the cash and the derivative segments of the equity markets and the arbitrage opportunity available within the derivative segments and by investing the balance in debt and money market instruments. However there is no assurance that the investment objective of the scheme will be realized. Investment style : The Scheme seeks to capture the “Cost of Carry” by executing simultaneous buy (in the cash market) and sell (In the futures) trades. The amount not so invested is invested in FDs and money market instruments.Ideal investment horizon : 1 year or moreEntry load : Nil Exit load: 0.25% in both Plan A and Plan B, if redemption / switch is requested within 30 days from the date of purchase, during ongoing period. (w.e.f. August 24, 2009)In case of Switches, Exit load shall be NIL for all switch transactions between equity schemes of IDFC Mutual Fund . (w.e.f. October 12, 2009.)Plans available: Plan A (Regular), Plan B (Institutional)Options available: Growth, Dividend & Dividend Sweep (w.e.f. 16-Nov-2009)Minimum investment amount : Plan A: Rs. 5,000, Plan B: Rs. 25,00,000 (w.e.f. July 6, 2009)Additional investment amount : Re.1SIP (minimum amount) : NAInception Date: 21 December 2006Statistical Measures : Standard deviation 0.33%Dividend frequency: Monthly, subject to availability of distributable surplusLast 8 dividends (Rs./ unit) :16-Apr-09 A 0.0600 NAV 10.313716-Apr-09 B 0.0600 NAV 10.446019-May-09 A 0.0600 NAV 10.256319-May-09 B 0.0600 NAV 10.393415-June-09 A 0.0500 NAV 10.248115-June-09 B 0.0500 NAV 10.389613-July-09 A 0.0400 NAV 10.262613-July-09 B 0.0400 NAV 10.408926-Aug-09 B 0.0200 NAV 10.419012-Nov-09 A 0.0600 NAV 10.321412-Nov-09 B 0.0600 NAV 10.466814-Dec-09 A 0.0200 NAV 10.322614-Dec-09 B 0.0200 NAV 10.472912-Jan-10 A 0.0200 NAV 10.328512-Jan-10 B 0.0200 NAV 10.4834NAV (Rs.):Plan A (Regular) Growth 12.1801Plan A (Regular) Dividend 10.3373Plan B (Institutional) Growth 12.3713Plan B (Institutional) Dividend 10.4947Face value (Rs. / unit) : 10Asset allocation (equity / debt / cash) : 67.58% /39.13% / -6.72%Fund manager’s comment:Cash-future spreads were affected as equity markets saw some selling pressure close to the expiry. The fund was able to successfully roll-over its futures positions into February.
IDFC-AF-Growth Crisil Liquid Fund Index
CAGR - Compounded Annualised Growth Rate
3 Month (Absolute)
6 Month (Absolute)
Last 1 Year CAGR
Last 2 Years CAGR
Since Inception CAGR
0.55%
1.64%
3.41%
4.97%
6.30%6.55%
0.70%1.39%
4.29%
6.51%6.82% 6.83%
Last 3 Years CAGR

6
IDFC Enterprise Equity Fund(IDFC - EEF)An Open Ended Equity Scheme. Data as of 29 January 2010
Asset Allocation
Marketvalue in % of
Name Lac (Rs.) NAV
Reliance Industries Ltd. 7130.52 10.73Infosys Technologies Ltd. 4569.30 6.87ICICI Bank Ltd. 3563.31 5.36Larsen & Toubro Ltd. 3287.30 4.94ITC Ltd 2482.41 3.73Housing Development Finance Cor Ltd 2313.81 3.48HDFC Bank Ltd. 2168.64 3.26State Bank Of India 2042.82 3.07Bharat Heavy Electricals Ltd. 1465.03 2.20Bharti Airtel Ltd. 1448.76 2.18Tata Consultancy Services Ltd. 1426.11 2.15Oil & Natural Gas Corporation Ltd. 1425.59 2.14Tata Steel Ltd. 1339.73 2.02Sterlite Industries Ltd. 1170.58 1.76Hindustan Unilever Ltd. 977.04 1.47Axis Bank Limited 969.77 1.46Jindal Steel & Power Ltd. 933.16 1.40Tata Power Co. Ltd. 822.22 1.24Mahindra & Mahindra Ltd. 794.09 1.19Wipro Ltd. 744.15 1.12Tata Motors Ltd. 722.19 1.09NTPC Ltd. 715.26 1.08Maruti Suzuki India Ltd. 708.58 1.07Grasim Industries Ltd. 687.23 1.03GAIL (India) Ltd. 682.39 1.03Hindalco Industries Ltd. 617.24 0.93Cipla Ltd. 607.49 0.91Jaiprakash Associates Ltd. 597.83 0.90Reliance Infrastructure Limited 559.11 0.84Infrastructure Development Finance Company Ltd. 549.73 0.83Hero Honda Motors Ltd. 540.51 0.81Steel Authority Of India Ltd. 484.31 0.73DLF Ltd. 466.09 0.70Punjab National Bank 460.95 0.69Reliance Communications Ltd 442.93 0.67Cairn India Limited 440.59 0.66Sun Pharmaceutical Industries Ltd. 426.76 0.64Unitech Ltd. 384.21 0.58Siemens Ltd. 374.55 0.56Idea Cellular Ltd. 355.92 0.54Reliance Capital Ltd. 354.54 0.53ACC Ltd 339.30 0.51Ambuja Cements Ltd. 320.08 0.48ABB Ltd 317.29 0.48HCL Technologies Ltd. 282.57 0.43Bharat Petroleum Corporation Ltd. 269.40 0.41Ranbaxy Laboratories Ltd. 265.60 0.40Power Grid Corporation Ltd. 249.34 0.38Suzlon Energy Ltd. 220.71 0.33Reliance Power Ltd. 205.24 0.31
Grand Total 66480.50 100.00
Nifty Stock Total 54722.29 82.31Derivative Total 89.59 0.13Call / Reverse Repo/ CBLO Total 8160.41 12.27Bank Deposits Total 2000.00 3.01Money Market Instruments Total 1033.88 1.56Net Current Asset 474.33 0.71
Future Total 11967.28 18.00
Fund features
Fund performance
Nature : EquityAverage AUM : Rs. 712.23 CroreFund Manager : Kenneth Andrade.Investment objective : The investment objective of the scheme is to seek to generate capital growth from a portfolio of predominantly equity and equity related instruments(Including Equity derivatives). The scheme may also invest in debt and money market instruments to generate reasonable income. However there is no assurance that the investment objective of the scheme will be realized.Investment Strategy (in brief): The term ‘Enterprise’ connotes activity, venture, project or an endeavour. The Scheme intends to invest in companies which are involved in or are in the process of setting up various business activites, ventures, projects or other commercial endeavours. The Scheme would invest in equities in the IPOs’ subsequent public offers or in the secondary market, other equity related instruments (including derivatives), benefit out of the cash and derivative markets arbitrage, opportunity and invest the residual sums in debt and money market instruments. For details please refer to the Offer document.The scheme will endeavour to generate capital appreciation through investing in equities by interalia adopting the mode of applying IPOs or subsequent public offering made by companies, if well-priced IPOs are not available the funds collected will be invested in other investment avenues such as index, cash futures arbitrage. Nifty spot futures arbitrage etc. as per the investment strategy of the scheme.The Scheme will endeavour to generate capital appreciation through investing in equities and equity related instruments by inter alia adopting the mode of applying for Initial Public Offerings (IPOs) or subsequent public offerings made by companies. The Scheme envisages to generate reasonable returns by investing in such equities. The balance equity allocations by the fund will be closely in line with Nifty. However the fund will seek to take on some deviation from Nifty by making smaller allocations to a range of arbitrage strategies in the equity and derivative markets.Investment style : The Scheme endeavours to generate capital appreciation through investing in equities by inter alia adopting the mode of applying for IPOs or subsequent public offering made by companies. If well priced IPOs are not available the funds collected may be invested in the index, hence generating market return from the index and the alpha from the premium on listing of IPOs.Entry load : (Plan A & Plan B) : Nil (w.e.f. August 01, 2009)Exit load: (Plan A & Plan B) : All Investment including SIP/Micro SIP/STP/FOF if redeemed / switched out within 365 days from the date of allotment - 1%. No Exit Loads / CDSC will be chargeable in case of switches made between different options of the Scheme. (w.e.f. September 01, 2009)In case of Switches, Exit load shall be NIL for all switch transactions between equity schemes of IDFC Mutual Fund . (w.e.f. October 12, 2009.)Options available: Growth, DividendMinimum investment amount (Plan A & Plan B): Rs. 5,000 (w.e.f. July 6, 2009)Additional investment amount : Re.1SIP (minimum amount) (Plan A & Plan B): Rs. 1000 (w.e.f. July 6, 2009)Inception Date (Plan A) : 9 June 2006Inception Date(Plan B) : 6 July 2009Statistical Measures : Beta (BSE 200) 0.84R Square (BSE 200) 0.89Beta (Nifty) 0.90Rsquare (Nifty) 0.92Standard deviation 4.25%Last 3 dividends (Rs./ unit) :28 July 2009 1.00 NAV 10.753014 May 2008 1.50 NAV 13.0106NAV (Rs.):Growth (A) 13.8196 (B) 11.3606Dividend (A) 11.3345 (B) 9.5363Face value (Rs. / unit) : 10Asset allocation (equity / debt / cash / derivative option) : 82.31% / 16.84% /0.71% / 0.13%Fund manager’s comment : The fund is currently invested in the Nifty stocks. The fund aims to generate alpha by participating in primary market issuances. As a strategy, Enterprise follows a 100% invested philosophy. We have activated our participation in primary issuances which is of recent origin.
Past performance may or may not be sustained in future.Benchmark : S&P CNX Nifty
under the IDFC-EEF-Growth as of 01029 January 2 Data as of 29 January 2010
IDFC-EEF - Growth S&P CNX Nifty
CAGR - Compounded Annualised Growth Rate
Portfolio as of 01029 January 2
3 Month (Absolute)
6 Month (Absolute)
Last 1 Year CAGR
Since Inception CAGR
Last 3 Years CAGR
Last 2 Year CAGR
13.85%
11.13%10.56%
4.94%4.84%4.16%4.15%3.84%3.73%3.58%3.38%
2.92%2.69%1.96%
1.47%1.28%1.03%
2.81%
Banks
Petr
ole
um
Pro
duct
s
Softw
are
Co
nst
ruct
ion
Pro
ject
Fin
ance
Auto
Fe
rrous
Meta
ls
Pow
er
Co
nsu
mer
Non
Dura
ble
s
Ind
ust
rial C
apita
lG
oods
Tele
com
Serv
ices
Cem
ent
Oil
No
n -
Ferr
ous
Meta
ls
Ph
arm
ace
utic
als
Div
ers
ified
Co
nst
ruct
ion
Gas
3.14% 3.95%
68.98%
-4.01%
4.91%9.28%
3.62% 5.30%
71.08%
-2.80%
6.15%
15.74%

Asset Allocation
Marketvalue in % of
Name Lac (Rs.) NAV
Mahindra & Mahindra Ltd. 203.51 2.73Hero Honda Motors Ltd. 194.88 2.61
Exide Industries Ltd. 167.40 2.24
ICICI Bank Ltd. 622.76 8.34Union Bank of India 382.35 5.12Axis Bank Limited 359.00 4.81Allahabad Bank 353.38 4.73Indian Bank 224.56 3.01
Unitech Ltd. 222.90 2.99
Emami Limited 250.38 3.35Balrampur Chini Mills Ltd. 210.53 2.82
Hindustan UniLever Ltd. 181.73 2.43
Jindal Steel & Power Ltd. 251.18 3.37Tata Steel Ltd. 227.64 3.05
Bharat Heavy Electricals Ltd. 360.78 4.83Sterlite Technologies Ltd 300.49 4.03
Sun TV Network Limited 193.25 2.59Jagran Prakashan Ltd 180.98 2.42
Sterlite Industries Ltd. 301.24 4.04
Oil & Natural Gas Corporation Ltd. 219.28 2.94
Reliance Industries Ltd. 523.10 7.01
Tata Consultancy Services Ltd. 368.10 4.93Infosys Technologies Ltd. 247.55 3.32HCL Technologies Ltd. 173.40 2.32Zensar Technologies Limited 107.50 1.44
Cox and Kings India Limited 143.47 1.92
Grand Total 7464.27 100.00
Auto Total 398.39 5.34
Auto Ancillaries Total 167.40 2.24
Banks Total 1942.05 26.02
Construction Total 222.90 2.99
Consumer Non Durables Total 460.90 6.17
Diversified Total 181.73 2.43
Ferrous Metals Total 478.82 6.41
Industrial Capital Goods Total 661.27 8.86
Media & Entertainment Total 374.23 5.01
Non - Ferrous Metals Total 301.24 4.04
Oil Total 219.28 2.94
Petroleum Products Total 523.10 7.01
Software Total 896.55 12.01
Transportation Total 143.47 1.92Others Total 0.00 0.00Net Current Asset 492.97 6.60
IDFC Tax Saver (ELSS) Fund(IDFC - TS[ELSS])A 10 year closed ended Equity Linked Saving Scheme
Fund features
Fund performance
Nature : EquityAverage AUM : Rs. 77.53 CroreFund Manager : Kenneth Andrade. w.e.f. 21 July, 2009Investment objective : The investment objective of the Scheme is to seek to generate long term capital growth from a diversified portfolio of predominantly equity and equity related instruments.There can be no assurance that the investment objective of the scheme will be realised.Investment style : The Scheme will invest in well- managed growth companies that are available at reasonable value. Companies would be identified through a systematic process of forecasting earnings based on a deep understanding of the industry growth potential and interaction with company management .
Exit load : Nil (w.e.f. 4th September, 2009)Options available: Growth, DividendMinimum investment amount : Rs. 500Additional investment amount : Re.500Inception Date: 15 March 2007Statistical Measures : Beta 0.81R Square 0.92Standard deviation 9.64%Dividends frequency : NANAV (Rs.):Growth 12.5208Dividend 12.5205Face value (Rs. / unit) : 10Asset allocation (equity / debt / cash) : 93.40% /- / 6.60%Fund manager’s commentThe focus is to invest in long term growth stocks at reasonable price. The portfolio is an diverse mix of companies across sectors and is agnostic to capitalization bias. Given the plethora of opportunities which is there in domestic economy, the fund seeks to invest in companies with strong track record of execution, high operating leverage and reasonable valuations.
Entry load : Nil
Past performance may or may not be sustained in future.Benchmark : BSE 200
under the IDFC-TS(ELSS)-Growth as of 029 January 201 Data as of 29 January 2010
Portfolio as of 029 January 201
IDFC-TS(ELSS) - Growth BSE200
CAGR - Compounded Annualised Growth Rate
3 Month (Absolute) 6 Month (Absolute) Last 1 Year CAGR Since Inception CAGR
Last 2 Year CAGR
Data as of 29 January 2010
7
5.99%
15.02%
73.92%
-5.77%
8.12%5.21% 8.15%
86.87%
-3.78%
11.83%
26.02%
12.01%
8.86%7.01%6.41%
5.34%5.01%4.04%
2.99%2.94%2.43%2.24%1.92%
Banks
Softw
are
Indust
rial
Ca
pita
l Goods
Petr
ole
um
P
roduct
s
Fe
rrous
Meta
ls
Co
nsu
mer
Non
Dura
ble
s
Auto
Media
&
En
tert
ain
ment
No
n -F
err
ous
Meta
ls
Const
ruct
ion
Oil
Div
ers
ified
Au
to A
nci
llaries
Tra
nsp
ort
atio
n
6.17%

MarketValue in % of Value of
Name Lac (Rs.) NAV Futures
GTL Ltd 1268.50 3.84 -1271.77
GMR INFRASTRUCTURE LIMITED 44.96 0.14 -45.15
Housing Development & Infrastr Ltd 214.94 0.65 -215.30
Hindustan Petroleum Corporation Ltd. 19.52 0.06 -19.53
Tata Teleservices (Mah) Limited 391.29 1.18 -392.84
India Cements Ltd. 644.15 1.95 -643.29
ICSA India Ltd 235.63 0.71 -236.66
IDBI Bank Ltd 468.32 1.42 -470.64
IFCI Limited 627.39 1.90 -630.42
Oracle Financial Serv Software Ltd 453.85 1.37 -454.83
India Infoline Ltd. 275.16 0.83 -276.21
IVRCL Infrastructures & Projects Ltd. 742.16 2.24 -744.81
Indian Overseas Bank 577.77 1.75 -580.60
Indiabulls Real Estate Limited 252.74 0.76 -254.26
Jaiprakash Associates Ltd. 572.21 1.73 -574.50
Larsen & Toubro Ltd. 754.64 2.28 -756.28
LIC Housing Finance Ltd. 58.91 0.18 -59.06
Lupin Ltd. 318.67 0.96 -319.76
Mangalore Refinery & Petrochemicals Ltd. 31.22 0.09 -31.28
Moser Baer India Limited 151.74 0.46 -152.51
Ispat Industries Ltd 396.32 1.20 -398.34
Noida Toll Bridge Co. ltd. 245.42 0.74 -247.75
NTPC Ltd. 323.86 0.98 -319.70
Praj Industries Limited 515.46 1.56 -516.94
Ranbaxy Laboratories Ltd. 799.48 2.42 -801.86
Reliance Communications Ltd 206.82 0.63 -206.69
Jindal Saw Ltd. 1384.50 4.19 -1392.30
Suzlon Energy Ltd. 1130.94 3.42 -1132.40
Triveni Engeering And Industries Ltd. 239.45 0.72 -240.04
Unitech Ltd. 912.78 2.76 -916.46
Welspun Guj Stahl Rohren Ltd 1066.60 3.23 -1068.63
Nifty Stock
Balaji Distilleries Limited 494.71 1.50
Zenotech Laboratories Limited 27.74 0.08
Zee News Limited FV 1 540.38 1.63
HDFC BANK Feb 2010 Future 22.78
ICICI BANK LTD Feb 2010 Future 23.17
United Spirits Ltd Feb 2010 Future -554.50
Axis Bank Limited Feb 2010 Future -46.26
Zee Entertainment Enterprises Ltd Feb 2010 Future -494.05
5600 CALL JUNE 2010 OPTION -6.00 -0.02
4500 PUT JUNE 2010 OPTION -16.83 -0.05
5300 CALL MARCH 2010 OPTION 2.36 0.01
5000 PUT MARCH 2010 OPTION 26.00 0.08
Grand Total 33062.21 100.02
Total 21,280.24 64.36 -21,350.36
Equity Shares Total 1062.83 3.21 -1,048.84
Nifty Stock / Option 5.53 0.02
Final Total 22354.13 67.61 -22399.20
Bank Deposit Total 6500.00 19.66
Call / Reverse Repo/ CBLO Total 5718.76 17.30
Net Current Asset -1505.15 -4.55
IDFC Arbitrage Plus Fund(IDFC - APF)An open-ended equity fund
Fund features
Nature : Equity DerivativesAverage AUM : Rs. 359.90 CroreFund Manager : Ashwin Patni & Arjun ParthasarathyInvestment objective : The investment objective of the scheme is to generate income (absolute to low volatility returns) by taking advantage of opportunities in the cash and the derivative segments of the equity markets including the arbitrage opportunities available within the derivative segment, by using other derivative based strategies and by investing the balance in debt and money market instruments. However there is no assurance that the investment objective of the scheme will be realized.Investment style : The fund aimed to generate absolute returns by investing in trades in the equity and derivative markets. The trades can consist of cash-futures arbitrage as well as relative value (such as pair trades and corporate event- based strategies) and derivatives strategies. Ideal investment horizon : 1 year or moreEntry load : NilExit load: IDFC- APF - Plan A & Plan B : 0.50% of NAV on investors who purchase/switch in and seek to redeem/switch out such units within 365 days such from the date of effecting such purchase/switch in. (w.e.f. August 24, 2009)In case of Switches, Exit load shall be NIL for all switch transactions between equity schemes of IDFC Mutual Fund . (w.e.f. October 12, 2009.)Options available: Growth, Dividend & Dividend Sweep (w.e.f. 16-Nov-2009)Minimum investment amount : Plan A : Rs.5,000, Plan B: Rs. 25,00,000 (w.e.f. July 6, 2009)Additional investment amount : Re.1Inception Date: 9 June 2008Statistical measures : Standard deviation 0.60%Last 3 dividends (Rs. / unit):12 Mar 2009 A 0.06 NAV 10.347612 Mar 2009 B 0.06 NAV 10.373516 Apr 2009 A 0.06 NAV 10.360016 Apr 2009 B 0.06 NAV 10.388612 Nov 2009 A 0.06 NAV 10.488412 Nov 2009 B 0.06 NAV 10.5329Dividend frequency : Monthly, subject to availability of distributable surplusNAV (Rs.):Growth (A) 11.0186 (B) 11.0387Dividend (A) 10.5523 (B) 10.6028Face value (Rs. / unit) : 10Asset allocation (equity / debt / cash/Derivatives Option) : 67.58% / 36.96% / -4.55% /0.02%Fund manager’s comment:Cash-future spreads were affected as equity markets saw some selling pressure close to the expiry. The fund was able to successfully roll-over its arbitrage positions into February. The fund also had positions in options, open offers and pair trades.
Portfolio as of 0 Contd...29 January 201
Data as of 29 January 2010
8
MarketValue in % of Value of
Name Lac (Rs.) NAV Futures
Portfolio as of 029 January 201
Bajaj Hindustan Ltd. 328.96 0.99 -329.77
Balrampur Chini Mills Ltd. 658.28 1.99 -659.38
Biocon Limited 285.52 0.86 -286.63
Bombay Rayon Fashions Ltd. 275.02 0.83 -276.43
Reliance Infrastructure Limited 385.34 1.17 -386.70
CAIRN INDIA LIMITED 484.90 1.47 -487.09
Century Textiles & Industries Ltd. 1820.97 5.51 -1831.63
Dena Bank 455.99 1.38 -457.76
Kingfisher Airlines Ltd 85.62 0.26 -85.94
Essar Oil Ltd 321.82 0.97 -322.52
Reliance Natural Resources Ltd 852.40 2.58 -855.72
Contd...
Fund performance
Past performance may or may not be sustained in future.Benchmark : Crisil Liquid Fund Index
under the IDFC-APF-Growth as of 29 January 2010
IDFC-APF - Growth Crisil Liquid Fund Index
3 Month (Absolute) 6 Month (Absolute) Since Inception (CAGR)Last 1 Year (CAGR)
6.09%
3.55%
1.52%
0.49%
6.26%
4.29%
1.39%
0.70%

IDFC Small & Midcap Equity (SME) Fund(IDFC - SMEF)An Open Ended Equity Scheme. Data as of 29 January 2010
9
Asset Allocation
Marketvalue in % of
Name Lac (Rs.) NAV
TVS Motor Company Ltd. 978.09 2.26Bajaj Auto Ltd. 873.85 2.02
Asahi India Glass Ltd. 665.87 1.54
Indian Overseas Bank 1544.76 3.57Union Bank of India 1019.60 2.36
Phoenix Mills Ltd. 892.35 2.06Anant Raj Ind Ltd. 646.26 1.50
Bajaj Electricals Ltd. 863.93 2.00
United Spirits Ltd. 2012.97 4.66Lakshmi Energy And Foods Ltd 1343.10 3.11Nestle India Ltd. 1266.50 2.93Dabur India Ltd. 1125.60 2.60Dhampur Sugar Mills Ltd. 1076.51 2.49Colgate-Palmolive (India) Ltd. 814.86 1.89Bajaj Hindustan Ltd. 810.00 1.87GlaxoSmithkline Consumer Healthcare Ltd. 662.50 1.53
Aditya Birla Nuvo LTD. 807.14 1.87
Usha Martin Ltd. 647.20 1.50Adhunik Metaliks Ltd. 569.84 1.32
Shriram Transport Finance Co Ltd. 1224.50 2.83Mahindra & Mahindra Fin Ser Ltd. 869.38 2.01Dewan Housing Finance Corpn Ltd 829.29 1.92Power Finance Corporation Ltd. 493.42 1.14
Fortis Healthcare Ltd. 846.49 1.96
Siemens Ltd. 1528.30 3.54AIA Engineering Ltd. 465.82 1.08
Sun TV Network Ltd. 966.25 2.24
Aurobindo Pharma Ltd. 1567.79 3.63Strides Arcolab Ltd. 1135.40 2.63Dishman Pharmaceuticals & Chemicals Ltd. 653.05 1.51Opto Circuits Ltd. 574.20 1.33
CESC Ltd. 743.95 1.72
Oracle Financial Serv Software Ltd 1512.84 3.50Patni Computers System Ltd. 694.58 1.61Mphasis Ltd. 508.95 1.18
Mundra Port & Special Eco Zone Ltd 1717.15 3.97Spicejet Ltd. 1451.16 3.36
Grand Total 43225.72 100.00
Auto Total 1851.94 4.28
Auto Ancillaries Total 665.87 1.54
Bank Total 2564.36 5.93
Construction Total 1538.61 3.56
Consumer Durables Total 863.93 2.00
Consumer Non Durables Total 9112.04 21.08
Diversified Total 807.14 1.87
Ferrous Metals Total 1217.04 2.82
Finance Total 3416.59 7.90
Healthcare Services Total 846.49 1.96
Industrial Capital Goods Total 1994.12 4.61
Media & Entertainment Total 966.25 2.24
Pharmaceuticals Total 3930.45 9.09
Power Total 743.95 1.72
Software Total 2716.37 6.28
Transportation Total 3168.31 7.33Others Total 1898.49 4.39Call / Reverse Repo/ CBLO Total 4290.22 9.93Net Current Asset 633.56 1.47
Long Future Total 790.45 1.83
Fund features
Fund performance
Nature : EquityAverage AUM : Rs. 427.52 CroreFund Manager : Kenneth AndradeInvestment objective : The investment objective of the Scheme is to seek to generate capital appreciation from a diversified portfolio of equity and equity related instruments.The Scheme will predominantly invest in small and midcap equity and equity related instruments. Small and Midcap equity and equity related instruments will be the stocks included in the CNX Midcap index or equity and equity related instruments of such companies which have a market capitalization lower than the highest components of CNX Midcap Index. The Scheme may also invest in stock other than mid cap stocks (i.e. in stocks, which have a market capitalisation of above the market capitalisation range of the defined small midcap stocks) and derivatives. On defensive consideration, the Scheme may also invest in debt and money market instruments. However there is no assurance that the investment objective of the scheme will be realized.Investment Style: The Scheme will predominantly invest in small and mid-cap equity and equity related instruments. Small and Mid-cap equity and equity related instruments will be the stocks included in the CNX Mid-Cap index or equity and equity related instruments of such companies which have a market capitalization lower than the highest components of CNX Mid-Cap Index. The scheme would predominantly create a portfolio of emerging business and companies that are aspiring leaders in their respective field of operations. Some part of the portfolio would be in stocks/ companies that do not have a significant history of being listed. The guiding principles while managing the portfolio are summarized below:1) Sustainable company profits drives long term share value2) Acquire stocks at reasonable value3) Monitor market interest to ensure consistent performanceIdeal Investment Horizon: More than 3 yearsEntry Load: NilExit load: The scheme is converted into open ended scheme w.e.f. September 11, 2009. W.e.f. September 11, 2009 Exit Load - If redeemed within 365 days from the date of purchase(s) applying First in First out basis (including purchase made through the STP/SIP) -1.00%.No exit load /CDSC will be chargeable in case of switches made between different options of the schemes. In case of Switches, Exit load shall be NIL for all switch transactions between equity schemes of IDFC Mutual Fund (w.e.f. October 12, 2009.)Options available: Growth, DividendMinimum investment amount : Rs. 5,000 SIP (minimum amount): Rs. 1000Additional investment amount : Re.1Inception Date: 7 March 2008Statistical Measures : Standard deviation 3.88%Last 3 dividends (Rs./ unit) :29 September 2009 1.10 NAV 12.3972Dividends frequency : NANAV (Rs.):Growth 14.9337Dividend 13.7288Face value (Rs. / unit) : 10Asset allocation (equity / debt / cash) : 88.61% / 9.93% / 1.47%Fund manager’s commentThe fund philosophy is to capture the potential of the small and mid - cap companies in the country. The underlying companies in the portfolio are growth oriented and at a second level the fund seeks to optimize valuations in this space. With markets buoyant the portfolio shifts have been reasonably aggressive in tune with the changing valuations. The strategy is expected to remain invested in smaller companies with low business risk and extreme valuation comfort.
Past performance may or may not be sustained in future.Benchmark : CNX Midcap
under the IDFC-SMEF-Growth as of 01029 January 2
IDFC-SMEF - Growth CNX Midcap
Data as of 29 January 2010
Portfolio as of 29 010 January 2
3 Month (Absolute) 6 Month (Absolute) Since Inception (CAGR)Last 1 Year CAGR
9.38%
24.14%
112.39%
23.52%
9.45%
23.00%
114.52%
5.54%
21.82%
9.09%7.90%
7.35%6.28%5.93%
5.01%4.61%3.56%2.82%
2.24%2.00%1.87%1.72%1.54%1.16%0.94%0.81%1.96%
Consu
mer
No
n D
ura
ble
s
Ph
arm
ace
utic
als
Fin
ance
Tra
nsp
ort
atio
n
Softw
are
Banks
Auto
Indust
rial
Ca
pita
l Goods
Co
nst
ruct
ion
Fe
rrous
Meta
ls
Media
&
En
tert
ain
ment
Consu
mer
Dura
ble
s
Health
care
S
erv
ices
Div
ers
ified
Pow
er
Au
to A
nci
llaries
Fert
ilise
rs
Hard
ware
Indust
rial
Pro
duct
s

IDFC Strategic Sector (50-50) Equity FundIDFC-SS (50-50)-EFA Open Ended Equity Fund Data as of 29 January 2010
10
Asset Allocation
Marketvalue in % of
Name Lac (Rs.) NAV
Sector - Banking & Finance Total 1634.56 49.93
Financial Services Total 1349.76 41.23Bank Nifty Long Future Total 284.79 8.70Diversified Total 1622.98 49.58
Construction Total 125.73 3.84
Consumer Goods Total 133.08 4.07
Metals Total 132.00 4.03
Industrial Manufacturing Total 55.97 1.71
Energy Total 327.20 10.00
Information Technology Total 229.65 7.02
Telecom Total 55.33 1.69Others Total 564.03 17.23Net Current Asset 300.85 9.19
ICICI Bank Ltd. 282.32 8.62Union Bank Of India 191.18 5.84Axis Bank Limited 179.50 5.48HDFC Bank Ltd. 163.11 4.98State Bank Of India 154.25 4.71Federal Bank Ltd. 95.64 2.92Bank Of Baroda 94.96 2.90Kotak Mahindra Bank Ltd. 93.47 2.86Housing Development Finance Cor Ltd 95.35 2.91
Larsen & Toubro Ltd. 125.73 3.84
Hindustan Unilever Ltd. 37.33 1.14ITC Ltd 95.74 2.92
Sterlite Industries Ltd. 44.74 1.37Tata Steel Ltd. 51.51 1.57Jindal Steel & Power Ltd. 35.74 1.09
Bharat Heavy Electricals Ltd. 55.97 1.71
Reliance Industries Ltd. 272.38 8.32Oil & Natural Gas Corporation Ltd. 54.82 1.67
Infosys Technologies Ltd. 174.94 5.34Tata Consultancy Services Ltd. 54.71 1.67
Bharti Airtel Ltd. 55.33 1.69
Grand Total 3273.59 100.00
Fund features
Fund performance
Nature : EquityAverage AUM: Rs. 34.52 CroreFund Manager : Kenneth AndradeInvestment objective : The investment objective of the scheme is to seek to generate long-term capital appreciation by investing in Equity and Equity related instruments.The investment objective of the fund shall be achieved by investing up to fifty percent of the assets of the scheme in a chosen sector (sector specific exposure) while the balance amount may be invested in companies across market capitalizations and across sectors (diversified exposure). The scheme may also invest in debt and money market instruments.There is no assurance or guarantee that the objectives of the scheme will be realized and the scheme does not assure or guarantee any returns.Ideal investment horizon : 3 years or moreEntry Load: (Plan A & Plan B) : Nil (w.e.f. August 01, 2009)Exit Load: (Plan A & Plan B) : All Investment including SIP/Micro SIP/STP/FOF if redeemed / switched out within 365 days from the date of allotment - 1%. No Entry / Exit Loads / CDSC will be chargeable in case of switches made between different options of the Scheme. (w.e.f. September 01, 2009)In case of Switches, Exit load shall be NIL for all switch transactions between equity schemes of IDFC Mutual Fund . (w.e.f. October 12, 2009.)Options available: Growth, Dividend. Reinvestment facility is available under the Dividend Option.Minimum investment amount (Plan A & Plan B): Rs. 5,000 Additional investment amount : Re.1SIP (minimum amount) ( Plan A & Plan B): Rs. 1000 Inception Date (Plan A) : 3 October 2008Inception Date (Plan B) : 2 April 2009Statistical Measures : Beta 0.85R Square 0.95Standard deviation 8.26%Dividend frequency : NANAV (Rs.):Growth (A)12.1486 (B) 13.3122Dividend (A)12.0196 (B) 13.3125Face value (Rs. / unit) : 10Asset allocation (equity / debt / cash) : 90.81% /Nil / 9.19%Fund manager’s comment :The fund is built around allocating 50% of its invested portfolio to one sector. The Energy sector (as defined by the AMFI Classification) was 50% of the portfolio from April 2009 to November 2009. The portfolio has now moved this concentration back to Financials towards the end of October. Half way through 2010 financial year, the risk on the system looks far lower that what it started off in April 2009. The fear of large scale NPA’s are now controllable and the sector is back to stability. The near term risks with the financial stocks are the valuations which look well priced. If growth returns to the economy then this risk gets mitigated. The Strategic Sector Fund is positioned to be a more aggressive fund with a concentration risk. The portfolio would be in stocks which are industry leaders.
Past performance may or may not be sustained in future.Benchmark : S & P CNX Nifty
under the IDFC Strategic Sector (50-50) Equity Fund-Growth as of 29 January 2010
IDFC Strategic Sector (50-50) Equity Fund Growth S & P CNX Nifty
Data as of 29 January 2010
Portfolio as of 01029 January 2
3 Month (Absolute) Since Inception CAGR6 Month (Absolute) Last 1 Year CAGR
-0.26%
0.99%
47.54%
15.84%
3.62% 5.30%
70.07%
20.41%
41.52%
14.52%
8.22%5.54%5.41%
4.07%3.22%3.10%2.11%1.58%1.52%
Fin
an
cia
lS
erv
ice
s
En
erg
y
Info
rma
tio
nT
ec
hn
olo
gy
Co
ns
tru
cti
on
Me
tals
Co
ns
um
er
Go
od
s
Au
tom
ob
ile
Ind
us
tria
lM
an
ufa
ctu
rin
g
Te
lec
om
Ce
me
nt
an
dC
em
en
tP
rod
uc
ts
Ph
arm
a

IDFC Tax Advantage (ELSS) FundIDFC TA (ELSS) FundAn open ended Equity Linked Saving Scheme with lock in period of 3 years. Data as of 29 January 2010
11
Asset Allocation
Marketvalue in % of
Name Lac (Rs.) NAV
Mahindra & Mahindra Ltd. 101.76 2.58Hero Honda Motors Ltd. 93.54 2.37
ICICI Bank Ltd. 249.11 6.31Allahabad Bank 176.69 4.48Axis Bank Ltd. 153.86 3.90Union Bank of India 152.94 3.87Federal Bank Ltd. 102.02 2.58Indian Overseas Bank 45.98 1.16
Unitech Ltd. 74.30 1.88
Larsen & Toubro Ltd. 71.19 1.80
Emami Ltd. 132.50 3.36TTK Prestige Ltd 65.49 1.66
Jindal Steel & Power Ltd. 125.59 3.18Tata Steel Ltd. 113.82 2.88
Allied Digital Services Ltd. 46.65 1.18
Bharat Heavy Electricals Ltd. 120.26 3.05Sterlite Technologies Ltd 120.20 3.04
Jagran Prakashan Ltd 120.65 3.06Sun TV Network Ltd. 77.30 1.96
Sterlite Industries Ltd. 150.62 3.82
Oil & Natural Gas Corporation Ltd. 109.64 2.78
Reliance Industries Ltd. 230.16 5.83
Strides Arcolab Ltd. 113.54 2.88Torrent Pharmaceuticals Ltd. 88.76 2.25Cadila Healthcare Ltd. 85.86 2.17
Jyoti Structures Ltd. 66.42 1.68
Infosys Technologies Ltd. 148.53 3.76Tata Consultancy Services Ltd. 147.24 3.73HCL Technologies Ltd. 104.04 2.64Zensar Technologies Ltd. 46.07 1.17
Cox and Kings India Ltd. 81.98 2.08
Grand Total 3947.78 100.00
Auto Total 195.30 4.95
Banks Total 880.58 22.31
Construction Total 74.30 1.88
Construction Project Total 71.19 1.80
Consumer Non Durables Total 197.99 5.02
Ferrous Metals Total 239.41 6.06
Hardware Total 46.65 1.18
Industrial Capital Goods Total 240.46 6.09
Media & Entertainment Total 197.95 5.01
Non - Ferrous Metals Total 150.62 3.82
Oil Total 109.64 2.78
Petroleum Products Total 230.16 5.83
Pharmaceuticals Total 288.16 7.30
Power Total 66.42 1.68
Software Total 445.88 11.29
Transportation Total 81.98 2.08Others Total 24.65 0.62Call / Reverse Repo/ CBLO Total 570.03 14.44Net Current Asset -163.58 -4.14
Fund features
Fund performance
Nature : EquityAverage AUM : Rs. 30.02 CroreFund Manager : Kenneth Andrade. w.e.f. 21 July, 2009 Investment objective : The investment objective of the Scheme is to seek to generate long term capital growth from a diversified portfolio of predominantly equity and equity related securities.There can be no assurance that the investment objective of the scheme will be realised.Investment style : The Scheme will invest in well- managed growth companies that are available at reasonable value. Companies would be identified through a systematic process of forecasting earnings based on a deep understanding of the industry growth potential and interaction with company management .Entry load : Nil (w.e.f. August 01, 2009)Exit load : Nil (w.e.f. September 04, 2009)Options available: Growth, Dividend. Reinvestment facility is available under the Dividend Option.Minimum investment amount : Rs. 500Additional investment amount : Rs. 500SIP (minimum amount) : Rs. 500Inception Date: 26 December 2008Statistical Measures : Beta 0.67R Square 0.91Standard deviation 7.72%Last 3 dividends (Rs./ unit) :20 January 2010 2.50 NAV 14.9373Dividends frequency : NANAV (Rs.):Growth 16.6915Dividend 14.2953Face value (Rs. / unit) : 10Asset allocation (equity / debt / cash) : 89.70% /14.44% / -4.14%Fund manager’s comment :The focus is to invest in long term growth stocks at reasonable price. The portfolio is an diverse mix of companies across sectors and is agnostic to capitalization bias. Given the plethora of opportunities which is there in domestic economy, the fund seeks to invest in companies with strong track record of execution, high operating leverage and reasonable valuations.
Past performance may or may not be sustained in future.Benchmark : BSE 200
under the IDFC TA (ELSS) - Growth as of 01029 January 2 Data as of 29 January 2010
Portfolio as of 29 010 January 2
IDFC-TA(ELSS) - Growth BSE200
Since Inception absolute 3 Month (Absolute) 6 Month (Absolute)
22.31%
11.29%
7.30%6.09%6.06%5.83%5.64%
5.01%4.95%3.82%
2.78%2.08%1.80%1.68%1.18%
1.88%
Banks
Softw
are
Ph
arm
ace
utic
als
Ind
ust
rial C
apita
lG
oods
Fe
rrous
Meta
ls
Petr
ole
um
Pro
duct
s
Co
nsu
mer
Non
Dura
ble
s
Media
&E
nte
rtain
ment
Auto
No
n -
Ferr
ous
Meta
lsOil
Tra
nsp
ort
atio
n
Co
nst
ruct
ion
Co
nst
ruct
ion
Pro
ject
Pow
er
Hard
ware
6.98%
16.44%
68.12%
59.78%
5.21%8.15%
86.87%
75.62%

IDFC India GDP Growth Fund(IDFC - IGGF)An Open Ended Equity Scheme Data as of 29 January 2010
12
Asset Allocation
Marketvalue in % of
Name Lac (Rs.) NAV
Bajaj Auto Ltd. 129.33 2.71
ICICI Bank Ltd. 311.38 6.52Bank of Baroda 163.11 3.41Axis Bank Ltd. 138.37 2.90Indian Overseas Bank 124.13 2.60Canara Bank 119.07 2.49ING Vysya Bank Ltd. 80.41 1.68
UltraTech Cement Ltd. 125.55 2.63Orient Paper & Industries Ltd. 67.50 1.41Madras Cements Ltd. 64.47 1.35
Anant Raj Ind Ltd. 145.68 3.05
Balrampur Chini Mills Ltd. 171.55 3.59Bajaj Hindustan Ltd. 101.25 2.12
Gujarat State Petronet Ltd 59.31 1.24
Allied Digital Services Ltd. 143.32 3.00
Bharat Heavy Electricals Ltd. 205.81 4.31
Jagran Prakashan Ltd 156.43 3.27Sun TV Network Ltd. 58.36 1.22
Manappuram General Fin & Leasing Lt 124.00 2.59
United Phosphorus Ltd. 132.40 2.77
Hindustan Petroleum Corporation Ltd. 189.76 3.97Reliance Industries Ltd. 178.80 3.74Bharat Petroleum Corporation Ltd. 120.25 2.52
Dishman Pharmaceuticals & Chemicals Ltd. 166.97 3.49
GVK Power & Infrastructure Ltd 91.80 1.92
Pantaloon Retail (India) Ltd. 214.40 4.49
Satyam Computers Ltd. 192.94 4.04Infosys Technologies Ltd. 151.01 3.16Everonn Education Ltd. 135.74 2.84HCL Technologies Ltd. 97.80 2.05Educomp Solutions Ltd. 95.98 2.01
Cox and Kings India Ltd. 187.70 3.93
Grand Total 4779.34 100.00
Auto Total 129.33 2.71
Banks Total 936.47 19.59
Cement Total 257.52 5.39
Construction Total 145.68 3.05
Consumer Non Durables Total 272.80 5.71
Gas Total 59.31 1.24
Hardware Total 143.32 3.00
Industrial Capital Goods Total 205.81 4.31
Media & Entertainment Total 214.79 4.49
Miscellaneous Total 124.00 2.59
Pesticides Total 132.40 2.77
Petroleum Products Total 488.80 10.23
Pharmaceuticals Total 166.97 3.49
Power Total 91.80 1.92
Retailing Total 214.40 4.49
Software Total 673.46 14.09
Transportation Total 187.70 3.93Call / Reverse Repo/ CBLO Total 320.02 6.70Net Current Asset 14.74 0.31
Fund features
Fund performance
Nature : EquityAverage AUM : Rs. 50.01 CroreFund Manager : Tridib PathakInvestment objective : The investment objective of the scheme is to seek to generate long-term capital appreciation by investing in Equity and Equity related instruments. The scheme aims to capture the growth in India's Gross Domestic Product (GDP). The scheme would endeavour to represent the growth in GDP by capturing the growth in the constituents of the GDP. The scheme may also invest in debt and money market instruments.There is no assurance or guarantee that the objectives of the scheme will be realized and the scheme does not assure or guarantee any returns.Investment style : The Scheme will invest in well- managed growth companies that are available at reasonable value. Companies would be identified through a systematic process of forecasting earnings based on a deep understanding of the industry growth potential and interaction with company management.Entry Load : NilExit load: All Investment including SIP/Micro SIP/STP/FOF if redeemed / switched out within 365 days from the date of allotment - 1%. No Exit Loads / CDSC will be chargeable in case of switches made between different options of the Scheme. (w.e.f. September 01, 2009)In case of Switches, Exit load shall be NIL for all switch transactions between equity schemes of IDFC Mutual Fund . (w.e.f. October 12, 2009.)Options available: Growth, Dividend. Reinvestment facility is also available under the dividend option.Minimum investment amount : Rs. 5000Additional investment amount : Re.1SIP (minimum amount) : Rs. 2000 Inception Date: 11 March 2009Statistical Measures : Beta 0.44R Square 0.72Standard deviation 5.99%Dividends frequency : NANAV (Rs.):Growth 14.3372Dividend 14.3401Face value (Rs. / unit) : 10Asset allocation (equity / debt / cash) : 93.00% / 6.70% / 0.31%Fund manager’s commentThe fund is benchmarked to the components of India's GDP in the proportion of the contribution of each component to GDP growth. The fund is invested mainly in the services sector, followed by industrials and then agriculture. Around 60% of the fund's portfolio is currently invested in midcap stocks
Past performance may or may not be sustained in future.Benchmark : BSE 500
under the IDFC-IGGF- Growth as of 01029 January 2 Data as of 29 January 2010
Portfolio as of 01029 January 2
IDFC-IGGF - Growth BSE500
CAGR - Compounded Annualised Growth Rate
3 Month (Absolute) Since Inception (Absolute)6 Month (Absolute)
3.15%8.92%
43.37%
5.98%9.59%
118.23% 19.59%
14.09%
10.23%
5.71%5.39%4.49%4.49%4.31%3.93%3.49%3.05%3.00%2.71%2.59%
1.92%1.24%
2.77%
Banks
Softw
are
Petr
ole
um
P
roduct
s
Consu
mer
No
n D
ura
ble
s
Cem
ent
Media
&
En
tert
ain
ment
Reta
iling
Tra
nsp
ort
atio
n
Co
nst
ruct
ion
Hard
ware
Pest
icid
es
Auto
Mis
cella
neous
Pow
er
Gas

IDFC Super Saver Income Fund - Investment Plan(IDFC - SSIF-IP)An Open - Ended Income Fund
13
Data as of 29 January 2010
Portfolio as of 29 January 2010
% of Name Rating NAV
Rural Electrification Corp Ltd AAA 12.66
ACC Ltd AAA 10.32
HDFC Bank Ltd. AAA 8.66
Power Grid Corporation Ltd. AAA 7.80
ONGC Videsh Ltd. AAA 7.72
State Bank of India AAA 5.49
7.02% GOI 2016 MD 17-08-2016 SOV 17.11
8.24% GOI 2027 MD 15-02-2027 SOV 12.81
6.35% GOI 2020 MD 02-01-2020 SOV 9.40
Grand Total 100.00
Non Convertible Debentures Total 52.64
Govt Securities(GSE) Total 39.31
Net Current Asset 8.05
Fund features
Nature : DebtAverage AUM : Rs. 212.91 CroreFund manager : Arjun ParthasarthyInvestment objective : Seek to generate stable returns by creating a portfolio that is invested in good quality fixed income and money market securities. However there is no assurance that the investment objective of the scheme will be realized.Investment Style: The Scheme seeks to invest in a mix of government securities and highly rated corporate bonds and aims to generate stable long-term returns through mix of accrual income and capital appreciation.Ideal investment horizon : 1 year or moreEntry load : NilExit load : IDFC-SSIF-IP - Plan A , Plan B & Plan C: 1.00% of NAV on investors who purchase/switch in and seek to redeem/switch out such units within 365 days such from the date of effecting such purchase/switch in. Investors opting for PEP / Dividend reinvestment option / SWP or switch between options will not be levied an exit load. (w.e.f. August 24, 2009)Options available : Growth, Dividend & Dividend Sweep (w.e.f. 16-Nov-2009)Minimum investment amount : Rs. 5,000 and in multiples of Re. 1 in Plan A (Regular Plan), Rs. 25 Lakh and in multiples of Re. 1 in Plan B (Institutional Plan)(w.e.f. July 6, 2009), Rs. 5 Crores and in multiples of Re. 1 in Plan C. (w.e.f. July 6, 2009)Additional investment amount : Re.1SIP (minimum amount) : in Plan A Rs. 1,000Inception date : 14 July 2000Statistical Measures : Standard deviation 1.64%Modified Duration 4.96 YearsDividend frequency : Quarterly, Half Yearly, AnnuallyLast 3 dividends :Date Nav Freq. Others I & HIDFC-SSIF-IP-Plan A30-Mar-09 10.4462 Quarterly 0.3669 0.394230-Jun-09 10.4659 Quarterly 0.3669 0.394231-Dec-09 10.4941 Quarterly 0.0090 0.009729-Sep-09 10.6641 Half Yearly 0.3636 0.390730-Mar-09 10.6717 Half Yearly 0.5462 0.586930-Mar-09 10.9413 Annual 0.7663 0.8234IDFC-SSIF-IP-Plan B30-Jun-09 10.2589 Quarterly 0.1223 0.131431-Dec-09 10.2880 Quarterly 0.0296 0.0318IDFC-SSIF-IP-Plan C30-Jun-09 10.1243 Quarterly 0.0408 0.043831-Dec-09 10.1529 Quarterly 0.0227 0.0244NAV (Rs.):Plan A Dividend Quarterly 10.5426Plan A Growth 22.1428Plan A Dividend Annual 11.5291Plan A Dividend Half Yearly 10.7937Plan B Growth 10.6522Plan B Dividend 10.3389Plan C Growth 10.2823Plan C Dividend 10.2032Face Value (Rs. / unit): 10Fund manager's comment:The fund maintained duration at higher levels of yields to capture accrual. The fund will actively monitor the dynamic interest rate and credit spread environment to optimize performance.Benchmark : Crisil Composite Bond Fund Index (CCBFI)
Asset Allocation
Fund performance IDFC-SSIF-IP Growth as of 29 January 2010
Data as of 29 January 2010
Past performance may or may not be sustained in future.
1 Non Convertible Debentures 52.64%
2 Govt Securities(GSE) 39.31%
3 Net Current Asset 8.05%
CAGR Last 1 Year
CAGR Last 2 Years
CAGR Last 3 Years
CAGR Last 5 Years
CAGR SinceAllotment
14/07/2000IDFC-SSIF-IP - Growth CCBFI
CAGR - Compounded Annualised Growth Rate
Rating & Rankings
ICRA Rating
Past performance is no guarantee of future results.For Methodology of Ranking Please refer Page No. 32.
1
2
3
7.52%8.68%
1.27%
9.06%9.61%
5.67%6.60%
6.00%
4.70%
Morningstar Rating

12
3
Data as of 29 January 2010
IDFC Dynamic Bond Fund(IDFC - DBF)An Open - Ended Income Fund
14
Portfolio as of 29 January 2010
% of Name Rating NAV
CBLO 79.17
ONGC Videsh Ltd. AAA 7.84
Grand Total 100.00
CBLO Total 79.17
Non Convertible Debentures Total 7.84Net Current Asset 12.98
Fund features
Nature : DebtAverage AUM : Rs. 204.17 CroreFund manager : Arjun ParthasarthyInvestment objective : Seek to generate optimal returns with high liquidity by active management of the portfolio; by investing in high quality money market & debt instruments. However there is no assurance that the investment objective of the scheme will be realized.Investment Style: The Scheme seeks to invest in a mix of government securities and highly rated corporate bonds and seeks to generate returns by actively managing the interest rate volatility.Ideal investment horizon : 1 year or moreEntry load : NilExit load : IDFC-DBF - Plan A & Plan B: Nil. (w.e.f. August 24, 2009)Options available : Growth, Dividend & Dividend Sweep (w.e.f. 16-Nov-2009)Minimum investment amount : Rs. 5,000 and in multiples of Re. 1 in Plan A (Regular Plan), Rs. 25 Lakh and in multiples of Re. 1 in plan B (Institutional Plan). (w.e.f. July 6, 2009)Additional investment amount : Re.1SIP (minimum amount) : in Plan A Rs. 1,000Inception date : 25 June 2002Statistical Measures : Standard deviation 1.77%Modified Duration 0.31 YearsDividend frequency : Quarterly & AnnuallyLast 3 dividends :Date Nav Freq. Others I & HIDFC- DBF - Plan A31-Dec-08 12.0332 Quarterly 0.2853 0.306630-Mar-09 10.5857 Quarterly 0.4158 0.446730-Jun-09 10.5502 Quarterly 0.4158 0.446730-Mar-09 11.1462 Annual 0.8560 0.9197IDFC- DBF - Plan B6-Jul-09 10.2050 0.2853 0.3066NAV (Rs.):Plan A Growth 18.0680Plan A Dividend Annual 11.6119Plan A Dividend Quarterly 10.5196Plan B Growth 10.5669Plan B Dividend 10.1775Face Value (Rs. / unit): 10Fund manager's comment :The fund will actively manage cash in an uncertain interest rate environment. The fund will move dynamically between cash, government bonds and corporate bonds to optimize performance. Benchmark : Crisil Composite Bond Fund Index (CCBFI)
Asset Allocation
Fund performance IDFC-DBF Growth as of 29 January 2010
Data as of 29 January 2010
Past performance may or may not be sustained in future.
1 CBLO 79.17%
2 Net Current Asset 12.98%
3 Non Convertible Debentures 7.84%
CAGR Last 1 Year
CAGR Last 2 Years
CAGR Last 3 Years
CAGR Last 5 Years
CAGR Since Allotment
25/06/2002IDFC-DBF - Growth CCBFI
CAGR - Compounded Annualised Growth Rate
Rating & Rankings
ICRA Rating
Past performance is no guarantee of future results.For Methodology of Ranking Please refer Page No. 32.
Morningstar Rating
9.81% 10.29%
8.51%
0.68%
8.09%
4.70%
6.00%6.60%
5.67% 5.98%

1
3
2
4
Data as of 29 January 2010
IDFC Super Saver Income Fund - Medium Term(IDFC-SSIF-MT)An Open - Ended Income Fund
15
1 Certificate Of Deposit 46.04%
2 Non Convertible Debentures 32.56%
3 Govt Securities(GSE) 10.80%
4 Net Current Asset 10.59%
Portfolio as of 29 January 2010
% of Name Rating NAV
ICICI Bank Ltd. A1+ 20.88ING Vysya Bank Ltd. P1+ 10.60Oriental Bank of Commerce P1+ 8.18Central Bank of India PR1+ 4.25UCO Bank P1+ 2.13
Power Grid Corporation Ltd. AAA 11.02ACC Ltd AAA 10.79ONGC Videsh Ltd. AAA 10.76
7.32% GOI 2014 MD 20-10-2014 SOV 10.80
Grand Total 100.00
Certificate Of Deposit Total 46.04
Non Convertible Debentures Total 32.56
Govt Securities(GSE) Total 10.80Net Current Asset 10.59
Fund features
Nature : DebtAverage AUM : Rs. 46.69 CroreFund manager : Anupam JoshiInvestment objective : Seek to generate stable returns with a low risk strategy by investing in good quality fixed income securities and money market securities. However there is no assurance that the investment objective of the scheme will be realized.Investment Style: The Scheme seeks to invest in a mix of government securities and highly rated corporate bonds and aims to generate stable long-term returns through mix of accrual income and capital appreciation.Ideal investment horizon : 6 months or moreEntry load : NilExit load : IDFC-SSIF-MT - Plan A & Plan B: 0.50% of NAV shall be the exit load payable by investors who purchase / switch in and seek to redeem / switch out such units within 182 days from the date of effecting such purchase / switch in. Investors opting for PEP / Dividend reinvestment option / SWP or switch between options will not be levied an exit load. (w.e.f. August 24, 2009)Options available : Growth, Dividend & Dividend Sweep (w.e.f. 16-Nov-2009)Minimum investment amount : Rs. 5,000 and in multiples of Re. 1 in Plan A (Regular Plan), Rs. 25 Lakh and in multiples of Re. 1 in Plan B (Institutional Plan). (w.e.f. July 6, 2009)Additional investment amount : Re.1SIP (minimum amount) : in Plan A Rs. 1,000Inception date : 8 July 2003Statistical Measures : Standard deviation 1.21%Modified Duration 1.75 YearsDividend frequency : Bi-monthly, Monthly, Fortnightly & DailyLast 3 dividends :Date Nav Freq. Others I & HIDFC- SSIF-MT Plan A28-Jan-10 10.0220 Daily 0.00193201 0.0020758227-Jan-10 10.0220 Daily 0.00480653 0.0051636725-Jan-10 10.0220 Daily 0.00197513 0.0021222630-Jan-10 10.4502 Bimonthly 0.0881 0.094729-Jan-10 10.0617 Fortnightly 0.0536 0.057515-Jan-10 10.0617 Fortnightly 0.0397 0.04271-Jan-10 10.0617 Fortnightly 0.0272 0.029329-Jan-10 10.1544 Monthly 0.0990 0.1063NAV (Rs.):Plan A Growth 15.5166Plan A Dividend Bi-Monthly 10.5569Plan A Dividend Fortnightly 10.0617Plan A Dividend Monthly 10.1544Plan A Dividend Daily 10.0175Plan B Growth 10.5362Plan B Dividend 10.9937Face Value (Rs. / unit): 10Fund manager's commentThe fund is invested in a mix of medium tenor corporate bonds and government bonds with weights allocated to certificate of deposits to temper duration. The fund will aim to maintain an average maturity between three to four years.Benchmark : CRISIL Short-Term Bond Fund Index (CSTBFI)
Asset Allocation
Fund performance IDFC-SSIF-MT - Growth as of 29 January 2010
Data as of 29 January 2010
Past performance may or may not be sustained in future.
CAGR Last 1 Year
CAGR Last 2 Years
CAGR Last 3 Years
CAGR Last 5 Years
CAGR Since Allotment
08/07/2003IDFC-SSIF-MT - Growth CSTBFI
CAGR - Compounded Annualised Growth Rate
Rating & Rankings
Value Research Rating
Past performance is no guarantee of future results.For Methodology of Ranking Please refer Page No. 32.
10.66%9.54%
8.12%
10.92%
6.92%6.24%
7.93% 8.04%6.83%
6.12%
Morningstar Rating
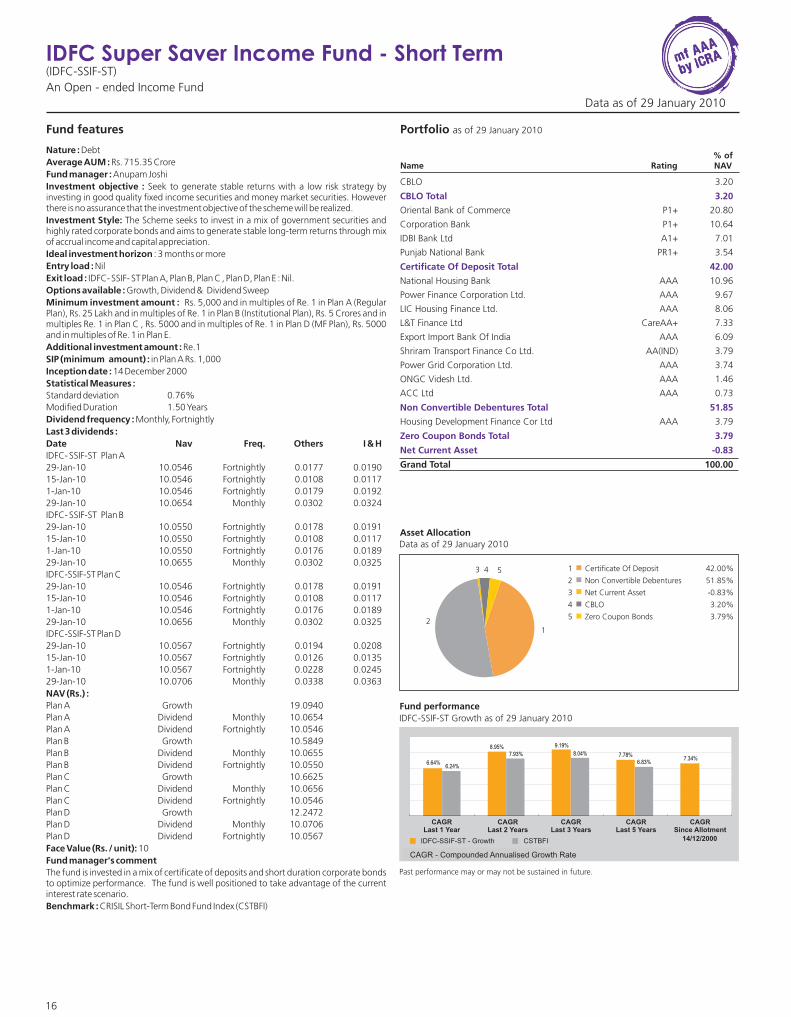
12
3 4 5
Data as of 29 January 2010
IDFC Super Saver Income Fund - Short Term(IDFC-SSIF-ST)An Open - ended Income Fund
16
Portfolio as of 29 January 2010
% of Name Rating NAV
CBLO 3.20
Oriental Bank of Commerce P1+ 20.80
Corporation Bank P1+ 10.64
IDBI Bank Ltd A1+ 7.01
Punjab National Bank PR1+ 3.54
National Housing Bank AAA 10.96
Power Finance Corporation Ltd. AAA 9.67
LIC Housing Finance Ltd. AAA 8.06
L&T Finance Ltd CareAA+ 7.33
Export Import Bank Of India AAA 6.09
Shriram Transport Finance Co Ltd. AA(IND) 3.79
Power Grid Corporation Ltd. AAA 3.74
ONGC Videsh Ltd. AAA 1.46
ACC Ltd AAA 0.73
Housing Development Finance Cor Ltd AAA 3.79
Grand Total 100.00
CBLO Total 3.20
Certificate Of Deposit Total 42.00
Non Convertible Debentures Total 51.85
Zero Coupon Bonds Total 3.79
Net Current Asset -0.83
Fund features
Asset Allocation
Fund performance IDFC-SSIF-ST Growth as of 29 January 2010
Data as of 29 January 2010
Past performance may or may not be sustained in future.
CAGR Last 1 Year
CAGR Last 2 Years
CAGR Last 3 Years
CAGR Last 5 Years
CAGR Since Allotment
14/12/2000IDFC-SSIF-ST - Growth CSTBFI
CAGR - Compounded Annualised Growth Rate
1 Certificate Of Deposit 42.00%
2 Non Convertible Debentures 51.85%
3 Net Current Asset -0.83%
4 CBLO 3.20%
5 Zero Coupon Bonds 3.79%
Nature : DebtAverage AUM : Rs. 715.35 CroreFund manager : Anupam JoshiInvestment objective : Seek to generate stable returns with a low risk strategy by investing in good quality fixed income securities and money market securities. However there is no assurance that the investment objective of the scheme will be realized.Investment Style: The Scheme seeks to invest in a mix of government securities and highly rated corporate bonds and aims to generate stable long-term returns through mix of accrual income and capital appreciation.Ideal investment horizon : 3 months or moreEntry load : NilExit load : IDFC- SSIF- ST Plan A, Plan B, Plan C , Plan D, Plan E : Nil. Options available : Growth, Dividend & Dividend Sweep Minimum investment amount : Rs. 5,000 and in multiples of Re. 1 in Plan A (Regular Plan), Rs. 25 Lakh and in multiples of Re. 1 in Plan B (Institutional Plan), Rs. 5 Crores and in multiples Re. 1 in Plan C , Rs. 5000 and in multiples of Re. 1 in Plan D (MF Plan), Rs. 5000 and in multiples of Re. 1 in Plan E.Additional investment amount : Re.1SIP (minimum amount) : in Plan A Rs. 1,000Inception date : 14 December 2000Statistical Measures : Standard deviation 0.76%Modified Duration 1.50 YearsDividend frequency : Monthly, Fortnightly Last 3 dividends :Date Nav Freq. Others I & HIDFC- SSIF-ST Plan A29-Jan-10 10.0546 Fortnightly 0.0177 0.019015-Jan-10 10.0546 Fortnightly 0.0108 0.01171-Jan-10 10.0546 Fortnightly 0.0179 0.019229-Jan-10 10.0654 Monthly 0.0302 0.0324IDFC- SSIF-ST Plan B29-Jan-10 10.0550 Fortnightly 0.0178 0.019115-Jan-10 10.0550 Fortnightly 0.0108 0.01171-Jan-10 10.0550 Fortnightly 0.0176 0.018929-Jan-10 10.0655 Monthly 0.0302 0.0325IDFC-SSIF-ST Plan C29-Jan-10 10.0546 Fortnightly 0.0178 0.019115-Jan-10 10.0546 Fortnightly 0.0108 0.01171-Jan-10 10.0546 Fortnightly 0.0176 0.018929-Jan-10 10.0656 Monthly 0.0302 0.0325IDFC-SSIF-ST Plan D29-Jan-10 10.0567 Fortnightly 0.0194 0.020815-Jan-10 10.0567 Fortnightly 0.0126 0.01351-Jan-10 10.0567 Fortnightly 0.0228 0.024529-Jan-10 10.0706 Monthly 0.0338 0.0363NAV (Rs.) :Plan A Growth 19.0940Plan A Dividend Monthly 10.0654Plan A Dividend Fortnightly 10.0546Plan B Growth 10.5849Plan B Dividend Monthly 10.0655Plan B Dividend Fortnightly 10.0550Plan C Growth 10.6625Plan C Dividend Monthly 10.0656Plan C Dividend Fortnightly 10.0546Plan D Growth 12.2472Plan D Dividend Monthly 10.0706Plan D Dividend Fortnightly 10.0567Face Value (Rs. / unit): 10Fund manager's commentThe fund is invested in a mix of certificate of deposits and short duration corporate bonds to optimize performance. The fund is well positioned to take advantage of the current interest rate scenario.Benchmark : CRISIL Short-Term Bond Fund Index (CSTBFI)
8.95% 9.19%
7.78%
6.64%7.34%
6.24%
7.93% 8.04%
6.83%

1 CBLO 1.45%
2 Certificate Of Deposit 44.42%
3 Commercial Paper 27.06%
4 Fixed Deposits 1.48%
5 Net Current Asset -0.04%
6 Non Convertible Debentures 7.42%
7 Bills Re-discounted 13.28%
8 Treasury Bills 4.93%
IDFC Cash Fund(IDFC-CF)An Open - Ended Liquid Fund
17
Data as of 29 January 2010
Portfolio as of 29 January 2010
% of Name Rating NAV
CBLO 1.45
State Bank Of Bikaner & Jaipur P1+ 14.73Bank of India P1+ 6.34Syndicate Bank Ltd. PR1+ 6.14Andhra Bank Ltd F1+(IND) 6.13Barclays Bank P1+ 4.92ICICI Bank Ltd. A1+ 2.47HDFC Bank Ltd. PR1+ 2.46Oriental Bank of Commerce P1+ 1.23
Steel Authority of India Ltd. PR1+ 19.67STCI Primary Dealer Ltd. A1+ 2.46Morgan Stanley (I) Capital Pvt Ltd F1+(IND) 2.46Sundaram Finance Ltd. A1+ 1.23Hindustan Petroleum Corporation Ltd. P1+ 1.23
SREI Equipment Finance Pvt Ltd PR1+ 4.95Alkem Laboratories Ltd. P1+ 2.47
91 Days TBill 26-02-2010 SOV 4.93
Grand Total 100.00
CBLO Total 1.45
Certificate Of Deposit Total 44.42
Commercial Paper Total 27.06
Non Convertible Debentures Total 7.42
Treasury Bills Total 4.93Fixed Deposits - Total 1.48Bills Re-Discounted - Total 13.28Net Current Asset -0.04
Fund features
Nature : Liquid FundAverage AUM : Rs. 2,298.21 CroreFund manager : Anupam JoshiInvestment objective : IDFC-CF is an open-ended liquid fund with an objective to generate optimal returns with high liquidity by investing in high quality money market and debt instruments. However there is no assurance that the investment objective of the scheme will be realized.Investment Style: The Scheme aims to invest in a highly quality money market instruments with high liquidity and seeks to generate accrual income with low volatility.Ideal investment horizon : 1 day or moreEntry load : NilExit load : NilOptions available : Growth, Dividend & Dividend Sweep (w.e.f. 16-Nov-2009)Minimum investment amount : Rs. 5,000 and in multiples of Re. 1 in Plan A (Regular Plan), Rs. 1 Crore and in multiples of Re. 1 in Plan B (Institutional Plan), Rs. 5 Crores and in multiples Re. 1 in Plan C (Super Institutional Plan).Additional investment amount : Re.1SIP (minimum amount) : NAInception date : 2 July 2001Statistical Measures : Standard deviation 0.11%Modified Duration 48.74 DaysDividend frequency : Daily, Weekly with compulsory re-investment, Periodic (in Plan B only) and Monthly (in Plan C only)Last 3 dividends :Date Nav Freq. Others I & HIDFC- CF Plan A31-Jan-10 10.5819 Daily 0.00079213 0.0007921330-Jan-10 10.5819 Daily 0.00079175 0.0007917529-Jan-10 10.5819 Daily 0.00078335 0.0007833529-Jan-10 10.0101 Weekly 0.0051 0.005122-Jan-10 10.0101 Weekly 0.0053 0.005315-Jan-10 10.0101 Weekly 0.0051 0.0051IDFC-CF Plan B31-Jan-10 10.5816 Daily 0.00081467 0.0008146730-Jan-10 10.5816 Daily 0.00081434 0.0008143429-Jan-10 10.5816 Daily 0.00080589 0.0008058915-Jan-10 10.0061 Weekly 0.0055 0.0055IDFC-CF Plan C31-Jan-10 10.0025 Daily 0.00084485 0.0008448530-Jan-10 10.0025 Daily 0.00084450 0.0008445029-Jan-10 10.0025 Daily 0.00083656 0.0008365621-Aug-09 10.0102 Weekly 0.0063 0.006314-Aug-09 10.0102 Weekly 0.0065 0.006531-Dec-09 10.0000 Monthly 0.0270 0.0270NAV (Rs.) :Plan A Growth 16.3194Plan A Dividend Daily 10.5819Plan A Dividend Weekly 10.0101Plan B Growth (IP ) 16.4364Plan B Dividend (IP ) Daily 10.5816Plan B Dividend (IP ) Weekly -Plan C Growth (SIP ) 11.1174Plan C Dividend (SIP ) Daily 10.0025Plan C Dividend (SIP) Monthly -Face Value (Rs. / unit): 10Fund manager's commentThe scheme is well positioned for a period of anticipated liquidity tightening enabling it to deliver returns while managing the flows.Benchmark : Crisil Liquid Fund Index (CLFI)
Asset Allocation
Fund performance IDFC-CF - Growth as of 29 January 2010
Data as of 29 January 2010
Past performance may or may not be sustained in future.
IDFC-CF - Growth CLFI
CAGR - Compounded Annualised Growth Rate
CAGR Last 1 Year
CAGR Last 2 Years
CAGR Since
Allotment
02/07/2001
CAGR Last 3 Years
(Annualised)30 Days
(Annualised)15 Days
(Annualised)7 Days
CAGR Last 5 Years
Past performance is no guarantee of future results.For Methodology of Ranking Please refer Page No. 32.
1
2
3
45
6
7
8
3.29% 3.39% 3.57%
4.44%
6.15% 6.18%5.94% 5.87%
3.40% 3.33%3.09%
4.29%
6.51%6.82%
6.25%

1 CBLO 6.51%
2 Net Current Asset -2.28%
3 Certificate Of Deposit 31.03%
4 Commercial Paper 64.74%
Portfolio as of 29 January 2010
% of Name Rating NAV
CBLO 6.51
Bank of India P1+ 18.12Andhra Bank Ltd F1+(IND) 12.91
Hindustan Petroleum Corporation Ltd. P1+ 25.92Steel Authority of India Ltd. PR1+ 25.88Sundaram Finance Limited P1+ 12.94
Grand Total 100.00
CBLO Total 6.51
Certificate Of Deposit Total 31.03
Commercial Paper Total 64.74Net Current Asset -2.28
IDFC Liquidity Manager(IDFC-LM)An Open - Ended Liquid Fund
Fund features
Nature : Liquid FundAverage AUM : Rs. 37.90 CroreFund manager : Anupam JoshiInvestment objective : Seek to provide high liquidity by investing in a portfolio of money market instruments and debt instruments. Whilst the scheme would endeavour to provide high liquidity to the investors, the surplus funds will be invested to deliver reasonable returns.
Investment Style: The Scheme aims to invest predominantly in the overnight money market so as to represent the returns of that part of the money market.Ideal investment horizon : 1 day or moreEntry load : NilExit load : Nil Options available : Minimum investment amount : Minimum of Rs. 5,000 and in multiples of Re. 1 thereafter.Additional investment amount : Re.1SIP (minimum amount) : Rs. 1,000Inception date : 17 January 2006Statistical Measures : Standard deviation 0.13%Modified Duration 0.13 YearsDividend frequency : Daily with compulsory re-investment, Weekly with compulsory re-investment and Monthly.Last 3 dividends :Date Nav Freq. Others I & H
30-Jan-10 10.0125 Daily 0.00082604 0.00029-Jan-10 10.0125 Daily 0.00082105 0.00029-Jan-10 10.0040 Weekly 0.0057 0.005722-Jan-10 10.0040 Weekly 0.0058 0.0058 15-Jan-10 10.0040 Weekly 0.0057 0.005729-Jan-10 10.0382 Monthly 0.0239 0.0239NAV (Rs.):Growth 12.5493Dividend Daily 10.0125Dividend Weekly 10.0040Dividend MonthlyFace Value (Rs. / unit): 10Fund manager's commentThe scheme is invested in overnight CBLO & upto 3 month CD's in line with its objectives.Benchmark : Crisil Liquid Fund Index (CLFI)
However there is no assurance that the investment objective of the scheme will be realized.
Growth, Dividend & Dividend Sweep (w.e.f. 16-Nov-2009)
31-Jan-10 10.0125 Daily 0.00082293 0.000822938260482105
10.0382
Data as of 29 January 2010
Asset Allocation
Fund performance IDFC-LM Growth as of 29 January 2010
Data as of 29 January 2010
Past performance may or may not be sustained in future.
IDFC-LM - Growth CLFI
CAGR - Compounded Annualised Growth Rate
CAGR Last 1 Year
CAGR Last 2 Years
CAGR Since
Allotment
17/01/2006
CAGR Last 3 Years
(Annualised)30 Days
(Annualised)15 Days
(Annualised)7 Days
18
12
34
7.47%6.82% 6.63%
3.83% 3.83%4.35%
5.47% 5.68% 5.79%
3.40% 3.33% 3.09%
4.29%
6.51%

1 Certificate Of Deposit 49.60%
2 Net Current Asset 5.23%
3 Commercial Paper 45.17%
Portfolio as of 29 January 2010
% of Name Rating NAV
Andhra Bank Ltd F1+(IND) 28.15Bank of India P1+ 15.80Bank of Maharashtra. A1+ 5.65
Steel Authority of India Ltd. PR1+ 28.22Hindustan Petroleum Corporation Ltd. P1+ 16.95
Grand Total 100.00
Certificate Of Deposit Total 49.60
Commercial Paper Total 45.17Net Current Asset 5.23
IDFC Liquid Fund(IDFC-LF)An Open - Ended Liquid Fund
Fund features
Nature : Liquid FundAverage AUM : Rs. 90.68 CroreFund manager : Anupam JoshiInvestment objective : Seek to provide high liquidity by investing in a portfolio of money market instruments and debt instruments. Whilst the scheme would endeavour to provide high liquidity to the investors, the surplus funds will be invested to deliver reasonable returns.
Investment Style: The Scheme aims to invest in a highly quality money market instruments with high liquidity and seeks to generate accrual Income with low volatility.Ideal investment horizon : 1 day or moreEntry load : NilExit load : NilOptions available : Minimum investment amount : Minimum of Rs. 5,000 and in multiples of Re. 1 in Plan A, Rs. 500 & in multiples of Re. 1 in Plan D.Additional investment amount : Re.1SIP (minimum amount) : Rs. 1,000 (Plan A)Inception date : 27 March 2006Statistical Measures : Standard deviation 0.13%Modified Duration 0.14 YearsDividend frequency : Daily & Weekly (with Compulsory re-investment) Monthly.Last 3 dividends :Date Nav Freq. Others I & H
30-Jan-10 1000.21 Daily 0.07796255 0.0779625529-Jan-10 1000.21 Daily 0.07780807 0.0778080729-Jan-10 1001.1827 Weekly 0.5448 0.544822-Jan-10 1001.1827 Weekly 0.5420 0.542015-Jan-10 1001.1827 Weekly 0.5351 0.535129-Jan-10 1003.4891 Monthly 2.2352 2.2352NAV (Rs.):Plan A Growth 1282.9102Plan A Dividend Daily 1000.2100Plan A Dividend Weekly 1001.1827Plan A Dividend Monthly 1003.4891Plan D Growth 10.2974Face Value (Rs. / unit): Plan A: 1000, Plan D: 10.Fund manager's commentThe scheme is invested in short maturity certificate of deposits in line with its objectives.Benchmark : Crisil Liquid Fund Index (CLFI)
However there is no assurance that the investment objective of the scheme will be realized.
Growth, Dividend & Dividend Sweep (w.e.f. 16-Nov-2009)
31-Jan-10 1000.21 Daily 0.07781907 0.07781907
Data as of 29 January 2010
Asset Allocation
Fund performance IDFC-LF Growth as of 29 January 2010
Data as of 29 January 2010
Past performance may or may not be sustained in future.
1
2
3
IDFC-LF - Growth CLFI
CAGR - Compounded Annualised Growth Rate
CAGR Last 1 Year
CAGR Last 2 Years
CAGR Since
Allotment
27/03/2006
CAGR Last 3 Years
(Annualised)30 Days
(Annualised)15 Days
(Annualised)7 Days
Past performance is no guarantee of future results.For Methodology of Ranking Please refer Page No. 32.
19
Morningstar Rating
Rating & Rankings3.64% 3.63%
7.02%
4.37%
5.90%6.56% 6.69%
3.40% 3.33% 3.09%
4.29%
6.51%6.82% 6.69%

IDFC Money Manager Fund - Treasury Plan(IDFC-MMF-TP)An Open - Ended Income Fund
20
Data as of 29 January 2010
Portfolio as of 29 January 2010
% of Name Rating NAVCBLO 2.61
State Bank of Hyderabad A1+ 5.43Punjab National Bank PR1+ 4.93Vijaya Bank PR1+ 4.42Allahabad Bank A1+ 3.86Bank of Maharashtra. A1+ 3.80Corporation Bank P1+ 3.80Canara Bank PR1+ 3.64Syndicate Bank Ltd. PR1+ 3.23Bank of India P1+ 2.82Central Bank of India PR1+ 2.80Punjab And Sind Bank A1+ 2.48Federal Bank Ltd. P1+ 2.36State Bank Of Travancore P1+ 2.30State Bank Of Patiala P1+ 2.30ICICI Bank Ltd. A1+ 2.25Oriental Bank of Commerce P1+ 2.10IDBI Bank Ltd P1+ 1.72Barclays Bank P1+ 1.67State Bank Of Bikaner & Jaipur P1+ 1.57Bank of Baroda A1+ 1.49Allahabad Bank P1+ 1.37IDBI Bank Ltd A1+ 1.32Yes Bank Ltd. A1+ 1.31United Bank Of India Ltd. A1+ 1.30State Bank Of Mysore A1+ 1.16State Bank Of Patiala A1+ 1.01Canara Bank A1+ 1.00ING Vysya Bank Ltd. P1+ 0.87HDFC Bank Ltd. P1+ 0.67Bank of Maharashtra. P1+ 0.67Citibank N.A. P1+ 0.67Jammu & Kashmir Bank Ltd. P1+ 0.66Central Bank of India P1+ 0.66Andhra Bank Ltd F1+(IND) 0.63Canara Bank P1+ 0.60UCO Bank P1+ 0.36Vijaya Bank P1+ 0.33Kotak Mahindra Bank Ltd. P1+ 0.33HDFC Bank Ltd. PR1+ 0.32Export Import Bank Of India AAA 0.16Standard Chartered Bank P1+ 0.07
Reliance Industries Ltd. P1+ 3.35Steel Authority of India Ltd. PR1+ 1.77Small Industries Dev Bank Of India PR1+ 1.01STCI Primary Dealer Ltd. A1+ 1.00Securities Trading Corp Ind Ltd A1+ 1.00Sterlite Industries Ltd. P1+ 0.99J M Financial Products Private Ltd. P1+ 0.67ONGC Videsh Ltd. P1+ 0.65Export Import Bank Of India P1+ 0.65Hindustan Petroleum Corporation Ltd. P1+ 0.50IDBI Home Finance Ltd. P1+ 0.40Kotak Mahindra Prime Ltd. P1+ 0.16Sundaram Finance Ltd. P1+ 0.16L&T Finance Ltd PR1+ 0.16Rural Electrification Corp Ltd PR1+ 0.16Indian Oil Corporation Ltd. P1+ 0.13IDBI Home Finance Ltd. A1+ 0.07Gujarat State Fertilizers & Chemicals Ltd. PR1+ 0.07LIC Housing Finance Ltd. P1+ 0.03
Indian Railway Finance Corpn. Ltd. AAA 0.91Housing Development Finance Cor Ltd AAA 0.69LIC Housing Finance Ltd. AAA 0.47Export Import Bank Of India AAA 0.34Union Bank of India AAA 0.27Axis Bank Ltd. LAAA 0.27ICICI Bank Ltd. LAAA 0.10
Infrastructure Development Finance Company Ltd. LAAA 1.02Export Import Bank Of India AAA 0.91Sundaram Finance Ltd. LAA+ 0.38National Housing Bank AAA 0.34National Bank for Agri. & Rural Dev AAA 0.31Housing Development Finance Cor Ltd AAA 0.27Power Finance Corporation Ltd. AAA 0.17Rural Electrification Corp Ltd AAA 0.15LIC Housing Finance Ltd. AAA 0.13IDBI Bank Ltd AA+ 0.03Power Grid Corporation Ltd. AAA 0.02Union Bank of India AAA 0.02Tata Motors Ltd. AAA 0.02Kotak Mahindra Prime Ltd. LAA 0.01Indian Railway Finance Corpn. Ltd. AAA 0.01Tata Sons Ltd. AAA 0.00
India Comml loan Trust Sr VI 2009 F1+(IND)(SO) 0.34Corporate Debt Trust 2009-10 Sr 2 A1+(SO) 0.33Loan Sec Trust Icici Bank Ser Xvi AAA(SO) 0.06
Nova IV Trust AAA(IND)(SO) 0.33
Infrastructure Development Finance Company Ltd. AAA 0.07Sundaram Finance Ltd. LAA+ 0.03
364 Days Tbill MD 25-03-2010 SOV 0.9091 Days Tbil MD 05-03-2010 SOV 0.3791 Days TBill MD 26-02-2010 SOV 0.17182 Days Tbill MD 05-03-2010 SOV 0.10
11.00% GOI 2010 MP 22-03-2010 SOV 0.1911.00% GOI 2010 UP 22-03-2010 SOV 0.1711.00% GOI 2010 Punjab 22-03-2010 SOV 0.06
Grand Total 100.00
CBLO Total 2.61
Certificate Of Deposit Total 74.42
Commercial Paper Total 12.93
Floating Rate Note Total 3.04
Non Convertible Debentures Total 3.77
Pass Through Certificates Total 0.73
Pass Through Certificates (ZCB) Total 0.33
Zero Coupon Bonds Total 0.11
Treasury Bills. Total 1.54
Government Securities Total 0.43Net Current Asset 0.09
Fund features
Nature : Debt FundAverage AUM : Rs. 13,973.32 CroreFund manager : Anupam JoshiInvestment objective : Seek to generate stable returns with a low risk strategy by creating a portfolio that is substantially invested in good quality floating rate debt or money market instruments, fixed rate debt or money market instruments swapped for floating returns and fixed rate debt and money market instruments. However there is no assurance that the investment objective of the scheme will be realized.Investment Style: The Scheme aims to invest only in highly rated money market instruments including floating rate instruments with short term benchmarks. The Scheme seeks to generate returns predominantly through accrual income.Ideal investment horizon : 1 day or moreEntry load : NilExit load : IDFC-MMF - TP : Plan A, Plan B, Plan C, Plan D & Plan E : Nil. Options available : Growth, Dividend & Dividend Sweep Minimum investment amount : Rs. 5,000 and in multiples of Re. 1 in Plan A (Regular Plan), Rs. 1 Crore and in multiples of Re. 1 in Plan B (Institutional Plan), Rs. 5 Crores and in multiples Re. 1 in Plan C (Super Institutional Plan), Rs. 25,000 and in multiples Re. 1 in Plan D, Rs. 5,000 and in multiples of Re. 1 in Plan E.Additional investment amount : Re.1SIP (minimum amount) : Rs. 1,000 (Plan A)Inception date : 18 Feb 2003Statistical Measures : Standard deviation 0.11%Modified Duration 106.83 DaysDividend frequency : Monthly & Daily / Weekly with compulsory reinvestmentLast 3 dividends :Date Nav Freq. Others I & HIDFC- MMF -TP Plan A29-Jan-10 10.0699 Daily 0.00089705 0.0009638228-Jan-10 10.0699 Daily 0.00090652 0.0009740027-Jan-10 10.0699 Daily 0.00181885 0.0019542329-Jan-10 10.0079 Weekly 0.0063 0.006722-Jan-10 10.0079 Weekly 0.0063 0.006715-Jan-10 10.0079 Weekly 0.0064 0.006929-Jan-10 10.0438 Monthly 0.0267 0.0286IDFC-MMF -TP Plan B29-Jan-10 10.0703 Daily 0.00099128 0.0010650628-Jan-10 10.0703 Daily 0.00100791 0.0010829327-Jan-10 10.0703 Daily 0.00202142 0.0021718829-Jan-10 10.0133 Weekly 0.0071 0.007622-Jan-10 10.0133 Weekly 0.0068 0.007415-Jan-10 10.0133 Weekly 0.0072 0.007729-Jan-10 10.0433 Monthly 0.0296 0.0318IDFC-MMF -TP Plan C29-Jan-10 10.0015 Daily 0.00099637 0.0010705428-Jan-10 10.0015 Daily 0.00101272 0.0010881027-Jan-10 10.0015 Daily 0.00203118 0.0021823729-Jan-10 10.0070 Weekly 0.0072 0.007722-Jan-10 10.0070 Weekly 0.0069 0.007415-Jan-10 10.0070 Weekly 0.0073 0.007812-Jan-10 10.0000 Regular 0.0373 0.0400IDFC-MMF -TP Plan D29-Jan-10 10.0007 Daily 0.00069417 0.0007457728-Jan-10 10.0007 Daily 0.00071042 0.0007633327-Jan-10 10.0007 Daily 0.00142642 0.00153271NAV (Rs.) :Plan A Growth 14.7230Plan A Dividend Monthly 10.0438Plan A Dividend Daily 10.0699Plan A Dividend Weekly 10.0079Plan B Growth 14.6149Plan B Dividend Daily 10.0703Plan B Dividend Weekly 10.0133Plan B Dividend Monthly 10.0433Plan C Dividend Daily 10.0015Plan C Growth 10.8337Plan C Dividend Weekly 10.0070Plan C Dividend Regular -Plan D Growth 10.2599Plan D Dividend Daily 10.0007Face Value (Rs. / unit): 10Fund manager's commentThe scheme is invested in short maturity liquid instruments in line with its objectives to deliver marginally higher returns over cash fund.Benchmark : NSE MIBOR INDEX
Asset Allocation
Fund performance IDFC-MMF-TP Growth as of 29 January 2010
Data as of 29 January 2010
Past performance may or may not be sustained in future.
1 CBLO 2.61%2 Certificate Of Deposit 74.42%3 Commercial Paper 12.93%4 Floating Rate Note 3.04%5 Non Convertible Debentures 3.77%6 Pass Through Certificates 0.73%7 Pass Through Certificates (ZCB) 0.33%8 Zero Coupon Bonds 0.11%9 Treasury Bills 1.54%10 Government Securities 0.43%11 Net Current Asset 0.09%
18/02/2003IDFC-MMF-TP - Growth NSE MIBOR
CAGR - Compounded Annualised Growth Rate
For Methodology of Ranking Please refer Page No. 32.
CAGR Last 1 Year
CAGR Last 2 Years
CAGR Since
Allotment
CAGR Last 3 Years
(Annualised)30 Days
(Annualised)15 Days
(Annualised)7 Days
CAGR Last 5 Years
1
2
3
45 67
891011
5.72%6.05%
6.27%6.39%
4.98%
4.14%4.02%4.04%
5.76%6.08%6.02%5.77%
3.54%3.33%3.32%3.30%

12
3
Portfolio as of 29 January 2010
% of Name Rating NAV
CBLO 0.32
Oriental Bank of Commerce P1+ 17.96Andhra Bank Ltd F1+(IND) 15.74Punjab National Bank PR1+ 12.07State Bank Of Patiala A1+ 10.87State Bank Of Patiala P1+ 6.00Union Bank of India P1+ 5.96State Bank Of Travancore P1+ 5.17UCO Bank P1+ 4.28Federal Bank Ltd. P1+ 3.47Corporation Bank P1+ 2.59Vijaya Bank PR1+ 2.56State Bank Of Bikaner & Jaipur P1+ 1.74State Bank Of Mysore A1+ 1.73Canara Bank PR1+ 1.73Jammu & Kashmir Bank Limited P1+ 1.72Dena Bank F1+(IND) 1.70PUNJAB AND SIND BANK A1+ 1.70ICICI Bank Ltd. A1+ 1.54Export Import Bank Of India AAA 0.86
Grand Total 100.00
CBLO Total 0.32
Certificate Of Deposit Total 99.42Net Current Asset 0.27
IDFC Money Manager Fund - Investment Plan(IDFC-MMF-IP)An Open - Ended Income Fund
Fund features
Nature : DebtAverage AUM : Rs. 2,634.94 CroreFund Manager : Anupam Joshi Investment objective : Seek to generate stable returns with a low risk strategy by creating a portfolio that is substantially invested in good quality floating rate debt or money market instruments, fixed rate debt or money market instruments swapped for floating returns and fixed rate debt and money market instruments. However there is no assurance that the investment objective of the scheme will be realized.Investment Style : The Scheme aims to invest in highly rated money market instruments including floating rate instruments with short term benchmarks. The Scheme seeks to generate returns predominantly through accrual income.Ideal investment horizon : 1 day or moreEntry Load : NilExit Load : Plan A, Plan B & Plan C: Exit Load for all investment including SIP/Micro SIP/STP shall be 1.00% of the applicable NAV if redeemed / switched out within 90 days from the date of allotment. Options available : Growth, Dividend & Dividend Sweep Minimum investment amount : Rs. 5000 and in multiples of Re.1 in plan A (Regular Plan), Rs. 1 Crore and in multiplies of Re.1 in plan B (institutional Plan), Rs. 5000 and in multiples of Re.1 in plan C.Additional investment amount : Re.1SIP (minimum amount) : Rs. 1000 (Plan A)Inception Date : 9 August 2004Statistical Measures : Standard deviation 0.12%Modified Duration 259.66 DaysDividend frequency : Days, weekly (with reinvest facility in both plan A & plan B), Monthly, Quarterly & Annual. Last 3 Dividends :Date Nav freq. Others I & HIDFC-MMF-IP Plan A29-Jan-10 10.0150 Daily 0.00107976 0.0011601128-Jan-10 10.0150 Daily 0.00107638 0.0011565327-Jan-10 10.0150 Daily 0.00215596 0.0023163929-Jan-10 10.0130 Weekly 0.0076 0.008122-Jan-10 10.0130 Weekly 0.0075 0.008115-Jan-10 10.0130 Weekly 0.0076 0.008129 Jan-10 10.0434 Monthly 0.0313 0.033629-Sep-09 10.1735 Quarterly 0.0848 0.091131-Dec-09 10.1909 Quarterly 0.0867 0.093130-Mar-09 10.5505 Annual 0.4158 0.4467IDFC-MMF-IP Plan B29-Jan-10 10.0150 Daily 0.00115107 0.0012367228-Jan-10 10.0150 Daily 0.00114411 0.0012292427-Jan-10 10.0150 Daily 0.00229004 0.0024604729-Jan-10 10.0138 Weekly 0.0081 0.008722-Jan-10 10.0138 Weekly 0.0080 0.008615-Jan-10 10.0138 Weekly 0.0080 0.0086NAV (Rs.) :Plan A Growth 13.9564Plan A Dividend Quarterly 10.2300Plan A Dividend Annual 10.9836Plan A Dividend Monthly 10.0434Plan A Dividend Daily 10.0150Plan A Dividend Weekly 10.0130Plan B Growth 14.2068Plan B Dividend Weekly 10.0138Plan B Dividend Daily 10.0150Face Value (Rs. / unit) : 10Fund Manager's comment The scheme is invested in longer maturity certificate of deposits to deliver marginally higher returns over liquid plus funds in line with its objectivesBenchmark : NSE MIBOR INDEX
Data as of 29 January 2010
Asset Allocation
Fund performance IDFC-MMF-IP Growth as of 29 January 2010
Data as of 29 January 2010
Past performance may or may not be sustained in future.
CAGR Last 1 Year
CAGR Last 2 Years
CAGR Last 3 Years
CAGR Since Allotment
09/08/2004IDFC-MMF-IP - Growth NSE MIBOR
CAGR - Compounded Annualised Growth Rate
Past performance is no guarantee of future results.For Methodology of Ranking Please refer Page No. 32.
21
CAGR Last 5 Years
(Annualised)7 Days
(Annualised)15 Days
(Annualised)30 Days
1 CBLO 0.32%
2 Net Current Asset 0.27%
3 Certificate Of Deposit 99.42%
4.82% 4.84% 4.83%5.31%
6.59%7.05%
6.38% 6.28%
3.30% 3.32% 3.33% 3.54%
5.77% 6.02% 6.08% 5.99%

1
2
3
IDFC Government Securities Fund - Investment Plan(IDFC-GSF-IP)An Open Ended - Dedicated Gilt Fund Data as of 29 January 2010
22
Portfolio as of 29 January 2010
% of Name Rating NAV
CBLO 37.03
6.35% GOI MD 02-01-2020 SOV 40.827.02% GOI MD 17-08-2016 SOV 26.24
Grand Total 100.00
CBLO Total 37.03
Govt Securities(GSE) Total 67.06Net Current Asset -4.09
Fund features
Nature : DebtAverage AUM : Rs.23.24 CroreFund Manager : Arjun Parthasarthy Investment objective : IDFC – GSF -IP is an open-ended dedicated gilt scheme with an objective to generate optimal returns with high liquidity by investing Government Securities. However there is no assurance that the investment objective of the scheme will be realized.Investment Style : The Scheme proposes to invest only in government securities with the aim of generating stable medium-term returns.Ideal investment horizon : 1 year or more Entry Load : NilExit Load : IDFC-GSF - IP : Plan A & Plan B : 1.00% of NAV on investors who purchase/switch in and seek to redeem/switch out such units within 365 days from the date of effecting such purchase/switch in. Investors opting for PEP / Dividend reinvestment option / SWP or switch between options will not be levied an exit load. (w.e.f. August 24, 2009)Options available : Growth, Dividend & Dividend Sweep (w.e.f. 16-Nov-2009)Minimum investment amount : Rs. 5000 and in multiples of Re. 1 in Plan A (Regular Plan), Rs. 25 Lakh and in multiples of Re. 1 in Plan B (Institutional Plan). (w.e.f. July 6, 2009)Additional investment amount : Re. 1SIP (minimum amount) : Rs. 1000 (Plan A)Inception Date : 9 March 2002Statistical Measures : Standard deviation 2.18%Modified Duration 4.20 YearsDividend frequency : Quarterly / Half yearly / Yearly. Last 3 Dividends :Date NAV Freq. Others I & HIDFC-GSF-IP Plan A29-Sep-09 10.7372 Half Yearly 0.3769 0.404930-Jun-09 10.5064 Quarterly 0.3098 0.332930-Mar-09 10.4055 Quarterly 0.3098 0.332908-Dec-08 11.1693 Quarterly 0.6522 0.700830-Mar-09 10.7886 Half Yearly 0.6196 0.665730-Mar-09 11.0733 Annual 0.8479 0.911030-Sep-08 10.4494 Half Yearly 0.3261 0.350424-Mar-08 10.7722 Annual 0.4076 0.4380IDFC-GSF-IP Plan B30-Jun-09 10.1637 0.0815 0.0876NAV (Rs.) :Plan A Growth 17.3884Plan A Dividend Quarterly 10.4283Plan A Dividend Half Yearly 10.7409Plan A Dividend Annual 11.4988Plan B Growth 10.1213Plan B Dividend 10.1175Face Value (Rs. / unit) : 10Benchmark : ISEC Composite INDEXFund manager's commentThe funds are positioned in the segment of the yield curve where returns will be optimum.
Asset Allocation
Fund performance IDFC-GSF-IP Growth as of 29 January 2010
Data as of 29 January 2010
Past performance may or may not be sustained in future.
1 Govt Securities (GSE) 67.06%
2 Net Current Asset -4.09%
3 CBLO 37.03%
CAGR Last 1 Year
CAGR Last 2 Years
CAGR Last 3 Years
CAGR Last 5 Years
CAGR Since Allotment
09/03/2002IDFC-GSF-IP - Growth ISCI
CAGR - Compounded Annualised Growth Rate
7.63% 8.04%
-1.62%
7.31% 7.26%
1.06%
7.84%8.54%
7.38%

1 CBLO 36.07%
2 Net Current Asset -0.28%
3 TREASURY BILLS 64.21%
Portfolio as of 29 January 2010
% of Name Rating NAV
CBLO 36.07
91 Days TBIL MD 05-03-2010 SOV 64.21
Grand Total 100.00
CBLO TOTAL 36.07
Treasury Bills Total 64.21
Net Current Asset -0.28
IDFC Government Securities Fund - Short Term Plan(IDFC-GSF-ST)An Open Ended - Dedicated Gilt Fund
Fund features
Nature : DebtAverage AUM : Rs. 7.82 CroreFund Manager : Arjun Parthasarthy Investment objective : IDFC – GSF-ST is an open-ended dedicated gilt scheme with an objective to generate optimal returns with high liquidity by investing Government Securities.
Investment Style : The Scheme proposes to invest only in government securities with the aim of generating stable medium-term returns.Ideal investment horizon : 1 day or more Entry Load : NilExit Load : IDFC-GSF - ST Plan A & Plan B: 0.25% of NAV on investors who purchase / switch in and seek to redeem / switch out such units within 30 days from the date of effecting such purchase / switch in. Investors opting for PEP/Dividend reinvestment option / SWP or switch between options will not be levied an exit load. (w.e.f. August 24, 2009)Options available : Minimum investment amount : Rs. 5000 and in multiples of Re. 1 in Plan A (Regular Plan), Rs. 25 Lakh and in multiples of Re. 1 in Plan B (Institutional Plan) (w.e.f. July 6, 2009)Additional investment amount : Re. 1SIP (minimum amount) : Rs. 1000 (Plan A)Inception Date : 9 March 2002Statistical Measures : Standard deviation 0.89%Modified Duration 0.06 YearsDividend frequency : Quarterly /Monthly Last 3 Dividends :Date NAV Freq. Others I & HIDFC-GSF-ST Plan A
29-Jan-10 10.0164 Monthly 0.0135 0.0145
29-Sep-09 10.0384 Quarterly 0.0280 0.0301IDFC-GSF-ST Plan B
31-Jul-09 10.0086 Weekly 0.0025 0.0027
NAV (Rs.) :Plan A Growth 13.7347Plan A Dividend Monthly 10.0164Plan A Dividend Quarterly 10.0622
Face Value (Rs. / unit) : 10Fund manager’s comment : The fund has a good mix of short dated treasury bills and overnight money markets to reduce volatility. Benchmark : ISEC Composite INDEX
However there is no assurance that the investment objective of the scheme will be realized.
Growth, Dividend & Dividend Sweep (w.e.f. 16-Nov-2009)
07-Aug-09 10.0084 Weekly 0.0022 0.002431-Jul-09 10.0084 Weekly 0.0025 0.002724-Jul-09 10.0084 Weekly 0.0014 0.0015
31-Dec-09 10.0456 Quarterly 0.0173 0.0186
21-Aug-09 10.0086 Weekly 0.0023 0.002514-Aug-09 10.0086 Weekly 0.0017 0.0018
31-Dec-09 10.0619 Quarterly 0.0174 0.018729-Sep-09 10.0547 Quarterly 0.0281 0.0302
Plan B Growth 10.0836Plan B Dividend Quarterly 10.0785
Data as of 29 January 2010
Asset Allocation
Fund performance IDFC-GSF-ST Growth as of 29 January 2010
Data as of 29 January 2010
Past performance may or may not be sustained in future.
CAGR Last 1 Year
CAGR Last 2 Years
CAGR Last 3 Years
CAGR Last 5 Years
CAGR Since Allotment
09/03/2002IDFC-GSF-ST - Growth ISCI
CAGR - Compounded Annualised Growth Rate
23
1
2
3
2.05%1.78%
3.17% 3.50%4.10%
1.06%
7.84%8.54%
7.38%

1 CBLO 81.29%
2 Net Current Asset 18.71%
Portfolio as of 29 January 2010
% of Name Rating NAV
CBLO 81.29
Grand Total 100.00
CBLO Total 81.29Net Current Asset 18.71
IDFC Government Securities Fund - Provident Fund Plan(IDFC-GSF-PF)An Open Ended - Dedicated Gilt Fund
Fund features
Nature : DebtAverage AUM : Rs. 24.32 CroreFund Manager : Arjun Parthasarthy Investment objective : Seek to generate optimal returns with high liquidity by investing in Government Securities.
Investment Style : The Scheme propose to invest only in government securities with the aim of generating stable medium-term returns.Ideal investment horizon : 1 year or moreEntry Load : NilExit Load : IDFC- GSF- PF Plan A & Plan B : Exit load of 1.00% of NAV shall be applicable in case of investors who redeem / switch out such investments within 365 days such from the date of effecting such purchase / switch. Investors opting for PEP / Dividend reinvestment option / SWP or switch between options within the plan will not be levied an exit load.Options available : Minimum investment amount : Rs. 5000 and in multiples of Re. 1 in plan A (Regular Plan), Rs. 25,00,000 and in multiplies of Re.1 in plan B (institutional Plan).(w.e.f. July 6, 2009)Additional investment amount : Re. 1SIP (minimum amount) : Rs. 1000(Plan A)Inception Date : 29 March 2004Statistical Measures : Standard deviation 2.39%Modified Duration -Dividend frequency : Quarterly / Yearly Last 3 Dividends :Date NAV Freq. Others I & HIDFC-GSF-PF Plan A30-Jun-09 10.6523 Quarterly 0.3995 0.4292
IDFC-GSF-PF Plan B31-Dec-09 10.677429-Sep-09 10.6726 Quarterly 0.0004 0.0004NAV (Rs.) :Plan A Growth 14.6225Plan A Dividend Quarterly 10.6264Plan A Dividend Annual 11.5282Plan B Growth 14.7295Plan B Dividend Quarterly 10.6769Face Value (Rs. / unit) : 10Fund Manager's comment :The funds are positioned in the segment of the yield curve where returns will be optimum.Benchmark : ISEC Composite Index
However there is no assurance that the investment objective of the scheme will be realized.
Growth, Dividend & Dividend Sweep (w.e.f. 16-Nov-2009)
30-Mar-09 10.8942 Annual 0.7174 0.7708
Quarterly 0.0049 0.0053
Data as of 29 January 2010
Asset Allocation
Fund performance IDFC-GSF-PF Growth as of 29 January 2010
Data as of 29 January 2010
Past performance may or may not be sustained in future.
CAGR Last 1 Year
CAGR Last 2 Years
CAGR Last 3 Years
CAGR Since Allotment
29/03/2004IDFC-GSF-PF - Growth ISCI
CAGR - Compounded Annualised Growth Rate
CAGR Last 5 Years
24
1
2
Morningstar Rating
Rating & Rankings
Past performance is no guarantee of future results.For Methodology of Ranking Please refer Page No. 32.
-0.73%
9.29% 9.44%8.33%
6.72%
1.06%
7.84%8.54%
7.38%5.96%

IDFC All Seasons Bond Fund(IDFC-ASBF)An Open - Ended Fund of Funds Scheme Data as of 29 January 2010
25
Portfolio as of 29 January 2010
% of Name Rating NAV
IDFC - SSIF - Short Term - Growth 36.85
IDFC-Money Manager Fund-Investment Plan-Inst Plan B-Growth 32.09
IDFC - SSIF - Medium Term - Growth Option 21.87
IDFC - SSIF - Investment Plan - Growth Option 6.59
Grand Total 100.00
Mutual Fund Units Total 97.41
Net Current Asset 2.59
Fund features
Nature : DebtFund Size : Rs. 11.74 CroreFund Manager : Arjun Parthasarthy Investment objective : Seek to generate optimal returns with high liquidity by active management of the portfolio, by investing predominantly in debt oriented mutual fund schemes and money market instruments. However there is no assurance that the investment objective of the scheme will be realized.Investment Style : The Scheme aims to actively manage the interest rate environment by allocating funds to various fixed income schemes based on the interest rate outlook.Ideal investment horizon : 1 year or moreEntry Load : NilExit Load : IDFC-ASBF - Plan A : 0.75% of NAV on investors who purchase/switch in and seek to redeem/switch out such units within 365 days from the date of effecting such purchase/switch in Plan A. Investors opting for PEP / Dividend reinvestment option / SWP or switch between options will not be levied an exit load. (w.e.f. August 24, 2009)Options available : Growth, Dividend & Dividend Sweep (w.e.f. 16-Nov-2009)Minimum investment amount : Rs. 5,000 and in multiples of Re. 1 in plan A (Regular Plan).Additional investment amount : Re. 1SIP (minimum amount) : Rs. 1000Inception Date : 13 September 2004Statistical Measures : Standard deviation 1.90%Dividend frequency : Quarterly, Half Yearly & AnnualLast 3 Dividends :Date Nav Freq. Others I & HIDFC-ASBF Plan A29-Sep-09 10.8681 Half Yearly 0.3930 0.422330-Jun-09 10.9623 Quarterly 0.2446 0.262830-Mar-09 10.7592 Quarterly 0.2446 0.262831-Dec-08 12.1828 Quarterly 0.0815 0.087630-Mar-09 10.8909 Half Yearly 0.3424 0.367930-Sep-08 10.4756 Half Yearly 0.2038 0.219030-Mar-09 10.9681 Annual 0.4076 0.4380Nav (Rs.) :Plan A Growth 14.6084Plan A Dividend Quarterly 11.0094Plan A Dividend Half Yearly 10.9628Plan A Dividend Annual 11.5303Face Value (Rs. / unit) : 10Fund Manager's comment The fund is invested in across duration products to maximize accrual and minimize impact of interest rate movements.Benchmark : Crisil Composite Bond Fund Index (CCBFI)
Asset Allocation
Fund performance under the IDFC-ASBF-Growth as of 29 January 2010
Data as of 29 January 2010
Past performance may or may not be sustained in future.
1 Mutual Fund Units 97.42%
2 Net Current Asset -0.63%
3 CBLO 3.21%
CAGR Last 1 Year
CAGR Last 2 Years
CAGR Last 3 Years
CAGR Since Allotment
13/09/2004IDFC-ASBF - Growth CCBFI
CAGR - Compounded Annualised Growth Rate
CAGR Last 5 Years
Rating & Rankings
Past performance is no guarantee of future results.For Methodology of Ranking Please refer Page No. 32.
Morningstar Rating
1
2
0.54%
8.80% 8.84%
7.54% 7.30%
4.70%
6.00%6.60%
5.67% 5.49%

IDFC Fixed Maturity Plan(IDFC-FMP)A Close - Ended Income Fund
IDFC-FMP - 9 (Allotment Date 28 Feb 2005) Average AUM Rs. 21.82 Crores I Date of Maturity 07 Apr 2010
Data as of 31 January 2010
Portfolio as of 31 January 2010 Portfolio Contd...
NAV as on 27 January 2010
PLAN (Rs./Unit*)Plan A - Growth 13.7045Plan A - Dividend 11.5506* Face value per unit = Rs 10/-
Sr. Name of Market Value % to Net AssetNo. Instrument (In Rs. Lakh) of the scheme
A Bonds & Debentures of :
B Securitised Debt Instruments
C Money Market Instruments
(I) Private Corporate Bodies - - (II) PSUs 199.97 9.14 (III) Banks/FI (including NBFC) 1,250.61 57.19 (IV) Others - -
Sub Total 1,450.58 66.33
(V) Single Loan - - (VI) Pool - -
Sub Total - -
(VII) CPs - - (VIII) CDs 593.65 27.15 (IX) T Bills - - (X) CBLOs/Repos - - (XI) Bills Rediscounting/BRDS - -
(XII) Others - - Sub Total 593.65 27.15
Net Assets 2,186.75 100.00
D Government Securities - - E Fixed Deposits - - F Cash and Net Current Assets 142.53 6.52 G Others (Pls specify) - -
Sr. Name of Market Value % to Net AssetNo. Instrument (In Rs. Lakh) of the scheme
(V)
(VI)
AnnexureA) Bonds & Debentures
Category of Issuer Name of the Issuer Market Value (in Rating % to Net Assets of Rs.lakh) the Scheme
Total - -
Indian Railway Finance Corpn. Ltd. 199.97 AAA 9.14Total 199.97 9.14
ICICI Bank Ltd 500.78 AAA 22.90HDFC Ltd 499.93 AAA 22.86Union Bank of India 249.90 AAA 11.43Total 1,250.61 57.19
Total - -
(I) Private Corporate Bodies
(II) PSUs
(III) Banks/FI (including NBFC)
(IV) Others
B) Securitised Debt InstrumentsSingle Loan
Obligor Originator Trust Details Name of Guarantor / Level of Guarantee Market Value RatingDetails of Underlying Security (as % of Loan) (in Rs. Lakh)
Total Pool
Originator Seller Trust Details Type of Pool Credit enhancement Market Value Rating(as % of Loan) (in Rs. Lakh)
Total
D) Government Securities
Details of Market Value % to Securities (in Rs. Lakh) of the Scheme
Net Assets
Total Total
E) Fixed Deposits
Bank Name Amount % to of the Scheme
(in Rs. Lakh) Net Assets
C) Money Market InstrumentsName of Market Value Rating % to
the Schemethe Issuer (in Rs. Lakh) Net Assets of
Total - -
495.32 A1+ 22.6598.33 A1+ 4.50
Total 593.65 27.15
Total - -
Total - -
Total - -
Total - -
(VII) CPs
(VIII) CDs
(IX) T Bills
(X) CBLOs/Repos
(XI) Bills Rediscounting/BRDS
(XII) Others
Union Bank of India Ltd.State Bank Of Patiala
26

IDFC Fixed Maturity Plan(IDFC-FMP)A Close - Ended Income Fund
IDFC - FMP - NMS - 1 (Allotment Date 14 Oct 2008) Average AUM Rs. 21.53 Crores I Date of Maturity 06 May 2010
Portfolio as of 010 31 January 2 Portfolio Contd...
NAV as on 27 January 2010
PLAN (Rs./Unit*)Plan A - Growth 11.6221Plan A - Dividend 11.6219Plan B - Growth -Plan B - Dividend -* Face value per unit = Rs 10/-
Sr. Name of Market Value % to Net AssetNo. Instrument (In Rs. Lakh) of the scheme
A Bonds & Debentures of :
B Securitised Debt Instruments
C Money Market Instruments
(I) Private Corporate Bodies 206.28 9.56 (II) PSUs 734.27 34.04 (III) Banks/FI (including NBFC) 507.96 23.55 (IV) Others - -
Sub Total 1,448.50 67.15
(V) Single Loan - - (VI) Pool - -
Sub Total - -
(VII) CPs 482.91 22.39 (VIII) CDs 29.50 1.37 (IX) T Bills - - (X) CBLOs/Repos 115.46 5.35 (XI) Bills Rediscounting/BRDS - -
(XII) Others - - Sub Total 627.86 29.11
Net Assets 2,157.14 100.00
D Government Securities - - E Fixed Deposits - - F Cash and Net Current Assets 80.77 3.74 G Others (Pls specify) - -
Sr. Name of Market Value % to Net AssetNo. Instrument (In Rs. Lakh) of the scheme
(V)
(VI)
AnnexureA) Bonds & Debentures
Category of Issuer Name of the Issuer Market Value (in Rating % to Net Assets of Rs.lakh) the Scheme
B) Securitised Debt InstrumentsSingle Loan
Obligor Originator Trust Details Name of Guarantor / Level of Guarantee Market Value RatingDetails of Underlying Security (as % of Loan) (in Rs. Lakh)
Total Pool
Originator Seller Trust Details Type of Pool Credit enhancement Market Value Rating(as % of Loan) (in Rs. Lakh)
Total
C) Money Market Instruments
Indian Oil Corporation Ltd. 482.91 P1+ 22.39Total 482.91 22.39
State Bank Of Patiala 29.50 A1+ 1.37Total 29.50 1.37
Total - -
CBLOs/Repos 115.46 5.35Total 115.46 5.35
Total - -
Total - -
(VII) CPs
(VIII) CDs
(IX) T Bills
(X) CBLOs/Repos
(XI) Bills Rediscounting/BRDS
(XII) Others
D) Government SecuritiesDetails of Market Value % to Securities (in Rs. Lakh) of the Scheme
Net Assets
Total Total
E) Fixed DepositsBank Name Amount % to
of the Scheme(in Rs. Lakh) Net Assets
Tata Sons Ltd. 206.28 AAA 9.56Total 206.28 9.56
Rural Electrification Corp Ltd 284.32 AAA 13.18Power Grid Corporation Ltd. 249.98 AAA 11.59Indian Railway Finance Corpn. Ltd. 199.97 AAA 9.27Total 734.27 34.04
LIC Housing Finance Ltd. 253.51 AAA 11.75Total 507.96 23.55
Total - -
(I) Private Corporate Bodies
(II) PSUs
(III) Banks/FI (including NBFC)
(IV) Others
Housing Development Finance Cor Ltd 254.44 AAA 11.80
Name of Market Value Rating % to the Scheme
the Issuer (in Rs. Lakh) Net Assets of
27
Data as of 31January 2010

IDFC Fixed Maturity Plan(IDFC-FMP)A Close - Ended Income Fund
IDFC-FMP - FMS-3 (Allotment Date 23 Sep 2009) Average AUM Rs. 1.41 Crores I Date of Maturity 27 Dec 2010
Data as of 31January 2010
28
Portfolio as of 31 January 2010 Portfolio Contd...
NAV as on 29 January 2010
PLAN (Rs./Unit*)Plan A - Growth 10.1696Plan A - Dividend 10.1696* Face value per unit = Rs 10/-
Sr. Name of Market Value % to Net AssetNo. Instrument (In Rs. Lakh) of the scheme
A Bonds & Debentures of :
B Securitised Debt Instruments
C Money Market Instruments
(I) Private Corporate Bodies - - (II) PSUs - - (III) Banks/FI (including NBFC) 10.14 7.20 (IV) Others - -
Sub Total 10.14 7.20
(V) Single Loan - - (VI) Pool - -
Sub Total - -
(VII) CPs - - (VIII) CDs 39.46 28.04 (IX) T Bills - - (X) CBLOs/Repos 90.01 63.95 (XI) Bills Rediscounting/BRDS - -
(XII) Others - - Sub Total 129.48 91.98
Net Assets 140.76 100.00
D Government Securities - - E Fixed Deposits - - F Cash and Net Current Assets 1.15 0.81 G Others (Pls specify) - -
Sr. Name of Market Value % to Net AssetNo. Instrument (In Rs. Lakh) of the scheme
AnnexureA) Bonds & Debentures
Category of Issuer Name of the Issuer Market Value (in Rating % to Net Assets of Rs.lakh) the Scheme
Total - -
Total - -
LIC Housing Finance Ltd. 10.14 AAA 7.20Total 10.14 7.20
Total - -
(I) Private Corporate Bodies
(II) PSUs
(III) Banks/FI (including NBFC)
(IV) Others
B) Securitised Debt InstrumentsSingle LoanObligor Originator Trust Details Name of Guarantor / Level of Guarantee Market Value Rating
Details of Underlying Security (as % of Loan) (in Rs. Lakh)
PoolOriginator Seller Trust Details Type of Pool Credit enhancement Market Value Rating
(as % of Loan) (in Rs. Lakh)
Total
C) Money Market InstrumentsName of Market Value Rating % to
the Schemethe Issuer (in Rs. Lakh) Net Assets of
Total - -
ICICI Bank Ltd 39.46 A1+ 28.04Total 39.46 28.04
Total - -
CBLO/Repo 90.01 63.95
Total - -
Total - -
(VII) CPs
(VIII) CDs
(IX) T Bills
(X) CBLOs/Repos
(XI) Bills Rediscounting/BRDS
(XII) Others
Total 90.01 63.95
D) Government SecuritiesDetails of Market Value % to Securities (in Rs. Lakh) of the Scheme
Net Assets
Total Total
E) Fixed DepositsBank Name Amount % to
of the Scheme(in Rs. Lakh) Net Assets
(V)
(VI)
Total

IDFC Fixed Maturity Plan(IDFC-FMP)A Close - Ended Income Fund
IDFC-FMP - TMS-1 (Allotment Date 27 Mar 2009) Average AUM Rs. 227.88 Crores I Date of Maturity 21 Apr 2010
Data as of 31 January 2010
29
Portfolio as of 31 January 2010 Portfolio Contd...
NAV as on
PLAN (Rs./Unit*)Plan A - Dividend 10.6477Plan A - Growth 10.6477Plan B - Dividend 10.6612Plan B - Growth 10.6612* Face value per unit = Rs 10/-
29 January 2010
Sr. Name of Market Value % to Net AssetNo. Instrument (In Rs. Lakh) of the scheme
A Bonds & Debentures of :
B Securitised Debt Instruments
C Money Market Instruments
(I) Private Corporate Bodies - - (II) PSUs - - (III) Banks/FI (including NBFC) - - (IV) Others - -
Sub Total - -
(V) Single Loan - - (VI) Pool - -
Sub Total - -
(VII) CPs - - (VIII) CDs 22,850.51 100.03 (IX) T Bills - - (X) CBLOs/Repos - -(XI) Bills Rediscounting/BRDS - - (XII) Others - -
Sub Total 22,850.51 100.03
Net Assets 22,844.57 100.00
D Government Securities - - E Fixed Deposits - - F Cash and Net Current Assets (5.94) (0.03)G Others (Pls specify) - -
Sr. Name of Market Value % to Net AssetNo. Instrument (In Rs. Lakh) of the scheme
AnnexureA) Bonds & Debentures
Category of Issuer Name of the Issuer Market Value (in Rating % to Net Assets of Rs.lakh) the Scheme
Total - -
Total - -
Total - -
Total - -
(I) Private Corporate Bodies
(II) PSUs
(III) Banks/FI (including NBFC)
(IV) Others
B) Securitised Debt InstrumentsSingle Loan
Obligor Originator Trust Details Name of Guarantor / Level of Guarantee Market Value RatingDetails of Underlying Security (as % of Loan) (in Rs. Lakh)
Total Pool
Originator Seller Trust Details Type of Pool Credit enhancement Market Value Rating(as % of Loan) (in Rs. Lakh)
Total
C) Money Market InstrumentsName of Market Value Rating % to
the Schemethe Issuer (in Rs. Lakh) Net Assets of
Total - -
ICICI Bank Ltd. 6,560.87 A1+ 28.72Standard Chartered Bank 6,415.50 P1+ 28.08
State Bank Of Bikaner & Jaipur 3,459.79 P1+ 15.14Total 22,850.51 100.03
Total - -
CBLO/Repo - -Total - -
Total - -
Total - -
(VII) CPs
(VIII) CDs
(IX) T Bills
(X) CBLOs/Repos
(XI) Bills Rediscounting/BRDS
(XII) Others
ING Vysya Bank Ltd. 6,414.34 P1+ 28.08
D) Government SecuritiesDetails of Market Value % to Securities (in Rs. Lakh) of the Scheme
Net Assets
Total Total
E) Fixed DepositsBank Name Amount % to
of the Scheme(in Rs. Lakh) Net Assets
(V)
(VI)

IDFC Fixed Maturity Plan(IDFC-FMP)A Close - Ended Income Fund
IDFC-FMP - SMS-1 (Allotment Date 23 Dec 2009) Average AUM Rs. 20.45 Crores I Date of Maturity 22 May 2011
Data as of 31 January 2010
29
Portfolio as of 31 January 2010 Portfolio Contd...
NAV as on
PLAN (Rs./Unit*)Plan A - Dividend 10.0553Plan A - Growth 10.0553Plan B - Dividend -Plan B - Growth* Face value per unit = Rs 10/-
29 January 2010
10.0587
Sr. Name of Market Value % to Net AssetNo. Instrument (In Rs. Lakh) of the scheme
A Bonds & Debentures of :
B Securitised Debt Instruments
C Money Market Instruments
(I) Private Corporate Bodies 557.85 27.22 (II) PSUs - - (III) Banks/FI (including NBFC) 1,154.14 56.31 (IV) Others - -
Sub Total 1,711.99 83.53
(V) Single Loan 277.44 13.54 (VI) Pool - -
Sub Total 277.44 13.54
(VII) CPs - - (VIII) CDs - - (IX) T Bills - - (X) CBLOs/Repos - -(XI) Bills Rediscounting/BRDS - - (XII) Others - -
Sub Total - -
Net Assets 2,049.46 100.00
D Government Securities - - E Fixed Deposits - - F Cash and Net Current Assets 60.03 2.93G Others (Pls specify) - -
Sr. Name of Market Value % to Net AssetNo. Instrument (In Rs. Lakh) of the scheme
AnnexureA) Bonds & Debentures
Category of Issuer Name of the Issuer Market Value (in Rating % to Net Assets of Rs.lakh) the Scheme
Tata Motors Ltd. 289.68 AAA 14.13 Tata Sons Ltd. 268.17 AAA 13.08Total 557.85 27.22
Total - -
Total 1,154.14 56.31
Total - -
(I) Private Corporate Bodies
(II) PSUs
(III) Banks/FI (including NBFC)
(IV) Others
Kotak Mahindra Prime Ltd. 299.82 LAA 14.63 IDFC Ltd. 295.16 AAA 14.40LIC Housing Finance Ltd. 280.11 AAA 13.67 Housing Development Finance Cor Ltd 279.06 AAA 13.62
B) Securitised Debt InstrumentsSingle Loan
Obligor Originator Trust Details Name of Guarantor / Level of Guarantee Market Value RatingDetails of Underlying Security (as % of Loan) (in Rs. Lakh)
Ministry Of Railways, GOI IRFC Ltd Nova IV Trust - LOCOMOTIVE Lease Agreement for Rolling Stock-Like Locomotive 0.00% 277.44 AAA(IND)(SO)
Total 277.44Pool
Originator Seller Trust Details Type of Pool Credit enhancement Market Value Rating(as % of Loan) (in Rs. Lakh)
Total
C) Money Market InstrumentsName of Market Value Rating % to
the Schemethe Issuer (in Rs. Lakh) Net Assets of
Total - -
Total - -
Total - -
Total - -
Total - -
Total - -
(VII) CPs
(VIII) CDs
(IX) T Bills
(X) CBLOs/Repos
(XI) Bills Rediscounting/BRDS
(XII) Others
D) Government SecuritiesDetails of Market Value % to Securities (in Rs. Lakh) of the Scheme
Net Assets
Total Total
E) Fixed DepositsBank Name Amount % to
of the Scheme(in Rs. Lakh) Net Assets
(V)
(VI)

Risk Factors
30
Risk Factors: Mutual Funds and securities investments are subject to market risks, reinvestment risk, changes in political, economic environment and government policy and there is no assurance or guarantee that the objectives of the Scheme/s will be achieved. The NAV of the Scheme/s can go up or down depending on factors and forces affecting the Securities Market including fluctuation in interest rates, trading volumes and reinvestment risk. Past performance of the Sponsor/AMC/Mutual Fund is not necessarily indicative of the future performance of the Scheme/s and may not necessarily provide a basis for comparison with other investments. IDFC Classic Equity Fund (IDFC - CEF), IDFC Imperial Equity Fund (IDFC - IEF), IDFC Premier Equity Fund (IDFC - PEF), IDFC Arbitrage Fund (IDFC - AF), IDFC Enterprise Equity Fund (IDFC - EEF),IDFC Tax Saver (ELSS) Fund(IDFC –TS[ELSS]), IDFC Arbitrage Plus Fund (IDFC - APF), IDFC Small & Midcap Equity (SME) Fund (IDFC - SMEF), IDFC Strategic Sector (50-50) Equity Fund IDFC-SS (50-50)-EF, IDFC Tax Advantage (ELSS) Fund (IDFC TA-ELSS), IDFC India GDP Growth Fund (IDFC-IGGF), IDFC Super Saver Income Fund - Investment Plan (IDFC - SSIF-IP), IDFC Dynamic Bond Fund (IDFC - DBF), IDFC Super Saver Income Fund - Medium Term (IDFC-SSIF-MT), IDFC Super Saver Income Fund - Short Term (IDFC-SSIF-ST), IDFC Cash Fund (IDFC-CF), IDFC Liquidity Manager (IDFC-LM), IDFC Liquid Fund (IDFC-LF), IDFC Money Manager Fund - Treasury Plan (IDFC-MMF-TP), IDFC Money Manager Fund - Investment Plan(IDFC – MMF-IP), IDFC Government Securities Fund - Investment Plan (IDFC-GSF-IP), IDFC Government Securities Fund – Short Term Plan (IDFC-GSF-ST), IDFC Government Securities Fund – Provident Fund Plan (IDFC-GSF-PF), IDFC All Seasons Bond Fund (IDFC-ASBF), IDFC Fixed Maturity Plan – 9-(IDFC-FMP – 9), IDFC Fixed Maturity Plan – Nineteen Months Series 1 (IDFC - FMP - NMS – 1), IDFC Fixed Maturity Plan – Fifteen Months Series 3 (IDFC-FMP - FMS-3), IDFC Fixed Maturity Plan – Thirteen Months Series 1 (IDFC-FMP - TMS-1) and IDFC Fixed Maturity Plan –Seventeen Months Series 1 (IDFC-FMP-SMS-1) are names of the Schemes and do not in any manner indicate either the quality of the Schemes, their future prospects or returns. The Sponsor or any of its associates is not responsible or liable for any loss resulting from the operation of the Schemes beyond the corpus of the Trust of Rs. 30,000/-. Terms of Issue & Load Structure: IDFC-CEF, IDFC-IEF IDFC-PEF, IDFC-AF, IDFC - EEF, IDFC –TS[ELSS], IDFC-APF, IDFC-SMEF, IDFC-SS(50-50)-EF, IDFC TA( ELSS ), IDFC-IGGF, IDFC-SSIF (IP), IDFC-DBF, IDFC-SSIF (MT), IDFC-SSIF (ST), IDFC-CF, IDFC-LM, IDFC-LF IDFC-MMF-TP,IDFC-MMF-IP, IDFC-GSF (IP), IDFC-GSF-ST, IDFC-GSF-PF, IDFC-ASBF,IDFC-FMP – 9, IDFC - FMP - NMS – 1, IDFC-FMP - FMS-3 , IDFC-FMP - TMS-1and IDFC-FMP-SMS-1: During the continuous offer the AMC calculates and publishes NAVs and offers for sale and redemption of units of the Scheme on all Business days . Entry Loads – Nil for all the schemes. Exit Load - For all the equity schemes(other than IDFC Arbitrage Fund ,IDFC Arbitrage Plus Fund and ELSS Schemes of IDFC : All investment including SIP/STP/Micro SIP/STP/FOF if redeemed / switched out within 365 days from the date of allotment-1%. No Entry Load/ Exit Loads/CDSC shall be chargeable in case of switches made between different options of the scheme. IDFC-AF - (Plan A & Plan B): is an Open Ended Equity scheme. 0.25% if redemption / switch is requested within 30 days from the date purchase during on going period. IDFC Tax Saver (ELSS) Fund : Nil. IDFC-APF - (Plan A& Plan B): 0.50% of NAV on investors who purchase / switch and seek to redeem / switch out such investments within 365 days from the date of effecting such purchase / switch in. IDFC-SMEF : The scheme is converted into open ended scheme w.e.f. September 11, 2009. After then during the Ongoing Offer Period load will be charged as follows: If redeemed within 1 year from the date of purchase(s) applying First in First out basis (including purchase made through the STP/SIP) -1.00%.No exit load /CDSC will be chargeable in case of switches made between different options of the schemes IDFC Tax Advantage (ELSS) Fund: Nil. IDFC India GDP Growth Fund & IDFC-SSIF Investment Plan (IP) – Plan A Plan B & plan C - 1% of NAV on investors who purchase / switch and seek to redeem / switch out such investments within 365 days from the date of effecting such purchase / switch in. Investors opting for PEP / Dividend reinvestment option / SWP or switch between options within the plan will not be levied an exit load. IDFC –DBF (Plan A & Plan B):-Nil, IDFC-SSIF Medium Term Plan (MT) Plan A &Plan B: 0.50% of NAV on investors who purchase / switch and seek to redeem / switch out such investments within 182 days from the date of effecting such purchase / switch in. Investors opting for PEP / Dividend reinvestment option / SWP or switch between options within the plan will not be levied an exit load. IDFC-SSIF Short Term Plan (ST) – Plan A, Plan B, Plan C & Plan D: Nil. IDFC –CF – Plan A & Plan B; Nil. IDFC Liquidity Manager; Nil. IDFC Liquid Fund (Plan A & Plan D) ; Nil IDFC MMF TP (Plan A, Plan B, Plan C& Plan D) –Nil & , IDFC-MMF-IP-(Plan A & Plan B) Exit Load for all investment including SIP/Micro SIP/STP shall be 1% of the applicable NAV if redeemed /switched out within 90 days from the date of allotment(with effect from 22-Dec-2009) , IDFC-GSF Investment Plan (IP) – Plan A & Plan B - 1% of NAV on investors who purchase / switch and seek to redeem / switch out such investments within 365 days from the date of effecting such purchase / switch in. Investors opting for PEP / Dividend reinvestment option / SWP or switch between options within the plan will not be levied an exit load IDFC-GSF Short Term Plan (ST)– Plan A & Plan B – 0.25% of NAV on investors who purchase / switch and seek to redeem / switch out such investments within 30 days from the date of effecting such purchase / switch in. Investors opting for PEP / Dividend reinvestment option / SWP or switch between options within the plan will not be levied an exit load. IDFC-GSF Provident Fund (PF) – Plan A & Plan B - 1% of NAV on investors who purchase / switch and seek to redeem / switch out such investments within 365 days from the date of effecting such purchase / switch in. Investors opting for PEP / Dividend reinvestment option / SWP or switch between options within the plan will not be levied an exit load IDFC-ASBF - 0.75% of NAV on investors who purchase / switch and seek to redeem / switch out such investments within 365 days from the date of effecting such purchase / switch in. Investors opting for PEP / Dividend reinvestment option / SWP or switch between options within the plan will not be levied an exit load.IDFC-FMP-9: 2%if redeem before 13 Nov.2006. IDFC- FMP-NMS – On maturity Nil. IDFC-FMP - FMS-3: Nil , IDFC-FMP - TMS-1: Nil and IDFC-FMP-SMS-1: NIL Investment Objective: IDFC – CEF: The investment objective of the scheme is to seek to generate long term capital growth from a diversified portfolio of predominantly equity and equity related instruments. However there is no assurance that the investment objective of the scheme will be realized. IDFC-IEF: The investment objective of the Scheme is to seek to generate capital appreciation and/or provide income distribution from a portfolio of predominantly equity and equity related instruments. There is no assurance or guarantee that the objectives of the scheme will be realized. . IDFC-IEF: The investment objective of the Scheme is to seek to generate capital appreciation and/or provide income distribution from a portfolio of predominantly equity and equity related instruments. There is no assurance or guarantee that the objectives of the scheme will be realized. IDFC-PEF: The Scheme shall seek to generate long-term capital growth from an actively managed portfolio of predominantly equity and equity related instruments. However there is no assurance that the investment objective of the scheme will be realized. IDFC-AF: The investment objective of the Scheme is to generate capital appreciation and income by predominantly investing in arbitrage opportunity in the cash and the derivative segments of the equity markets and the arbitrage opportunity available within the derivative segments and by investing the balance in debt and money market instruments. However there is no assurance that the investment objective of the scheme will be realized. IDFC-EEF: The investment objective of the scheme is to seek to generate capital growth from a portfolio of predominantly equity and equity related instruments (Including Equity derivatives). The scheme may also invest in debt and money market instruments to generate reasonable income. However there is no assurance that the investment objective of the scheme will be realized. IDFC - TS [ELSS]: The investment objective of the Scheme is to seek to generate long-term capital growth from a diversified portfolio of predominantly equity and equity-related securities. There

Risk Factors
31
can be no assurance that the investment objective of the scheme will be realized IDFC-APF: The investment objective of the scheme is to generate income (absolute to low volatility returns) by taking advantage of opportunities in the cash and the derivative segments of the equity markets including the arbitrage opportunities available within the derivative segment, by using other derivative based strategies and by investing the balance in debt and money market instruments. However there is no assurance that the investment objective of the scheme will be realized. IDFC-SMEF: The investment objective of the Scheme is to seek to generate capital appreciation from a diversified portfolio of equity and equity related instruments. The Scheme will predominantly invest in small and midcap equity and equity related instruments. Small and Midcap equity and equity related instruments will be the stocks included in the CNX Midcap index or equity and equity related instruments of such companies which have a market capitalization lower than the highest components of CNX Midcap Index. The Scheme may also invest in stock other than mid cap stocks (i.e. in stocks, which have a market capitalization of above the market capitalization range of the defined small midcap stocks) and derivatives. On defensive consideration, the Scheme may also invest in debt and money market instruments. However there is no assurance that the investment objective of the scheme will be realized. IDFC-SS (50-50)-EF: The investment objective of the scheme is to seek to generate long-term capital appreciation by investing in Equity and Equity related instruments. The investment objective of the fund shall be achieved by investing up to fifty percent of the assets of the scheme in a chosen sector (sector specific exposure) while the balance amount may be invested in companies across market capitalizations and across sectors (diversified exposure). The scheme may also invest in debt and money market instruments. There is no assurance or guarantee that the objectives of the scheme will be realized and the scheme does not assure or guarantee any returns. IDFC TA (ELSS): The investment objective of the Scheme is to seek to generate long term capital growth from a diversified portfolio of predominantly equity and equity related securities. There can be no assurance that the investment objective of the scheme will be realized. IDFC –IGGF: The investment objective of the scheme is seek to generate long term capital appreciation by investing in Equity and Equity related instruments. The scheme aims to capture the growth in India's Gross Domestic Product (GDP). The scheme would endevour to represent the growth in GDP by capturing the growth in the constituents of the GDP. The scheme may also invest in Debt and money market instruments. There is no assurance or guarantee that the objectives of the scheme will be realized and the scheme does not assure or guarantee any returns. IDFC - SSIF-IP: Seek to generate stable returns by creating a portfolio that is invested in good quality fixed income and money market securities.However there is no assurance that the investment objective of the scheme will be realized. IDFC – DBF: Seek to generate optimal returns with high liquidity by active management of the portfolio; by investing in high quality money market & debt instruments. However there is no assurance that the investment objective of the scheme will be realized. IDFC-SSIF-MT: Seek to generate stable returns with a low risk strategy by investing in good quality fixed income securities and money market securities. However there is no assurance that the investment objective of the scheme will be realized. IDFC-SSIF-ST: Seek to generate stable returns with a low risk strategy by investing in good quality fixed income securities and money market securities. However there is no assurance that the investment objective of the scheme will be realized. IDFC-CF: IDFC-CF is an open-ended liquid fund with an objective to generate optimal returns with high liquidity by investing in high quality money market and debt instruments. However there is no assurance that the investment objective of the scheme will be realized. IDFC-LM: The investment objective of the Scheme is to seek to provide high liquidity by investing in a portfolio of money market instruments and debt instruments. Whilst the scheme would endeavour to provide high liquidity to the investors, the surplus funds will be invested to deliver reasonable returns. There can be no assurance that the investment objective of the scheme will be realised IDFC-LF: The investment objective of the Scheme is to seek to provide high liquidity by investing in a portfolio of money market instruments and debt instruments. Whilst the scheme would endeavour to provide high liquidity to the investors, the surplus funds will be invested to deliver reasonable returns. There can be no assurance that the investment objective of the scheme will be realised. IDFC-MMF-TP& IDFC-MMF-IP: Seek to generate stable returns with a low risk strategy by creating a portfolio that is substantially invested in good quality floating rate debt or money market instruments, fixed rate debt or money market instruments swapped for floating returns and fixed rate debt and money market instruments. However there is no assurance that the investment objective of the scheme will be realized. IDFC-GSF-IP: IDFC – GSF -IP is an open-ended dedicated gilt scheme with an objective to generate optimal returns with high liquidity by investing Government Securities. However there is no assurance that the investment objective of the scheme will be realized.IDFC-GSF-ST: IDFC-GSF-ST is an open-ended dedicated gilt scheme with an objective to generate optimal returns with high liquidity by investing Government Securities. However there is no assurance that the investment objective of the scheme will be realized. IDFC-GSF-PF: Seek to generate optimal returns with high liquidity by investing in government securities. However there is no assurance that the investment objective of the scheme will be realized. IDFC-ASBF: Seek to generate optimal returns with high liquidity by active management of the portfolio, by investing predominantly in debt oriented mutual fund schemes and money market instruments. However there is no assurance that the investment objective of the scheme will be realized. IDFC-FMP – 9: The investment objective of the Scheme is to seek to achieve growth of capital by investing in a portfolio of fixed income securities normally in line with the duration of the scheme. There can be no assurance that the investment objective of the scheme will be realised. IDFC - FMP - NMS – 1: The investment objective of the Scheme is to seek to generate income by investing in a portfolio of debt and money market instruments maturing normally in line with the duration of the scheme. There can be no assurance that the investment objective of the scheme will be realised. IDFC-FMP - FMS-3: The investment objective of the Scheme is to seek to generate income by investing in a portfolio of debt and money market instruments maturing before the duration of the scheme. There is no assurance or guarantee that the objectives of the scheme will be realized. IDFC-FMP - TMS-1: The investment objective of the Scheme is to seek to generate income by investing in a portfolio of debt and money market instruments. There can be no assurance that the investment objective of the scheme will be realized.IDFC-FMP-SMS-1: The investment objective of the Scheme is to seek to generate income by investing in a portfolio of debt and money market instruments maturing before the duration of the scheme. There is no assurance or guarantee that the objectives of the scheme will be realized IISL Disclaimer: "S&P®" and "Standard and Poor's®" are trademarks of the McGraw-hill Companies, Inc. ("S&P"), and have been licensed for use by India Index Services & Products Limited in connection with the S&P CNX Nifty Index. "The Product is not sponsored, endorsed, sold or promoted by India Index Services & Products Limited ("IISL") or Standard & Poor's, a division of The McGraw-Hill Companies, Inc. ("S&P"). Neither IISL nor S&P makes any representation or warranty, express or implied, to the owners of the Product or any member of the public regarding the advisability of investing in securities generally or in the Product. Please read the full Disclaimers in relation to the S&P CNX Nifty Index in the Offer Document / Prospectus / Information Statement." Statutory Details: IDFC Mutual Fund has been set up as a trust by Infrastructure Development Finance Company Limited (IDFC) (liability restricted to corpus of Trust of Rs. 30,000) with IDFC AMC Trustee Company Ltd as the trustee and IDFC Asset Management Company Ltd as the investment manager. Investors in the scheme(s) are not being offered any guaranteed or assured rate of return. Copy of Scheme Information Document and Key Information Memorandum along with application form for all the schemes may be obtained from the office of IDFC Mutual Fund, One India Bulls Centre, 841, Jupiter Mills Compound, Senapati Bapat Marg,, Elphinstone Road, (West), Mumbai 400 013. Contact 1-800-226622 for details.For details please read the respective Scheme Information Document (SID) (including those of FMPs)/ Offer Document (OD) / Statement of Additional Information (SAI) carefully before investing

Methodology of RankingData as of 30 September 2009
Value Research Rating:Value Research Fund Ratings are a composite measure of historical risk-adjusted returns. In the case of equity and hybrid funds this rating is based on the weighted average monthly returns for the last 3 and 5-year periods. In the case of debt funds this rating is based on the weighted average weekly returns for the last 18 months and 3-year periods and in case of short-term debt funds - weekly returns for the last 18 months. These ratings do not take into consideration any entry or exit load.
Five-stars indicate that a fund is in the top 10% of its category in terms of historical risk-adjusted returns. Four stars indicate that a fund is in the next 22.5%, middle 35% receive three stars, the next 22.5% are assigned two stars while the bottom 10% receive one star. The number of schemes in each category is mentioned along side the categories name. Equity Diversified (142), Equity : Index (17), Equity Tax Planning (23), Hybrid Equity Oriented (25), Hybrid: Monthly Income (32), Debt: Medium-term (40), Gilt: Medium and Long-term (28), Gilt: Short-term (13), Debt: Ultra Short-term (40), Debt: Ultra Short-term Institutional (46), Debt: Short-term (15), Debt: Floating Rate Short-term (15),Debt: Floating Rate Long-term (10), Hybrid: Debt-oriented (16), Debt: Liquid Plus: (24), Debt: Liquid Plus Institutional:(23). These Fund Ratings are as on September 30, 2009.
The Value Research Ratings are published in Monthly Mutual Fund Performance Report and Mutual Fund Insight. The Ratings are subject to change every month. The Rating is based on primary data provided by respective funds, Value Research does not guarantee the accuracy.
ICRA Credit Risk Rating Methodology:ICRA's Credit Risk rating is an analytical process characterised by both width and depth, and following on the organisation's extensive knowledge base encompassing almost every sector of the Indian economy, besides the economy itself. Our goal in Credit Risk Rating of debt mutual funds is to provide investors with a simple-to-use measure of credit risk. The Credit Risk Ratings incorporate ICRA's assessment of a debt fund's published investment objectives and policies, its management characteristics, and the creditworthiness of its investment portfolio.
ICRA's analysts obtain and rely on relevant data from public and non-public sources. While this data may vary according to the type and nature of the debt fund, the following information is typically used in the Rating process:
Prospectus and related documents:-Debt fund portfolio data, including periodic investor reports and public filings.- Industry surveys, studies, and special reports - Internal documents describing the Asset Management Company's (AMC's) structure, investment philosophy, decision making process, and performance track record
In addition, ICRA encourages continual dialogue with the AMC's management. ICRA's analysts would normally meet the company representatives for a discussion of the relevant factors in connection with the assignment of an initial Credit Risk Rating, and on a periodic basis thereafter.
ICRA's Credit Matrix provides debt fund managers with investment decision flexibility. The Credit Matrix is a tool used by ICRA to analyse the investment portfolios of debt mutual funds. The analysis involves measuring a portfolio's aggregate credit quality through a review of the credit quality of each underlying debt security. A portfolio's weighted average credit quality is then measured against the appropriate benchmark credit score. Separate benchmark credit scores are used for liquid and bond funds. Short-term debt funds have weighted average portfolio maturities of up to one year and are typically liquid/cash funds. Long-term debt funds, on the other hand, have weighted average maturity of more than one year and are typically bond funds. ICRA benchmarks short-term debt funds including liquid/cash funds against a 12-month benchmark credit score, while long-term debt funds are benchmarked against the long-term benchmark credit score. ICRA generally assigns short-term MF Credit Risk Ratings to short-term/liquid funds, but gives an option to these funds to seek long-term MF Credit Risk Rating. Similarly, ICRA generally assigns long-term MF Credit Risk Ratings to bond funds, but gives an option to these funds with weighted average maturity of less than 12 months to seek short-term MF Credit Risk Ratings.
ICRA Mutual Fund Awards 2009:IDFC Dynamic Bond Fund - Plan A has been ranked as a 4 Star Fund in the category of 'Open Ended Debt – Long Term' schemes (25 Schemes) for its 1 year performance till March 31, 2009.IDFC Super Saver Income – Investment Plan – Plan A has been ranked as a 4 Star Fund in the category of 'Open Ended Debt – Long Term' schemes (25 Schemes) for its 1 year performance till March 31, 2009.IDFC Super Saver Income – Short Term Fund has been ranked as a 5 Star Fund in the category of 'Open Ended Debt – Short Term' schemes (11 Schemes) for its 1 year performance till March 31, 2009.IDFC Imperial Equity Fund – Plan A has been ranked as a 5 Star Fund in the category of 'Open Ended Diversified Equity - Defensive' schemes (65 Schemes) for its 1 year performance till March 31, 2009.IDFC Premier Equity Fund – Plan A has been ranked as a 4 Star Fund in the category of 'Open Ended Diversified Equity - Defensive' schemes (65 Schemes) for its 1 year performance till March 31, 2009.IDFC Dynamic Bond Fund - Plan A has been ranked as a 5 Star Fund in the category of 'Open Ended Debt – Long Term' schemes (20 Schemes) for its 3 year performance till March 31, 2009.IDFC Super Saver Income – Investment Plan – Plan A has been ranked as a 4 Star Fund in the category of 'Open Ended Debt – Long Term' schemes (20 Schemes) for its 3 year performance till March 31, 2009.IDFC Super Saver Income – Short Term Fund has been ranked as a 4 Star Fund in the category of 'Open Ended Debt – Short Term' schemes (11 Schemes) for its 3 year performance till March 31, 2009.IDFC Premier Equity Fund – Plan A has been ranked as a 5 Star Fund in the category of 'Open Ended Diversified Equity - Aggressive' schemes (39 Schemes) for its 3 year performance till March 31, 2009.IDFC Imperial Equity Fund – Plan A has been ranked as a 5 Star Fund in the category of 'Open Ended Diversified Equity - Defensive' schemes (57 Schemes) for its 3 year performance till March 31, 2009.The rank is an outcome of an objective and comparative analysis against various parameters, including: risk adjusted return, fund size, company concentration, portfolio turnover and liquidity. The ranking methodology did not take into account entry and exit loads imposed by the Fund. The ranks are neither a certificate of statutory compliance nor any guarantee on the future performanceRanking Source & Publisher : ICRA Online Ltd.
ICRA Credit Risk Rating:IDFC Money Manager Fund - Treasury Plan: “Credit Risk Rating mfAAA” - The Fund carries the lowest credit risk, similar to that associated with long-term debt obligations rated in the highest-credit-quality category.IDFC Money Manager Fund – Investment Plan: “Credit Risk Rating mfAAA” - The Fund carries the lowest credit risk, similar to that associated with long-term debt obligations rated in the highest-credit-quality category.IDFC Cash Fund: “Credit Risk Rating mfA1+” - The highest-credit-quality short-term rating assigned by ICRA to debt funds. Debt funds rated in this category carry the lowest credit risk in the short term and are similar to that of fixed income obligations of highest-credit-quality category with maturity of upto one year.This rating should however, not be construed as an indication of the performance of the Mutual Fund scheme or of volatility in its returns.Source: ICRA Ltd.
CRISIL Credit Quality Rating:IDFC Super Saver Income Fund - Investment Plan: “Credit Quality Rating AAAf” - The assigned rating AAAf is valid only for “IDFC Super Saver Income Fund - Investment Plan”. The rating of CRISIL is not an opinion on the Asset Management Company’s willingness or ability to make timely payments to the investor. The rating is also not an opinion on the stability of the NAV of the Fund, which could vary with market developments.
CRISIL Credit Quality Rating Methodology:CRISIL's credit quality ratings are based on the analysis of the credit risk of securities held by the fund. CRISIL has developed a Credit Quality Matrix to evaluate fund’s overall level of protection against losses associated with credit default. The matrix is a set of credit factors and credit scores derived scientifically from CRISIL’s rating default and transition rates.
32
ICRA Credit Risk Rating Disclaimer:The rank for the schemes is an outcome of an objective and comparative analysis against various parameters, including: risk adjusted return, fund size, company concentration, portfolio turnover and liquidity. 7-Star Fund Rank indicates - Best Performance amongst the 5-Star Funds. 5-Star Fund Rank indicates - Best performance (Top 10% of the category). Entry/Exit Loads not considered.Past Performance is no guarantee of future results. Ranking Source & Publisher: ICRA Online Limited.
Morningstar Rating This Morningstar-sourced information is provided to you by IDFC AMC and is at your own risk. Morningstar is not responsible for any damages or losses arising from any use of this information. Also, this information must not be relied upon without appropriate verification. IDFC AMC informs you as follows: (i) no investment decision should be made in relation to any of the information provided other than on the advice of a professional financial advisor; (ii) past performance is no guarantee of future results; and (iii) the value and income derived from investments can go down as well as up.
The Morningstar fund rating methodology is based on a fund's risk-adjusted return within a given Morningstar category. Morningstar ratings are calculated every month for the 3 year, 5 year and 10 year period. Within each rating period, the top 10% funds receive a five star rating, the next 22.5% earn a four star rating, the next 35% get three stars, the next 22.5% receive two stars, and the bottom 10% get one star. Loads are not considered for the rating purpose. The rating is based on NAV provided by respective funds. The current fund rating is for the 3 year period as of December 31, 2009, IDFC Imperial Equity Fund Growth has been rated 5-Star fund in the category of Large Cap schemes (342 Schemes), IDFC Premier Equity Fund Growth has been rated 5-Star fund in the category of Small/Mid Cap schemes, IDFC Dynamic Bond Fund Growth has been rated 5-Star fund in the category of Intermediate Bond schemes (174 Schemes), IDFC Liquid Fund Growth has been rated 4-Star fund in the category of Liquid schemes (366 Schemes), IDFC Gov Sec PF Fund Growth has been rated 4-Star fund in the category of Intermediate Government schemes (77 Schemes) IDFC SS Income Inv Fund Growth has been rated 4-Star fund in the category of Intermediate Bond schemes (174 Schemes), IDFC SS Inc M/T Fund Growth has been rated 4-Star fund in the category of Short-term Bond schemes IDFC All Seasons Bond Fund Growth has been rated 4-Star fund in the category of Intermediate Bond schemes (174 Schemes).

IDFC AMC Offices
Ahmedabad : Ground Floor, Zodiac Avenue, Opp. Mayor’s Bunglow, Near Law Garden, Ahmedabad - 380 006. Tel.: 079-64505881/5857.
Bangalore : Raheja Point, 2nd Floor, Magrath Road, Opp. Garuda Mall, Bangalore - 25. Tel.: 080-64501951/52,66111504/05/06.
Chandigarh : Sco-2475-76, 1st Floor, Sector-22, Chandigarh - 160022. Tel. :0172-5071918/19/21/22. Fax : 01725071918..
Chennai : Maalavika Centre, Old no. 144/145, New No. 60, Kodambakkam High Road, Nungambakkam, Chennai - 600 034.
Tel.: 044-39185409/ 10/ 11.
Cochin : 39/3993 B2, Ground floor, Vantage Point, VRM Road, Ravipuram, Cochin-682 016, Kerala. Tel: 0484-3012639/4029291, Fax: 0484-2358639
Coimbatore : Red Rose Plaza, 509 H, II Floor, D.B. Road, R.S. Puram, Coimbatore - 641 002. Tel.: 0422-2542645, 2542678.
Dehradun : C/o EBD BUSINESS CENTRE, cubicle no 3, 49, Rajpur Road, Dehradun- 248001, Tel.: 09837500990
Goa : Advani Bussiness Centre, Neelkamal Arcade, A B Road, Panjim, Goa - 403001. TEl: 0832-6650403, Fax: 0832-6650310.
Mobile : 9823289903.
Hyderabad : 4th Floor, Central Plaza, #6-3-902/A, Raj Bhavan Road, Somajiguda, Hyderabad - 500082 Tel.: 040-42014646/47, Fax-040-40037521.
Indore : 405, 4th Floor, 21 / 1, D.M. Tower, Race Course Road, Indore – 452 001.Phone: 0731-4206927/ 0731-4208048. Fax 0731-4206923
Jaipur : G-7, G-8, Anukampa Towers, Church Road, Jaipur - 302 001. Tel.: 0141-5105797, 5105798.
Kanpur : Office No. 214, 215, IInd Floor, KAN Chambers, 14/113, Civil Lines, Kanpur - 208 001. Tel: 0512-2331071, 2331119.
Kolkata : Oswal Chambers, 1st Floor, 2 Church Lane, Kolkata - 700 001. Tel.: 033-3024 9794/ 78/ 89/ 88/ 90.
Lucknow : Flat No. 2, 1st Floor, SAS House, 6B, Tej Bhadur Sapru Marg, Lucknow -226001. Tel : 0522 – 3056900/01/02/03/04/05. Fax – 0522 - 3056900
Ludhiana : SCO 16-17, Basement, Feroze Gandhi Market, Ludhiana - 141 001. Tel.: 0161-5022155, 5022156.
Manglore : Raj Business Centre, 3rd Floor, Raj Towers, Balmatta Road, Manglore - 575001. (Not an official point of accepting transaction.)
Mumbai : 17/18, 3rd Floor, Vasvani Mansion, 120, Dinshaw Vachha Road, Opp K.C. College, Churchgate, Mumbai 400 020. Maharashtra. Phone 022-22876419
Nagpur : Fortune Business Centre, First Floor, 6 Vasant Vihar, W.H.C.Rd., Shankar Nagar, Nagpur-440010. Tel.: 0712-6451428 / 2525657
Nashik : Kavita Complex 2nd Floor, Madan Services, Near Big Bazar, College Road, Nasik 422005. Mob. 09970625856.
New Delhi : 4th Floor, Narain Manzil, 23 Barakhamba Road, New Delhi - 110 001. Tel.: 011-47311301/ 02/03/04/05.
Patna : Bhagwati Dwarka Arcade, Plot No. 830P, Exhibition Road, Patna - 800001
Pune : 1st Floor, Dr. Herekar Park Building, Next to Kamala Nehru Park, Off. Bhandarkar Road, Pune - 411 004. Tel: 020-66020965/ 4.
Rajkot : “Star Plaza”, 2nd Floor, Office No. 201, Phulchab Chowk, Rajkot - 360 001. Tel. 0281-6626012.
Surat : U-15/16, Jolly Plaza, Athvagate, Surat: 395001. Phone: 2475060, 2475070
Vadodara : Ground Floor, Akash Ganga Complex, Adjacent to Vanijya Bhavan, Race Course Circle, Vadodara - 390 007. Tel.: 0265 - 6620919/ 939.
Visakhapatnam : Visakha Executive Centre, 47-11-1/5, Eswar Arcade, Dwarakanagar,1st Lane, Visakhapatnam-530016, Mob: 99634-39222.
Phone TransactREDEEM SWITCH CHECK BALANCE
Call Free: 1-800-226622** Available from 8.00 am to 7.00 pm on all business days.www.idfcmf.com
IDFC Asset Management Company Ltd. Registered Office: One IndiaBulls Centre, Jupiter Mills Compound, 841, Senapati Bapat Marg, Elphinstone (W), Mumbai - 400013. Tel No. 24399999; 66289999; Fax: 24215051-52.