PRESENTED BY INTERFAITH HUMAN SERVICES AND PENNSYLVANIA INTERFAITH POWER & LIGHT ENERGY EFFICIENCY.
Upload
marion-boothCategory
view
220download
0
Identity, Faith. Learning and Interfaith Relations in Canada
Presentation for Interfaith and Belonging Canadian Race Relations Foundation
JACK JEDWAB ASSOCIATION FOR CANADIAN STUDIES October 16, 2012

Methodology
Conducted by the firm Leger Marketing for the Association for Canadian Studies and the Canadian Race Relations Foundation, was done via web panel with 1522 respondents between March 17 and March 19, 2012. Across the country an equivalent phone survey would have a margin of error of 2.9 points 19 times out of 20)

Attachment to religion lowest across identities-increases amongst 65 plus
Total A manA
woman 18-24 25-34 35-44 45-54 55-64 65 + French English OtherTotal Weight
1522 735 787 179 247 297 307 226 267 332 877 297
TotNumb
1522 813 709 115 206 313 392 223 273 428 954 132
Canada 84% 83% 86% 79% 80% 82% 88% 87% 89% 54% 95% 89%
Prov 88% 87% 88% 83% 85% 85% 87% 90% 94% 91% 88% 82%
My Lang Group
78% 75% 81% 62% 78% 77% 82% 80% 85% 84% 80% 65%
My Ethnic Community
51% 50% 53% 40% 49% 58% 55% 47% 54% 57% 50% 47%
My Religious Group
38% 34% 41% 29% 32% 40% 34% 37% 52% 26% 39% 45%

Importance of religion and belief in God is lowest amongst youth
Agree Total A man A woman 18-24 25-34 35-44 45-54 55-64 65 +
Religion is an important part of my life
42% 37% 46% 30% 38% 43% 38% 42% 56%
God exists 67% 64% 71% 56% 63% 71% 66% 65% 79%
Good Deeds are rewarded
76% 71% 81% 77% 72% 76% 77% 77% 79%
Bad Deeds are punished
63% 58% 67% 72% 65% 61% 60% 63% 58%
A higher power governs the world
58% 54% 62% 52% 55% 60% 54% 55% 69%
There is life after death
63% 58% 68% 60% 61% 64% 61% 62% 70%

Francophones least likely to believe that a high power governs
Agree Total French English OtherMaritim
es QC ON MB/SK AB BC
Religion is an important part of my life
42% 33% 44% 43% 47% 33% 45% 54% 43% 37%
God exists
67% 64% 68% 69% 70% 62% 70% 79% 67% 62%
Good Deeds are rewarded
76% 77% 77% 75% 82% 78% 76% 82% 75% 70%
Bad Deeds are punished
63% 54% 64% 68% 70% 56% 66% 65% 60% 60%
A higher power governs the world
58% 45% 60% 67% 62% 46% 62% 73% 66% 52%
There is life after death
63% 62% 65% 57% 60% 60% 65% 69% 67% 59%

Canadians can practice freely but rights of women may be affected
AGREE Total A man
A woman 18-24 25-34 35-44 45-54 55-64 65 + French English Other
People can
practise their
religion freely in Canada
91% 93% 90% 91% 94% 91% 91% 91% 90% 84% 94% 94%
Religion inevitably poses a threat to women's rights
45% 44% 45% 49% 44% 40% 42% 49% 45% 55% 43% 35%
Religion brings people together more than it divides them
47% 44% 49% 42% 43% 47% 44% 43% 58% 40% 48% 51%
I want to learn more about religions other than my own
49% 48% 49% 46% 56% 51% 42% 48% 48% 40% 55% 41%

Yes to Religious Pluralism, But…
AGREE Total A man
A woman 18-24 25-34 35-44 45-54 55-64 65 + French English Other
There is room for a variety of religions in Canada
82% 84% 81% 84% 83% 80% 83% 84% 79% 74% 82% 91%
We have to take steps to protect our Canadian religious traditions from outside influences
51% 48% 54% 41% 53% 46% 45% 53% 69% 65% 51% 38%
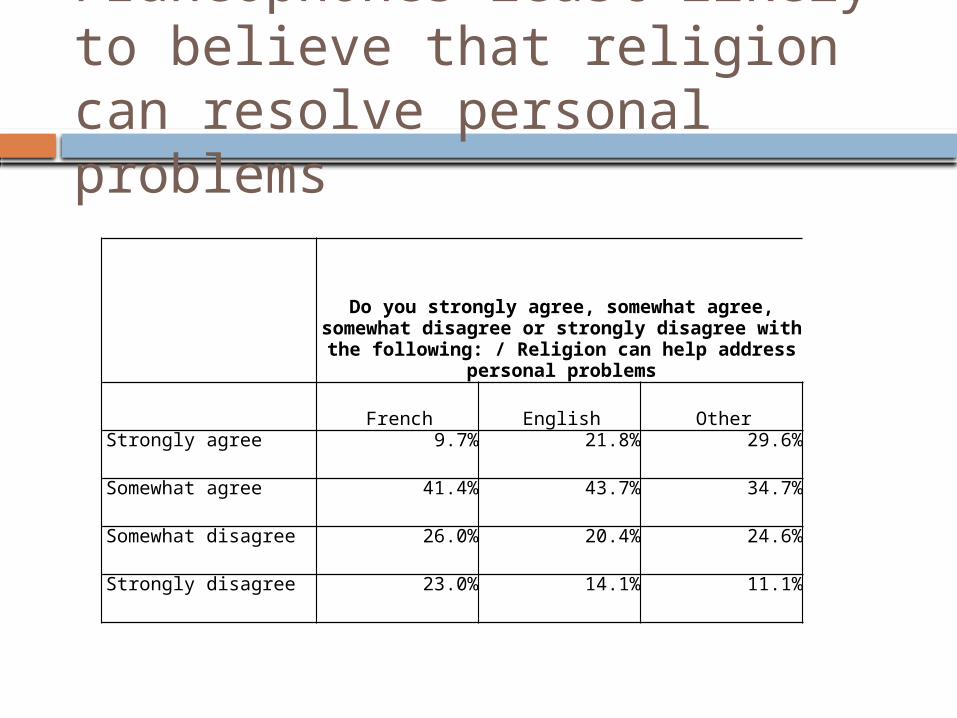
Francophones least likely to believe that religion can resolve personal problems
Do you strongly agree, somewhat agree, somewhat disagree or strongly disagree with the following: /
Religion can help address personal problems
French English OtherStrongly agree 9.7% 21.8% 29.6%
Somewhat agree 41.4% 43.7% 34.7%
Somewhat disagree 26.0% 20.4% 24.6%
Strongly disagree 23.0% 14.1% 11.1%

It is leaders and not religious people that lack trust
Total Trust Total A man
A woman 18-24 25-34 35-44 45-54 55-64 65 +
People that are religious
67% 63% 70% 66% 66% 64% 66% 67% 72%
People that are not religious/Atheists
73% 71% 75% 79% 72% 77% 71% 68% 73%
Clergy/Religious Leaders
48% 46% 51% 39% 47% 43% 47% 50% 62%

Those who believe that God exists are most likely to trust religious leaders
God existsClergy/Religious Leaders
Strongly agree Somewhat agreeSomewhat disagree
Strongly disagree
Trusted a lot 18.4% 5.5% 4.0% 5.0%
Somewhat trusted 45.3% 44.1% 31.6% 17.4%
Trusted a little 25.9% 35.3% 42.7% 33.1%
Not trusted at all 10.4% 15.0% 21.7% 44.6%

Those who consider religion as important in their lives are far more inclined to affirmGod’s existence (see table below) and far more likely to agree that good deeds will be rewarded
Religion is an important part of my lifeGod exists
Strongly agree Somewhat agree Somewhat disagree Strongly disagreeStrongly agree 95.7% 56.4% 22.2% 6.9%
Somewhat agree 3.3% 41.2% 52.0% 18.3%
Somewhat disagree .7% 2.1% 23.6% 30.2%
Strongly disagree .3% .3% 2.2% 44.6%
Religion is an important part of my lifeGood deeds are rewarded
Strongly agree Somewhat agree Somewhat disagree Strongly disagreeStrongly agree 58.0% 26.9% 17.6% 12.9%
Somewhat agree 36.4% 56.3% 59.6% 48.0%
Somewhat disagree 4.9% 13.8% 17.6% 21.5%
Strongly disagree .7% 3.1% 5.1% 17.7%

Young Canadians least likely to trust religious leaders
Total Trust Total A man
A woman 18-24 25-34 35-44 45-54 55-64 65 +
People that are religious
67% 63% 70% 66% 66% 64% 66% 67% 72%
People that are not religious/Atheists
73% 71% 75% 79% 72% 77% 71% 68% 73%
Clergy/Religious Leaders
48% 46% 51% 39% 47% 43% 47% 50% 62%

Those who want to learn more about other religions
more likely to agree that religion unifies
I want to learn more about religions other than my own
Religion brings people together more than it divides them
Strongly agreeSomewhat
agreeSomewhat
disagreeStrongly
disagree
Strongly agree 27.1% 39.1% 20.0% 13.8%
Somewhat agree 11.4% 45.7% 28.9% 14.0%
Somewhat disagree 8.8% 34.4% 34.9% 21.9%
Strongly disagree 10.3% 22.5% 18.3% 48.9%

Those who want to learn more about other religions more positive about Muslims
I want to learn more about religions other than my own
Do you have a very positive, somewhat positive, somewhat negative or very negative opinion of the following: / Muslims
Strongly agreeSomewhat
agreeSomewhat
disagreeStrongly
disagree
Very positive 30.1% 39.9% 9.2% 20.8%
Somewhat positive 14.4% 45.2% 24.8% 15.6%
Somewhat negative 8.8% 32.0% 31.7% 27.4%
Very negative 5.7% 17.4% 34.8% 42.2%

Those who want to learn more about other religions more positive about Jews
I want to learn more about religions other than my own
Do you have a very positive, somewhat positive, somewhat negative or very negative opinion of the following: / Jews
Strongly agreeSomewhat
agreeSomewhat
disagreeStrongly
disagree
Very positive 21.7% 43.4% 18.1% 16.8%
Somewhat positive 12.0% 36.6% 28.5% 22.9%
Somewhat negative 9.7% 28.6% 31.8% 30.0%
Very negative 4.2% 15.5% 25.4% 54.9%
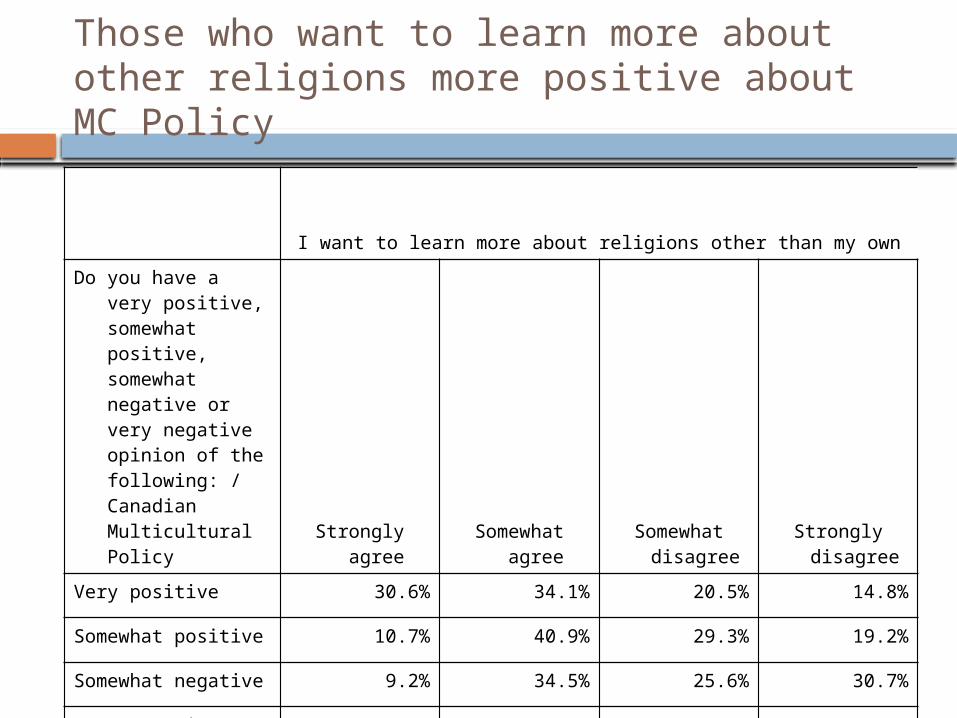
Those who want to learn more about other religions more positive about MC Policy
I want to learn more about religions other than my own
Do you have a very positive, somewhat positive, somewhat negative or very negative opinion of the following: / Canadian Multicultural Policy
Strongly agreeSomewhat
agreeSomewhat
disagreeStrongly
disagree
Very positive 30.6% 34.1% 20.5% 14.8%
Somewhat positive 10.7% 40.9% 29.3% 19.2%
Somewhat negative 9.2% 34.5% 25.6% 30.7%
Very negative 6.3% 22.7% 29.5% 41.5%

Those who want to learn more about other religions more trusting of Muslims
I want to learn more about religions other than my own
The following can be trusted a lot, somewhat trusted, trusted a little or not trusted at all: / Muslims
Strongly agreeSomewhat
agreeSomewhat
disagreeStrongly
disagree
Trusted a lot 41.8% 34.2% 6.8% 17.1%
Somewhat trusted 14.6% 44.0% 24.3% 17.1%
Trusted a little 7.1% 35.6% 34.5% 22.8%
Not trusted at all 3.7% 21.5% 28.9% 46.0%

Those who want to learn more about other religions more trusting of Jews
I want to learn more about religions other than my own
The following can be trusted a lot, somewhat trusted, trusted a little or not trusted at all: / Jews
Strongly agreeSomewhat
agreeSomewhat
disagreeStrongly
disagree
Trusted a lot 29.8% 38.3% 13.6% 18.3%
Somewhat trusted 11.4% 41.0% 27.3% 20.3%
Trusted a little 6.8% 27.7% 37.8% 27.7%
Not trusted at all 5.0% 20.1% 20.9% 54.0%

Those supporting interfaith dialogue more likely to agree that religion unifies
Government should provide funds to support dialogue to resolve problems between religious communities
Religion brings people together more than it divides them
Strongly agreeSomewhat
agreeSomewhat
disagreeStrongly
disagree
Strongly agree 19.6% 29.5% 30.4% 20.5%
Somewhat agree 5.2% 30.4% 43.0% 21.5%
Somewhat disagree 4.9% 21.4% 41.5% 32.2%
Strongly disagree 1.7% 18.9% 18.3% 61.1%

Muslims less trusted than other groups Total Trust Total
18-24 25-34 35-44 45-54 55-64 65 +
Protestant 71% 53% 69% 69% 74% 73% 83%
Catholics 70% 63% 67% 66% 68% 73% 83%
Jews 69% 64% 69% 65% 71% 69% 77%
Aboriginals 64% 66% 66% 64% 66% 59% 60%
Immigrants 63% 73% 63% 62% 62% 57% 62%
Muslims 48% 56% 50% 51% 49% 45% 39%

As observed below, some 43% of Canadians strongly agree that they have heard negative comments about Muslims over the past year compared with 31% in the case of Aboriginals and 25% in the case of Jews.
I have heard negative comments about…in the past year
Strongly agree
Somewhat agree
Somewhat disagree
Strongly disagree
Muslims 43.5% 38.8% 11.1% 6.5% 100.0%
Aboriginals 31.2% 37.6% 20.7% 10.4% 100.0%
Jews 24.7% 34.4% 26.4% 14.5% 100.0%

People least likely to agree that discrimination
towards black people not their fault If there is discrimination against…it is mainly their fault
Total
18-24 25-34 35-44 45-54 55-64 65 +
Muslims 42% 28% 41% 38% 39% 39% 62%
Jews 26% 20% 30% 25% 26% 24% 28%
Black People 19% 24% 20% 17% 17% 16% 20%
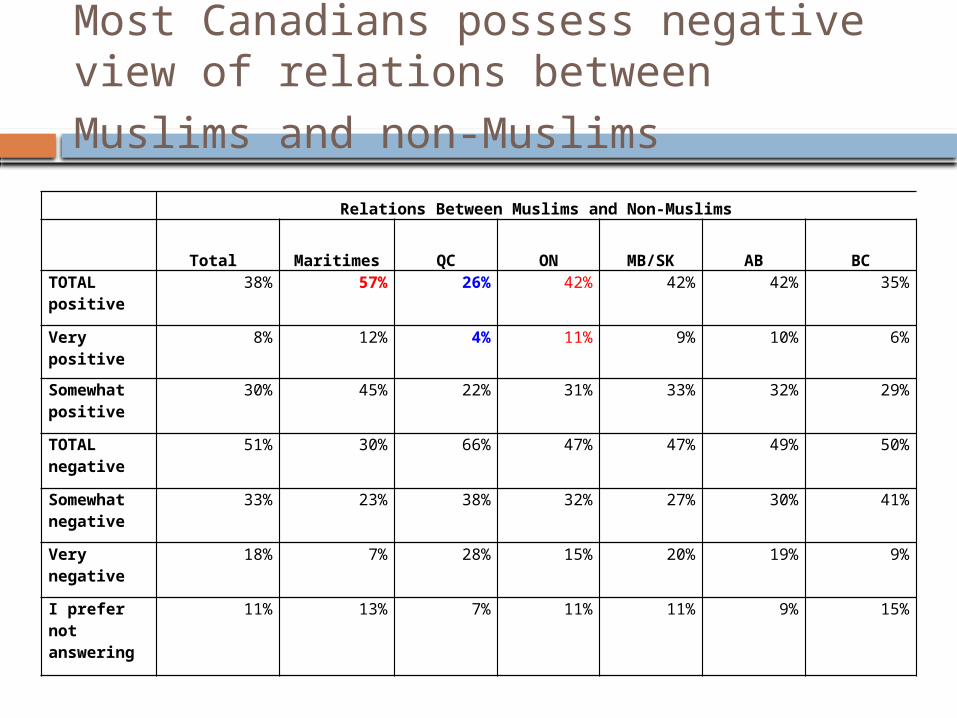
Most Canadians possess negative view of relations between Muslims and non-Muslims
Relations Between Muslims and Non-Muslims
Total Maritimes QC ON MB/SK AB BCTOTAL positive
38% 57% 26% 42% 42% 42% 35%
Very positive 8% 12% 4% 11% 9% 10% 6%
Somewhat positive
30% 45% 22% 31% 33% 32% 29%
TOTAL negative
51% 30% 66% 47% 47% 49% 50%
Somewhat negative
33% 23% 38% 32% 27% 30% 41%
Very negative 18% 7% 28% 15% 20% 19% 9%
I prefer not answering
11% 13% 7% 11% 11% 9% 15%

Young people more optimistic around relations between Muslims and non-Muslims
Relations Between Muslims and Non-Muslims
18-24 25-34 35-44 45-54 55-64 65 + French English OtherTOTAL positive
56% 35% 34% 43% 38% 29% 25% 44% 38%
Very positive 24% 4% 7% 7% 5% 8% 5% 9% 10%
Somewhat positive
32% 31% 27% 35% 34% 22% 20% 35% 28%
TOTAL negative
31% 51% 54% 47% 53% 64% 66% 46% 52%
Somewhat negative
20% 37% 41% 30% 30% 38% 38% 31% 34%
Very negative 11% 14% 14% 17% 24% 26% 28% 14% 17%
I prefer not answering
13% 14% 12% 11% 8% 7% 9% 11% 10%

Those who were the most likely to have heard negative comments about Muslims were the most likely to hold negative opinions about them. But those with moderate exposure to such comments held negative views to the same degree as those who heard very little negative remarks about Muslims.
Do you have a very positive, somewhat positive, somewhat negative or very negative opinion of the
following: / Muslims
I have heard negative
comments about
Muslims in the past
yearSomewhat negative Very negative Total Negative
Strongly agree 33.2% 22.6% 55.8%
Somewhat agree 29.6% 7.3% 36.9%
Somewhat disagree 17.3% 12.5% 29.8%
Strongly disagree 18.4% 17.3% 35.7%

I have heard negative comments about Muslims in the past year
Strongly agree
Somewhat agree
Somewhat disagree
Strongly disagree
Age 43.5% 38.8% 11.1% 6.5% 100.0%
18-24 years of age 48.9% 38.3% 6.1% 6.7% 100.0%
25-34 years of age 45.3% 38.1% 12.6% 4.0% 100.0%
35-44 years of age 37.2% 38.3% 18.5% 6.0% 100.0%
45-54 years of age 38.6% 41.5% 9.2% 10.8% 100.0%
55-64 years of age 44.9% 33.0% 15.4% 6.6% 100.0%
65-74 years of age 46.3% 45.8% 4.9% 3.0% 100.0%
Negative comments about Muslims have been heard to roughly equal degrees across the age spectrum

When comparing the provinces, it is British Columbians that are least likely to report that they heard negative comments about Muslims with residents of Saskatchewan most likely to have heard them.
I have heard negative comments about Muslims in the past year
Strongly agree
Somewhat agree
Somewhat disagree
Strongly disagree
Alberta 46.2% 41.0% 10.3% 2.6% 100.0%
British Columbia 34.0% 46.8% 15.8% 3.4% 100.0%
Manitoba 40.0% 34.5% 7.3% 18.2% 100.0%
New Brunswick 41.7% 33.3% 11.1% 13.9% 100.0%
Nova Scotia 44.4% 20.0% 15.6% 20.0% 100.0%
Ontario 43.0% 39.2% 11.6% 6.1% 100.0%
Quebec 48.8% 37.7% 7.4% 6.1% 100.0%
Saskatchewan 55.3% 34.0% 4.3% 6.4% 100.0%

Quebecers most negative about relations between Jews and non-Jews
Relations Between Jews and Non-Jews
Total Maritimes QC ON MB/SK AB BC
TOTAL positive
59% 67% 38% 67% 61% 63% 64%
Very positive
15% 23% 6% 19% 14% 18% 13%
Somewhat positive
44% 43% 32% 49% 47% 45% 51%
TOTAL negative
30% 20% 52% 23% 26% 31% 21%
Somewhat negative
23% 18% 36% 18% 20% 22% 20%
Very negative
7% 2% 16% 5% 6% 9% 1%
I prefer not answering
10% 13% 9% 10% 13% 6% 15%

Young Canadians somewhat less likely to be
positive about relations between Jews and non-Jews
Relations Between Jews and Non-Jews
18-24 25-34 35-44 45-54 55-64 65 + FrenchEnglis
h OtherTOTAL positive
69% 50% 55% 57% 59% 68% 39% 67% 62%
Very positive
23% 13% 12% 14% 11% 19% 8% 17% 17%
Somewhat positive
46% 37% 43% 44% 48% 49% 31% 50% 45%
TOTAL negative
19% 36% 31% 31% 34% 28% 51% 23% 27%
Somewhat negative
9% 30% 25% 23% 24% 22% 35% 19% 21%
Very negative
10% 6% 6% 7% 10% 6% 16% 5% 7%
I prefer not answering
11% 14% 14% 12% 7% 4% 10% 10% 11%
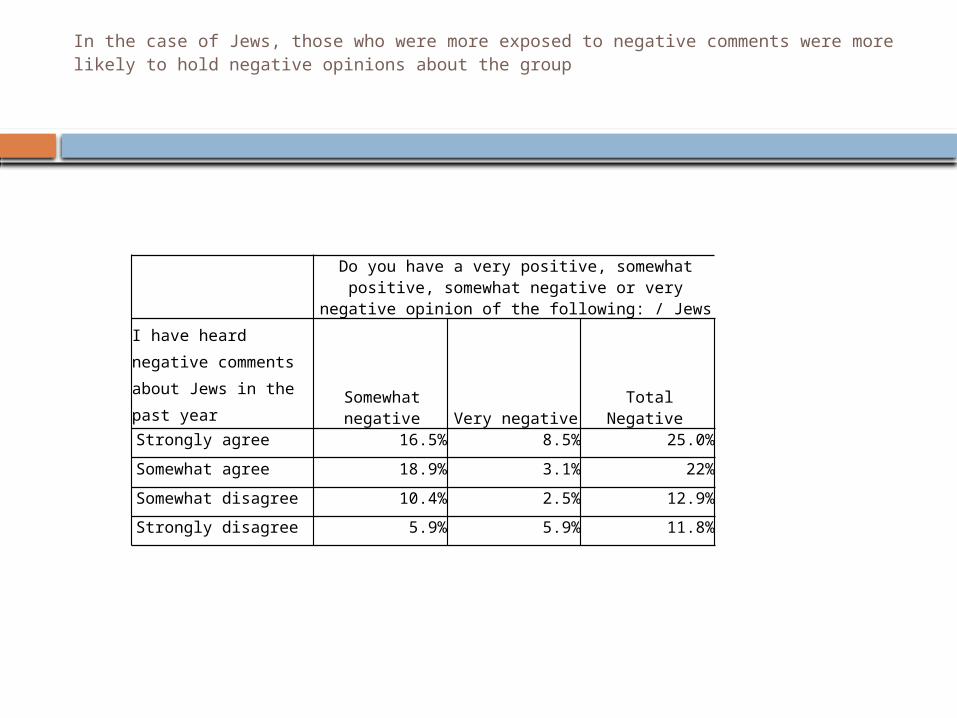
In the case of Jews, those who were more exposed to negative comments were more likely to hold negative opinions about the group
Do you have a very positive, somewhat positive, somewhat negative or very negative opinion of the
following: / Jews
I have heard negative
comments about Jews in
the past year Somewhat negative Very negative Total Negative
Strongly agree 16.5% 8.5% 25.0%
Somewhat agree 18.9% 3.1% 22%
Somewhat disagree 10.4% 2.5% 12.9%
Strongly disagree 5.9% 5.9% 11.8%

In the case of Jews, it is the youngest cohort that is somewhat more exposed to negative remarks.
I have heard negative comments about Jews in the past year
Strongly agree
Somewhat agree
Somewhat disagree
Strongly disagree
Age 24.7% 34.4% 26.4% 14.5% 100.0%
18-24 years of age 34.8% 30.9% 18.0% 16.3% 100.0%
25-34 years of age 25.1% 33.2% 31.6% 10.1% 100.0%
35-44 years of age 25.9% 29.3% 30.0% 14.8% 100.0%
45-54 years of age 24.1% 32.9% 24.4% 18.6% 100.0%
55-64 years of age 23.5% 31.4% 31.9% 13.3% 100.0%
65-74 years of age 13.9% 51.5% 19.8% 14.9% 100.0%

Manitobans were least likely to hear negative remarks about Jews which was most common in Quebec
I have heard negative comments about Jews in the past yearStrongly
agreeSomewha
t agreeSomewhat disagree
Strongly disagree
Total
Alberta 23.7% 39.7% 25.6% 10.9% 100.0%
British Columbia 15.3% 28.6% 39.4% 16.7% 100.0%
Manitoba 11.1% 25.9% 37.0% 25.9% 100.0%
New Brunswick 22.2% 30.6% 22.2% 25.0% 100.0%
Nova Scotia 28.3% 21.7% 17.4% 32.6% 100.0%
Ontario 26.1% 33.2% 26.6% 14.1% 100.0%
Quebec 30.1% 40.6% 18.2% 11.0% 100.0%
Saskatchewan 21.7% 41.3% 28.3% 8.7% 100.0%