Identity and environmentalism: the influence of community ...
26
Munich Personal RePEc Archive Identity and environmentalism: the influence of community characteristics Owen, Ann L. and Videras, Julio and Wu, Stephen Hamilton College 8 December 2008 Online at https://mpra.ub.uni-muenchen.de/12054/ MPRA Paper No. 12054, posted 11 Dec 2008 09:24 UTC
Transcript of Identity and environmentalism: the influence of community ...
Munich Personal RePEc Archive
Identity and environmentalism: the
influence of community characteristics
Owen, Ann L. and Videras, Julio and Wu, Stephen
Hamilton College
8 December 2008
Online at https://mpra.ub.uni-muenchen.de/12054/
MPRA Paper No. 12054, posted 11 Dec 2008 09:24 UTC
Identity and Environmentalism: The Influence of Community Characteristics
Ann L. Owen
Julio Videras
Stephen Wu
Hamilton College
December 2008
Abstract
This paper examines the influence of community characteristics on self-proclaimed
environmentalism. We find that the composition of a community affects the likelihood that a
person claims to be a strong environmentalist, even after controlling for individual characteristics
and pro-environment behaviors. Individuals are more likely to definitely agree they are strong
environmentalists if they live in areas where a large share of the population has post-graduate
degrees and if they live in heavily Democratic areas or heavily Republican areas. These
community effects occur only when individuals are predisposed to take on an environmental
identity.
Ann L. Owen Julio Videras Stephen Wu
Department of Economics Department of Economics Department of Economics
Hamilton College Hamilton College Hamilton College
198 College Hill Road 198 College Hill Road 198 College Hill Road
Clinton, NY 13323 Clinton, NY 13323 Clinton, NY 13323
1 Introduction
In the past three decades, surveys have consistently shown that environmental problems are a
cause of public concern (Guber, 2003) while recent opinion polls indicate that energy policy and
climate change have become important issues for American voters (Bannon et al., 2007).
Investigating the socioeconomic profile of self-proclaimed environmentalists can provide
insights into the likelihood that changes in social norms and economic conditions will influence
behaviors leading to sustainable consumption.1 In this paper, we examine whether the
ideological composition of a community influences an individual’s propensity to identify as an
environmentalist. In order to study the link between a community’s ideology and self-
proclaimed environmentalism we focus on two characteristics that typically correlate with pro-
environment attitudes and efforts: political preferences and education levels. Using data from a
nationally representative household survey and the Census, we estimate multinomial probit
models and show a correlation between a person’s self-proclaimed environmentalism and
educational attainment at the zip-code level and between environmentalism and political
preferences at the county level, even after controlling for individual factors and the frequency of
pro-environment behaviors.
Recent advances in economic research on identity and, in particular, work by Akerlof and
Kranton, motivate this research. Akerlof and Kranton (2000, 2005) argue that individuals gain
utility when they behave according to the prescribed behavior that their social categories and
particular situations require. In addition, identity is not a fixed stable construct, but situation-
1 There is evidence that self-proclaimed environmentalism is not simply a label but has practical consequences.
Kahn (2007) finds that communities in California with a higher proportion of Green Party registered voters exhibit
higher frequencies of pro-environment behaviors. Using survey data, Owen, Videras, and Wu (2008) find that
environmentalism is a strong predictor of individual pro-environment efforts. In contrast, using a sample of
households in Norway, Holden (2004) finds that households do not have a smaller ecological footprint because of
their membership in an environmental organization.
2
dependent. That is, individuals have multiple “selves” and different situations and social context
determine which self individuals subscribe to. In this way, the social context can influence
individuals’ identity through the internalization of their reference group’s preferences. The
environmental psychology literature also investigates the importance of community factors in
shaping personal values and behaviors towards the natural environment. Kempton and Holland
(2003) find that engagement in pro-environment practices requires the person’s self-
identification as an actor while Opotow and Brook (2003) argue that such identification, an
individual’s environmental identity, is shared socially.
Research in social psychology and sociology motivate two specific hypotheses in this
paper about how group characteristics might be related to an individual’s sense of self. First,
there is evidence that individuals are more likely to associate with others who are like them, what
researchers call homophily. McPherson, Smith-Lovin and Cook (2001) discuss several studies
that show that individuals with similar demographic characteristics associate with each other.
Our work expands this literature because it suggests that group composition may actually alter
self-perception. Specifically, we show that individuals who live in areas with a very high
proportion of people who are likely to support pro-environment policy (areas where a high
proportion of individuals vote Democrat) are more likely to self-identify as environmentalists
even after controlling for relevant demographic characteristics and, importantly, even after
controlling for pro-environment behaviors that might more objectively define environmentalism.
We examine a second hypothesis advanced initially by McGuire and Padawer-Singer
(1976) and McGuire (1984): the distinctiveness hypothesis. 2 According to this idea, individuals
who have traits that are different from that of the group’s will focus more on those traits when
2 For a more recent discussion of the distinctiveness hypothesis, interested readers should see Leonard, Mehra and
Katerberg (2008).

3
formulating a self-concept. For example, a black woman may be more likely to identify as an
African-American in a group of white women, but when with a group of black men, may be
more likely to identify as a woman. Although much of this work has focused on demographic
characteristics, especially race, our findings also support this idea as we show that individuals are
more likely to report being an environmentalist when they live in a community with a very low
proportion of people who are likely to support pro-environment policy. Therefore, we find
evidence consistent with both the homophily hypothesis and the distinctiveness hypothesis:
individuals who live in either very liberal or very conservative areas are more likely to identify
themselves as strong environmentalists than those living in politically moderate areas.
Because our research explores the links between individual preferences and
characteristics of the community where the individual lives, this paper also relates to the
literature on economic outcomes and social interactions. However, while the relationships we
find are consistent with community characteristics causing self-identification, we cannot prove
causation as our data do not allow us to distinguish among the mechanisms that could explain a
relationship between individual and community characteristics (Manski, 2000).
Finally, this paper contributes to the vast literature on the determinants of
environmentalism. This research usually focuses on the categorization of values and norms and
their influence on attitudes, intentions, and behaviors. (See, among many others, the research by
Thogersen and Olander (2002), Dunlap et al. (2000), and Stern (2000)). In this paper, we
contribute to this literature by focusing on people’s identity as environmentalists and the
influence of community characteristics on an individual’s self-proclaimed environmentalism,
rather than on the set of values that define environmentalism.
4
The paper proceeds as follows. Section 2 presents the data and empirical model. Section
3 discusses the results and section 4 concludes.
2 Data and Empirical Identification
We use data for approximately 1,700 respondents from a nationally representative household
survey conducted in September and October of 2007. The respondents were recruited via
random digit dialing to be part of the Knowledge Networks Internet panel. Knowledge
Networks provides households Internet access to avoid the biased sample that results from
requiring participants to obtain Internet access on their own.3,4
The survey instrument contained
fifty questions.5 The first set of questions asked about general attitudes toward the natural
environment. The second group elicited how frequently individuals engage in pro-environment
behaviors out of concern for the environment. Third, the survey evaluated the respondents’
general knowledge of environmental problems. Finally, the survey asked questions about time
preferences, risk aversion, and attitudes towards free riding. We augment the survey with
respondent demographics and an array of individual characteristics that Knowledge Networks
collects as part of their “public affairs profile,” a series of questions that are asked periodically of
all members of the panel.
3 Internet surveys have several advantages. They allow for more complex questions than can be asked in a telephone
survey and are less likely to be subject to interviewer bias (trying to please the interviewer by responding the “right
way”) than telephone or face-to-face surveys are. See Krosnick and Chang (2001) for a comparison of random digit
dialing telephone interviews, the Knowledge Networks Internet panel, and other Internet panels. Knowledge
Networks does not accept volunteer panelists. 4 The response rate among Knowledge Networks panelists for our survey was 66%. Berrens et al. (2004) also
present results using a survey implemented by Knowledge Networks (KN) on willingness to pay for climate change
mitigation and Cameron and DeShazo (2001, 2004) show that their KN sample is comparable to data from the 2000
Census. 5 The entire survey as well as more detailed information about the survey methodology can be obtained from
http://www.hamilton.edu/levitt/Sustainability/Environmental_survey_2008.html.

5
We are interested in understanding what factors affect an individual’s self-identification as an
environmentalist. The dependent variable in our models is the answer to the question of whether
or not individuals considered themselves to be environmentalists. The possible responses are
“no,” “yes, somewhat,” and “yes, definitely.” Approximately eight percent of individuals in the
sample say they are definitely environmentalists. Forty-nine percent answer “yes, somewhat”
and forty-three percent say they are not environmentalists. Although researchers typically use a
binary classification for environmentalism, we find interesting results when we treat this variable
as a three-category response. Although this dependent variable is ordered, we estimate a
multinomial probit given that we reject the assumption of parallel regression at a 5% significance
level.
Our respondents answered the same question approximately six months before they
completed our survey, as part of Knowledge Networks’ public affairs profile. We repeated the
question to explore whether individuals might want to appear to have the “right” attitudes in our
survey. We find that only seven people who said they were definitely not an environmentalist
six months earlier claim to definitely be an environmentalist in our survey. On the other hand,
there are 96 individuals who claimed to be strong environmentalists in the Knowledge Networks’
public affairs profile whose answer in our survey was “yes, somewhat” (87 respondents) or “no”
(9 respondents). Thus, with regard to self-proclaimed environmentalism, our responses are more
conservative than those in the Knowledge Networks’ public affairs profile. We hypothesize that
taking a survey specifically on environmental issues might have made respondents more
thoughtful about their identity as an environmentalist. It is also worth noticing that self-
proclaimed environmentalism correlates strongly with responses to attitudinal questions about

6
the natural environment and actual pro-environment efforts. Overall, we believe our dependent
variable is a reliable measure of the respondents’ environmental identity.6
As we mention above, our main hypothesis is that the ideological composition of a
community might influence an individual’s propensity to identify as an environmentalist. To
measure a community’s ideology we focus on political preferences and educational attainment.
We use Census data at the zip-code level to calculate the share of individuals (25 years of age
and older) with a postgraduate degree. We use county-level voting data from the 2004
presidential election to compute aggregate political preferences.7 To examine the distinctiveness
and homophily hypotheses, we proxy political preferences with the variables low_kerry and
high_kerry. The variable low_kerry takes on the value of 1 if the respondent lives in a county
where the Democratic candidate, John Kerry, received less than 40 percent of the votes;
high_kerry that takes on the value of 1 for those living in counties that had a percentage of Kerry
supporters over 60 percent in 2004.8,9
One advantage of using data at these levels of aggregation
is that statistically significant effects due to self-selection are less likely than if we defined
“community” at a much finer level: individuals are less likely to self-select into counties than
into census blocks, for example. On the other hand, it might be more difficult to find an effect of
ideological composition on an individual’s environmental identity.
Naturally, individuals who live in highly Democratic areas, for example, are much more
likely to be Democrats themselves. Thus, we need controls for personal political preferences and
education. We use seven categories for education (high-school dropout is the default). We also
6 Nonetheless, when we use the earlier response to the question about environmentalism, the nature of our results is
similar, although the coefficients are estimated less precisely. 7 The data come from www.uselectionatlas.org. 8 The omitted category is those living in areas that are politically more moderate (where Kerry received between 40-
60 percent of the 2004 presidential vote). 9 We find qualitatively similar results when using a specification that includes a quadratic for the percentage of the
Kerry vote (a linear and a squared term).

7
include a variable that indicates a respondent’s political preferences: the variable democrat takes
on the value of 1 for “Strong Republican” and on the value of 5 for “Strong Democrat.”
Other controls include household size, age and age squared, and dichotomous variables for
gender, married respondents, an interaction between gender and marital status, homeowners, and
African-Americans and Hispanics. These individual characteristics influence identity, may be
related to values toward the environment, and are also likely correlated with education levels and
political preference. We also include the log of household income at the census block level, the
fraction of the population in the respondent’s zip code that is classified as being in an urban area,
the percent of homeowners in the respondent’s zip code, and regional dummies. Descriptive
statistics appear in Table 1.
3 Results
In this section, we present results from multinomial probit regression models estimating the
likelihood that respondents claim to be strong environmentalists or not environmentalists,
relative to those individuals who claim to be “somewhat” environmentalists. Secondly, we
present descriptive statistics that suggest community factors matter only for those individuals
who are predisposed to claim an environmental identity. Finally, we investigate this finding
more systematically by estimating multinomial probit models that use a split sample.
Before discussing the results, it is worth noticing that although the dependent variable is
ordered, we obtain richer and sharper results when we estimate a multinomial probit model
rather than an ordered probit, even though the main conclusions are the same with either
8
procedure. Furthermore, we reject (at a 5% significance level) the assumption of parallel
regression that is necessary for the ordered probit model. 10
The dependent variable measures the degree to which respondents agree to the following
question, “Would you describe yourself as an environmentalist?” Respondents may choose “yes,
definitely”, “yes, somewhat”, or “no”. Table 2a shows the coefficient estimates when estimating
the probability of “yes, definitely”, relative to the base case of “yes, somewhat.” The first
regression in column 1 includes individual controls only. We find that race and political leaning
are significant predictors of being a strong environmentalist. African Americans and Hispanics
are less likely to claim to be strong environmentalists. Also, the more individuals lean towards
describing themselves as a strong Democrat, the more likely they are to be strong
environmentalists.
The second column of Table 2a shows the results for a regression that includes community
characteristics only. We find that those who live in zip codes that have a higher percentage of
people with post-graduate degrees and those living in areas that had a high percentage of Kerry
supporters (over 60 percent) in 2004 are significantly more likely to be strong environmentalists
than weak environmentalists, holding other community characteristics constant. In results not
shown in the tables, the marginal effects imply that living in a highly democratic zip code is
associated with an increase in the probability of being a strong environmentalist by 5.5
percentage points. This is unsurprising because those living in highly Democratic areas are
much more likely to be Democrats themselves and those in areas with higher levels of education
are more likely to have higher levels of income and education as well. It is interesting that there
10 Although the sampling strategy employed was an equal-probability design which theoretically should have
produced a sample that was self-weighting, throughout our analysis we use population weights that are calculated
based on respondents demographic characteristics (e.g., race, age, gender, education). See the survey documentation
for a more thorough discussion of this issue at:
http://www.hamilton.edu/levitt/Sustainability/Environmental_survey_2008.html

9
is also a positive coefficient on low_kerry, an indicator variable for those living in areas where
Kerry received less than 40 percent of the votes. This coefficient, however, is statistically
insignificant.11
Column three of Table 2a includes community and individual characteristics. Individual
political preferences correlate with being a strong environmentalist, though this coefficient is
now significant at the 10 percent level. We also find that those living in communities with a
high percentage of people with a post graduate education and those living in areas that are highly
Democratic are more likely to be strong environmentalists. A calculation of marginal effects
shows that a 10 percentage point increase in the number of people with an advanced degree in a
given zip code implies a 2.1 percentage point increase in the probability of being a strong
environmentalist. The analogous marginal effect for living in a very Democratic area is 5.3
percentage points. These results hold up even after we include a control for the individual’s
level of education and political preference. Perhaps those who live in highly Democratic areas
are more likely to be fervent environmentalists due to the presence of other like-minded citizens.
Why else might self-proclaimed environmentalism relate to community characteristics?
Might there be community effects that influence actual pro-environmental behaviors and,
indirectly, one’s environmentalism? To examine this issue, the fourth column of Table 2a
includes an index of pro-environmental behaviors. The survey asks how often people engage in
recycling, altering food consumption, conserving gas, conserving energy use at home, buying
environmentally friendly products, contribute to environmental organizations, and suggest to
friends or relatives to alter their behavior. Respondents answer either “nearly all the time,
frequently, occasionally, or never” for each of these activities. We use an index that linearly
11 The omitted category is those living in areas that are politically more moderate (where Kerry received between
40-60 percent of the 2004 presidential vote).
10
sums the scores of each individual response (using a 0-3 scale).12
We cannot interpret the
estimate on this control causally as individuals who claim to be environmentalists are much more
likely to engage in pro-environmental behaviors. The goal of this exercise is to explore whether
there are statistically significant predictors of being an environmentalist even after controlling for
an objective measure of actual pro-environment efforts.
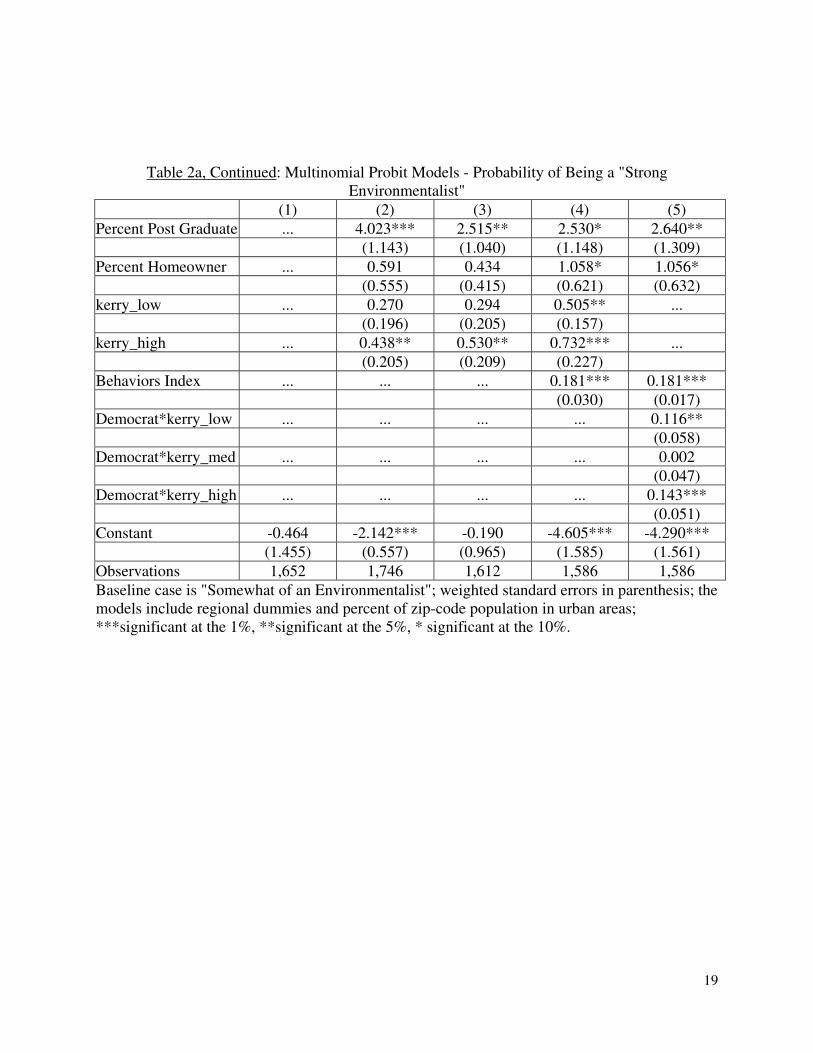
The results in the fourth column show that, as expected, the index of pro-environmental
behaviors is strongly correlated with being an environmentalist. More interesting is the fact that
while personal political preference is no longer significant, county-level political preference
remains a significant predictor of being a strong environmentalist. After controlling for
individual characteristics, those respondents living in very highly Democratic areas or very
highly Republican areas are more likely to claim to be environmentalists, relative to those that
live in more moderate areas (both of these coefficients are statistically significant). Thus,
personal political preferences have an indirect effect on identity (via actual pro-environment
efforts) while community preferences have a direct effect on the likelihood of claiming to be an
environmentalist. It is striking that those living in very highly Republican areas are also more
likely to be strong environmentalists, after controlling for personal political affiliation and
education level. These results indicate that individuals are more likely to be strong
environmentalists when a large percentage of their peers are either very similar or very different
to them. The effect of community political preferences is weakest for those living in more
moderate areas. In addition, living in an area with a high percentage of people with post-
graduate degrees increases the likelihood of claiming to be an environmentalist, ceteris paribus.
12 We also repeated all regressions with separate indices for each pro-environmental behavior but found that results
were not sensitive.

11
In sum, these results show that being an environmentalist does not merely reflect how much
individuals engage in pro-environmental behaviors, but involves the degree to which they
identify themselves for a particular cause. For two individuals who engage in the same
frequency of pro-environmental behaviors, those who live in highly Democratic or highly
Republican communities are more likely to claim to be strong environmentalists, relative to those
living in politically moderate areas.
Next, we examine whether there is an interaction between being a Democrat and the effects
of living in strongly Democratic and strongly Republican areas. In this regression, we use three
interaction variables, democrat*kerry_low, democrat*kerry_med, and democrat*kerry_high.
The results in column 5 show that democrat*kerry_low and democrat*kerry_high are
statistically significant, while the democrat*kerry_med variable is insignificant. Being a
Democrat significantly affects the likelihood of being a strong environmentalist only for those
living in highly Republican and highly Democratic areas.
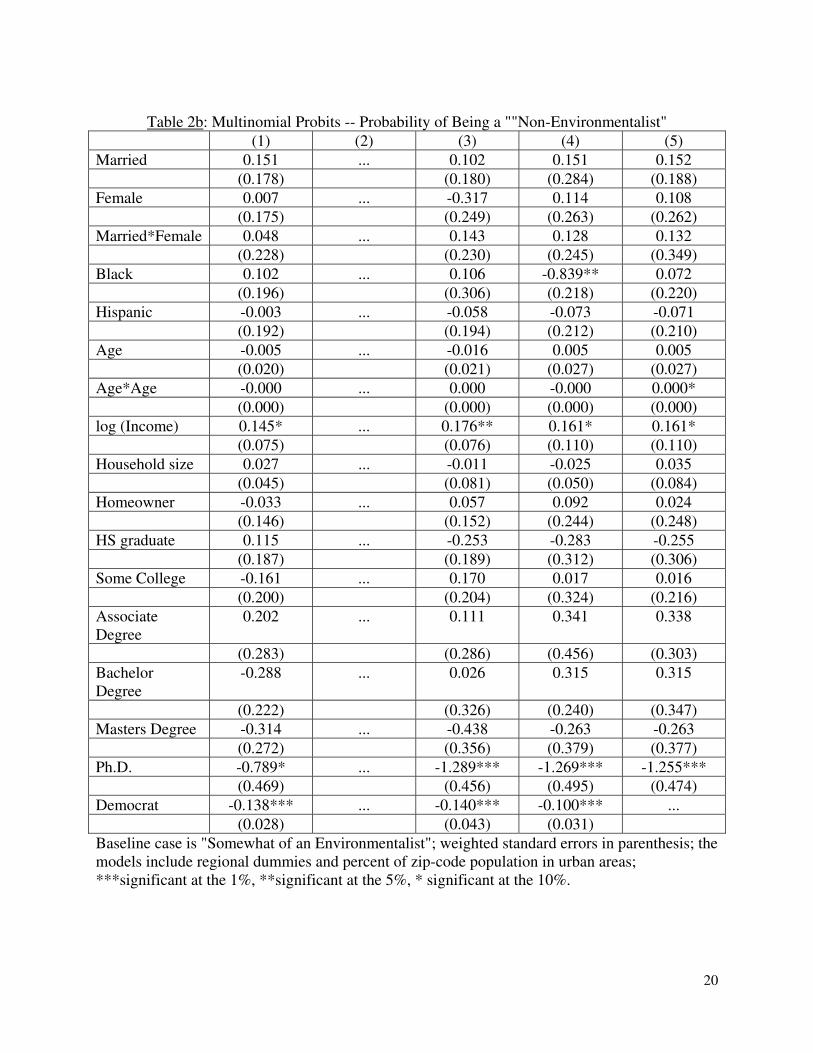
Table 2b presents the results when we estimate the likelihood of being a non-
environmentalist relative to the baseline case of “somewhat of an environmentalist.” Column 1
of Table 2b shows results when we include only individual characteristics. We find that the
more individuals lean toward being a Democrat, the less likely they are to be non-
environmentalists. In addition, those with a doctoral degree are less likely to be non-
environmentalists, though this coefficient is only significant at the 10 percent level. The second
column of this table shows results for a model that includes community characteristics only. We
find that those living in areas with a low percentage of Kerry supporters are more likely to be
non-environmentalists, but no other coefficients are statistically significant.

12
In column 3, we include individual and community characteristics. Leaning Democrat is still
negatively related to the probability of being a non-environmentalist. Now the doctoral degree
coefficient is significant at the 1 percent level, and those with higher incomes are more likely to
be non-environmentalists. However, none of the community characteristics significantly affect
the probability of being a non-environmentalist. When we include an index of pro-environmental
behaviors, we find that the index strongly correlates with being a non-environmentalist. In the
last column of Table 3b, we find that the three interaction terms democrat*kerry_low,
democrat*kerry_med, and democrat*kerry_high are significant predictors of being a non-
environmentalist. T-tests show that the effects of leaning Democrat on the probability of being a
non-environmentalist are the same for individuals living in politically liberal, conservative, and
moderate communities.
The results in Tables 2a and 2b indicate that there are differences in the impact of community
factors when comparing the change from being a non-environmentalist to a weak
environmentalist and the change from being a weak environmentalist and a strong
environmentalist. The education level and political climate of one’s community strongly
influences the likelihood of being a strong environmentalist, relative to a weak environmentalist,
but does not affect the probability of being a non-environmentalist versus a weak
environmentalist. In addition, we find that being a Democrat significantly affects the likelihood
of being a strong environmentalist for those living in either highly Republican or highly
Democratic areas.
The distinctiveness and homophily hypotheses suggest that community factors may
accentuate existing individual characteristics either because these characteristics are in contrast
to those held by the community or because they are similar. Therefore, it is worth investigating
13
whether the effects of community characteristics are only relevant for those who may be
predisposed to identify as environmentalists.
Table 3 is a first step towards examining this issue, presenting the cross-tabulation between
the percent of Democratic respondents who identify as environmentalists and community
characteristics. The first panel of Table 3 shows those who say they “lean Democrat,” are
Democrats, or are “strong Democrats.” The bottom panel shows those who are “strong
Democrats.” Given that Democrats may be more predisposed to environmentalism than others,
these statistics suggest that the effects of community characteristics is strongest when living in an
area that is populated with people who have either very similar political views or very different
political views, with a larger percent of the Democrats being more likely to declare themselves to
be strong environmentalists either when they live in highly Republican areas or highly
Democratic areas.
We follow up more systematically on these findings by estimating multinomial probit models
using a split sample. We estimate each regression on a sub-sample of Democrats and a second
sub-sample of Republicans and Independents. Tables 4a and 4b present the results. As
expected, the results in Table 4a show that community characteristics do influence those who are
predisposed to identifying as environmentalists, Democrats, but do not matter for Republicans
and Independents. Those Democrats who live in either highly Democratic areas or those who
live in highly Republican areas are both more likely to identify themselves as strong
environmentalists, relative to those living in politically moderate areas. Consistent with
previous findings, the results in Table 4b do not provide evidence that community characteristics
determine a distinction between those who are not environmentalists and those who are weak
environmentalists.

14
These split-sample results serve as a falsification test and strengthen our conclusions because
the effects of community characteristics exist only if individuals are more likely to support pro-
environment policy and may be predisposed to identifying as environmentalists. Thus, we find
evidence for community effects when we should and do not find evidence when we should not,
mitigating concerns that our correlations can be attributed to other factors.
4 Conclusion
Our results document a relationship between individual identity and community characteristics.
We find that living in an area in which others either share your values or have very different
values accentuate an individual’s identification as a strong environmentalist. Although an
interesting feature of our results is that identity as an environmentalist is not exclusively related
to pro-environment efforts, it is also the case that people who identify as environmentalists
engage in more pro-environment behaviors on average than those who do not. Thus, these
results suggest that objectively measured behaviors do not completely determine identity. This
paper suggests that community composition is an important link in understanding the evolution
of environmentalism and social norms that might be conducive to sustainability.

15
References
Akerlof, George A., and Rachel E. Kranton, 2000, “Economics and Identity” the Quarterly
Journal of Economics,
115(3): 715-753.
Akerlof, George A., and R.E. Kranton, 2005, “Identity and the Economics of Organizations,” the
Journal of Economic Perspectives, 19(1): 9-32.
Bannon, Brent, DeBell, Matthew, Krosnick, Jon A., Kopp, Ray, and Peter Aldhous, 2007,
“America’s Evaluations of Policies to Reduce Greenhouse Gas Emissions,” manuscript.
Berrens, Robert P., Alok K. Bohara, Hank C. Jenkins-Smith, Carol L. Silva, and David L.
Weimer, 2004, “Information and effort in contingent valuation surveys: application to global
climate change using national internet samples,” Journal of Environmental Economics and
Management, 47: 331-363.
Cameron, Trudy Ann and J.R. DeShazo, 2004, “An Empirical Model of Demand for Future
Health States when Valuing Risk-Mitigating Programs,” University of Oregon, mimeo.
DeShazo, J. R., Trudy A. Cameron, and Manrique Saenz, 2001, “Test of Choice Set
Misspecification for Discrete Models of Consumer Choice,” University of Oregon, mimeo.
Dunlap, Riley E., Van Liere, Kent D., Mertig, Angela G., and Robert Emmet Jones, 2000,
“Measuring endorsement of the New Ecological Paradigm: A revised NEP scale,” Journal of
Social Issues, 56(3): 425-442.
Holden, Erling, 2004, “Towards sustainable consumption: Do green households have smaller
ecological footprints?” International Journal of Sustainable Development, 7(1): XXXX.
Kahn, Matthew E., 2007, “Do Greens drive Hummers or Hybrids? Environmental Ideology as a
Determinant of Consumer Choice” Journal of Environmental Economics and Management, 54:
129-145
Kempton, Willet, and Dorothy C. Holland, 2003, “Identity and sustained environmental
practice,” in Identity and the Natural Environment, S. Clayton and S. Opotow, Eds., The MIT
Press, Cambridge, Massachusetts.
Kotchen, M. and Moore, M., 2007, “Private Provision of Environmental Public Goods:
Household Participation in Green-Electricity Programs” Journal of Environmental Economics
and Management, 53:1-16.
Krosnick, John A. and LinChiat Chang, 2001, “A comparison of the random digit dialing
telephone survey methodology with Internet survey methodology as implemented by Knowledge
Networks and Harris Interactive,” Ohio State University, mimeo.
16
Guber, Deborah Lynn, 2003, "The Grassroots of a Green Revolution: Polling America on the
Environment," The MIT Press, Cambridge, Massachusetts.
Leonard, Ana S., Ajay Mehra, and Ralph Katerberg, 2008, “The social identity and social
networks of ethnic minority groups in organizations: a crucial test of distinctiveness theory,”
Journal of Organizational Behavior 29: 573-589.
Manski, Charles F., 2000, “Economic analysis of social interactions,” Journal of Economic
Perspectives, 14 (3): 115-136.
McGuire, W.J., 1984, “Search for self: Going beyond self-esteem and the reactive self” in R. A.
Zukcer, J. Aronoff, and A.I. Rabin (editors), Personality and the prediction of behavior (New
York: Academic Press): 73-120.
McGuire, W. J. and Padawer-Singer, A., 1976, “Trait salience in the spontaneous self-concept,”
Journal of Personality and Social Psychology, 33: 743-754.
McPherson, M., L. Smith-Lovin, and J.M. Cook, 2001, “Birds of a feather: Homophily in social
networks” Annual Review of Sociology 27: 415-439.
Opotow, Susan, and Amara Brook, 2003, “Identity and exclusion in rangeland conflict,” in
Identity and the Natural Environment, S. Clayton and S. Opotow, Eds., The MIT Press,
Cambridge, Massachusetts.
Owen, Ann L., Julio Videras, and Stephen Wu, 2008, “More information isn’t always better:
The case of the voluntary provision of environmental quality,” Hamilton College Sustainability
Program Working paper #2008-1.
Thogersen, John, and Folke Olander, 2002, “Human values and the emergence of a sustainable
consumption pattern: A panel study,” Journal of Economic Psychology, 23(5): 605-630.
Stern, Paul C., 2000, “Toward a coherent theory of environmentally significant behavior,”
Journal of Social Issues, 56(3): 407-424.

17
Table 1: Summary Statistics
Variable Mean Std. Dev.
Strongenvironmentalist 0.08 0.26
Somewhat environmentalist 0.49 0.50
Not environmentalist 0.43 0.50
Married 0.58 0.49
Female 0.52 0.50
African American 0.10 0.30
Hispanic 0.11 0.32
Age 47.67 16.81
Log HH Inc (census block) 10.53 0.96
Household Size 2.58 1.40
Homeowner 0.69 0.46
High School Graduate 0.30 0.46
Some College 0.21 0.41
Associate Degree 0.06 0.24
Bachelor Degree 0.17 0.38
Post Graduate Degree 0.10 0.31
Index of Political Affiliation 4.21 2.15
Behaviors Index: Index of
Pro-Environmental Behaviors
9.70 4.25
Proportions by Zip Code:
Post Graduate Degree 0.08 0.06
Homeowners 0.68 0.17
Live in Urban Area 0.77 0.31
kerry_low: Less than 40%
voted for Kerry
0.29 0.45
kerry_high: Greater than 60%
voted for Kerry
0.20 0.40
Observations 1808

18
Table 2a: Multinomial Probit Models - Probability of Being a "Strong Environmentalist"
(1) (2) (3) (4) (5)
Married 0.054 ... -0.022 0.177 0.168
(0.274) (0.279) (0.188) (0.284)
Female -0.195 ... -0.033 -0.245 -0.268
(0.242) (0.176) (0.189) (0.189)
Married*Female 0.084 ... 0.225 -0.032 -0.014
(0.318) (0.327) (0.349) (0.245)
Black -0.798*** ... -0.877*** 0.065 -0.852**
(0.280) (0.207) (0.386) (0.399)
Hispanic -0.469* ... -0.483* -0.687** -0.690**
(0.270) (0.279) (0.301) (0.298)
Age -0.029 ... -0.029 -0.044 -0.044
(0.026) (0.027) (0.021) (0.021)
Age*Age 0.000 ... 0.000 0.000** -0.000
(0.000) (0.000) (0.000) (0.000)
log (Income) -0.067 ... -0.081 -0.106 -0.110
(0.098) (0.102) (0.083) (0.082)
Household size -0.018 ... 0.024 0.035 -0.025
(0.080) (0.047) (0.084) (0.049)
Homeowner -0.004 ... 0.044 0.012 0.091
(0.194) (0.198) (0.163) (0.163)
HS graduate -0.259 ... 0.061 0.119 0.119
(0.269) (0.276) (0.202) (0.202)
Some College 0.224 ... -0.206 0.091 0.097
(0.286) (0.298) (0.216) (0.320)
Associate
Degree
0.299 ... 0.281 0.532 0.527
(0.427) (0.433) (0.303) (0.456)
Bachelor
Degree
0.119 ... -0.374* -0.219 -0.219
(0.317) (0.225) (0.348) (0.240)
Masters Degree 0.520 ... 0.404 0.553 0.563
(0.338) (0.280) (0.291) (0.291)
Ph.D. 0.841* ... 0.541 0.839* 0.881*
(0.458) (0.465) (0.474) (0.496)
Democrat 0.094** ... 0.082* 0.067 ...
(0.041) (0.028) (0.044)
Baseline case is "Somewhat of an Environmentalist"; weighted standard errors in parenthesis; the
models include regional dummies and percent of zip-code population in urban areas; ***
significant at the 1%, **significant at the 5%, * significant at the 10%.
19
Table 2a, Continued: Multinomial Probit Models - Probability of Being a "Strong
Environmentalist"
(1) (2) (3) (4) (5)
Percent Post Graduate ... 4.023*** 2.515** 2.530* 2.640**
(1.143) (1.040) (1.148) (1.309)
Percent Homeowner ... 0.591 0.434 1.058* 1.056*
(0.555) (0.415) (0.621) (0.632)
kerry_low ... 0.270 0.294 0.505** ...
(0.196) (0.205) (0.157)
kerry_high ... 0.438** 0.530** 0.732*** ...
(0.205) (0.209) (0.227)
Behaviors Index ... ... ... 0.181*** 0.181***
(0.030) (0.017)
Democrat*kerry_low ... ... ... ... 0.116**
(0.058)
Democrat*kerry_med ... ... ... ... 0.002
(0.047)
Democrat*kerry_high ... ... ... ... 0.143***
(0.051)
Constant -0.464 -2.142*** -0.190 -4.605*** -4.290***
(1.455) (0.557) (0.965) (1.585) (1.561)
Observations 1,652 1,746 1,612 1,586 1,586
Baseline case is "Somewhat of an Environmentalist"; weighted standard errors in parenthesis; the
models include regional dummies and percent of zip-code population in urban areas;
***significant at the 1%, **significant at the 5%, * significant at the 10%.
20
Table 2b: Multinomial Probits -- Probability of Being a ""Non-Environmentalist"
(1) (2) (3) (4) (5)
Married 0.151 ... 0.102 0.151 0.152
(0.178) (0.180) (0.284) (0.188)
Female 0.007 ... -0.317 0.114 0.108
(0.175) (0.249) (0.263) (0.262)
Married*Female 0.048 ... 0.143 0.128 0.132
(0.228) (0.230) (0.245) (0.349)
Black 0.102 ... 0.106 -0.839** 0.072
(0.196) (0.306) (0.218) (0.220)
Hispanic -0.003 ... -0.058 -0.073 -0.071
(0.192) (0.194) (0.212) (0.210)
Age -0.005 ... -0.016 0.005 0.005
(0.020) (0.021) (0.027) (0.027)
Age*Age -0.000 ... 0.000 -0.000 0.000*
(0.000) (0.000) (0.000) (0.000)
log (Income) 0.145* ... 0.176** 0.161* 0.161*
(0.075) (0.076) (0.110) (0.110)
Household size 0.027 ... -0.011 -0.025 0.035
(0.045) (0.081) (0.050) (0.084)
Homeowner -0.033 ... 0.057 0.092 0.024
(0.146) (0.152) (0.244) (0.248)
HS graduate 0.115 ... -0.253 -0.283 -0.255
(0.187) (0.189) (0.312) (0.306)
Some College -0.161 ... 0.170 0.017 0.016
(0.200) (0.204) (0.324) (0.216)
Associate
Degree
0.202 ... 0.111 0.341 0.338
(0.283) (0.286) (0.456) (0.303)
Bachelor
Degree
-0.288 ... 0.026 0.315 0.315
(0.222) (0.326) (0.240) (0.347)
Masters Degree -0.314 ... -0.438 -0.263 -0.263
(0.272) (0.356) (0.379) (0.377)
Ph.D. -0.789* ... -1.289*** -1.269*** -1.255***
(0.469) (0.456) (0.495) (0.474)
Democrat -0.138*** ... -0.140*** -0.100*** ...
(0.028) (0.043) (0.031)
Baseline case is "Somewhat of an Environmentalist"; weighted standard errors in parenthesis; the
models include regional dummies and percent of zip-code population in urban areas;
***significant at the 1%, **significant at the 5%, * significant at the 10%.

21
Table 2b, Continued: Multinomial Probits -- Probability of Being a ""Non-Environmentalist"
Percent Post
Graduate
... 0.137 0.438 0.580 0.601
(0.924) (1.182) (1.320) (1.136)
Percent Homeowner ... -0.169 -0.776* -0.630 -0.651
(0.368) (0.588) (0.452) (0.448)
kerry_low ... 0.273** 0.186 0.142 ...
(0.133) (0.145) (0.238)
kerry_high ... -0.030 0.079 0.138 ...
(0.150) (0.161) (0.166)
Behaviors Index ... ... ... -0.178*** -0.178***
(0.017) (0.031)
Democrat*kerry_low ... ... ... ... -0.076*
(0.044)
Democrat*kerry_med ... ... ... ... -0.115***
(0.032)
Democrat*kerry_high ... ... ... ... -0.090**
(0.040)
Constant -0.665 -0.005 -0.824 1.740 1.822*
(0.908) (0.359) (1.642) (1.100) (1.094)
Observations 1,652 1,746 1,612 1,586 1,586
Baseline case is "Somewhat of an Environmentalist"; weighted standard errors in parenthesis; the
models include regional dummies and percent of zip-code population in urban areas;
***significant at the 1%, **significant at the 5%, * significant at the 10%.

Table 3: Political Affiliation and Self-Proclaimed Environmentalism
________________________________________________________________________________________________________________________
Highly Republican
Areas Moderate Areas Highly Democratic Areas
Leans democrat, democrat,
(2004 Kerry
Vote<40%) (2004 Kerry Vote 40-60%) (2004 Kerry Vote>60%)
or strong democrat
Frequency Percent Frequency Percent Frequency Percent
Not an environmentalist 93 37.35 183 35.53 92 33.45
Somewhat of an environmentalist 133 53.41 297 57.67 142 51.64
Strong environmentalist 23 9.24 35 6.8 41 14.91
Total 249 100 515 100 275 100
________________________________________________________________________________________________________________________
________________________________________________________________________________________________________________________
Highly Republican
Areas Moderate Areas Highly Democratic Areas
Strong democrat
(2004 Kerry
Vote<40%) (2004 Kerry Vote 40-60%) (2004 Kerry Vote>60%)
Frequency Percent Frequency Percent Frequency Percent
Not an environmentalist 20 31.25 55 31.07 27 26.21
Somewhat of an environmentalist 29 45.31 104 58.76 58 56.31
Strong environmentalist 15 23.44 18 10.17 18 17.48
Total 64 100 177 100 103 100
________________________________________________________________________________________________________________________
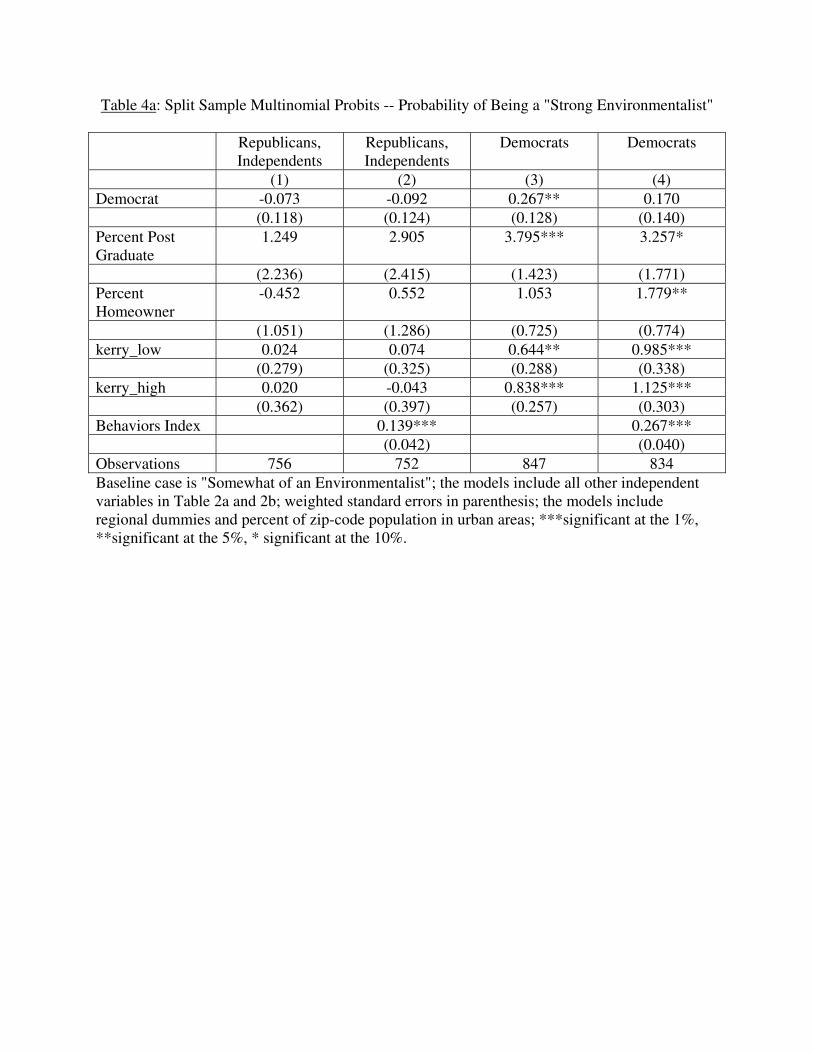
Table 4a: Split Sample Multinomial Probits -- Probability of Being a "Strong Environmentalist"
Republicans,
Independents
Republicans,
Independents
Democrats Democrats
(1) (2) (3) (4)
Democrat -0.073 -0.092 0.267** 0.170
(0.118) (0.124) (0.128) (0.140)
Percent Post
Graduate
1.249 2.905 3.795*** 3.257*
(2.236) (2.415) (1.423) (1.771)
Percent
Homeowner
-0.452 0.552 1.053 1.779**
(1.051) (1.286) (0.725) (0.774)
kerry_low 0.024 0.074 0.644** 0.985***
(0.279) (0.325) (0.288) (0.338)
kerry_high 0.020 -0.043 0.838*** 1.125***
(0.362) (0.397) (0.257) (0.303)
Behaviors Index 0.139*** 0.267***
(0.042) (0.040)
Observations 756 752 847 834
Baseline case is "Somewhat of an Environmentalist"; the models include all other independent
variables in Table 2a and 2b; weighted standard errors in parenthesis; the models include
regional dummies and percent of zip-code population in urban areas; ***significant at the 1%,
**significant at the 5%, * significant at the 10%.
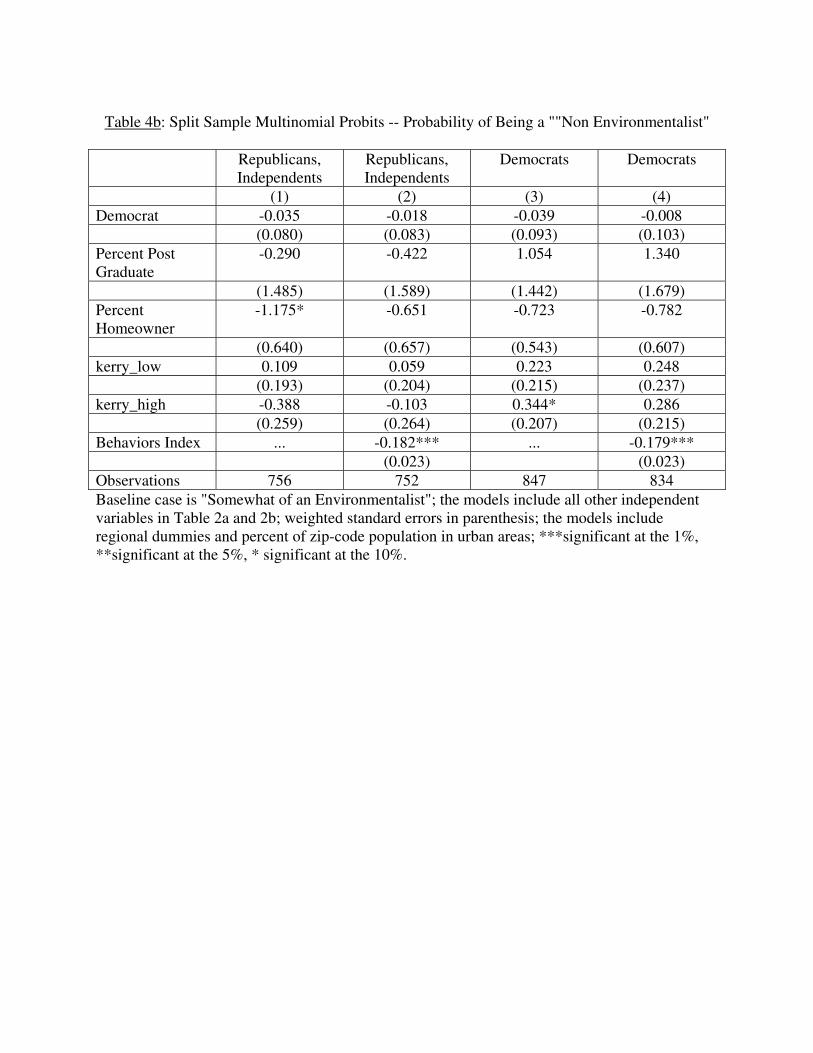
Table 4b: Split Sample Multinomial Probits -- Probability of Being a ""Non Environmentalist"
Republicans,
Independents
Republicans,
Independents
Democrats Democrats
(1) (2) (3) (4)
Democrat -0.035 -0.018 -0.039 -0.008
(0.080) (0.083) (0.093) (0.103)
Percent Post
Graduate
-0.290 -0.422 1.054 1.340
(1.485) (1.589) (1.442) (1.679)
Percent
Homeowner
-1.175* -0.651 -0.723 -0.782
(0.640) (0.657) (0.543) (0.607)
kerry_low 0.109 0.059 0.223 0.248
(0.193) (0.204) (0.215) (0.237)
kerry_high -0.388 -0.103 0.344* 0.286
(0.259) (0.264) (0.207) (0.215)
Behaviors Index ... -0.182*** ... -0.179***
(0.023) (0.023)
Observations 756 752 847 834
Baseline case is "Somewhat of an Environmentalist"; the models include all other independent
variables in Table 2a and 2b; weighted standard errors in parenthesis; the models include
regional dummies and percent of zip-code population in urban areas; ***significant at the 1%,
**significant at the 5%, * significant at the 10%.