Identifying Scotomata in Hazard Identification Caused By ...
89
Eastern Illinois University Eastern Illinois University The Keep The Keep Masters Theses Student Theses & Publications Spring 2021 Identifying Scotomata in Hazard Identification Caused By Identifying Scotomata in Hazard Identification Caused By Ignorance and Overconfidence Ignorance and Overconfidence Allen Johanson Eastern Illinois University Follow this and additional works at: https://thekeep.eiu.edu/theses Part of the Ergonomics Commons, Industrial Technology Commons, Operational Research Commons, and the Risk Analysis Commons Recommended Citation Recommended Citation Johanson, Allen, "Identifying Scotomata in Hazard Identification Caused By Ignorance and Overconfidence" (2021). Masters Theses. 4866. https://thekeep.eiu.edu/theses/4866 This Dissertation/Thesis is brought to you for free and open access by the Student Theses & Publications at The Keep. It has been accepted for inclusion in Masters Theses by an authorized administrator of The Keep. For more information, please contact [email protected].
Transcript of Identifying Scotomata in Hazard Identification Caused By ...
Eastern Illinois University Eastern Illinois University
The Keep The Keep
Masters Theses Student Theses & Publications
Spring 2021
Identifying Scotomata in Hazard Identification Caused By Identifying Scotomata in Hazard Identification Caused By
Ignorance and Overconfidence Ignorance and Overconfidence
Allen Johanson Eastern Illinois University
Follow this and additional works at: https://thekeep.eiu.edu/theses
Part of the Ergonomics Commons, Industrial Technology Commons, Operational Research Commons,
and the Risk Analysis Commons
Recommended Citation Recommended Citation Johanson, Allen, "Identifying Scotomata in Hazard Identification Caused By Ignorance and Overconfidence" (2021). Masters Theses. 4866. https://thekeep.eiu.edu/theses/4866
This Dissertation/Thesis is brought to you for free and open access by the Student Theses & Publications at The Keep. It has been accepted for inclusion in Masters Theses by an authorized administrator of The Keep. For more information, please contact [email protected].

Identifying Scotomata in Hazard Identification Caused by Ignorance and Overconfidence
Allen Johanson
Eastern Illinois University

2
Abstract
The manufacturing and construction industries are two of the most dangerous
professions, and employees are frequently exposed to hazards and hazardous conditions which
can lead to serious injury or even death. An observed phenomenon, frequently called the
Dunning-Kruger Effect states that unskilled people are often unaware of their shortcomings and
those with the higher-level skills often underestimate their abilities. This study examines
employees’ training, years of experience, and performance to gauge any correlations among
these variables in the area of hazard awareness. The goal of this study is to help individuals to
recognize blind spots in their knowledge to identify hazards in various situations to keep
themselves and others safe.

3
Table of Contents
Abstract ........................................................................................................................................... 2
Table of Figures .............................................................................................................................. 4
Table of Tables ............................................................................................................................... 5
Acknowledgement .......................................................................................................................... 6
Introduction ..................................................................................................................................... 7
Significance..................................................................................................................................... 9
Research Questions ....................................................................................................................... 10
Question 1 ................................................................................................................................. 10
Question 2 ................................................................................................................................. 10
Question 3 ................................................................................................................................. 10
Problem Statement ........................................................................................................................ 11
Purpose .......................................................................................................................................... 12
Limitations .................................................................................................................................... 13
Delimitations ................................................................................................................................. 13
Literature Review.......................................................................................................................... 14
Dunning-Kruger Effect and Other Similar Studies ................................................................... 14
Workplace Safety and Injury Prevention .................................................................................. 17
Methodology ................................................................................................................................. 21
Research Design and Theoretical Framework .......................................................................... 21
Assumptions .............................................................................................................................. 21
Description of Participants ........................................................................................................ 21
Data Collection ......................................................................................................................... 22
Results and Discussion ................................................................................................................. 24
Conclusion ................................................................................................................................ 38
Recommendations for Future Research ........................................................................................ 40
References ..................................................................................................................................... 41
Appendix A: Institutional Review Board Approval Letter ........................................................... 44
Appendix B: Survey ...................................................................................................................... 45
Appendix C: Raw Data Tables ..................................................................................................... 76

4
Table of Figures
Figure 1 Research Question Triangle ........................................................................................... 10
Figure 2 Pie Chart of the Job Types of the Respondents .............................................................. 24
Figure 3 Pie Chart of the Years of Experience of the Respondents.............................................. 25
Figure 4 Pie Chart of the Certifications Held by the Respondents ............................................... 27
Figure 5 X-Y Plot of All Normalized Scores vs. Years of Experience ........................................ 31
Figure 6 X-Y Plot of All Expected Scores vs. Years of Experience ............................................ 32
Figure 7 X-Y Plot of All Normalized Scores vs. Expected Scores .............................................. 32
Figure 8 Histogram of All Expected Scores ................................................................................. 33
Figure 9 Histogram of All Normalized Scores ............................................................................. 33
Figure 10 Bar Graph of Expected Scores and Normalized Scores for Each Certification Type .. 34
Figure 11 Box and Whisker Plot of the Expected Scores and Scores for each Certification ....... 35
Figure 12 Bar Graph of Expected Scores and Normalized Scores for Each Category ................. 36
Figure 13 Box and Whisker Plot of the Expected Scores and Normalized Scores for each
Category ........................................................................................................................................ 37
Figure 14 Survey Flow Chart ........................................................................................................ 45

5
Table of Tables
Table 1 Summary Table of the Job Categories of the Respondents ............................................. 25
Table 2 Summary Table of the Years of Experience of the Respondents .................................... 26
Table 3 Summary of the Certifications Held by the Respondents ................................................ 27
Table 4 Summary Table of Respondent Responses ...................................................................... 30
Table 5 Pearson Correlation Analysis........................................................................................... 31
Table 6 Summary Table of the Average Expected Scores and Average Normalized Score of Each
Certification .................................................................................................................................. 35
Table 7 Summary Table of the Expected Scores and Normalized Scores of Each Category ....... 36

6
Acknowledgement
I would like to thank Dr. Isaac Slaven for his assistance in the design of the study, the
guidance in the analysis of the raw data, and the mentorship throughout the thesis writing
process.
Also, I would like to thank my advisory committee, Dr. Austin Cheney and Dr. Jerry
Cloward for their feedback, support and guidance throughout the entire research process.
I would also like to thank Rick Grobart, of Focus Management, for his assistance in
distributing the survey.
Finally, I would like to thank James Slaven of Indiana University School of Medicine,
Department of Biostatistics & Health Data Science, for his assistance with the statistical analysis
of the data.

7
Introduction
This study was designed to determine how an individual’s confidence, competence, and
training influence an individual’s performance in identifying hazardous situations within the
workplace. The goal is to show any internal biases that might affect the value of safety training
to help employee recognition of hazards to reduce the number of workplace injuries.
According to the U.S. Bureau of Labor Statistics, in 2019 workers in private industries
incurred 2.8 million non-fatal workplace injuries or illnesses. This is a rate of 2.8% of all full-
time workers, or 2.8 cases per 100 workers. This was the same amount that was reported in 2017
and 2018 [1]. According to the National Council on Compensation Insurance’s (NCCI) database,
the average cost of all work’s compensation claims was $41,003 for 2017-2018. The top causes
of work’s compensation claims resulted from motor vehicle crashes, burns, falls/slips, and being
caught by something. The most frequent categories of worker’s compensation costs were
amputations, fractures/crushes/dislocations, trauma, and burns [2]. In 2019, there were 5,333
workers who died from a work-related injury, which was an increase of 2% from 2018, equating
to 3.5 fatal accidents per 100,000 full-time workers [3].
The education and training of employees is one of the most important tools that
companies can use to keep their employees safe. Many different training programs and aids have
been created by the Occupational Safety and Health Administration (OSHA) to assist employers
in maintaining safe work environments for their employees. These programs provide employees
with the knowledge and skills needed to perform their jobs safely, the awareness of workplace
hazards, and how to identify, report, and control them, as well as any special training due to
unique hazards [4]. By utilizing effective training methods, companies can reduce the amount of

8
non-fatal and fatal workplace injuries by equipping employees with the skills and knowledge to
identify hazards and potential hazards [5].
The primary study from where this study was inspired is Justin Kruger and David
Dunning’s study titled “Unskilled and Unaware of It.” Their findings became known as the
Dunning-Kruger Effect. Their study found that incompetent individuals are often overconfident
in their abilities and are often unable to see the gaps of information that they knew. Their study
also found that competent individuals tend to underestimate their skills and their knowledge.
Since the original study in 1999, there have been numerous studies that have identified this effect
in various fields. This study examines the effect in the area of hazard awareness.
9
Significance
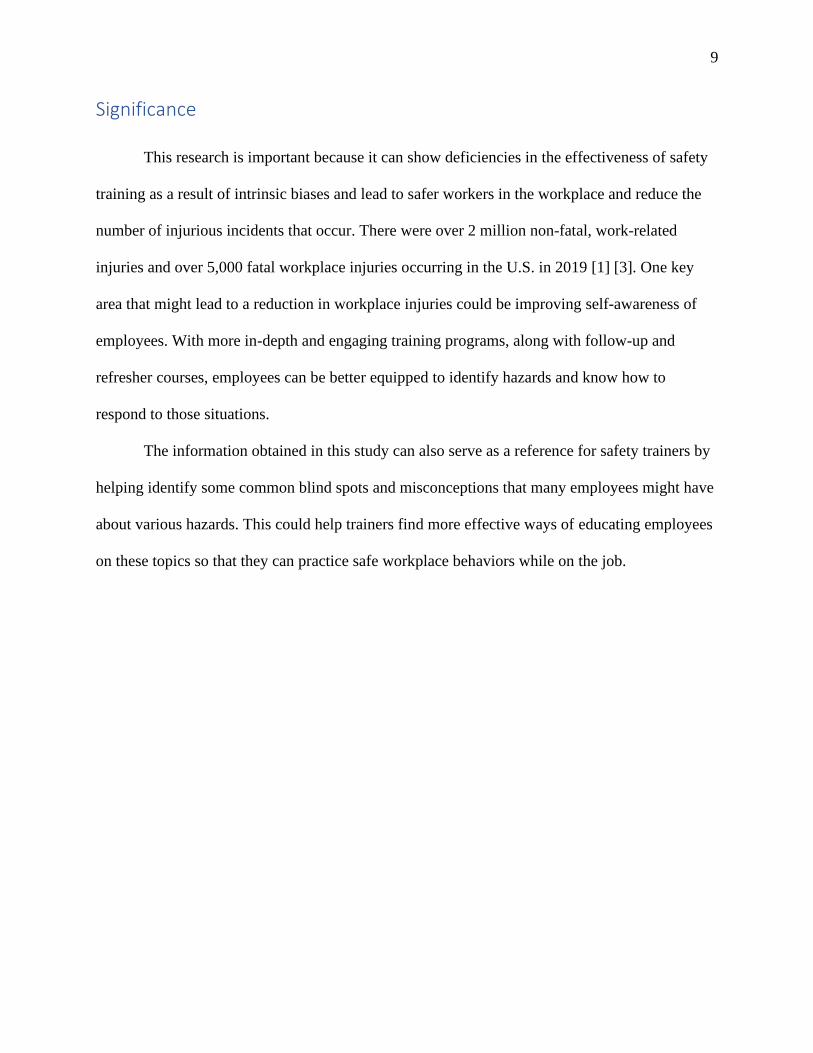
This research is important because it can show deficiencies in the effectiveness of safety
training as a result of intrinsic biases and lead to safer workers in the workplace and reduce the
number of injurious incidents that occur. There were over 2 million non-fatal, work-related
injuries and over 5,000 fatal workplace injuries occurring in the U.S. in 2019 [1] [3]. One key
area that might lead to a reduction in workplace injuries could be improving self-awareness of
employees. With more in-depth and engaging training programs, along with follow-up and
refresher courses, employees can be better equipped to identify hazards and know how to
respond to those situations.
The information obtained in this study can also serve as a reference for safety trainers by
helping identify some common blind spots and misconceptions that many employees might have
about various hazards. This could help trainers find more effective ways of educating employees
on these topics so that they can practice safe workplace behaviors while on the job.

10
Research Questions
This study examined three areas that could be key deciding factors in one’s ability to identify
safety hazards. The following questions lead to the creation of a research triangle (Figure 1).
Question 1
Is there a significant relationship among different types of Environment Health and Safety (EHS)
training certifications or degrees and their performance in their ability to identify hazards?
Question 2
Is there a significant relationship between one’s confidence in identifying hazards and their
performance in their ability to identify hazards?
Question 3
Is there a significant relationship between one’s training in EHS and his or her confidence in
identifying hazards?
Figure 1 Research Question Triangle

11
Problem Statement
The construction industry and manufacturing industry are two of the most dangerous
industries in the United States. These industries are constantly exposed to many hazards that
could lead to severe injury or even death if not handled appropriately. This study looks to
determine blind spots in hazard recognition that may be influenced by training or
overconfidence.

12
Purpose
The purpose of this study is to provide more information for individuals to improve their
awareness of hazards and respective blind spots, or scotomata. The study provides insight to
trainers and employers as to the effectiveness of training.

13
Limitations
There were a few limitations that were present when gathering information via online
surveys. We cannot do anything about dishonest answers or skipped questions. There is also an
accessibility issue where only individuals with email addresses or internet access are able to
partake in the survey.
Delimitations
Some of the delimitations of this study that were able to be controlled were the
population, the variables being tested, and the statistical analysis being performed. The
population that was invited to take part in the study was individuals from various industrial
groups and professional organizations primarily involved with manufacturing and construction.
We were also able to prevent multiple responses from the same respondent by setting up the
survey to only allow one response from each IP address. By asking these individuals, the study
will encompass a large variety of people who have varying levels of experience and abilities at
identifying hazards. The variables that were being identified were individual’s self-assessments
of how safe they believe they are and how well they are able to identify hazards from
photographs. Once all the information was collected, the overall scores were tabulated and a
multiple linear regression was used to determine if there is any statistical significance among
confidence, performance, and training.

14
Literature Review
Dunning-Kruger Effect and Other Similar Studies
The original study which this study is based was performed by Justin Kruger and David
Dunning at Cornell University in 1999. Their study, Unskilled and Unaware of It, was designed
to assess humans’ metacognitive competence, and help individuals recognize the limitations of
their abilities [6].
Their study found that incompetency, “not only causes poor performance, but also the
inability to recognize one’s performance is poor” [6]. During all four of the studies that Kruger
and Dunning conducted, participants in the bottom quartile overestimated themselves and felt
that they were above average in their performances. These individuals not only performed
poorly, but also failed to recognize that they performed poorly. It was also observed that the
participants in the top quartile tended to underestimate their ability and their test performances
relative to their peers. This group failed to recognize that the level of knowledge that they
possessed was not shared by the peers. The study linked one’s level of metacognitive skills with
one’s ability to judge their performance. It was found that by improving an individual’s
metacognitive skills, they are also able to improve the accuracy of their self-appraisals [6].
Some key findings that this study found were that not everybody overestimates their
abilities or performances. They found that the poor performers often believe that they are doing
just fine with their performance and fail to recognize just how incompetent their performance is.
The study also concluded that top performers judge their decisions accurately but overestimate
how other people perform on the same tasks [7].
Dunning and Kruger’s study has also been replicated several times studying different
categories such as reasoning, humor, grammar, leadership, driving, aviation, dating popularity,

15
academics and continuing professional development. Many of these studies utilized similar
experimental designs using pre-exams to ask participants about their experiences and perceived
skills on a scale of 1-10. The studies then presented the test to the participants. The results were
then always graded and scored before analysis was performed [8].
The findings of these secondary studies confirmed many of findings of the original
Dunning-Kruger study. It was found that individuals who lack competence overestimate their
abilities (illusory superiority), and individuals with higher skillsets underestimate their ability
(illusory inferiority) [9]. These studies also found that some sources of the error in one’s self-
assessment are one’s self-views and skill level. Self-skills are their perception of the situation,
and their skill levels are how much they know about the topic [10].
The effectiveness of self-assessments “depend on the individual’s ability to self-assess
gaps in their competence, and their willingness to seek out opportunities to reduce those gaps
when identified” [11]. Self-assessments are often not effective tools for identifying weaknesses
because humans tend to avoid engaging in learning to fill any blind spots because that would
require more energy and a commitment and willingness to change [11].
There are many reasons that people have biases or blind spots in their knowledge
resulting from overconfidence. Some of those reasons are: 1) learning can be more difficult in
some settings than others, 2) different behavioral biases may reinforce each other, or 3) rules of
thumb can spill over to other contexts. [12]. This study suggests that learning a skill because
“that’s how we do it” may not be beneficial to employees in the long-run and may cause
overconfidence. Overconfidence can be defined as the overestimation of one’s actual
performance, over-placement of one’s performance compared to others, or excessive precision in
their beliefs [13].

16
When studying students in higher education, one study found that students often
predicted their performance on exams to upwards of 30% better than they actually scored.
However, higher performing students were much closer in predicting their scores. It was
concluded that the under-performers lacked metacognitive insight to realize their shortcomings.
They also found that the higher-performing students were often correct in their assessments, yet
lacked the confidence of their metacognitive skills [14].
David Dunning has also done further research examining the Dunning-Kruger effect,
both with Justin Kruger, with other researchers, and by himself. One study that Dunning did by
himself focused on people’s patterns of error in judgement. He found that the individuals doing
the judging also have gaps in their skills and knowledge. Dunning calls this a ceiling of
competence. Each person’s imperfections are also impairments in their performance or
judgement [15]. He also concluded that the incompetent people are not the only individuals
effected by their incompetence, but they also effect the individuals who are around them. In a
section titled “Managing the Incompetent”, Dunning claims that it is hard for others to work with
the incompetent because they often don’t know that they need advice, and the feedback that they
receive is not always effective because they often resist negative feedback [15]. He also
discusses some of the burdens of top performers because they tend to misjudge their own
knowledge because they feel that if they know the information, then others should too, and their
genius is often unrecognized [15].
Another study that Dunning performed looked at self-assessments within the workplace.
The study found that people overrate themselves, and that flawed self-assessments occur all the
way up the corporate ladder [16]. People also have a tendency to hold inflated self-views that
exceed their actual performance abilities. The study also states some challenges associated with
17
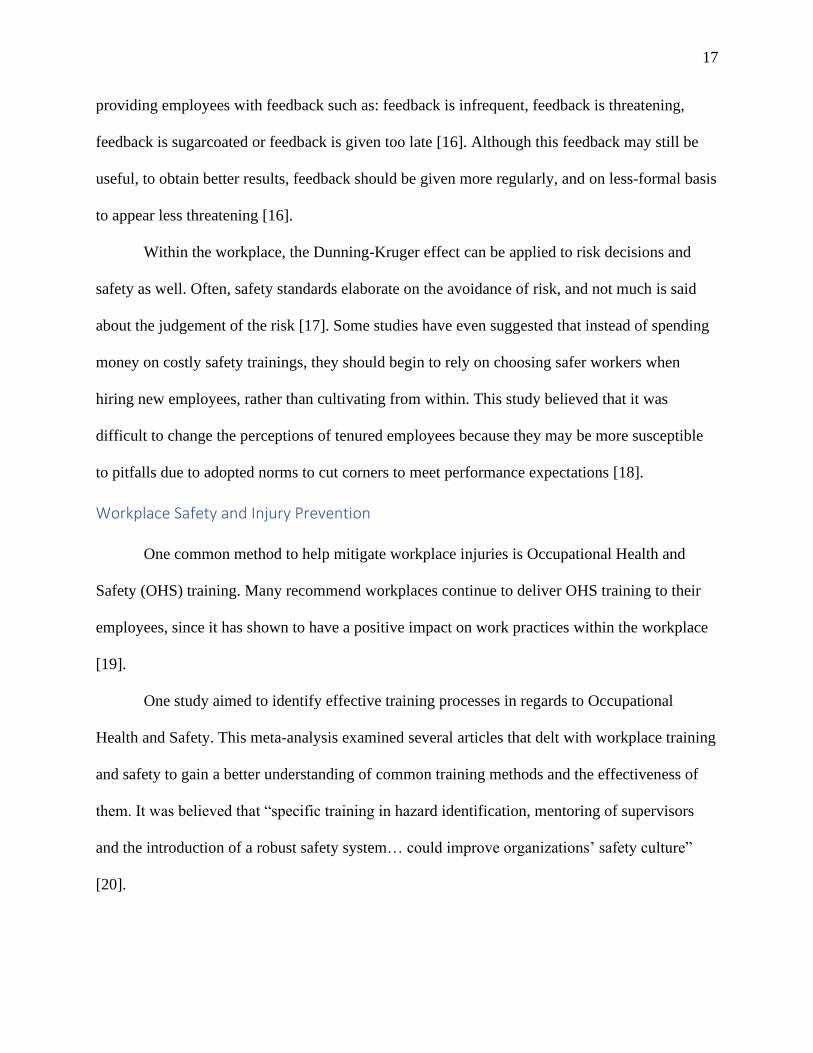
providing employees with feedback such as: feedback is infrequent, feedback is threatening,
feedback is sugarcoated or feedback is given too late [16]. Although this feedback may still be
useful, to obtain better results, feedback should be given more regularly, and on less-formal basis
to appear less threatening [16].
Within the workplace, the Dunning-Kruger effect can be applied to risk decisions and
safety as well. Often, safety standards elaborate on the avoidance of risk, and not much is said
about the judgement of the risk [17]. Some studies have even suggested that instead of spending
money on costly safety trainings, they should begin to rely on choosing safer workers when
hiring new employees, rather than cultivating from within. This study believed that it was
difficult to change the perceptions of tenured employees because they may be more susceptible
to pitfalls due to adopted norms to cut corners to meet performance expectations [18].
Workplace Safety and Injury Prevention
One common method to help mitigate workplace injuries is Occupational Health and
Safety (OHS) training. Many recommend workplaces continue to deliver OHS training to their
employees, since it has shown to have a positive impact on work practices within the workplace
[19].
One study aimed to identify effective training processes in regards to Occupational
Health and Safety. This meta-analysis examined several articles that delt with workplace training
and safety to gain a better understanding of common training methods and the effectiveness of
them. It was believed that “specific training in hazard identification, mentoring of supervisors
and the introduction of a robust safety system… could improve organizations’ safety culture”
[20].

18
It was found that 53.6% of all training was done in the form of classroom theory lessons
(lectures), 12% in the form of e-learning and only 8% had hands-on practice. 57% of the safety
trainings were completed in a single session, and 69.2% of the sessions lasted 1 hour or less.
These trainings focused primarily on accidents (46.4%) and ergonomic hazards (42.9%), and
very few studies addressed biological dangers, or physical risks, and none discussed chemical
exposures [20].
Many different sectors were studied during this meta-analysis. The primary industries
where training occurs are the construction industry (28%), farming industry (24%), and
manufacturing (12%). Many of these trainings were often directed towards individuals via one-
on-one training, whereas fewer did small groups; only one group conducted trainings with large
groups of more than thirty-five trainees at a time. [20].
The study also examined the follow-up appraisals that were conducted. The most
common form of assessment was in the form of a questionnaire (65.9%), observations on the job
(13.6%) and practical tests (9.1%) [20].
It was found that training had a positive effect on the knowledge gained by employees.
After completing their training, it was indicated that employees had a more favorable attitude
towards preventative behaviors and adopted a more safety-minded mindset [20].
It has been found that the more engaging the training, there is a greater acquisition of
knowledge retention, and will have a greater impact on reducing injuries. A study conducted by
Burke and colleagues in 2006 found that more engaging safety training methods were
approximately three times more effective than less engaging methods of training such as
classroom lectures or written materials. These better methods included such techniques as:

19
hands-on demonstrations, videos, dialogue, conversation, and interactions between the trainer
and the trainees, or active participation components in computer-based training seminars [21].
No matter the training method, it is everyone’s responsibility to create a safe work
environment; this so all the way from the youngest or newest employees all the way up to the
leaders and owners.
An Australian study conducted in 2018 found that younger workers are 17% more likely
to suffer from a work-related injury [22]. The article mentions some things to consider when
managing younger and newer employees. The things to remember are: they have limited or no
workplace experience, they are less aware of OHS risks and responsibilities, they may be
reluctant to ask questions or speak up, they may be overconfident in their capabilities, or they
want to make a good impression and jump into situations without thinking about safety [22]. In
order to maintain a safe work environment, one can: follow all reasonable instructions and
workplace procedures, wear personal protective equipment as required, and report unsafe
situations or injuries to supervisors and other employees. The article also suggest having newer
employees familiarize themselves with the health and safety requirements of the workplace and
to ask for assistance and training to ensure that they complete all tasks safely [22].
Although it is each worker’s responsibility to ensure that they are safe and do not perform
risky operations or tasks, it is also the responsibility of managers, supervisors, and upper
management to ensure that employees have safe environments to work. A 2010 article published
in the Professional Safety Journal said that, “creating an organization that eliminates fatalities
and life-altering injuries cannot be delegated. It requires the integrated involvement of the entire
organization, from the CEO to each worker” [23]. Another journal found that companies which
emphasize safety, concern of workers and compliance with regulations find themselves with

20
fewer OHS issues [24]. This shows that when leaders make safety a priority, not just production,
the entire organization has a better acceptance towards safety practices and can create safer
working environments.

21
Methodology
Research Design and Theoretical Framework
This study used an online survey questionnaire sent out via email blasts to individuals
that asked them about their background and previous trainings and certifications related to safety.
The survey then asked them to rate their confidence in various categories within the construction
industry and the general [manufacturing] industry on a scale of 0-10. The participants were given
10 randomized images from a question pool of 25 pictures and were asked to click on any part of
the image in which they identify a hazard. This survey can be found in Appendix B: Survey. The
data was then gathered from the surveys and statistical analysis was conducted to find any
correlations that exist with statistical significance.
Assumptions
This experiment assumed that individuals completed the surveys honestly and provided
accurate information about their background knowledge and confidence about safety. It is also
assumed that individuals gave their best effort during the portion of the survey where they were
asked to identify the hazards that they recognized within the images they were given.
Description of Participants
The survey was distributed via an email blast to a national Engineering Technology
Database listserv (ETD Listserv), EIU’s Engineering Technology Advisory Board, EIU’s
Lumpkin College of Business and Technology Leadership Team, as well as a risk management
consultant contact working in the workman’s compensation insurance industry. Within the email
blast, the respondents were encouraged to forward the survey to anyone else that they thought

22
might participate in the survey. It was also emphasized that no background in the field of safety
was necessary to participate.
Data Collection
For this research experiment, a survey was conducted using Qualtrics and the results were
stored within the program. The information was exported to Microsoft Excel to be graded. The
raw data that was collected and graded can be found in Appendix C: Raw Data Tables. Any
incomplete survey responses were thrown out and not used for the statistical analysis. For the
grading process, an answer key was created prior to starting, which identified the known hazards
within each picture. For each correctly identified hazard in an image, the respondent received +1
points. For each incorrectly identified hazard or for clicking on an area that was not a hazard
received -1 points. Therefore, a maximum score was determined for each image, with a possible
minimum score of negative infinity. Once each image had been graded from the respondent, a
normalized score could be assigned to the respondent as well as scores for their performance in
the specific categories that they received pictures. In order to obtain a normalized score for each
respondent the following two formulas were used:
𝑁𝑜𝑟𝑚𝑎𝑙𝑖𝑧𝑒𝑑 𝑆𝑐𝑜𝑟𝑒 = 𝑅𝑎𝑤 𝑆𝑐𝑜𝑟𝑒
𝑀𝑎𝑥 𝑆𝑐𝑜𝑟𝑒, if the raw score ≥ 0
𝑁𝑜𝑟𝑚𝑎𝑙𝑖𝑧𝑒𝑑 𝑆𝑐𝑜𝑟𝑒 = −(𝑀𝑎𝑥 𝑆𝑐𝑜𝑟𝑒−𝑅𝑎𝑤 𝑆𝑐𝑜𝑟𝑒
𝑀𝑎𝑥 𝑆𝑐𝑜𝑟𝑒), if the raw score < 0
The raw score was calculated by the total number of correctly identified hazards from all of the
respondent’s images subtracted from the number of missed hazards and false clicks. Each
respondent’s max score was calculated by the total number of determined hazards for each image
based off of the answer key and the images that were randomly assigned to them.
Analyses were performed to determine the association between training and confidence
with performance. Bivariate correlation and regression analyses were first conducted to

23
determine the bivariate associations, with multivariate regression models (MLR) then being
performed to determine if the bivariate analyses would be attenuated. Post-hoc power analyses
were also performed to determine the power of the study, in order to determine the necessary
effect size to be powered with the current sample size at a power level of 0.80. All analyses
were performed using SAS v9.4 (SAS Institute, Cary, NC) and all analytic assumptions were
verified, with non-parametric tests being used when necessary.
24
Results and Discussion
There were 91 total respondents who took the survey. Of those respondents, 68 of the
responses were complete and were used for the calculations and analysis for this study. The 23
incomplete responses were thrown out.
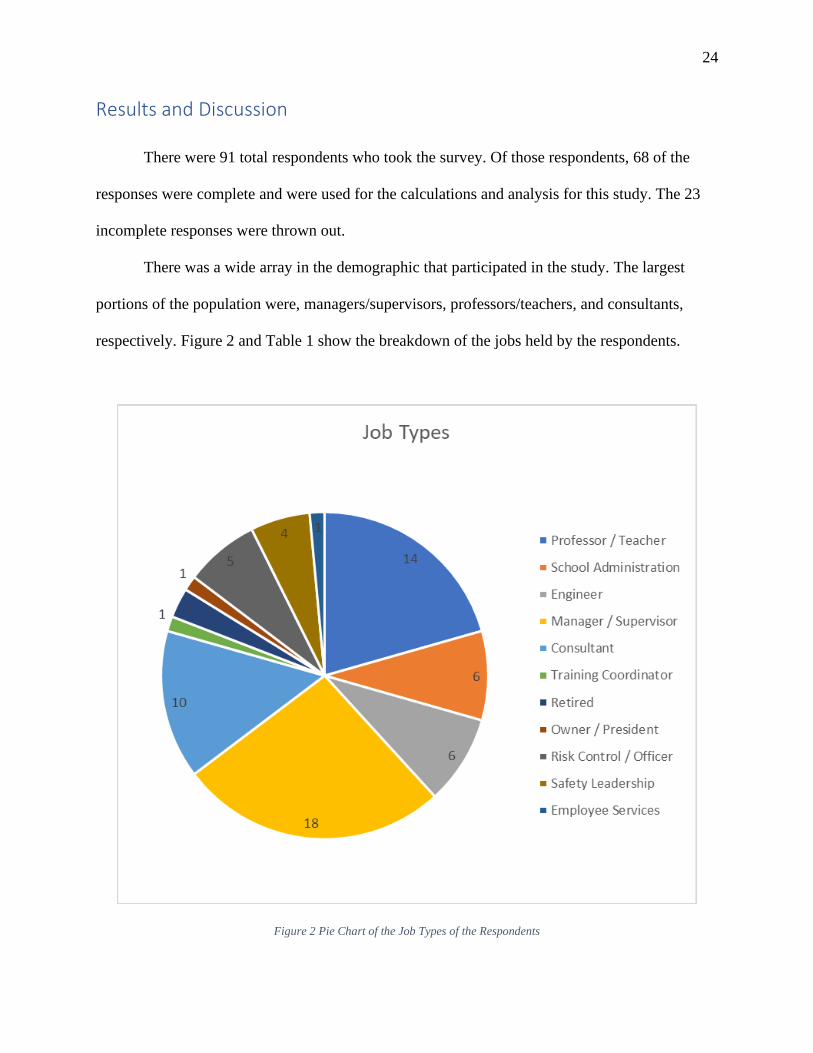
There was a wide array in the demographic that participated in the study. The largest
portions of the population were, managers/supervisors, professors/teachers, and consultants,
respectively. Figure 2 and Table 1 show the breakdown of the jobs held by the respondents.
Figure 2 Pie Chart of the Job Types of the Respondents

25
Table 1 Summary Table of the Job Categories of the Respondents
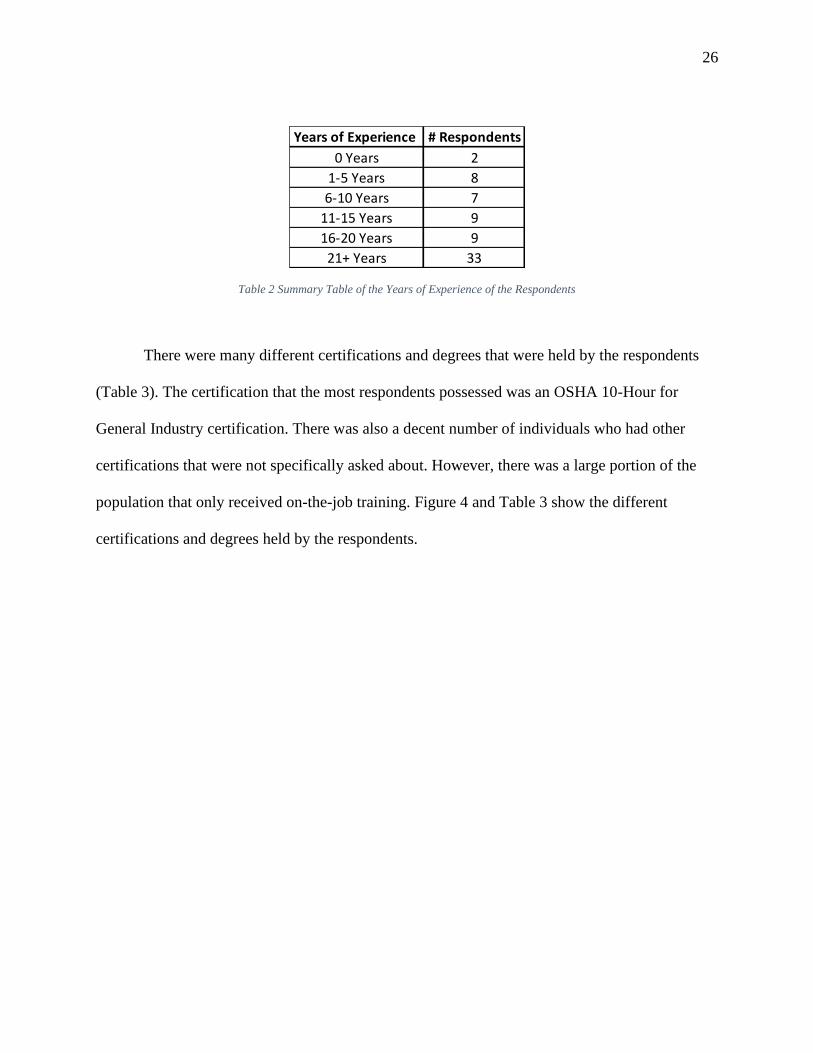
Most of the respondents had over 21 years of experience in their respective industries.
Very few of the respondent had minimal experience within their industry. Figure 3 and Table 2
show the breakdown of the years of experience of the respondents.
Figure 3 Pie Chart of the Years of Experience of the Respondents
Job Categories # Respondents
Professor / Teacher 14
School Administration 6
Engineer 6
Manager / Supervisor 18
Consultant 10
Training Coordinator 1
Retired 2
Owner / President 1
Risk Control / Officer 5
Safety Leadership 4
Employee Services 1
26
Table 2 Summary Table of the Years of Experience of the Respondents
There were many different certifications and degrees that were held by the respondents
(Table 3). The certification that the most respondents possessed was an OSHA 10-Hour for
General Industry certification. There was also a decent number of individuals who had other
certifications that were not specifically asked about. However, there was a large portion of the
population that only received on-the-job training. Figure 4 and Table 3 show the different
certifications and degrees held by the respondents.
Years of Experience # Respondents
0 Years 2
1-5 Years 8
6-10 Years 7
11-15 Years 9
16-20 Years 9
21+ Years 33

27
Figure 4 Pie Chart of the Certifications Held by the Respondents
Table 3 Summary of the Certifications Held by the Respondents
Certification / Degree # Respondents
Certified Safety Professional (CSP) 9
Safety Management Specialist (SMS) 2
Associate Safety Professional (ASP) 5
Occupational Health and Safety Technician (OHST) 5
Construction Health and Safety Technitian (CHST) 3
Safety Trained Supervisor (STS) 3
Safety Trained Supervisor Construction (STSC) 1
Certified Industrial Trainer (CIT) 3
Graduate Safety Practitioner (GSP) 2
Transitional Safety Practitioner (TSP) 1
OSHA 10-Hour for General Industry 24
OSHA 10-Hour for Construction 14
OSHA 30-Hour for General Industry 16
OSHA 30-Hour for Construction 12
Certified Industrial Hygienist (CIH) 1
Other 19
Only On-the-Job Training 21

28
Once the responses had been scored, the results could be analyzed to determine if there
were any correlations between certification types and normalized scores, expected scores and
normalized scores, and certification types and expected scores. A summary table of years of
experience, normalized scores, and expected scores was created to be used for the MLR. This
information can be found in Table 4. The MLR indicated that neither training nor confidence
were positively associated with performance. Training was positively associated with
confidence, which was not associated with attenuated in the MLR models including confidence.
The correlation summary table was also used to run a Pearson correlation analysis (Table 5). For
the Pearson correlation analysis, the outliers (the individuals who received positive scores) were
removed. The analysis showed that there was a statistically significant result in the correlation
between years of experience and their expected score. It was found that the more years of
experience an individual has, the better they believe they will be able to identify hazards. There
were non-significant results between the normalized score and years of experience and with
normalized score and expected score.
The empirical regression model, i.e. equation, for the relationship between years of
experience and normalized score has a p-value of 0.3290 from the experience variable. The
equation for that model is:
𝑆𝑐𝑜𝑟𝑒 = −1.44 − 0.002(𝑒𝑥𝑝𝑒𝑟𝑖𝑒𝑛𝑐𝑒)
The empirical regression model, for the relationship between experience and expected scores
have p-values of 0.4578 and 0.5876 respectively. The equation for this model is:
𝑆𝑐𝑜𝑟𝑒 = −1.40 − 0.002(𝑒𝑥𝑝𝑒𝑟𝑖𝑒𝑛𝑐𝑒) − 0.009(𝑒𝑥𝑝𝑒𝑐𝑡𝑒𝑑)
The low value of these coefficients and the high p-values indicate there is little influence on the
normalized score (performance) from either expected score or experience. That is, at this sample

29
size, performance cannot be reliably predicted based upon the respondent’s experience or
expected score.
A power analysis was also performed with the data from Table 4. The outliers were again
removed prior to running the power analysis. With n=62, the study was powered at 80% with the
usual alpha of 0.05. This would make a correlation coefficient of 0.35. That is why the
correlation coefficient for the years of experience and expected score (0.32570) was significant.
The power analysis also showed that to be powered to find a statistically significant results with
a smaller correlation of years of experience with expected score, the sample size would need to
be n=647. This did not show that the sample was undersized or underpowered, there just wasn’t
much statistical information with experience and score.
X-Y graphs were also created from the MLR data to show the relationships between total
scores and years of experience (Figure 5), expected scores and years of experience (Figure 6),
and total scores and years of experience (Figure 7). Figure 8 depicts a histogram showing the
distribution of individuals self-reported expected scores. Figure 9 depicts a histogram showing
that the majority of respondents received a negative overall score between -1.03 and -1.93, with
only a few individuals receiving positive overall scores.

30
Table 4 Summary Table of Respondent Responses
# Years Normalized Score Expected Score
1 5 -1.69 6.07
2 15 0.03 1.00
3 9 -1.48 4.80
4 42 -1.81 9.73
5 12 -1.48 1.80
6 1 -1.17 4.87
7 5 -1.41 7.87
8 40 -1.45 4.27
9 35 -1.50 5.27
10 35 -1.23 8.40
11 40 -1.25 4.47
12 30 -1.86 8.20
13 1 -1.61 4.60
14 50 -1.28 5.40
15 12 -1.21 7.33
16 5 -1.48 6.33
17 2 -1.95 4.00
18 0 -1.13 3.53
31 5 -1.60 6.13
32 11 -1.43 4.47
33 30 -1.35 7.40
34 25 -1.58 6.47
35 37 0.00 9.27
36 17 -1.24 4.20
37 25 -1.32 4.27
38 25 -1.65 5.40
39 15 -1.31 2.40
40 17 -2.05 7.87
41 8 -1.07 4.33
42 16 -1.23 3.33
43 21 -1.54 1.07
44 5 -1.42 6.60
45 21 0.32 8.67
46 25 -1.26 8.67
47 36 0.28 7.27
48 40 -1.80 6.67
49 0 -1.42 1.53
50 19 -1.35 4.40
51 18 -1.14 8.00
52 35 -1.76 7.13
53 41 -1.87 8.53
54 35 -1.75 4.73
55 46 -1.58 10.00
56 6 -1.52 5.40
57 35 -1.48 3.73
58 25 0.08 9.47
59 30 -2.38 7.60
60 9 -1.57 6.80
61 20 -1.59 2.67
62 8 -1.45 8.40
63 17 -1.52 9.13
64 7 -1.50 5.53
65 16 -1.48 4.93
66 10 0.16 7.07
67 12 -1.71 5.33
68 12 -1.09 8.27
69 15 -1.63 3.40
70 23 -1.17 7.73
71 21 -1.48 8.53
72 13 -1.69 3.73
73 25 -1.39 5.07
74 17 -1.22 7.73
75 27 -1.46 4.60
78 20 -1.74 8.13
79 28 -1.48 4.67
86 40 -1.10 8.47
90 42 -1.32 8.40
91 29 -1.68 6.80

31
Table 5 Pearson Correlation Analysis
Figure 5 X-Y Plot of All Normalized Scores vs. Years of Experience

32
Figure 6 X-Y Plot of All Expected Scores vs. Years of Experience
Figure 7 X-Y Plot of All Normalized Scores vs. Expected Scores

33
Figure 8 Histogram of All Expected Scores
Figure 9 Histogram of All Normalized Scores
The next thing that was examined was if there were any certification types that performed
better than others. For this analysis, a summary table of the average normalized scores and
average expected scores for each certification type was created. These results can be seen in
Table 6. The data was also graphed using a double bar graph and can be seen in Figure 10. To

34
obtain these averages, each overall score was sorted by the different categories of certifications.
The individual normalized scores and expected scores for each category can be found in
Appendix C: Raw Data Tables. Those data points were then graphed using a box and whisker
plot (Figure 11).
Figure 10 Bar Graph of Expected Scores and Normalized Scores for Each Certification Type

35
Table 6 Summary Table of the Average Expected Scores and Average Normalized Score of Each Certification
Figure 11 Box and Whisker Plot of the Expected Scores and Scores for each Certification
Certification / Degree Average Normalized Score Average Expected Score
CSP -1.27 7.30
SMS -0.92 4.77
ASP -0.74 6.39
OHST -1.09 5.64
CHST -0.61 6.27
STS -1.08 3.49
STSC 0.03 1.00
CIT -0.49 5.22
GSP -0.86 4.07
TSP 0.03 1.00
OSHA 10-Hour for General Industry -1.28 6.31
OSHA 10-Hour for Construction -1.16 6.47
OSHA 30-Hour for General Industry -1.17 6.56
OSHA 30-Hour for Construction -1.00 7.09
CIH 0.03 1.00
Other -1.21 7.36
Only On-the-Job Training -1.39 5.44

36
By analyzing the raw data as well as studying the graphs, we see that there is no
statistical importance between how well people of any certification type actually performs
compared to how well they think they will perform.
This study also took a look to see if there were any specific categories of safety in which
individuals had a better understanding of hazard recognition. The tables of each individual’s
score and expected score for each certification can be found in Appendix C: Raw Data Tables.
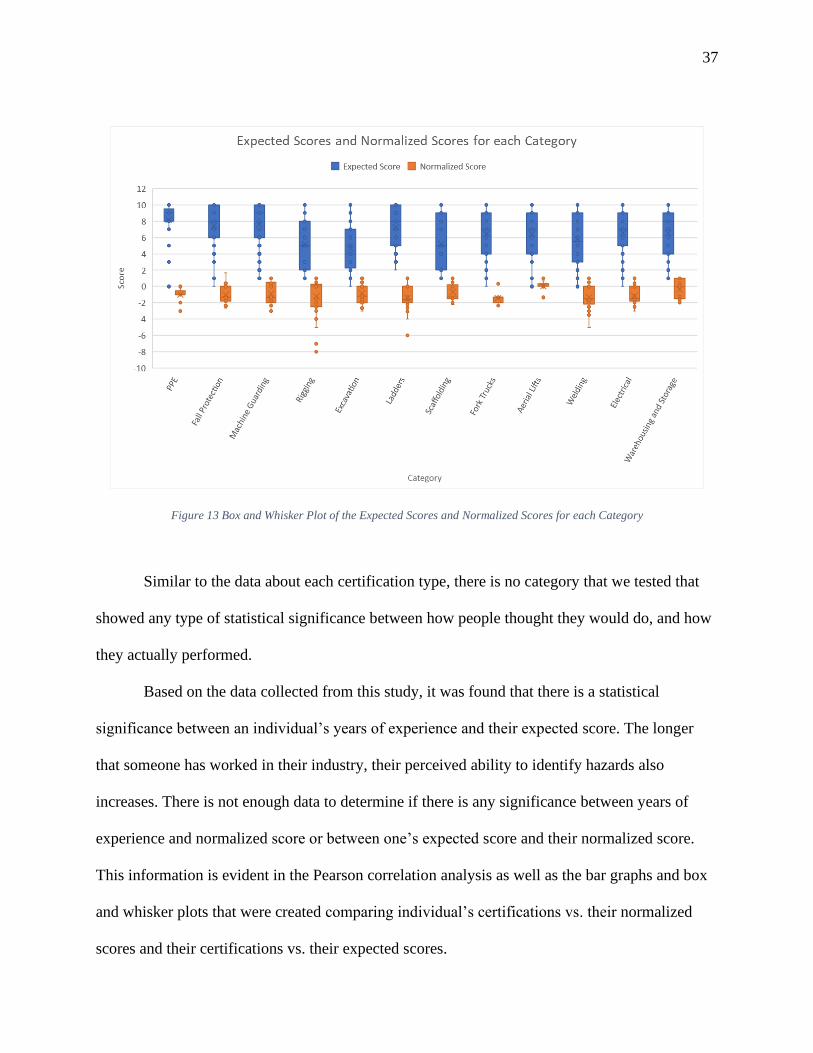
Figure 12 Bar Graph of Expected Scores and Normalized Scores for Each Category
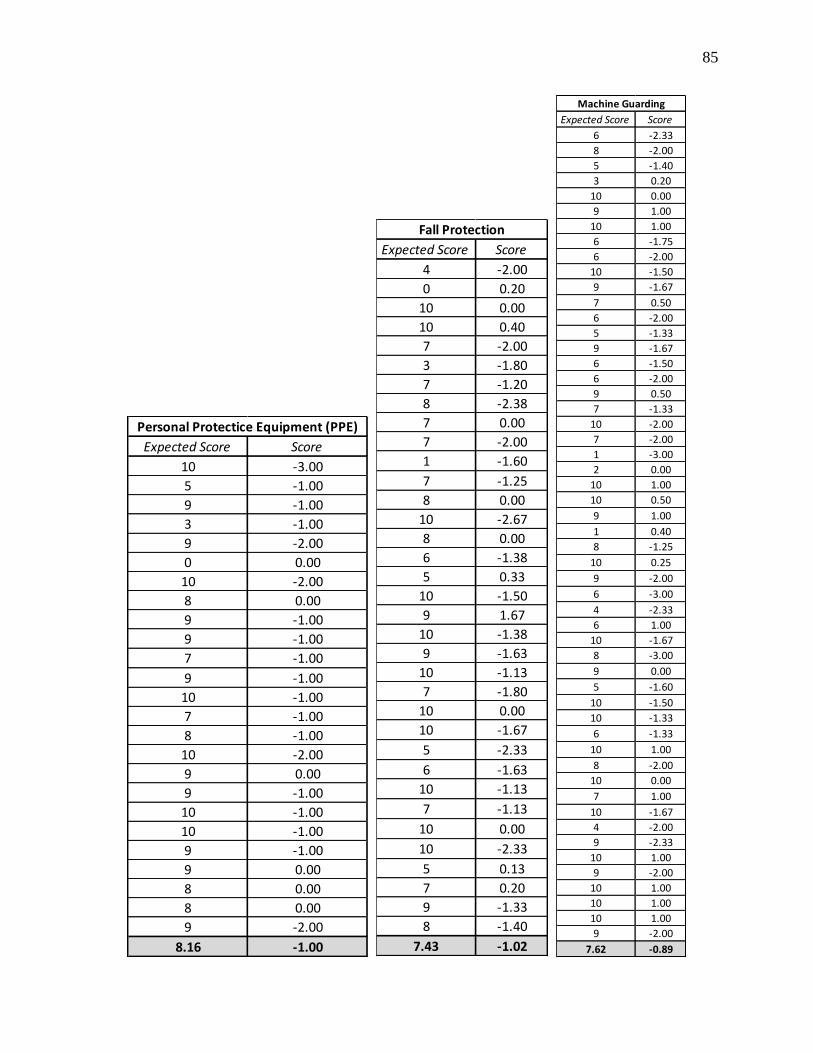
Table 7 Summary Table of the Expected Scores and Normalized Scores of Each Category
Category Average Expected Score Average Normalized Score
PPE 8.16 -1.00
Fall Protection 7.43 -1.02
Machine Guarding 7.62 -0.89
Rigging 5.17 -1.18
Excavations 4.64 -0.87
Ladders 7.24 -1.36
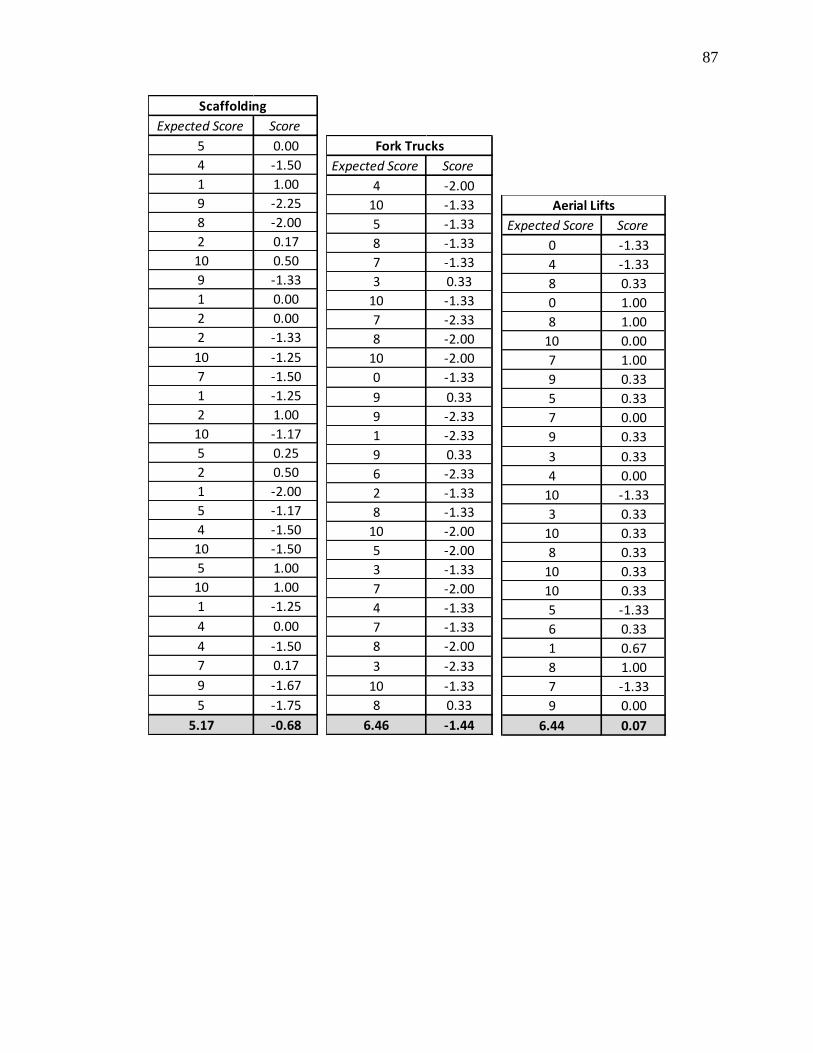
Scaffolding 5.17 -0.68
Fork Trucks 6.46 -1.44
Aerial Lifts 6.44 0.07
Welding 5.80 -1.34
Electrical 6.51 -1.16
Warehousing and Storage 6.54 -0.37
37
Figure 13 Box and Whisker Plot of the Expected Scores and Normalized Scores for each Category
Similar to the data about each certification type, there is no category that we tested that
showed any type of statistical significance between how people thought they would do, and how
they actually performed.
Based on the data collected from this study, it was found that there is a statistical
significance between an individual’s years of experience and their expected score. The longer
that someone has worked in their industry, their perceived ability to identify hazards also
increases. There is not enough data to determine if there is any significance between years of
experience and normalized score or between one’s expected score and their normalized score.
This information is evident in the Pearson correlation analysis as well as the bar graphs and box
and whisker plots that were created comparing individual’s certifications vs. their normalized
scores and their certifications vs. their expected scores.
38
It was also determined that there is no single certification type that better prepares
individuals for identifying hazards. This is evident from the graphs that were plotted to compare
the normalized scores and expected scores from all of the respondents of each certification
category.
The last finding that the study found was that in each category being examined,
individuals often overestimated their knowledge in the category and underperformed when asked
to select the hazards from the images.
One theory that is believed to have caused the negative scores for the respondents is the
Law of Instrument. This theory states that an evaluator’s background directly relates to their
evaluation choices. It is believed that, “once a researcher adopts an instrument or method into
their methodological tool kit, it will often be applied in settings beyond its original intended
purpose” [25]. If you only possess one tool, you will utilize that tool for everything. That is why
this theory is also known as the Law of the Hammer. If you only have a hammer, everything is a
nail. In this study, the respondents only had the tools in which their particular certifications
provided them, and therefore could only correctly identify hazards based on what they already
knew. However, when identifying hazards that they were not trained to identify they used their
judgement which was based on what they actually knew. This pitfall caused the respondents to
click on things that they thought were hazards which had no clear indication of being hazardous.
Conclusion
With thousands of workplace injuries and fatalities each year in the construction and
manufacturing industries alone in the United States, there should be a large stress on the
importance of workplace safety. Although these industries have made significant gains to
keeping their employees safe, there will always be some risk associated with working these types

39
of jobs. It is very important that employees receive the necessary training to not only perform
their jobs correctly, but also safely and to be able to recognize when a situation is hazardous.
There should also be refresher courses for employees to remind them of potential hazards and
how to respond to them. Through training and re-training, individuals should have the
confidence, the competence, and the training to identify and prevent hazards and create safer
workplace environments which will reduce the number of injuries and fatalities.

40
Recommendations for Future Research
We observed from these results that a cognitive bias, the Law of Instrument, may exist.
This was observed by the number of hazards that were identified that were not evidently existent.
The negative scores may have confounded the results. Accordingly, one recommendation for
future research would be to develop a better method for the survey. We asked individuals to rank
their confidence of how well they felt that they could identify hazards on a scale of 0-10. With
this current scale, a negative ranking was not a possible option for respondents. It might be a
consideration to include a post-test, where they would rank how they felt they did in identifying
the hazards in the images that they actually were given.
There were a number of people who indicated very little experience but also did not
indicate a complete ignorance of the subject. An examination on the ability to recognize hazards
for people with little to no safety training may provide more insight into the effects that the Law
of Instrument had as a confounding variable of this project.
41
References
[1] Bureau of Labor Statistics, "Bureau of Labor Statistics," 4 November 2020. [Online].
Available: https://www.bls.gov/news.release/pdf/osh.pdf. [Accessed 22 January 2021].
[2] National Safety Council, "Workers’ Compensation Costs," [Online]. Available:
https://injuryfacts.nsc.org/work/costs/workers-compensation-costs/. [Accessed 22 January
2021].
[3] Bureau of Labor Statistics, "Bureau of Labor Statistics," 16 December 2020. [Online].
Available: https://www.bls.gov/news.release/pdf/cfoi.pdf. [Accessed 22 January 2021].
[4] OSHA, "OSHA," [Online]. Available: https://www.osha.gov/shpguidelines/education-
training.html. [Accessed 22 January 2021].
[5] OSHA, "OSHA," January 2012. [Online]. Available:
https://www.osha.gov/dsg/InjuryIllnessPreventionProgramsWhitePaper.html. [Accessed 22
January 2021].
[6] J. Kruger and D. Dunning, "Unskilled and unaware of it: How difficulties in recognizing
one's own incompetence lead to inflated self-assessments," Journal of Personality and
Social Psychology, vol. 77, no. 6, pp. 1121-1134, 1999.
[7] T. Schlosser, D. Dunning, K. L. Johnson and J. Kruger, "How Unaware are the Unskilled?
Empirical test of the "Signal Extraction" Counterexplanation for the Dunning-Kruger
Effect in Self-evaluation of Performance," Journal of Economic Psycology, vol. 39, pp. 85-
100, 2013.
[8] S. R. Pavel, M. F. Robertson and B. T. Harrison, "The Dunning-Kruger Effect and SIUC
University’s Aviation Students," Journal of Aviation Technology and Engineering, vol. 2,
no. 1, pp. 125-129, 2012.
[9] L. Tan, "Innovations in Continuing Professional Development," Clinical Oncology, vol. 23,
pp. 659-661, 2011.
[10] J. Ehrlinger, "Skill Level, Self-Views and Self-Theories," Social and Personality
Psychology, vol. 2, no. 1, pp. 382-398, 2008.
[11] G. Regehr and K. Eva, "Self-assessment, Self-direction, and the self-regulating
Professional," Clinical Orthopaedics and Related Research, vol. 449, pp. 34-38, 2006.
[12] U. Malmendier and T. Taylor, "On the Verges of Overconfidence," Journal of Economic
Perspectives, vol. 29, no. 4, pp. 3-8, 2015.

42
[13] D. A. Moore and P. J. Healy, "The Trouble With Overconfidence," Psychological Review,
vol. 115, no. 2, pp. 502-517, 2008.
[14] T. M. Miller and L. Geraci, "Unskilled but Aware: Reinterpreting Overconfidence in Low-
Performing Students," Journal of Experimental Psychology: Learning, Memory, and
Cognition, pp. 1-5, 2011.
[15] D. Dunning, "On Identifying Human Capital: Flawed Knowledge Leads to Faulty
Judgements of Expertise by Individuals and Groups," Advances in Group Processes, vol.
32, pp. 149-176, 2015.
[16] D. Dunning, C. Heath and J. M. Suls, "Flawed Self-Assessment: Implications for Health,
Education, and the Workplace," American Psychological Society, vol. 5, no. 3, pp. 69-106,
2004.
[17] A. Johnsen, G. D. Crnkovic, K. Lundqvist, K. Hanninen and P. Pettersson, "Risk-based
Decision-making Fallacies: Why Present Functional Safety Standards are not Enough," pp.
1-10, 2017.
[18] F. Giordano, "The Numbing Effect of Experience," pp. 1-78, 2019.
[19] L. S. Robinson, C. M. Stephenson, P. A. Schulte, B. C. Amick III, E. L. Irvin, D. E.
Eggerth, S. Chan, A. R. Bielecky, A. M. Wang, T. L. Heidotting, R. H. Peters, J. A. Clarke
and K. Cullen, "A Systematic Review of the Effectiveness of Occupational Health and
Safety Training," Scandinavian Jurnal of Work, Environment, and Health, vol. 38, no. 3,
pp. 193-208, 2012.
[20] F. Ricci, A. Chiesi, C. Panari and A. Pelosi, "Effectiveness of Occupational Health and
Safety Training," Journal of Workplace Learning, vol. 28, no. 6, pp. 355-377, 2016.
[21] M. J. Burke, S. A. Sarpy, K. Smith-Crowe, S. Chan-Serafin, R. O. Salvador and G. Islam,
"Relative Effectiveness of Worker Safety and Health Training Methods," American
Journal of Public Health, vol. 96, no. 2, pp. 315-324, 2006.
[22] B. Minchin, "Integrate Sustainability," 31 January 2019. [Online]. Available:
https://www.integratesustainability.com.au/2019/01/31/new-young-workers-safety/.
[Accessed 19 April 2021].
[23] T. R. Krause, D. R. Groover and D. K. Martin, "Preventing Incidents and Fatalities: Eight
Questions Every Senior Leader Should Ask," Professional Safety, pp. 46-53, June 2010.
[24] T. R. Cunningham and C. J. Jacobson, "Safety Talk and Safety Culture: Discursive
Reportoires as Indicators of Workplace Safety and Health Practice and Readiness to
Change," Annals of Work Exposures and Health, vol. 62, no. 1, pp. 55-64, 2018.

43
[25] T. Azzam, "Evaluator Characteristics and Methodological Choice," American Journal of
Evaluation, vol. 32, no. 3, pp. 376-391, 2011.

44
Appendix A: Institutional Review Board Approval Letter

45
Appendix B: Survey
Figure 14 Survey Flow Chart

46
Hazard Identification
Hazard Identification Survey
Eastern Illinois University School of Technology invites you to take part in a brief survey about
safety training and hazard recognition. The purpose of this survey is to research how confident
people are in identifying workplace hazards based on any training they may have received.
Participating in this survey is completely voluntary. The decision to participate, decline, or
withdraw from participation will have no effect on your future relations with EIU. This survey
takes approximately 10-15 minutes.
Any information you share will be used in our analysis for aiding in identifying more effective
ways to conduct safety training and creating safer work environments. Your identity and
information will always be kept confidential and we maintain no information that could be able
to potentially identify you as an individual.
Your input is important to us. We plan to use what we learn to help create safer work
environments for workers in various industries.
Thank you for your participation in this survey.
If you have any questions or concerns about the treatment of human participants in this study,
you may call or write:
Institutional Review Board
Eastern Illinois University
600 Lincoln Ave.
Charleston, IL 61920
Telephone: (217) 581-8576
E-mail: [email protected]
You will be given the opportunity to discuss any questions about your rights as a research subject
with a member of the IRB. The IRB is an independent committee composed of members of the
University community, as well as lay members of the community not connected with EIU. The
IRB has reviewed and approved this study.

47
How long (in years) have you worked in your specific industry?
________________________________________________________________
What is your current job position / title?
________________________________________________________________

48
Please check any training, certifications or degrees with respect to safety that you hold:
Possess (current) Outdated or Expired
Certified Safety Professional (CSP) o o
Safety Management Specialist
(SMS) o o
Associate Safety Professional (ASP) o o
Occupational Health and Safety
Technician (OHST) o o
Construction Health and Safety
Technician (CHST) o o
Safety Trained Supervisor (STS) o o
Safety Trained Supervisor
Construction (STSC) o o
Certified Instructional Trainer (CIT) o o
Graduate Safety Practitioner (GSP) o o
Transitional Safety Practitioner
(TSP) o o
OSHA 10-Hour for General Industry o o
OSHA 10-Hour for Construction o o
OSHA 30-Hour for General Industry o o
OSHA 30-Hour for Construction o o
Certified Industrial Hygienist (CIH) o o
Other o o
49
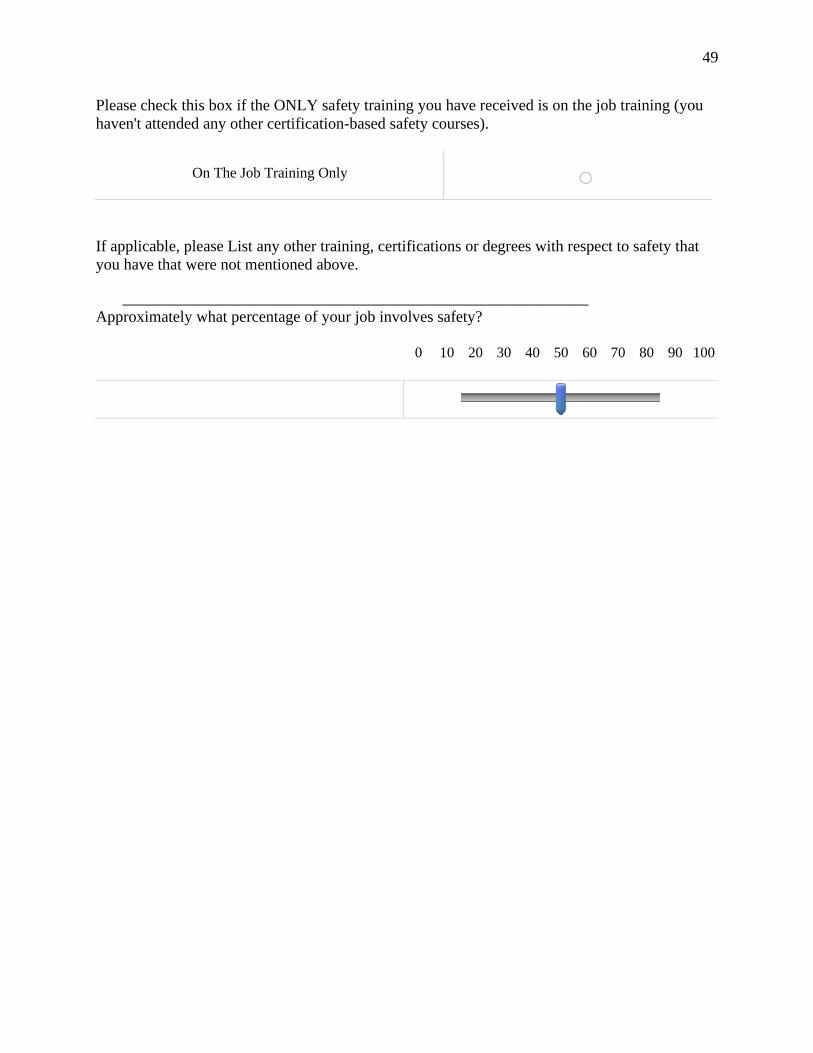
Please check this box if the ONLY safety training you have received is on the job training (you
haven't attended any other certification-based safety courses).
On The Job Training Only o
If applicable, please List any other training, certifications or degrees with respect to safety that
you have that were not mentioned above.
________________________________________________________________
Approximately what percentage of your job involves safety?
0 10 20 30 40 50 60 70 80 90 100

50
Rate your ability to identify hazards in the following:
0 1 2 3 4 5 6 7 8 9 10
General Safety in Manufacturing
General Safety in Construction
Personal Protective Equipment (PPE)
Fall Protection
Lock Out - Tag Out
Machine Guarding
Rigging
Excavations
Ladders
Scaffolding
Fork Truck
Aerial Lift
Welding
Electrical
Warehousing and Storage

51
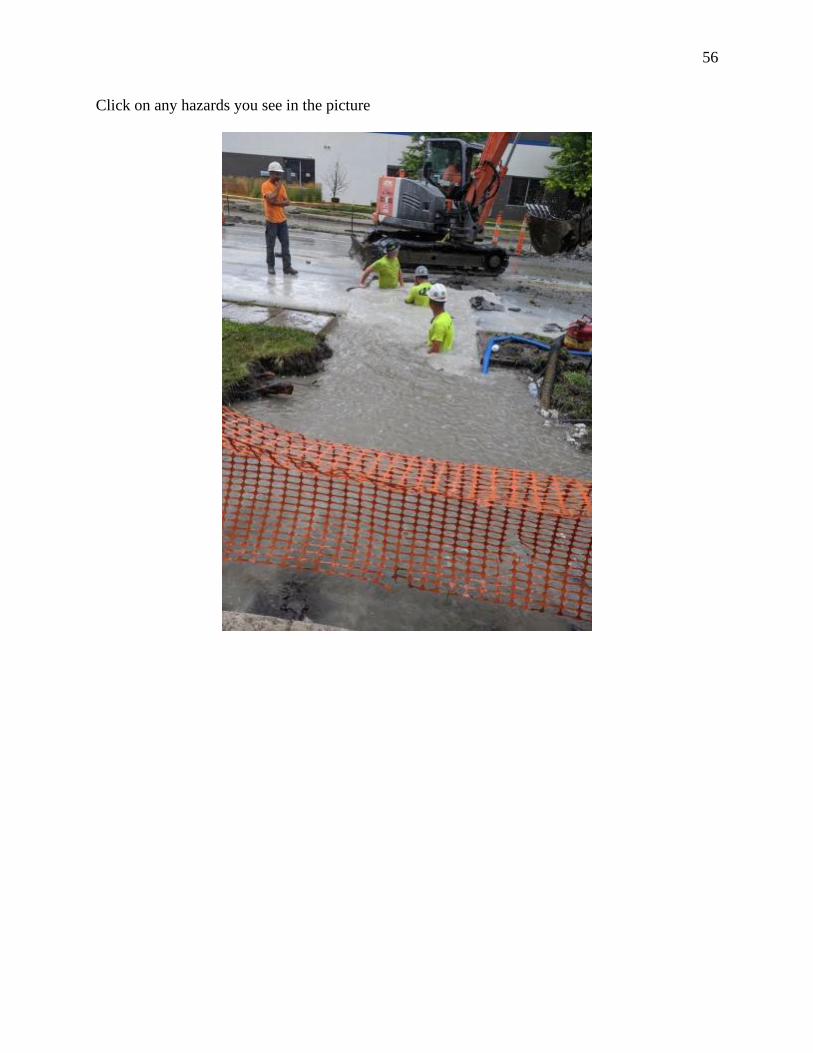
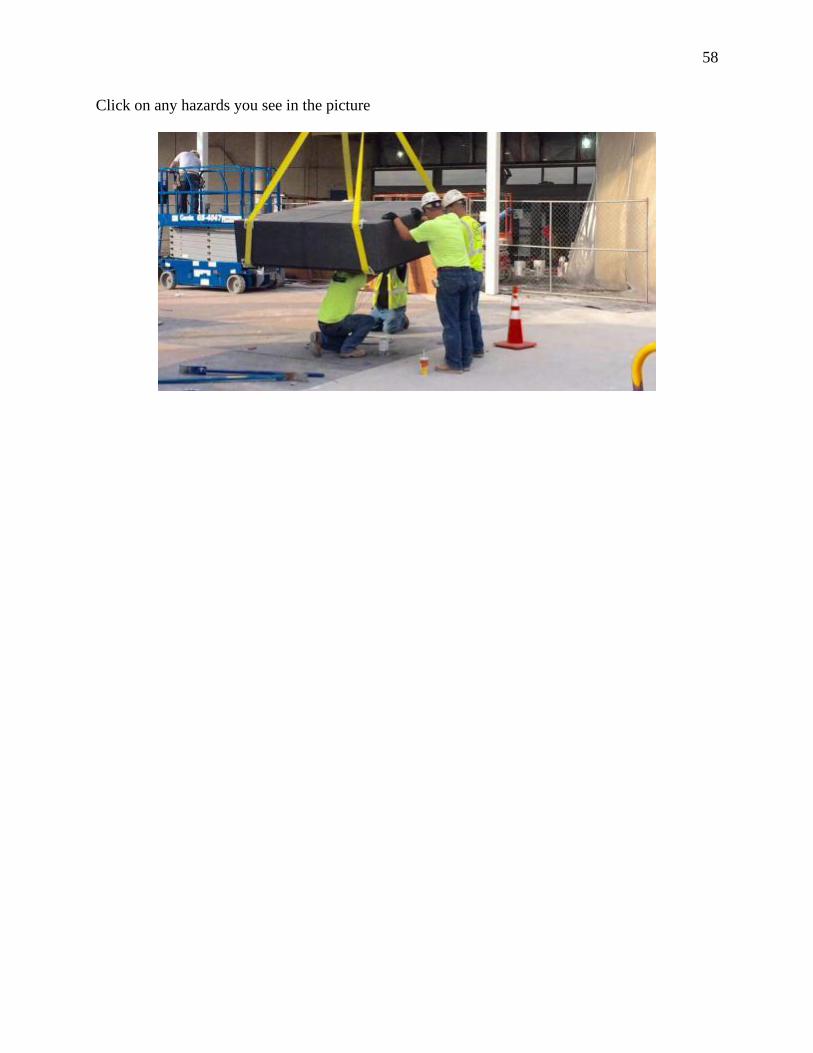
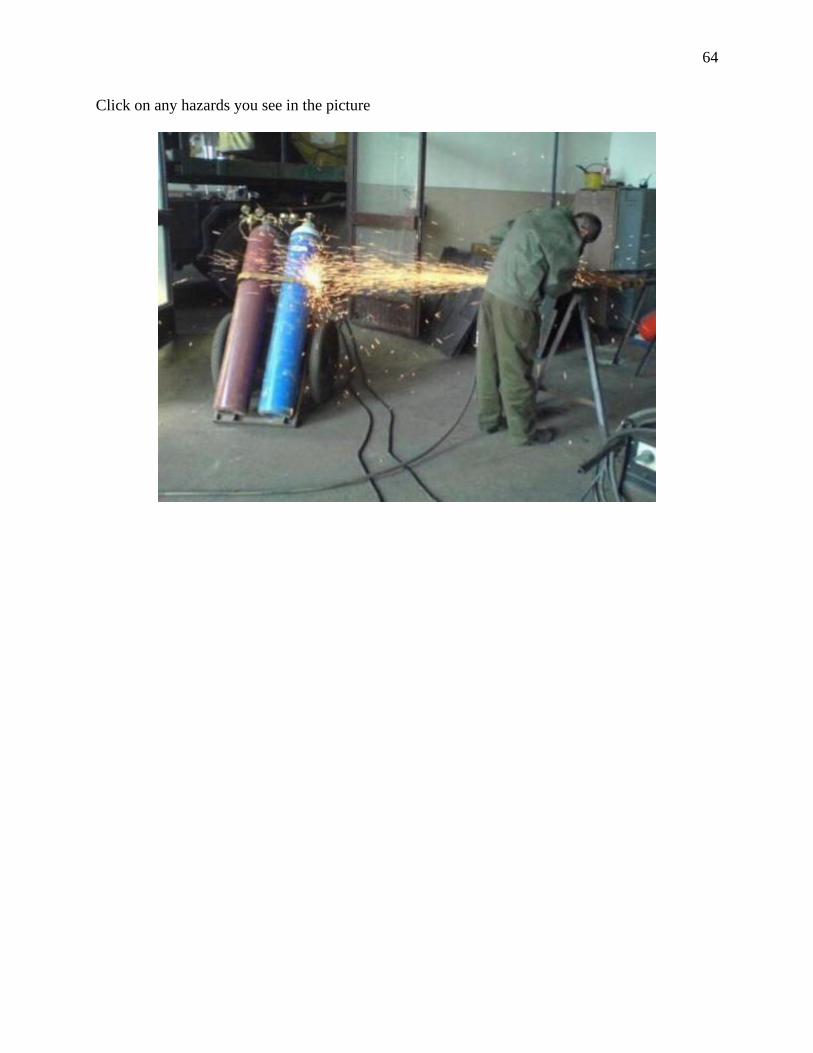
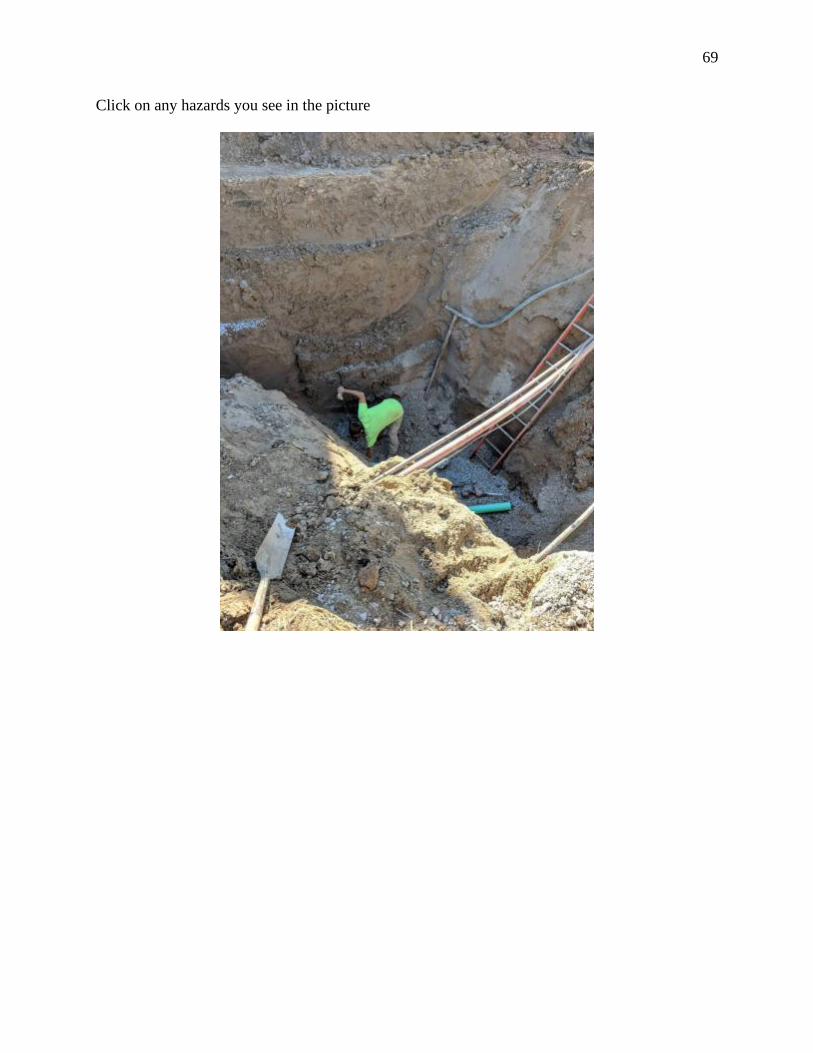
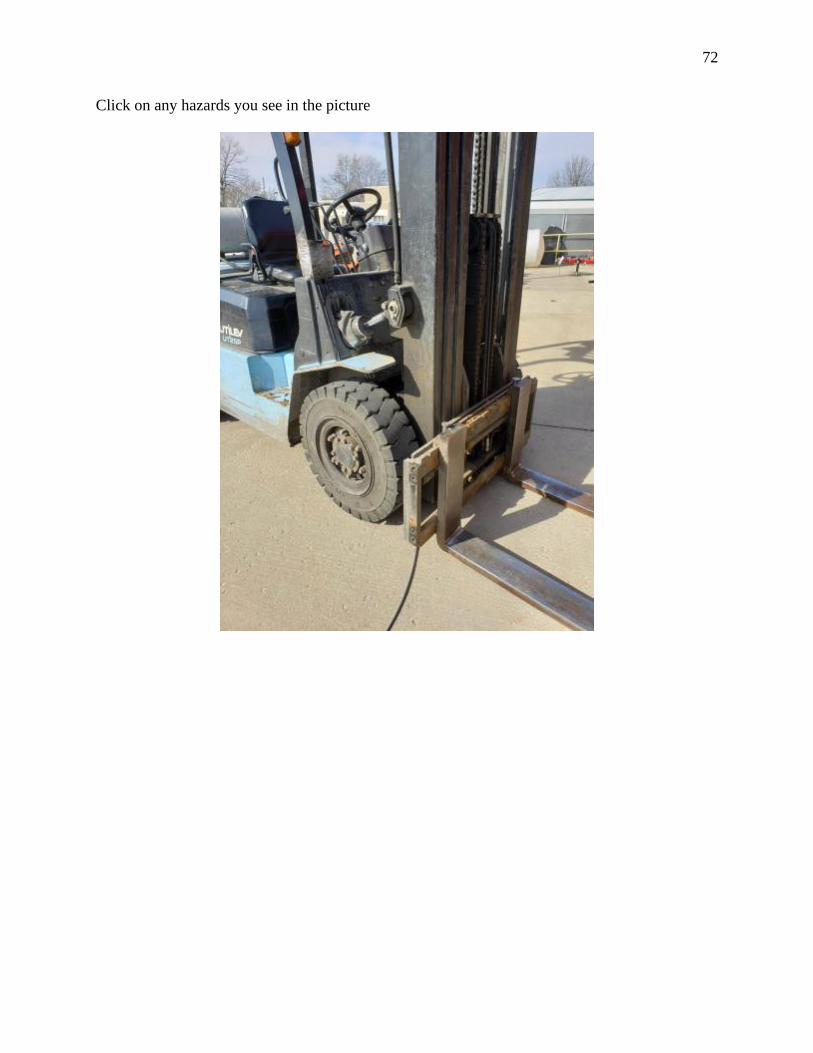
Next, you will receive a series of 10 images. Please identify any hazards that you see within the
picture by clicking on the hazard. If you do not see any hazards, just move on to the next picture.
Click on any hazards you see in the picture

52
Click on any hazards you see in the picture

53
Click on any hazards you see in the picture

54
Click on any hazards you see in the picture

55
Click on any hazards you see in the picture
56
Click on any hazards you see in the picture

57
Click on any hazards you see in the picture
58
Click on any hazards you see in the picture

59
Click on any hazards you see in the picture

60
Click on any hazards you see in the picture

61
Click on any hazards you see in the picture

62
Click on any hazards you see in the picture

63
Click on any hazards you see in the picture
64
Click on any hazards you see in the picture

65
Click on any hazards you see in the picture

66
Click on any hazards you see in the picture

67
Click on any hazards you see in the picture

68
Click on any hazards you see in the picture
69
Click on any hazards you see in the picture

70
Click on any hazards you see in the picture

71
Click on any hazards you see in the picture
72
Click on any hazards you see in the picture

73
Click on any hazards you see in the picture

74
Click on any hazards you see in the picture

75
Click on any hazards you see in the picture
Thank you for your participation in this survey. Your response is greatly appreciated.

76
Appendix C: Raw Data Tables

77

78

79

80

81
Score Expected Average
0.00 9.27
-2.05 7.87
-1.75 4.73
-1.58 10.00
-1.09 8.27
-1.48 8.53
-1.10 8.47
0.03 1.00
-2.38 7.60
-1.27 7.30
CSP
Score Expected Average
-1.87 8.53
0.03 1.00
-0.92 4.77
SMS
Score Expected Average
0.32 8.67
0.03 1.00
0.00 9.27
-1.65 5.40
-2.38 7.60
-0.74 6.39
ASP
Score Expected Average
-1.95 4.00
0.00 9.27
-1.87 8.53
0.03 1.00
-1.65 5.40
-1.09 5.64
OHST
Score Expected Average
0.00 9.27
-1.87 8.53
0.03 1.00
-0.61 6.27
CHST
Score Expected Average
0.03 1.00
-1.59 2.67
-1.68 6.80
-1.08 3.49
STS
Score Expected Average
0.03 1.00
0.03 1.00
STSC
Score Expected Average
0.03 1.00
0.00 9.27
-1.52 5.40
-0.49 5.22
CIT
Score Expected Average
-1.76 7.13
0.03 1.00
-0.86 4.07
GSP
Score Expected Average
0.03 1.00
0.03 1.00
TSP

82
Score Expected Average
-1.41 7.87
-1.50 5.27
-1.95 4.00
-1.13 3.53
-1.42 6.60
-1.26 8.67
-1.42 1.53
-1.14 8.00
-1.76 7.13
0.08 9.47
-1.52 9.13
-1.17 7.73
-1.48 8.53
-1.74 8.13
0.03 1.00
-1.86 8.20
-1.43 4.47
0.00 9.27
0.32 8.67
-2.38 7.60
-1.59 2.67
-1.63 3.40
-1.69 3.73
-1.68 6.80
-1.28 6.31
OSHA 10-General
Score Expected Average
-1.95 4.00
-1.13 3.53
-1.42 6.60
-1.76 7.13
-1.58 10.00
-1.52 5.40
0.08 9.47
0.03 1.00
-1.86 8.20
-1.48 6.33
0.00 9.27
0.32 8.67
-2.38 7.60
-1.63 3.40
-1.16 6.47
OSHA 10-Hour Construction
Score Expected Average
-1.41 7.87
-1.95 4.00
-1.42 6.60
-1.80 6.67
0.08 9.47
-1.17 7.73
-1.48 8.53
0.03 1.00
-1.48 1.80
-1.86 8.20
0.00 9.27
0.32 8.67
-1.57 6.80
-1.63 3.40
-1.74 8.13
-1.68 6.80
-1.17 6.56
OSHA 30-Hour General

83
Score Expected Average
-1.48 6.33
-1.42 6.60
-1.26 8.67
-1.58 10.00
-1.52 5.40
0.08 9.47
0.03 1.00
-1.86 8.20
0.00 9.27
0.32 8.67
-1.63 3.40
-1.74 8.13
-1.00 7.09
OSHA 30-Hour Construction
Score Expected Average
0.03 1.00
0.03 1.00
CIH
Score Expected Average
-1.81 9.73
-1.41 7.87
-1.23 8.40
-1.86 8.20
-1.65 5.40
-2.05 7.87
0.32 8.67
0.28 7.27
-1.87 8.53
-1.75 4.73
-1.58 10.00
-1.48 3.73
0.08 9.47
0.16 7.07
-1.17 7.73
-1.48 8.53
-1.69 3.73
-1.46 4.60
-1.32 8.40
-1.21 7.36
Other

84
Score Expected Average
-1.48 4.80
-1.45 4.27
-1.25 4.47
-1.28 5.40
-1.21 7.33
-1.60 6.13
-1.35 7.40
-1.58 6.47
-1.24 4.20
-1.31 2.40
-1.07 4.33
-1.23 3.33
-1.35 4.40
-1.48 3.73
-1.45 8.40
-1.52 9.13
-1.50 5.53
-1.48 4.93
-1.71 5.33
-1.22 7.73
-1.46 4.60
-1.39 5.44
Only On-the-Job
85
Expected Score Score
10 -3.00
5 -1.00
9 -1.00
3 -1.00
9 -2.00
0 0.00
10 -2.00
8 0.00
9 -1.00
9 -1.00
7 -1.00
9 -1.00
10 -1.00
7 -1.00
8 -1.00
10 -2.00
9 0.00
9 -1.00
10 -1.00
10 -1.00
9 -1.00
9 0.00
8 0.00
8 0.00
9 -2.00
8.16 -1.00
Personal Protectice Equipment (PPE)
Expected Score Score
4 -2.00
0 0.20
10 0.00
10 0.40
7 -2.00
3 -1.80
7 -1.20
8 -2.38
7 0.00
7 -2.00
1 -1.60
7 -1.25
8 0.00
10 -2.67
8 0.00
6 -1.38
5 0.33
10 -1.50
9 1.67
10 -1.38
9 -1.63
10 -1.13
7 -1.80
10 0.00
10 -1.67
5 -2.33
6 -1.63
10 -1.13
7 -1.13
10 0.00
10 -2.33
5 0.13
7 0.20
9 -1.33
8 -1.40
7.43 -1.02
Fall Protection
Expected Score Score
6 -2.33
8 -2.00
5 -1.40
3 0.20
10 0.00
9 1.00
10 1.00
6 -1.75
6 -2.00
10 -1.50
9 -1.67
7 0.50
6 -2.00
5 -1.33
9 -1.67
6 -1.50
6 -2.00
9 0.50
7 -1.33
10 -2.00
7 -2.00
1 -3.00
2 0.00
10 1.00
10 0.50
9 1.00
1 0.40
8 -1.25
10 0.25
9 -2.00
6 -3.00
4 -2.33
6 1.00
10 -1.67
8 -3.00
9 0.00
5 -1.60
10 -1.50
10 -1.33
6 -1.33
10 1.00
8 -2.00
10 0.00
7 1.00
10 -1.67
4 -2.00
9 -2.33
10 1.00
9 -2.00
10 1.00
10 1.00
10 1.00
9 -2.00
7.62 -0.89
Machine Guarding

86
Expected Score Score
6 0.00
8 -2.33
7 1.00
1 -1.33
9 -1.50
8 1.00
7 0.00
2 0.00
6 0.00
1 0.00
2 0.00
3 -3.00
10 1.00
3 0.50
1 0.33
3 0.00
10 -2.00
5 0.50
6 0.00
8 -5.00
2 -4.00
10 0.00
1 -3.00
8 0.00
6 -2.50
5 1.00
2 -4.00
2 0.00
5 0.50
5 0.00
5 0.00
1 0.50
6 -7.00
5 -3.00
9 -2.00
8 -8.00
5.17 -1.18
Rigging
Expected Score Score
7 -2.00
3 -2.00
8 -1.80
3 -1.33
1 -1.20
3 -2.00
10 0.50
1 0.00
9 -3.00
1 -1.60
1 0.00
3 1.00
10 -2.50
1 -1.20
4 -1.67
0 0.33
6 0.00
5 0.50
1 -1.20
6 -1.33
9 0.00
3 0.00
8 -2.00
8 0.00
7 -2.67
5 0.00
2 -1.67
3 0.00
3 0.50
4 -1.20
4 0.00
1 -1.33
5 0.67
8 -2.00
7 -2.00
7 1.00
4.64 -0.87
Excavation
Expected Score Score
7 -2.00
9 -2.00
10 -2.50
5 -1.64
5 -2.00
10 -4.00
4 0.14
3 1.00
8 -1.33
3 -1.50
8 1.00
2 -2.00
10 1.00
10 -1.88
5 -3.00
3 -1.50
8 -1.50
3 -1.67
8 -1.91
10 0.00
6 1.00
8 -1.86
8 -1.88
5 -1.50
10 -3.00
5 1.00
7 -1.50
10 0.25
10 0.00
8 -1.75
7 -1.33
4 -1.33
3 -1.71
5 1.00
10 -2.13
9 -6.00
4 0.00
10 -1.91
9 -2.25
7 -2.50
10 0.00
10 -3.09
8 -1.63
7 -2.67
5 -2.00
10 1.00
10 0.11
6 -1.88
10 -1.60
8 -1.56
4 -1.55
8 -1.25
7 -2.40
10 0.00
9 -1.75
7.24 -1.36
Ladders
87
Expected Score Score
5 0.00
4 -1.50
1 1.00
9 -2.25
8 -2.00
2 0.17
10 0.50
9 -1.33
1 0.00
2 0.00
2 -1.33
10 -1.25
7 -1.50
1 -1.25
2 1.00
10 -1.17
5 0.25
2 0.50
1 -2.00
5 -1.17
4 -1.50
10 -1.50
5 1.00
10 1.00
1 -1.25
4 0.00
4 -1.50
7 0.17
9 -1.67
5 -1.75
5.17 -0.68
Scaffolding
Expected Score Score
4 -2.00
10 -1.33
5 -1.33
8 -1.33
7 -1.33
3 0.33
10 -1.33
7 -2.33
8 -2.00
10 -2.00
0 -1.33
9 0.33
9 -2.33
1 -2.33
9 0.33
6 -2.33
2 -1.33
8 -1.33
10 -2.00
5 -2.00
3 -1.33
7 -2.00
4 -1.33
7 -1.33
8 -2.00
3 -2.33
10 -1.33
8 0.33
6.46 -1.44
Fork Trucks
Expected Score Score
0 -1.33
4 -1.33
8 0.33
0 1.00
8 1.00
10 0.00
7 1.00
9 0.33
5 0.33
7 0.00
9 0.33
3 0.33
4 0.00
10 -1.33
3 0.33
10 0.33
8 0.33
10 0.33
10 0.33
5 -1.33
6 0.33
1 0.67
8 1.00
7 -1.33
9 0.00
6.44 0.07
Aerial Lifts

88
Expected Score Score
7 0.50
2 0.33
10 -2.33
4 1.00
4 -1.80
9 0.00
10 -1.60
3 -1.80
4 1.00
9 0.50
9 0.33
1 -1.50
7 -1.40
3 0.00
10 -1.33
8 -1.50
9 -2.50
5 0.33
5 -1.50
2 -2.00
3 0.33
0 -1.67
8 -2.00
7 -2.33
3 -1.40
10 -1.33
10 -2.20
5 -1.33
5 -1.50
5 -1.50
2 -5.00
8 -1.80
5 0.00
1 -3.50
7 -3.00
0 -2.50
7 -2.80
10 -1.67
9 0.00
6 -3.00
5.80 -1.34
Welding Expected Score Score
8 -1.40
1 -1.56
5 -1.60
6 0.25
1 -1.67
7 -1.11
10 -1.50
8 -2.50
9 -1.89
10 -1.60
2 -1.33
5 -2.50
9 0.44
0 -2.20
5 -1.50
10 -2.25
7 -1.25
10 -1.60
8 1.00
9 0.00
8 1.00
4 -2.33
3 -1.50
5 -1.50
10 0.33
6 -1.44
7 -3.00
2 0.00
10 -1.50
3 -1.22
8 1.00
10 -1.20
8 -1.20
5 -2.00
5 -2.20
7 0.00
9 -1.25
5 -1.80
5 -2.20
7 0.40
7 -1.56
9 0.25
7 -1.25
6.51 -1.16
Electrical
Expected Score Score
7 -1.6
1 1
10 1
5 1
6 0.2
3 0.2
9 -1.5
8 -1.75
1 -1.2
4 -2
1 -1.75
5 0.25
5 -1.5
5 1
8 -2
10 1
2 -1.75
10 -1.6
9 -1.5
9 -1.75
9 1
8 -1.4
5 0
10 1
10 0.25
10 0
3 -1.25
3 1
8 1
6 1
9 0
10 -1.25
9 -2
3 -1.5
8 0.4
1 0.2
10 0.4
8 1
7 0.00
6.54 -0.37
Warehousing and Storage