
Identifying Profiles of Reading Strengths and Weaknesses ...
141
Identifying Profiles of Reading Strengths and Weaknesses at the Secondary Level A DISSERTATION SUBMITTED TO THE FACULTY OF THE GRADUATE SCHOOL OF THE UNIVERSITY OF MINNESOTA BY Allison M. McCarthy Trentman IN PARTIAL FULFILLMENT OF THE REQUIREMENTS FOR THE DEGREE OF DOCTOR OF PHILOSOPHY Theodore J. Christ, Advisor May, 2012
Transcript of Identifying Profiles of Reading Strengths and Weaknesses ...

Identifying Profiles of Reading Strengths and Weaknesses at the Secondary Level
A DISSERTATION
SUBMITTED TO THE FACULTY OF THE GRADUATE SCHOOL
OF THE UNIVERSITY OF MINNESOTA
BY
Allison M. McCarthy Trentman
IN PARTIAL FULFILLMENT OF THE REQUIREMENTS
FOR THE DEGREE OF
DOCTOR OF PHILOSOPHY
Theodore J. Christ, Advisor
May, 2012

Allison M. McCarthy Trentman, 2012

i
Acknowledgements
My graduate school career at the University of Minnesota has been a positive and
rewarding experience. I could not have achieved this goal without the help of many
mentors, friends, and family. First, I would like to thank my advisor, Ted Christ, for his
continued support and encouragement throughout this process. I am grateful for the many
professional opportunities he afforded me, and have learned a great deal from each of
them, which will benefit me in future career endeavors. I would also like to thank my
committee members for their support and guidance: Sandy Christenson, Kristen
McMaster, and Annie Hansen. They raised the level of my critical thinking, and I valued
and learned from their expertise throughout the process.
I would also like to thank my peers and colleagues in the program that helped me
laugh in below zero degree weather and whose friendships I will enjoy for years to come.
Finally, I would like to thank my family; without them, I would not be where I am today.
To both of my parents, who always taught me that the “world is my oyster”, I owe this
achievement to you. I cannot express how much your love and support has given me the
strength to pursue every goal I have set for myself. To my mother, who has instilled in
me a life-long passion for literacy; your professional accomplishments and recognition
push me every day to do more for students who would otherwise fall through the cracks.
And last, but definitely not least, to my husband, Tom, whose patience and support
throughout my time in graduate school made it possible for me to continue to pursue my
goals, despite the 1200 miles between us. Thank you for your level-headedness and
unconditional love, as you stood by my side.

ii
Abstract
The purpose of this study was to evaluate the feasibility and potential utility of
reading profiles to identify common patterns of reading strengths and weaknesses among
students in high school with deficit reading skills. A total of 55 students from three
Midwestern high schools were administered a battery of assessments that targeted
specific reading skills, as well as a self-report survey that assessed motivation. A cluster
analysis revealed that four distinct profiles were present within the sample and that
instruction may be differentiated among a subset of the profiles on some subskills. Profile
characteristics accurately and adequately represented individual student characteristics,
which may indicate that small group interventions could be devised based on the
collective group deficits, which places this study within the problem analysis context.
The current study extended the link between assessment and intervention for reading at
the secondary level and illuminated the need for further research. Implications for the
research and practice of school psychologists are discussed.

iii
Table of Contents
List of Tables iv
List of Figures v
Chapter 1: Introduction 1
Statement of the Problem 3
Purpose 4
Chapter 2: Literature Review 7
Theoretical Underpinning: The Simple View of Reading 7
Reading Acquisition 8
Reading Instruction 27
Struggling High School Readers 32
Motivation in the Context of Struggling Secondary Readers:
Achievement Goal Theory 46
Summary 49
Chapter 3: Method 51
Participants & Settings 51
Procedures 52
Measures 53
Data Analyses 56
Chapter 4: Results 59
Question 1 67
Question 2 71
Question 3 79
Question 4 80
Question 5 87
Question 6 89
Chapter 5: Discussion 104
Summary of Findings 105
Implications 112
Limitations 113
Future Directions and Conclusions 116
References 120
Appendix A 128
Appendix B 130

iv
List of Tables
Table 1. Descriptive statistics for instruments. 59
Table 2. Skewness and kurtosis by instrument. 60
Table 3. Skewness and kurtosis by subskill. 60
Table 4. Instruments used to measure each subskill. 62
Table 5. Correlation matrix for measures using z-scores. 64
Table 6. Descriptive statistics for each subskill by profile. 70
Table 7. Comparison of profiles between high school sample (current study)
and elementary sample (Buly & Valencia, 2002). 80
Table 8. One-way ANOVA results for differences between subskills. 82
Table 9. Tukey’s post hoc analysis for differences between profiles on
phonics measures. 83
Table 10. Tukey’s post hoc analysis for differences between profiles on
fluency measures. 84
Table 11. Tukey’s post hoc analysis for differences between profiles on
vocabulary measures. 85
Table 12. Tukey’s post hoc analysis for differences between profiles on
comprehension measures. 86
Table 13. One-sample t-test results by cluster and subskill. 88
Table 14. Frequency counts and means for Quick Word Caller profile
responses on the ISM. 90
Table 15. Frequency count and means for Lowest Reader profile responses
on the ISM. 93
Table 16. Frequency counts and means for Quick and Accurate profile
responses on the ISM. 96
Table 17. Frequency counts and means for Quick Comprehenders profile
responses on the ISM. 99
Table 18. Means of responses (based on a Likert scale) on ISM dimensions
by profile. 102

v
List of Figures
Figure 1. Confirmatory Factor Analysis: Model 3. 66
Figure 2. Graphical presentation of Quick Word Caller profile by z-score
and subskill. 73
Figure 3. Graphical presentation of Lowest Reader profile by z-score
and subskill. 74
Figure 4. Graphical presentation of Quick and Accurate profile by z-score
and subskill. 76
Figure 5. Graphical presentation of Quick Comprehenders profile by
z-score and subskill. 78
Figure 6. Dendrogram by average linkage, derived from hierarchical
cluster analysis. 130
Figure 7. Responses to task dimension (ISM) overall and by profile. 131
Figure 8. Responses to effort dimension (ISM) overall and by profile. 131
Figure 9. Responses to competition dimension (ISM) overall and by
profile. 132
Figure 10. Responses to social power dimension (ISM) overall and by
profile. 132
Figure 11. Responses to affiliation dimension (ISM) overall and by
profile. 133
Figure 12. Responses to social concern dimension (ISM) overall and
by profile. 133
Figure 13. Responses to praise dimension (ISM) overall and by profile. 134
Figure 14. Responses to token dimension (ISM) overall and by profile. 134

1
Chapter 1
Introduction
Reading acquisition is a complex process that begins early with the expected
outcome of comprehension (Alonzo, Basaraba, Tindal, & Carriveau, 2009; National
Reading Panel [NRP], 2000). Comprehension is the target of reading development and
instruction. Along the way, children acquire concepts of print, phonological awareness
skills, phonics skills, reading fluency, and vocabulary. Ultimately, a student “reads to
learn” (Chall, 1983), particularly once they are past third grade. This is especially true for
students at the secondary level. Their courses are content heavy and, without adequate
reading skills, they may have trouble acquiring the content necessary to achieve success
in the classroom. Unfortunately, many students do struggle throughout their school career
without adequate or appropriate instruction to help improve their reading skills. The
accountability era highlights this pitfall in high school education. Secondary students are
not making significant gains on high stakes reading tests (Edmonds, Vaughn, Wexler,
Reutebuch, Cable, & Klingler Tackett, et al., 2009; Deschler et al., 2001; National
Assessment of Educational Progress [NAEP], 2009). For instance, although 17 year old
students performed higher on the 2008 long-term trend assessment in reading, as
compared to scores from 2004, the scores were not significantly different. Moreover,
there has been no significant difference (or gain) in performance on the reading
assessment (at age 17) since 1971 (NAEP, 2009). It is likely that students with deficit
reading achievement in high school also struggled in elementary and middle school
(Fuchs, Fuchs, & Compton, 2010; Snow, Burns, & Griffin, 1998). These students who

2
never received adequate instruction and did not acquire the necessary skills in reading
may have specific weaknesses that undermine reading efficiency and reading
comprehension. Such deficits effectively limit their capacity to read to learn. Educators
need to identify the area of greatest need for each student who experiences
comprehension breakdown (Edmonds et al., 2009). Students’ reading strengths and
weaknesses (skills) need to be assessed to improve the link between assessment and
intervention.
In the past, aptitude by treatment interactions (ATI) were promoted, but then later
debunked. ATI was first identified as a means of determining the best ‘treatment,’ or
intervention, for an individual or group of individuals based on a particular ability
(aptitude) (Cronbach, 1957). Cronbach (1957) emphasized the examination of individuals
and treatments in a simultaneous manner, meaning that characteristics of both should be
considered in order to identify the most effective treatment. ATI relied on the assumption
that one individual will learn better from one curriculum, instructional procedure, or
accommodation based on their aptitude. Twenty years later, Cronbach and Snow (1977)
dismissed ATI because no research generated evidence to support the approach.
Cronbach and Snow (1977) determined that too many ‘interactions’ existed that could not
be tested; thus, parsing out all moderating factors for the purpose of identifying the best
treatment was like a “hall of mirrors,” and therefore, unreliable. Reschly and Ysseldyke
(2002) described the shift to ATI, then away from ATI, and now the shift to problem
solving as best practice. Within the problem-solving model, there is a focus on improving
alterable variables rather than aptitudes or abilities (Christ, 2008; Deno, 2005; Deno,

3
1986). These alterable variables might be considered ‘skills,’ which are observable and
measurable, and there is an expectation for progress within the skill once the appropriate
intervention is applied. This approach must be applied at the secondary level for students
whose limited reading success likely affects text comprehension.
Students who have reading difficulties may have particular trouble in the area of
comprehension (Edmonds et al., 2009). Many agree that this is true; however, there is
disagreement on the possible cause of the deficit. Among these perspectives are
phonological awareness (limited research), phonics and decoding, fluency, vocabulary,
and various metacognitive strategies (Fuchs et al., 2010). In other words, researchers
make a case for why one of these is the primary reason for comprehension difficulties.
Therefore, it may be useful to identify patterns of strengths and weaknesses that
contribute to comprehension deficits. This approach aligns with the second step of the
problem solving process: problem analysis. The purpose of problem analysis is to
identify the “salient characteristics” (Christ, 2008) of the defined problem. In the context
of the current study, those characteristics are the underlying subskills of reading. Once
these are identified, they can be used to identify potential solutions to the problem
(Christ, 2008). In turn, the possibility of informing instruction becomes greater, as
previous evidence suggested that one approach to reading instruction does not serve all
students equally (Buly & Valencia, 2002; 2003; 2005; Vaughn et al., 2010; Wexler,
Vaughn, Edmonds, & Reutebuch, 2008).
Statement of the Problem. Statistics showed that a large percentage (69%) of
high school students have not mastered the skills they need to acquire information from

4
content area classes (Institute of Education Sciences [IES], 2008), based largely on the
fact that they have reading deficits that impact their ability to comprehend written text.
Furthermore, repeated failure to make progress in the area of reading impacts a student’s
level of motivation. Struggling students become less motivated to put effort into tasks
that have been difficult for many years (Brophy, 2004; Guthrie, 2008; Ryan & Deci,
1991). In general, struggling students do not have a desire to engage in their schoolwork,
which often results in poor academic performance (Guthrie, 2008). Much of adolescents’
self-perception grows out of previous experiences (Brophy, 2004; Guthrie, 2008). If a
student has struggled in school from elementary school to high school, he or she is likely
to develop negative self-perceptions. This has negative implications for the success of
that student. As such, motivation to read and acquire new information may be impaired
by skill deficits in reading.
Explicit instruction is best informed when reading weaknesses are specifically
identified. Otherwise, students may fail at post-secondary options, such as college and
work settings, where students are expected to function independently and use written text
to learn new information (Alvermann, 2002). Identifying profiles for students who have
difficulty with reading comprehension might inform interventions and instruction to
increase achievement within the domain of reading and other content areas (Edmonds et
al., 2009; IES, 2008) with further hope of increasing the overall achievement of these
students.
Purpose. This study should be considered within the context of problem analysis:
before a hypothesized solution can be implemented, it is necessary to first identify the

5
salient characteristics (reading strengths and weaknesses) of the defined problem (low
reading achievement). The purpose of this study was to evaluate the potential to engage
in individualized assessments that yield information that is relevant and useful to select or
design interventions for students in high school with deficit reading skills. To meet this
goal, profiles of reading strengths and weaknesses were identified. These profiles were
compared to profiles already identified in the elementary reading literature (Buly &
Valencia, 2002), which were widely cited in current profile studies at the secondary level
(Brassuer-Hock, Hock, Kieffer, Baincarosa, & Deshler, 2011; Hock, Brasseur, Deshler,
Catts, Marquis, Mark et al., 2009; Lesaux & Kieffer, 2010). The instruments,
methodology, and analysis employed were also similar to the current study (Buly &
Valencia, 2002), which provided further rationale for comparison. The stability of those
profiles was examined to determine whether they might be useful for intervention
development. Motivation is also integral to student success and was examined in
comparison to profile membership.
The following research questions guided this study:
1. To what extent can reading skills profiles be identified at the secondary level?
2. What reading strengths and weaknesses are present for each identified profile?
3. To what extent are reading profiles for secondary students similar to those of
elementary students, as determined by Buly and Valencia (2002)?
4. To what extent can subskill strengths and weaknesses within each profile be used
to develop targeted interventions?
5. To what extent will profile stability be related to group or individual deficits?

6
6. Does student level of motivation vary based on his/her reading skills profile?

7
Chapter 2
Literature Review
This chapter will 1) briefly describe a theoretical underpinning of reading; 2)
summarize theories of reading acquisition as it pertains to each reading domain, and
deficits within each domain; 3) focus on achievement on reading domains at the
secondary level; 4) summarize the typical trajectory of reading instruction; 5) summarize
the prevalence of secondary students who struggle with reading achievement; 6)
summarize the history of reading interventions at the secondary level; 7) expand on
problem analysis for secondary students; 8) summarize a profile study at the elementary
and secondary level; and 9) summarize achievement motivation as it relates to struggling
readers.
Theoretical Underpinning: The Simple View of Reading
The Simple View of Reading holds that the process of reading consists of two
component skills, decoding and linguistic comprehension (Hoover & Gough, 1990). It
also holds that the process of reading is not serial, that it is a bottom-up and top-down
process, in which reading skills build upon one another. For instance, readers can make
progress in a higher level skill without necessarily achieving all lower level skills. In the
Simple View, decoding was defined as efficient word identification. Linguistic
comprehension was defined as the ability to understand word meanings and language in
order to make interpretations and inferences. Both components are required in order to
achieve reading success. Hoover and Gough (1990) presented decoding and linguistic
comprehension as variables ranging from zero to one, and that reading is the product of
8
the two components. A reader cannot be completely deficient in one and expect to read
text. Therefore, it is a multiplicative process (R = D X LC) and each are necessary,
although not sufficient alone; even some level of decoding or linguistic comprehension
skill will help facilitate the reading process. This implies that instruction in one
component will advance overall reading success. The Simple View of Reading is
appropriate within the context of the current study because individual subskills of reading
were examined. Although more than two components of reading were included, the
purpose of identifying profiles of reading strengths and weaknesses (of subskills) was to
determine which skills were limiting students’ progress in the area of reading
achievement. The following discussion of reading acquisition adds to the theoretical
framework presented here.
Reading Acquisition
Ehri (2005) described the phases of typical reading development to include pre-
alphabetic, partial alphabetic, full alphabetic, and consolidated alphabetic. Students
learning to read during the pre-alphabetic stage have not acquired letter-sound
correspondence knowledge, so they “read” based on memory for letter shapes and word
features. Ehri and Wilce (1987; Juel, Griffith, & Gough, 1986) call this “cue” reading.
Once students learn some letter names and sounds, they are able to identify some words;
this occurs as students move into the partial alphabetic phase. During this phase,
students’ partial knowledge of letter sounds means that they do not have a complete
knowledge of phonemes, limiting the capacity to read all words. Once students do have
complete knowledge of spelling patterns and letter-sound correspondences, they are able

9
to read sight words, moving them to the full alphabetic phase and they have mastered
phonological awareness skills in this phase. Finally, students reach the consolidated
alphabetic phase as they add more sight words to memory. During this phase, readers
have memorized letter patterns, and letter-sound correspondences are consolidated into
larger units, making word identification more automatic. As students progress through
the phases of reading development, the newly learned skills support previously learned
skills (Ehri, 2005). This implicates a top-down, bottom-up concept of the reading process
(e.g., the Simple View of Reading).
Beyond these phases of reading development, research and theory also implicated
specific reading subskills that contribute to reading success (Rapp, van den Broek,
McMaster, Kendeou, & Espin, 2008), which also means that failure to obtain these
subskills may lead to difficulty with comprehension (Edmonds et al., 2009). Research has
shown that many students who enter high school with adequate skills in decoding and
fluency may not have adequate skills in comprehension (Underwood & Pearson, 2004).
Therefore, success across all subskills, including comprehension, may be necessary to
learn new information from texts. The earliest acquired subskill that might play a role in
comprehension difficulties is phonological awareness. Phonological awareness is
knowledge and manipulation of letter sounds and word chunks that are produced orally
(NRP, 2000). This means that one can identify, and is aware of, individual units of sound
and syllables in a word. This skill is the precursor to phonics in which sound-symbol
correspondences are learned. In phonics, students learn that each sound is represented by
a symbol and that these symbols are used to make up words in print. Once a child can

10
identify words through print, they have the potential to become more fluent in reading.
They are more accurate and quick to identify words in text. Reading becomes an
automatic process and children begin to build a personal vocabulary (lexicon), primarily
dependent upon what they have read.
A strong relationship exists between vocabulary and comprehension. Some
researchers even argue that these two domains cannot be separated (NRP, 2000).
Comprehension is defined as a coordinated process of reading subskills in which
information is acquired; comprehension is the end goal for reading instruction. Young
readers should be able to engage in literal, inferential, and evaluative comprehension
tasks. Literal comprehension is simply recall of information from the text, whereas
inferential and evaluative comprehension tasks require higher-level thinking skills
(Alonzo et al., 2009). They both require synthesis and analysis skills. If a student is able
to recall basic information from a text, they are more likely to synthesize and analyze the
information as well (Alonzo et al., 2009). Conversely, synthesis and analysis might be
impossible if the reader cannot recall simple facts from the text. This phenomenon is yet
another example of the top-down and bottom-up processes involved in reading (e.g., the
Simple View of Reading). Instruction and interventions often focus on lower level skills,
such as phonological awareness and phonics and decoding, based on the assumption that
improving these skills will positively impact comprehension skills (Rapp et al., 2007).
However, this approach may not be appropriate or effective for some students.
Reading subskills are generally instructed in a sequential, chronological fashion
because they build upon one another. However, as a child learns a more complex skill,

11
reading development refines the knowledge of the lower level skill. For instance, as more
words are added to a student’s lexicon, they are automatically decoded. As a result,
fluency increases. Then, as fluency improves and automaticity is achieved, more
cognitive resources can be used to comprehend the text (LaBerge & Samuels, 1974).
Again, both examples provide evidence for a bottom-up and top-down process of reading
(Hoover & Gough, 1990). Practicing and refining one skill will likely aid in the
development of another skill (Afflerbach, 2004; Ehri, 2005). That said, this course of
development may only be true for typically developing students, despite the sequential
instruction that students traditionally receive. In contrast, a student who exhibits
difficulty with reading fluency may still succeed in comprehending the text. In this case,
a student has developed strategies to overcome those difficulties. Therefore, it is not
accurate to state that reading subskills are strictly sequential and that each successful
reader must have equal success in each skill (Hoover & Gough, 1991).
Some studies have demonstrated success when lower level skills such as
phonological awareness and decoding are targeted, but success is not uniform across
interventions (Edmonds et al., 2009; Wexler et al., 2008). Cutting and Scarborough
(2006) suggested that even if lower level skills are targeted and improved,
comprehension skills may not improve. About 3% of poor readers, especially older poor
readers, are successful at word recognition but not comprehension. Overall, the research
appeared to be inconclusive in terms of determining intervention targets and assessing
comprehension requires the examination of multiple components of reading. A more
detailed description of these subskills demonstrates the relationship among them.

12
Phonological awareness. Phonological awareness is the knowledge about and
ability to identify and manipulate sounds, syllables, and rimes in oral language (Bentin &
Leshem, 1993; NRP, 2000; Stahl & Murray, 1994). The skill is highly correlated with,
and is considered one of the best predictors of, overall reading success for students
throughout their schooling years (Ball & Blachman, 1991; Juel, 1988; NRP, 2000; Snow
et al., 1998). Stahl and Murray (1994; Ball & Blachman, 1991) explained that
phonological awareness aids in the acquisition of alphabetic orthography and spelling
skills (Ball & Blachman, 1991). Furthermore, for children to acquire phonics skills, they
must master phonological awareness first (Juel, 1988). Segmentation, deletion,
substitution, and manipulation are the main tasks of phonological awareness that a young
reader should be able to demonstrate. These phonological awareness skills support
learning the symbol-sound correspondence that students are exposed to during phonics
instruction (Juel, 1988).
Phonological awareness deficit. For some struggling readers, the primary cause
for limited reading success may be phonological awareness (Curtis, 2004; Lovett &
Steinbach, 1997). At the elementary level, reading success can be predicted by acquired
skills in this domain (Ball & Blachman, 1991; Juel, 1988; Lovett & Steinbach, 1997;
NRP, 2000; Snow et al., 1998). Phonological awareness skill at the secondary level may
also predict level of reading comprehension (Curtis, 2004). For instance, a high school
student with a reading disability performs similar to that of a 5th
grade reader on
phonological awareness tasks (Curtis, 2004). A student who has difficulty identifying the
relationship between letters and sounds probably also has trouble with word identification

13
(Bhat, Griffin, & Sindelar, 2003). It is unclear whether these prereading skills continue to
impact reading performance at the secondary level, and whether they should be
considered targets for intervention. Moats (2004) proposed that struggling readers at the
secondary level may have trouble with recognizing speech sounds, learning patterns of
word-spelling, and learning word structure , which stems from deficits in fundamental
skills such as phonological awareness (Bhat et al., 2003). Furthermore, struggling readers
may demonstrate difficulty with morphological skills, such as syllable and morpheme
recognition. This may reduce accuracy and rate in identifying words. Moats (2004)
suggested that if these bottom-up skills are explicitly taught to students who struggle with
reading, then comprehension will improve.
Bhat et al. (2003) provided a phonological awareness intervention to older
students to strengthen word identification skills. In a within-group repeated measures
design, all students received one-on-one instruction in phonological awareness skills,
including rhyming; identifying initial and final sounds; blending words, syllables and
phonemes; segmenting words, syllables, and phonemes; deletion; reversal; and
substitution. Authors suggested that improvements were made and phonological
awareness skills were retained, positively impacting overall reading skills (Bhat et al.,
2003). However, validity of results was questioned because one treatment group made
gains prior to receiving the intervention, suggesting that screening measures were not
adequate or that the intervention lacked efficacy.
This study (2003) represented one of the few studies at the secondary level in
which phonological awareness was the focus. Therefore, there was still little evidence to

14
support the opinion that a deficit in phonological awareness affects overall reading
achievement for this population, or that intervention to improve phonological awareness
will improve reading achievement.
Phonics and decoding. Phonics acquisition begins with cue reading and
eventually develops into cipher reading. Cue reading refers to the tendency to memorize a
particular characteristic of a word to be used as a means of recognition (Ehri & Wilce,
1987). However, this learned skill quickly becomes ineffective because there are few
meaningful distinctive cues between words. As a result, readers must learn sound-symbol
correspondences to recognize familiar and unfamiliar words (Ehri & Wilce, 1987),
leading to knowledge for decoding skills once systematic instruction and practice occurs.
Decoding is the identification of words based on sound-symbol correspondences
learned through the development of phonics skills (Kamil, Mosenthal, Pearson, & Barr,
2005). Some assume that adequate word-level decoding skills implicate word-level
comprehension, thus inferring text comprehension (Archer, Gleason, & Vachon, 2003).
Without the ability to decode at the word-level, a reader is not likely to comprehend the
text because attention will be given to more basic reading subskills (Kamil et al., 2005;
NIL, 2007). However, the literature still suggests that decoding is necessary, but not
sufficient for text comprehension (SVR; Hoover & Gough, 1990; Johnston, Barnes, &
Desrochers, 2008).
Phonics and decoding deficit. Some researchers have predicted that one in ten
secondary students encounter difficulties with phonics and decoding (Curtis, 2004).
Archer et al. (2003) claimed that if a student displays adequate listening comprehension

15
but poor reading comprehension, decoding is the main deficit area. Phonics and decoding
deficits may be responsible for students’ failure to meet grade level standards of text
comprehension (IES, 2008). Archer et al. (2003) suggested that many high school
students are reading between second and fifth grade levels and that these students may
have the most trouble with decoding multi-syllabic words (Archer et al., 2003; Curtis,
2004; NIL, 2007). They have mastered single-syllable words and recognize a small
repertoire of high frequency, irregular words. However, students do not systematically
decode multi-syllabic words, making pronunciation of morphemes and affixes difficult.
These same students may also omit syllables completely. This reflects ‘compensatory
reading’ which means that students may understand the alphabetic principle and can
decode some words, but rely on context skills to identify words, rather than completing
word-level analysis (Curtis, 2004). When multi-syllabic words cannot be decoded,
students’ reading skills were estimated at the upper-elementary grades (Archer et al.,
2003). Multi-syllabic words make up the majority of secondary texts, and insufficient
decoding skills would certainly limit comprehension.
Explicit grapho-syllabic instruction helped students read novel words in one study
with 60 students in grades six through ten (Bhattacharya & Ehri, 2004). The grapho-
syllabic instruction included explaining that there is a vowel in each syllable, showing
how to correctly segment syllables, and demonstrating the correct pronunciation of each
syllable. This intervention was compared to a whole word analysis, which simply
consisted of practicing reading multi-syllabic words. Students in the grapho-syllabic
treatment group demonstrated higher performance on reading novel words and nonsense

16
words, with post-test effect sizes ranging from 0.63 to 1.66. This study supported Archer
et al.’s (2003) claim that if secondary students are provided systematic instruction for
decoding multi-syllabic words, they do make gains in reading. As a result, fluency may
improve.
Fluency. Reading fluency is composed of three necessary components: accuracy,
rate, and prosody; achievement of these components is only acquired through reading
practice (NRP, 2000; see LaBerge & Samuels, 1974). Fluency develops as a result of
automatic word identification, which makes up the skill of automaticity (NRP, 2000;
LaBerge & Samuels, 1974).
Reading fluency is frequently measured as words read correct within 60 seconds,
reflecting its component pieces of accuracy and rate. Fluent readers read quickly and they
can usually comprehend texts (Burns, Tucker, Hauser, Thelen, Holmes, & White, 2002).
In contrast, readers who are inaccurate but read quickly are not fluent readers, nor are
they likely to comprehend text (Johnston et al., 2008). Fluency and comprehension form
a direct relationship in that fluency is a precursor to comprehension (Burns et al., 2002;
Wayman, Wallace, Wiley, Ticha, & Espin, 2007); reading rate aids in the process of
comprehension, and a minimum reading rate is necessary for comprehension (Burns et
al., 2002). Although there is evidence that reading rate can be improved at the secondary
level, it is not clear how this impacts comprehension (Curtis, 2004).
Fluency at the secondary level. Typically developing secondary students achieve
high levels of fluency, similar to the fluency of adults. In other words, successful high
school readers are not much different from successful adult readers (Snow et al., 1998).
17
Fluency is measured in words read correct per minute (WRC/min), and this is commonly
used at the elementary level to observe growth (Wayman et al., 2007). Students in first
and second grade typically gain one to two WRC/min throughout an academic year as
they build their fluency and vocabulary. However, typically developing students in upper
elementary and secondary grades do not make such gains (Deno, Fuchs, Marston &
Shinn, 2001). Instead, their annual growth rate of correct words read per minute
decreases until they achieve a growth rate of .60 in either fifth or sixth grade (Deno et al.,
2001). Therefore, widely used and supported measures of oral reading fluency (e.g.,
Curriculum-based Measurement-Reading; Deno, 1985; 1986) may not be sensitive to
growth for high school students (Ticha, Espin, & Wayman, 2009). Yet the relationship
between fluency and comprehension still exists at the secondary level. High school
students must achieve a certain level of fluency in order to adequately comprehend the
complex texts they face in classrooms. However, some researchers estimated that
approximately 90% of poor readers older than fourth grade have a specific difficulty with
accurately and quickly identifying words (Moats, 2004), making them dysfluent readers.
Fluency deficit. This domain of reading is frequently assessed, however, due to
the lack of appropriate fluency measures for students at the secondary level, much less
emphasis is placed on fluency at that level. Regardless, the Theory of Automaticity
(LaBerge & Samuels, 1974) still supports a need for students to decode words
automatically in order to free resources that can be used for comprehension. Perhaps this
is even more important at the high school level where students are expected to construct
meaning and learn new information from texts (Wexler et al., 2008). Rasinski et al.

18
(2005; Alonzo et al., 2009) argued that fluency instruction even at this level can improve
reading comprehension and overall academic success. However, improving fluency itself
at the secondary level has proved difficult to do (Wexler et al., 2008).
Cutting and Scarborough (2006) suggested that reading rate may be a contributing
factor to comprehension deficits. Not only does lower rate of reading contribute to a lack
of cognitive resources (Cutting & Scarborough, 2006; LaBerge & Samuels, 1974), it is
obvious that if a student cannot read through a text in a given amount of time, their
comprehension will suffer. Thus, adequate reading rate becomes a necessity for
successful comprehension. By including speed in a logistic regression, in addition to
decoding and linguistic comprehension skills, comprehension was best predicted (Cutting
& Scarborough, 2006).
In one intervention study, the Great Leaps Program was administered to middle
school students with the targeted goal of increasing fluency (Mercer, Campbell, Miller,
Mercer, & Lane, 2000). The program focused on building fluency for three of the
subskills described in this review: phonics, vocabulary, and comprehension. Forty-nine
students received a five to six minute intervention, daily. Students practiced recognizing
letter-sound correspondences and high-frequency sight words until they reached fluency.
They also engaged in repeated readings until fluency was achieved. All students in the
study made significant gains in reading achievement, supporting the implementation of a
fluency-based intervention for subskills of reading (Mercer et al., 2000). Though this
study yielded positive results, the sample was a sample of convenience. Furthermore, the
author of the Great Leaps Program led the intervention implementation, which may

19
question the validity of results. The study must be replicated with other secondary
populations to demonstrate this intervention’s efficacy.
Repeated reading and vocabulary-previewing interventions positively impacted
comprehension levels and rate in one intervention study (Hawkins, Hale, Sheeley, &
Ling, 2011). Six high school students were exposed to three conditions: control, repeated
reading (RR), and repeated reading plus vocabulary previewing (RR + VP). Oral reading
fluency, comprehension level, and comprehension rate (percentage of correct answers to
comprehension questions divided by time required to read the passage in seconds, and
then multiplying by 60). In the control condition, students were asked to read a passage
and were told they would be asked to answer 10 multiple-choice questions about the
passage. The RR condition followed typical RR procedures with error correction,
followed by teaching words that were misread. Students read the passage twice during
this condition. Finally, in the RR + VP condition, students were instructed on important
vocabulary words from the passage by reading through the words and definitions
independently and then reviewing with the instructor. Next, the same RR procedures
were followed as in the RR condition. Overall, both experimental conditions (RR alone
and RR + VP) increased performance in oral reading fluency, with effect sizes ranging
from .96 to 7.17. This study extended research on reading fluency at the high school
level: it was possible to improve oral reading fluency rates for secondary students.
However, there was less convincing evidence for the impact of the experimental
conditions on comprehension level and rate. Results were inconsistent across students
and conditions, but there was evidence of a small increase in trends on level and rate

20
performance indices. The purpose of adding the vocabulary previewing component was
to investigate whether there would be an impact on reading comprehension, if combined
with a fluency component. The mixed results were consistent with previous research.
Authors suggested that further research on a combined fluency plus comprehension
intervention must be conducted (Hawkins et al., 2011).
Vocabulary. Vocabulary is defined as a component of overall reading skill, but
its relationship with comprehension is so strong that it is sometimes difficult to parse
apart the two skills (NRP, 2000). A rich vocabulary is most likely the direct result of
early language exposure including being read to and hearing conceptual conversation
(Hart & Risley, 1995; Juel, 1988). Receptive and productive vocabularies are frequently
measured and implicate comprehension skills (Alonzo et al., 2009; NRP, 2000; Snow et
al., 1998; Taylor & Ysseldyke, 2007). Receptive vocabulary is the ability to understand a
larger pool of words than what is used in speech. Productive vocabulary consists of those
words an individual uses in speech. Receptive vocabulary is usually much larger than
productive vocabulary (NRP, 2000), but it can be transferred to productive vocabulary if
vocabulary is explicitly taught (Taylor & Ysseldyke, 2007), leading to deeper and more
accurate comprehension. Thus, vocabulary contributes to comprehension at least at the
word level. The skilled reader would extend their understanding of semantics to form
relationships between the concepts presented in the text. Explicit vocabulary instruction
for adolescents can potentially influence comprehension skills, although it may not result
in improved performance on standardized comprehension measures (IES, 2008).

21
Vocabulary at the secondary level. Harmon, Hedrick, and Wood (2005)
suggested a few instructional strategies for struggling readers to increase vocabulary.
First, students must engage in independent reading. Teachers might also incorporate trade
books that are relevant to the content and teach new vocabulary within a particular
context. Students should also be given the opportunity to select new vocabulary words to
learn. Finally, direct and explicit instruction in vocabulary should include structural
analysis, which refers to learning root words as a strategy for learning new vocabulary
(Harmon et al., 2005).
Few vocabulary studies that included a sample from the secondary level have
been published recently. Mastropieri, Scruggs, and Fulk (1990) did examine vocabulary
acquisition and its relation to comprehension in one intervention study. Twenty-five high
school students were included in the study; all were previously diagnosed with a learning
disability. Both concrete and abstract words were included in the study. There were two
experimental conditions; half of the sample participated in the keyword condition and the
other half participated in the rehearsal condition. In the keyword condition, 18 words
were presented on an index card that showed the vocabulary word, keyword, definition,
and an illustration that showed the relationship between the vocabulary word and the
keyword. Students viewed each index card for 30 seconds after the investigator described
the contents of the card. Next, students were tested on the definition and the illustration.
The materials for the rehearsal condition only differed in what was presented on the
cards: there was no keyword or illustration. Again, students were given 30 seconds to
look at each word. The investigator provided the definition and the student was to

22
provide the correct word; error correction was provided. Students engaged in a recall test
in which they were instructed to provide a definition for each word. After both
conditions, students were administered a matching ‘comprehension test’ where they were
asked to match the correct word with the appropriate sentence. Students in the keyword
condition recalled more abstract and concrete words than students in the rehearsal
condition (M=10.67, SD=2.9 in the keyword condition; M=3.54, SD=2.2 in the rehearsal
condition). Not only were students in the keyword condition able to recall definitions
better than in the latter condition, but they were better able to apply the definition to
novel situations (sentences presented in the comprehension test). This study demonstrated
the benefits of using a mnemonic strategy for students who struggled with reading.
Furthermore, it provided evidence of its utility for secondary students and its application
to learning abstract words. While this study showed promise, the publication is more than
two decades old, demonstrating yet again the lack of research dedicated to secondary
students with limited reading success.
Vocabulary deficit. A limited lexicon is likely to impact comprehension of text,
especially textbooks used for content area courses. If a student comes across an unknown
word, he or she must use context clues to identify its meaning. A reader must acquire and
build new knowledge, but with inadequate resources (Baker, Simmons, & Kamee’nui,
1998; Harmon et al., 2005). To understand most textbooks at the secondary level, both a
word knowledge base and background knowledge base are required (Harmon et al.,
2005). This means that students must build new concepts but with unfamiliar vocabulary
words (Harmon et al., 2005), which is probably difficult for even a high achieving reader.

23
In a research synthesis, Baker et al. (1998) identified one difference in vocabulary
knowledge between students who were successful readers and those who were less
successful as the size of a student’s vocabulary and how much growth in vocabulary he
or she can achieve. Both of these themes converge on early language exposure and the
work of Hart and Risley (1995). Baker et al. (1998) also examined individual differences
in vocabulary, which can be divided into three groups: lack of knowledge of language
rules and structure, memory deficits, and limited strategies for learning new words. In
another synthesis, Jitendra, Edwards, Sacks, and Jacobson (2004) stated that vocabulary
development was impeded by the amount of independent reading in which students
engage, the strategies (or lack thereof) that students use to learn new words within a text,
and a vague or imprecise word knowledge base. Each of these can guide instruction and
intervention development. Overall, mnemonic and key word strategies, cognitive strategy
instruction for word learning, and direct instruction for vocabulary, improved vocabulary
performance with large effect sizes, even for high school students (Jitendra et al., 2004).
Research supported explicit vocabulary instruction in the classroom for typically
developing and struggling readers alike. However, despite a large research and literature
base on vocabulary and its relation to reading achievement, vocabulary instruction is not
conducted in ways that truly support struggling readers (Jitendra et al., 2004).
Comprehension. Comprehension is defined as an integration of basic subskills of
reading (Dole, Duffy, Roehler, & Pearson, 1991; NRP, 2000). Comprehension is a
higher-order skill in which the reader must understand concepts and ideas in the text
(Rapp et al., 2007). The process itself is complex and represents active engagement

24
between the reader and the text (Taylor & Ysseldyke, 2007). Comprehension was
traditionally viewed as a passive activity in which information was imbued upon the
reader. In contrast, more contemporary views of comprehension reflect active
engagement with the text, relying on active inference and evaluation to create meaning
from the text (Dole et al., 1991; NRP, 2000). Readers use specific knowledge about a
topic, general world knowledge about a topic, and knowledge about text organization and
structure to create this meaning (Dole et al., 1991). Using background knowledge enables
the reader to make inferences about the text while also enabling them to expand their own
knowledge on the topic (Taylor & Ysseldyke, 2007; Rapp et al., 2007; Snow et al., 1998).
The reader who can integrate details from the text with background knowledge has the
most reading success (Pressley, 1998). Calling upon existing information and extracting
information requires the reader to use explicit interactive strategies, such as asking
questions about the text and finding answers to those questions to build knowledge
(Taylor & Ysseldyke, 2007). This represents an intended reading goal of producing
summaries (creating meaning) and predicting what will happen next in the text (Rapp et
al., 2007). Though comprehension builds upon more basic skills, it is necessary to
instruct upon higher order reading comprehension, even if some of the basic subskills
have not been previously mastered (Hoover & Gough, 1990; Rapp et al., 2007). The
successful reader learns from the text once it is comprehended (Wexler et al., 2008) and
the student “reads to learn” (Chall, 1983).
Comprehension at the secondary level. Comprehension is the key to success at
the secondary level (Edmonds et al., 2009). Students take classes in which they are

25
learning new content daily and where they are required to acquire and integrate new
information in order to be successful on classroom assessments. Teachers at the
secondary level are often not prepared to explicitly instruct comprehension (Blanton et
al., 2007; Denti & Guerin, 2004; Edmonds et al., 2009; IES, 2008; Moats, 2004; National
Institute on Literacy [NIL], 2007; Pressley, 2004) and often believe it is not their role to
engage in reading instruction (IES, 2008). Secondary teachers have too much content to
cover and too little training in explicit reading instruction (Edmonds et al., 2009).
Background knowledge at the secondary level might portray an even greater gap
between successful and unsuccessful readers (Stanovich, 1986). It is likely that
unsuccessful secondary level readers have consistently avoided texts, in turn widening
the gap in background knowledge. Since high school classes are so content heavy,
students are expected to constantly learn new information (Deschler et al., 2001). If
students are not able to consume the texts, they are not consuming the information,
increasing their deficit in vocabulary and background knowledge.
Comprehension deficit. Successful comprehension requires that the reader
purposefully and appropriately chooses and implements the best comprehension strategy,
given the particular text and the particular purpose for reading (Nokes & Dole, 2004;
Rapp et al., 2007). “Metacognition is the consideration, monitoring, and control of one’s
cognitive activities” (Nokes & Dole, 2004). This includes knowing oneself as a reader,
the task, and the strategies that can be employed to address that task (Nokes & Dole,
2004). Therefore, a skilled reader self-monitors his or her reading to adapt and direct
cognitive resources (Nichols, Young, Rickelman, 2007; Rapp et al., 2007), as well as

26
reads with a certain goal in mind (Pressley & Wharton-McDonald, 1997). A good reader
is aware of these metacognitive strategies enough to change the approach in order to
extract the most information from the text (Nichols et al., 2007), whereas a struggling
reader will not adjust his or her reading strategy when they do not comprehend the text
(Nokes & Dole, 2004). Explicit strategy instruction positively impacts metacognition and
comprehension skills for students with learning disabilities (Boyle, Rosenberg, Connelly,
Washburn, Brinckerhoff, & Banerjee, 2003; Nokes & Dole, 2004).
Self-monitoring skills, one metacognitive strategy, are also pertinent to
comprehension ability (Dole et al., 1991; Snow et al., 1998). An engaged reader is one
who reads a text with purpose and self-adjusts or self-monitors their approach to best
extract information from the given text. Often, readers who struggle do not self-monitor
and are not aware that they are missing information (Rapp et al., 2007). A skilled reader
intentionally chooses a strategy based on the text and knows when to adapt the strategy
(e.g., when information is not adequately extracted; Dole et al., 1991; Snow et al., 1998).
In general, proficient readers attend to specific pieces of the text as needed to
accommodate the information in the text (Rapp et al., 2007). This would indicate that a
proficient reader also passes over the unimportant information in order to give more
attention to the more important information. Failure to employ self-monitoring skills
expectedly leads to limited reading proficiency (Snow et al., 1998).
Training middle school students in self-monitoring skills led to better
performance in text comprehension (Jitendra, Hopps, & Xin, 2000). In a study of 33
middle school students, investigators taught students to use a self-monitoring card during

27
an explicit strategy instruction intervention package. The purpose of adding the self-
monitoring element to this main idea and summarization intervention was to promote
generalization of learned strategies. Many students with learning disabilities may learn a
skill or strategy within a particular context, but are unable to apply that skill to novel
situations (Edmonds et al., 2009; Jitendra et al., 2000). The self-monitoring component
was an attempt to transfer the learned strategy to new learning situations. Students in the
experimental group received 40 minutes of main idea and self-monitoring explicit
instruction from the investigators (Jitendra et al., 2000). Students in the control group
received reading instruction as normally scheduled. The experimental group outscored
the control group in identifying the main idea of the text (ES = 1.28 and 2.71, for answer
selection and generation, respectively). Jitendra et al. (2000) also observed that students
continued to use the self-monitoring card on their own, six weeks after the study was
completed, which demonstrated maintenance of the comprehension strategies. This study
demonstrated the utility and feasibility of teaching self-monitoring skills, as well as its
importance in comprehending text content. While there are a fair number of research
studies on comprehension strategy training, very few exist at the secondary level.
Without research that explicitly addresses this practical concern, educators are left to
randomly implement strategies in an attempt to address comprehension deficits for
secondary students.
Reading Instruction
Reading instruction at the secondary level is either deemphasized or does not
occur (Blanton et al., 2007). This might be due to limited knowledge of the reading

28
development and the reading process at this level (Chall, 1983; Hasselbring & Goin,
2004). In contrast, there is extensive literature on early reading and elementary reading
(Chall, 1983; see Snow et al., 1998). Young readers require explicit instruction and rely
on their teachers (Chall, 1983) because reading is not a natural occurrence (Foorman,
Francis, Fletcher, Schatschneider, & Mehta, 1998). However, by the time students reach
high school, they are expected to have mastered the basic subskills of reading in order to
extrapolate information from texts. However, Underwood and Pearson (2004) suggested
that struggling readers at the secondary level should receive as much instructional support
as elementary students receive when they first learn to read.
Secondary teachers rely on the content to guide instruction because it is assumed
that students have achieved a sufficient level of reading proficiency to comprehend
(Edmonds et al., 2009). Teachers are also short on time and resources to provide explicit
instruction in reading, even if it is warranted for many students in their classroom.
Moreover, secondary teachers often are not trained to provide explicit reading instruction
(Blanton et al., 2007; Denti & Guerin, 2004; IES, 2008; Moats, 2004) and many feel that
they are not equipped to teach the struggling reader (Denti, 2004).
The “fourth grade slump”. Chall (1983) coined the “fourth grade slump” to
denote the shift in literacy instruction after third grade. Students are explicitly taught to
read in Kindergarten through grade three (Chall, 1983; Hasselbring & Goin, 2004).
However, fourth grade marks the curriculum change of “reading to learn.” Unfortunately,
this does not mirror the developmental trajectory for many students. While successful
readers make the transition of “reading to learn” from expository texts, other students
29
may not. The purpose of “reading to learn” is to extract meaning and form an
understanding of the text. The introduction of expository texts compounds this difficulty,
even for students who read at grade level (Blanton et al., 2007). Though they have had
the same explicit instruction through third grade, some students may still require
continued explicit instruction. However, these students often do not receive such explicit
instruction because teachers must focus on content learning. Not only does the “fourth
grade slump” denote the shift in instruction, it also denotes the beginning of academic
failure for many students, which often persists through high school. It is at this point that
the gap widens between successful and unsuccessful readers (Blanton et al., 2007;
Stanovich, 1986): 74% of students in grade three who struggled with reading also
struggled with reading in grade nine (Foorman et al., 1998).
Narrative versus expository texts. The “fourth grade slump” is further
exacerbated by the shift from narrative to expository texts. Expository texts are used in
the classroom as a means of information dissemination, whether it is a textbook or
newspaper (Fang, 2008; Saenz & Fuchs, 2002). Fang (2008) described the main
difference between narrative and expository texts as based on the language: narrative
texts use language that students use everyday whereas expository texts use specialized
language. This difference creates the difference between the text types and also creates
the difficulty that students have with expository texts (Fang, 2008).
Other authors contended that factors other than topic are relevant to secondary
students who struggle with expository texts (NIL, 2007; Saenz & Fuchs, 2002). Saenz
and Fuchs (2002) conducted a study of 111 high school students who were all previously

30
identified with a learning disability. The purpose of the study was to identify strengths
and weaknesses in reading performances on both narrative and expository texts. Students
read two passages, one narrative and one expository during pre- and post-testing. Words
read correct per minute (WRC/min) was calculated. Next, students were asked to answer
10 comprehension questions. Overall, students performed better on both measures of
narrative text passages than on expository text passages. Saenz and Fuchs (2002) owed
this to the following differences between the two text types: text structure, familiarity
with presented concepts, vocabulary, and background knowledge (Saenz & Fuchs, 2002).
Text structure simply referred to the organization of the text that facilitates connections
made by the reader. Readers must be able to recognize frequently utilized patterns of
expository text. This includes semantically and syntactically recognizable cues or
patterns, such as phrases like ‘however’ or ‘although’. Expository texts vary their use of
these patterns from one to the next, though, making it more difficult for a reader to
become familiar with the text structure. Another pitfall is the content: ideas in an
expository text are simply more difficult. Given the nature and purpose of expository
texts, this cannot be avoided at the secondary level. Similarly, a reader’s receptive
vocabulary also contributes to text comprehension. Again, vocabulary in expository texts
is elevated, making comprehension a challenging task. Usually, the use of technical
vocabulary cannot be avoided when describing a particular topic. The final contributing
factor, as proposed by Saenz and Fuchs (2002), was background knowledge, which varies
by individual. Educators cannot control for the amount of background knowledge a
student has access to, particularly once the student is in high school. Background

31
knowledge helps the reader predict what will happen next, given context clues and
conceptual ideas. In turn, comprehension is extended, particularly if the readers’
prediction is confirmed. Another possibility is that a student may have adequate
background knowledge, but does not appropriately use strategies to best extract
information from the text. For this student, making gains in comprehension may be easier
if he learns and uses strategies effectively.
Each of these factors contributed to poorer fluency and poorer text comprehension
for expository texts, providing further evidence that struggling secondary readers require
explicit instruction to be successful in comprehension (Saenz & Fuchs, 2002). Though
authors found significant differences between student performance on the two texts, the
methodology for the questions correct measure was taxing on working memory as
students were not able to look back over the passage while answering questions. This
may have impacted students’ performance in a way that was not directly related to
comprehension skill. Furthermore, this was a descriptive study, rather than an
intervention study. Future research should extend this study methodology to an
intervention study with a treatment and control group. Overall, Saenz and Fuchs (2002)
suggested that students who struggled with reading, regardless of age, were not
knowledgeable about expository or narrative text structure; for proficient readers,
knowledge of text structure is another helpful strategy (Rapp et al., 2007). Thus, another
tribulation for struggling readers is identified.

32
Struggling High School Readers
The prevalence of struggling readers in general education at the secondary level is
astounding. One study reported that 69% of eighth grade students were below proficiency
in comprehending grade level text (IES, 2008). Below proficiency indicated that students
have not mastered or demonstrated competency over the tested material. In the case of
comprehension, students who fall below proficiency are not able to acquire information
from the text, nor are they able to evaluate, analyze, or apply the information from a
given text. This persists into adulthood with 23% of adults reading at the basic level of
reading proficiency (Rapp et al., 2007). Moreover, only about 3% of students acquire
inferential and evaluative comprehension skills (Alvermann, 2002). Students should be
able to comprehend, analyze, and apply information (Blanton et al., 2007). “Basic” level
skills are not sufficient for a student to meet success once they leave high school. In
postsecondary settings, including the work environment, individuals are required to use
the inferential and evaluative skills that many students lack (Alvermann, 2002).
A student who struggles with reading at that level will probably have difficulty
with most other high school content areas because they are so dependent on text
comprehension (Denti & Guerin, 2004; Deschler et al., 2001). Reading difficulties for
students at this age level are typically pervasive and comprehensive; they increase with
time and as new skills are required (Moats, 2004). In addition, high school texts are
written on the tenth through twelfth grade level, with some even at the college level
(Denti, 2004). A struggling reader will simply not be able to extract information from
33
such texts and will often choose not to read because it is a labor-intensive task (Denti,
2004).
Some argued that individual skills instruction for students at the secondary level is
necessary, but possibly not sufficient (Alvermann, 2002). Denti and Guerin (2004)
suggested that strides in literacy improvement can be made with direct instruction and
comprehension strategies. Unfortunately, given that these students have limited access to
direct instruction, it is no surprise that frustration for these students has mounted since
elementary school (Denti & Guerin, 2004; Deschler et al., 2001; Guthrie, 2008; O’Brien,
Beach, & Scharber, 2007); this has great implications for school failure.
History of Reading Interventions. Staggering statistics and statewide
assessment failures have contributed to a long history of intervening for students who
struggle with reading. The majority of intervention research is conducted at the
elementary level, with many fewer experimental studies at the middle or high school
levels (Edmonds et al., 2009; Vaughn et al., 2008). Interventions for elementary students
with reading difficulties often focus on the subskills of reading, but their impact on
comprehension, the highest order skill, varies (Rapp et al., 2007). In addition, more
effective interventions exist for middle school students than for high school students
(Vaughn et al., 2010), yet content continues to increase in difficulty level, further
compounding reading difficulties for secondary students (Edmonds, et al., 2009).
Fluency is frequently assessed at the elementary level and this data are used as an
overall indicator of reading success, however, there is little evidence for how to improve
this subskill for secondary students, even when considered in isolation from other

34
subskills (Pressley, 2004). Additionally, in a meta-analysis on fluency at the secondary
level, results did not demonstrate overwhelming improvements for reading
comprehension (Wexler et al., 2008). Though improvements were made for the rate
component of fluency, fewer improvements were demonstrated for word identification
and comprehension. In general, Wexler et al. (2008) found that fluency interventions
conducted at the secondary level had limited impacts on overall comprehension skill. The
most prominent finding of the meta-analysis was that some form of repeated readings,
reading previews, or simply greater exposure to texts as a fluency intervention increased
students’ reading rate, but again, this did not transfer to comprehension skills (Wexler et
al., 2008).
Edmonds et al. (2009) explored the efficacy of subskill interventions to improve
comprehension. Included in the synthesis were all studies with participants identified as
struggling readers, not just those identified with a learning disability. Overall, Edmonds
et al. (2009) found that comprehension can be improved if a student is exposed to a
targeted comprehension intervention or a multicomponent intervention (targeting
multiple subskills of reading). There was some evidence to suggest that word reading
strategies interventions provided some improvement for struggling readers. The average
effect size for studies targeting word reading strategies (decoding) included in the meta-
analysis was 0.34. In contrast, targeted fluency interventions did not show great effects
for improving comprehension, which was surprising considering the strength of
relationship that is usually found between comprehension and fluency. The most robust
results indicated that explicit comprehension strategy instruction best supported students

35
who struggled with comprehension at the secondary level (e.g., ES = 2.23). Edmonds et
al. (2009) then turned their attention to generalization of skills learned through these
interventions. In general, even if students successfully applied a particular skill that
would enhance comprehension during the intervention (reflected by substantial effect
sizes), there was minimal transfer to general comprehension. In other words, the learned
skills were not generalized to everyday tasks that required comprehension (Edmonds et
al., 2009).
Despite significant resources invested, many interventions at the secondary level
simply did not deliver the expected results (Rapp et al., 2007), even when gaps in the
secondary intervention research were targeted (Vaughn et al., 2010). For instance, in a
year long, three phase intervention program for sixth grade students, very limited effects
were found (Vaughn et al., 2010). Only small gains were made and gains were only
found for particular subgroups of students. Vaughn et al. (2010) sought to determine
whether researcher-provided interventions administered to students in groups of 10 to 15
would positively impact reading performance. In Phase I, fluency, ‘word study,’
vocabulary, and comprehension were targeted. Students engaged in repeated readings
with peers and received explicit instruction for decoding multisyllabic words. Vocabulary
lessons were also incorporated by providing definitions of the same multisyllabic words.
For the comprehension component, students responded to literal and inferential questions.
Phase II emphasized vocabulary and comprehension, while students were still asked to
apply fluency and word study skills learned during Phase I. Phase III was quite similar to
Phase II, except most materials were researcher-developed and there was a greater

36
emphasis on independent reading by using previously learned fluency and comprehension
strategies.
This intervention study was fairly costly, considering that it was implemented in
seven schools, required nine interventionists, and spanned an entire school year. These
factors made the results even more disappointing and left educators wondering how to
help students beyond elementary school. Once again, intervening for students at this level
was discouraging. Edmonds et al. (2009) provided a few hypotheses for the lack of
effects: (a) the needs for secondary students are different from younger students; (b)
secondary students read expository texts rather than narrative, which were primarily used
in the literature; and (c) intensity of interventions needs to be examined as secondary
students might require more intensive interventions to increase comprehension skills.
Meta-analyses and intervention studies provided little encouragement or support
for intervening at the secondary level. Even when effects were demonstrated, there was
little generalization. Moving away from interventions requires an examination of
assessment. If students are not showing an improvement in comprehension skills, perhaps
they are being exposed to the wrong intervention(s). With this evidence, it can be argued
that interventions are not accurately targeted for each student (Alvermann & Rush, 2004).
Assuming that struggling readers at the secondary level all require the same type of
instruction has not led to desired outcomes. Instead, a deeper assessment of students
might provide better insight for specific instructional needs (Buly & Valencia, 2002;
2003; 2005; Rapp et al., 2007).

37
What is the root of the problem? Educators know that comprehension is the
ultimate goal of reading (NRP, 2000). It is the purpose of reading and it is the manner in
which new information is often acquired. Without comprehension, there would be no
learning. High stakes testing has simply highlighted the difficulties that U.S. students
have, but the problems have been present for years. For example, NAEP (2008) examined
reading performance from 1971 to 2004 for students ages 9, 13, and 17. Performance for
9-year-old students improved between 1971 and 2004, but no improvement was found for
13 or 17 year old students. Furthermore, scores at the 75th
and 90th
percentiles did not
change significantly for 17 year olds (NAEP, 2008; Edmonds et al., 2009), indicating that
secondary students were not prepared to achieve reading success (Edmonds et al., 2009).
The literature base emphasized teacher training to better and explicitly instruct
comprehension. Other researchers were more interested in the actual cause of
comprehension difficulty. Some argued that basic skills such as phonological awareness
and word identification skills were to blame. This would indicate that instruction in these
specific bottom-up skills would aid in improving comprehension (Lovett et al., 2008), but
targeted interventions in this area have not always improved comprehension (Cutting &
Scarborough, 2006). In contrast, interventions that targeted comprehension strategies and
metacognitive learning have helped (Pressley & Wharton-McDonald, 1997). Still, there
was limited research in identifying patterns of reading strengths and weaknesses for
secondary students. Given this type of information, there is opportunity to inform
instruction as well as provide more individualized instruction.

38
The problem analysis step of the problem solving approach is relevant in helping
to determine the cause of minimal success in comprehension. Essentially, once a problem
is identified, the next step is to determine why the problem is occurring. Here, the focus
is on alterable variables in the student’s environment rather than on within-child
characteristics (Burns & Gibbons, 2008; Christ, 2008; Daly, Witt, Martens, & Dool,
1997). Daly et al. (1997) referred to this as the functional explanation of academic
failure; this allows for manipulation of the instructional environment, including the
instructional sequence and opportunities to respond. The purpose of problem analysis is
to assess and evaluate how environmental factors (the causal and maintaining variables)
may affect student performance to then inform instruction and intervention development
(Christ, 2008). Once ‘salient characteristics’ of the problem are identified, problem
solutions may be identified via hypothesis testing. Christ (2008) referred to a ‘systematic
hypothesis testing framework’ in which scientific theory guides the selection of analytic
hypotheses as well as the process of testing each analytic hypothesis. Analytic hypothesis
testing is a unique approach specific to the particular problem (Christ, 2008). In the
context of the current study where limited research has been conducted, it is necessary to
follow this approach. Educators and researchers cannot rely on the standard protocol of
assessment for reading deficits because that follows research at the elementary level
(Edmonds et al., 2009). The issues students face at the secondary level are much different
and unique to the high school context.
Daly et al. (1997) provided five reasons (hypotheses) for poor performance in
school: the student does not want to do the task; the student has not spent enough time

39
learning the task; the student has not had enough help with the task; the student has not
done it in that particular way; and the task is too difficult for the student. Each of the five
reasons, or hypotheses, is an alterable variable that can be used to manipulate the
student’s instructional environment. Therefore, educators can test each hypothesis
individually to analyze why the problem in a specific academic skills area is occurring
(Christ, 2008; Daly et al., 1997). Daly et al. (1997) suggested testing the easiest
hypothesis first (reason one) until the reason for the problem is identified in the interest
of time and resource efficiency. Furthermore, these five reasons can be pared down to the
“can’t do-won’t do” phenomenon, or the ‘skills versus performance deficit’ (Christ,
2008). It must be determined which category the student falls into in order to develop an
intervention. The ‘won’t do’ category introduces the issues of student motivation
discussed earlier (Daly et al., 1997).
Based on this discussion of problem analysis, the current study falls within the
domain of this step of the problem solving approach. Many secondary students are not
achieving the expected levels of performance on statewide assessments that primarily
measure comprehension skills. This observed problem must be evaluated to determine
what causal and maintaining variables are in place. The hypothesis generation and testing
that occurs within problem analysis is pertinent to examining high school students’
reading strengths and weaknesses. These students are not all encountering the same
difficulty: there is no one solution that fits each of them (Buly & Valencia, 2002; Burns
& Gibbons, 2008; Deno, 2005).

40
Identifying Reading Strengths and Weaknesses. Buly and Valencia (2002;
2003; 2005) conducted a study in which they identified 108 fourth grade students who
performed below proficiency on a statewide assessment (Washington Assessment of
Student Learning [WASL]). Although these students were identified as performing below
expected standards for reading, results from the assessment provided no information on
the students’ area(s) of weakness. High stakes assessments are in part intended to inform
policy and curriculum alignment. However, if results can only really claim that there is a
lack of proficiency in reading, the data are not specific beyond acknowledgement of skill
deficit, and therefore is not sufficient to suggest a particular policy or curricular
development (Alvermann & Rush, 2004; Buly & Valencia 2002; 2003; 2005). Thus, Buly
and Valencia (2002; 2003; 2005) set out to determine these students’ area(s) of weakness,
based on a profile identified via cross-battery assessment.
Ten clusters, or profiles, were identified from the data. These profiles included
automatic word callers (18%), struggling word callers (15%), word stumblers (18%),
slow and steady comprehenders (24%), slow word callers (17%), and disabled readers
(10%). That so many profiles were discovered indicated that policy makers cannot use
general assessment results to identify one program that should be employed all students.
Unfortunately, this is usually how policy and curricular decisions are made (Buly &
Valencia, 2002; 2003; 2005).
A factor analysis was first conducted to identify the underlying variables for
performance on the WASL (Buly & Valencia, 2002; 2003; 2005). The three factors were
word identification, fluency, and comprehension. Interestingly, Snow et al. (1999)

41
identified these factors as necessary to be considered a skilled reader. Identifying these
factors revealed that on average, students in this sample performed below grade level in
word identification, but skills were far weaker on fluency and comprehension (Buly &
Valencia, 2002; 2003; 2005). However, this was a profile of the averages. Buly and
Valencia (2002; 2003; 2005) questioned whether the profile for the averages would fit the
majority of students or whether different profiles would emerge.
Eighteen percent of students in the sample made up clusters 1 and 2, the
automatic word callers. These students were strong in word identification, but weak in
comprehension. About 60% of automatic word callers were learning English as a second
language. Students might have adequate word identification, fluency and vocabulary
skills, but lacked the ability to integrate meaning. Or students might lack adequate skills
in word identification, which made comprehension a challenge (Buly & Valencia, 2002;
2003; 2005).
Cluster 3 students were struggling word callers and made up about 15% of
students in the sample. These students were stronger in fluency and word identification
skills than in comprehension skills, but still encountered difficulties with word
identification. This latter characteristic distinguished the group from clusters 1 and 2.
These students also lacked adequate vocabularies, which complicated their decoding
skills (Buly & Valencia, 2002; 2003; 2005).
Word stumblers made up cluster 4 and about 18% of the sample. Though these
students might be able to comprehend material, they still struggled with word
identification. Some might have acquired some comprehension skills, such as relying on

42
context, but reading was laborious. These students were often slow readers, mostly due to
lack of automatic word identification skills. Difficulty with word identification was
evident at the most basic skill level, including sound-symbol correspondence as well as
difficulty with sight words (Buly & Valencia, 2002; 2003; 2005).
Slow and steady comprehenders in clusters 5 and 6 comprised the largest
subgroup of struggling readers at 24%. As indicated by their name, these students
comprehended texts, but they read quite slowly. More specifically, these students had a
relative strength at identifying real words, as compared to non-words. However, they
lacked automatic word identification skills (Buly & Valencia, 2002; 2003; 2005).
Clusters 7 and 8 were slow word callers (17%). These students slowly identified
words, impacting their fluency. They also demonstrated lower comprehension skills and
smaller receptive vocabulary lexicons. The strength for this group of students was
decoding (Buly & Valencia, 2002; 2003; 2005).
The last clusters, 9 and 10, were made up of disabled readers. This was the
smallest subgroup of the sample at 9%. Students in these clusters struggled on all three
factors. Their performance on the statewide assessment placed them at the lowest level of
reading and indicated a lack of basic reading skills (Buly & Valencia, 2002; 2003; 2005).
The authors sought to determine specific subskill deficits and demonstrated that
an aggregated profile of struggling readers does not fit the majority of students. They
identified 10 clusters that each described specific strengths and weaknesses. If policy
decisions are made based on the profile of the average, many students will miss relevant
instruction even if they receive supplemental services. The study clearly indicated a need

43
for more individualized analysis of reading patterns for students who struggle with
comprehension.
Similarly, Lesaux and Kieffer (2010) sought to determine whether skills profiles
would emerge for young adolescent (sixth grade) students in an urban setting. Their
measures tapped into the following domains: general and academic vocabulary, working
memory, oral reading fluency, and word and nonsense reading accuracy. They identified
three profiles using latent class analysis, which fits a hypothesized model with a specified
number of groups; this analysis enables researchers to examine goodness of fit criteria for
the identified groups. Slow Word Callers (60.3%), Globally Impaired Readers (21.4%),
and Automatic Word Callers (18.3%) emerged from the analysis. The Slow Word Callers
demonstrated strengths in nonsense word reading accuracy skills, a significant weakness
in vocabulary, and low average fluency skills. The Globally Impaired Readers performed
below average on all measures across subskills. Students classified as Automatic Word
Callers also demonstrated a strength in nonsense word reading accuracy and a weakness
in vocabulary, but their fluency skills fell within the average range. This study shared a
similar finding with Buly and Valencia (2002): most students struggled with higher level
skills (vocabulary and/or comprehension) rather than word level decoding (Lesaux and
Kieffer, 2010).
More recently, skills profiles at the high school level were identified (Brasseur-
Hock et al., 2011), based on a descriptive study in which the component skills of
struggling adolescent readers versus proficient adolescent readers were identified (Hock
et al., 2009). Hock et al. (2009) assessed word level accuracy, fluency, vocabulary and

44
comprehension. Overall, the fluency score was the lowest for struggling readers, while
word decoding was the highest score. When compared to the proficient readers, the
struggling readers performed 20 to 25 points lower across subskills. In the profile
analysis that followed, word level accuracy, fluency, and vocabulary were used to
compare the mean performances across the domains between struggling and proficient
readers. For the struggling readers, results yielded a significant difference between
fluency and word level accuracy, word level accuracy and vocabulary, and vocabulary
and fluency. For the proficient readers, there were significant differences between word
level accuracy and fluency, and vocabulary and fluency, but not between word level
accuracy and vocabulary for this group. Hock et al. (2009) also examined the subskills by
demographic groups, including students registered for free/reduced lunch, English
Language Learners, and students with disabilities. Differences were found for some of
these groups; for instance, students receiving free/reduced lunch scored nine to 13 points
lower across components. Students with disabilities (LD) also scored lower across
components, with the lowest performance on the word level accuracy measures. This
study provided the rationale for identifying component skills groups in later research.
Brausseur-Hock et al. (2011) identified the need to investigate reading skills
profiles for this age level due to the lack of effective interventions in the literature base
and the deficient levels of reading at which adolescents perform. Brausseur-Hock et al.
(2011) administered nine instruments to measure reading comprehension, word reading
accuracy, reading fluency, and vocabulary and language comprehension. Their sample
was composed of 345 ninth grade students (at the beginning of the academic year) from

45
an urban setting; the first step was to determine which students were proficient readers,
and which students demonstrated struggles in the area of reading by administering the
Kansas Reading Assessment. They used latent class analysis to identify profiles among
the students who were classified as struggling readers: Readers with Severe Global
Weaknesses (14%), Readers with Moderate Global Weaknesses (36%), Dysfluent
Readers (29%), Weak Language Comprehenders (11%), and Weak Reading
Comprehenders (9%).
Readers with Severe Global Weaknesses performed at least one standard
deviation below the national mean across all measures, with the greatest difficulty on
measures of word reading accuracy. Readers with Moderate Global Weaknesses also
demonstrated weaknesses across all measures, but achieved at a higher level than the first
group. These readers only performed one standard deviation below the national mean.
They also performed as low as students in the Readers with Severe Global Weaknesses
group on vocabulary and language comprehension measures. Dysfluent Readers
demonstrated the greatest weaknesses in fluency, and a relative strength in language
comprehension and word reading accuracy (in the average range). Weak Language
Comprehenders scored within the average range across all measures, except for subtests
of language comprehension, on which they scored significantly below the national mean.
Finally, Weak Reading Comprehenders performed within the average or above average
range on all measures, except on the reading comprehension measure (Kansas Reading
Assessment). Interestingly, these readers also demonstrated a strength in reading rate;
however, the authors hypothesized that these students read quickly without engaging in

46
deep levels of comprehension processing or strategy use. This study reflected the need to
assess adolescent students who struggle with reading in order to gain a better
understanding of their strengths and weaknesses. The sample, however, was not
generalizable because it consisted of students from one Midwestern state (Brausseur-
Hock et al., 2011). It did provide further context for the importance of investigating
profiles of reading strengths and weaknesses in other settings.
Motivation in the Context of Struggling Secondary Readers: Achievement Goal
Theory
Student motivation is relevant and meaningful in the context of a study assessing
students’ skills in reading. Students who have experienced limited success in school have
lower feelings of competency and autonomy as they progress through the grade levels
(Covington & Dray, 2001). As such, they may not value the task of learning itself (Ames
& Archer, 1988; Meece, Anderman, & Anderman, 2006; Meece, Blumenfield, & Hoyle,
1988). Achievement goal orientation theory is a prominent theory of motivation within
the school context that focuses on the types of goals students employ within achievement
contexts (Meece et al., 2006). For students who have struggled with reading throughout
their school career, their chosen goal orientations may be a result of feelings of low self-
efficacy (Meece et al., 2006). This theoretical framework provides an explanation for
multiple goals of motivation within the school context, and is appropriate for the
examination of struggling readers.
Achievement goal orientation theory is broken into four types of orientation
goals: mastery-approach goals, mastery-avoidance goals, performance-approach goals,

47
and performance-avoidance goals. Endorsement of one goal orientation over the other is
highly associated with different task outcomes (Anderman, Austin, & Johnson, 2001). A
student with a mastery-approach orientation values learning and developing new skills,
whereas a student who relies primarily on mastery-avoidance goals will avoid
misunderstanding of a given task (Anderman, et al., 2001; Meece et al., 2006). The
primary purpose of endorsing performance-approach goals is to be judged positively
based on ability or competency, whereas students with performance-avoidance goals are
more concerned with avoiding negative judgments of ability or competency (Anderman
et al., 2001; Meece et al., 2006). Research showed that if a student approached an activity
or classroom context with mastery goals, the student was more likely to approach
challenging tasks and have positive feelings about the task (Ames & Archer, 1988;
Meece et al., 2006). Mastery goals were correlated with higher feelings of self-efficacy
and positive perceptions of ability and competency. In contrast, students who employed
performance goals were more likely to engage in surface level cognitive processing
(Meece et al., 2006). In a particular classroom context, a student with a mastery goal
orientation is likely to perceive making errors as a part of learning, whereas for the
student with a performance goal orientation, it is anxiety producing; a student with a
mastery goal orientation is satisfied by approaching challenging tasks, whereas the
student with a performance goal orientation is satisfied only by doing better than his or
her peers (Archer & Ames, 1988; Meece et al., 2006).
It is important to note that goal orientation varies not only based on individual,
but also based on the situational demands (Ames & Archer, 1988; Meece et al., 2006).
48
For instance, a student might have mastery goals in history class, but not in science class,
based on the goal orientation of the teaching style and classroom environment (Ames &
Archer, 1988; Meece et al., 2006). Indeed, students have their own self-perceptions of
mastery versus performance goals in each classroom context, and that perception affects
their selection of learning strategies (Ames & Archer, 1988; Meece et al., 2006). Both
mastery and performance goals can be manipulated, but they largely depend on the
standards to which a person judges their own ability or competence (Meece et al., 2006;
McInerney & Ali, 2006). As such, perhaps students who have struggled with reading will
have limited mastery or performance goals in classes that require high level reading.
Achievement goal theory is often applied to transitional periods of schooling
(Austin et al., 2001; Meece et al., 2006). In general, elementary level classrooms are
oriented toward mastery goals, whereas middle school classrooms and beyond usually
facilitate performance goal orientation. Beginning in middle school, students feel less
autonomy in class projects, students experience weak relationships with teachers (as
compared to the elementary level), and there is a greater emphasis on grades and
performance (Austin et al., 2001). This often precipitates the transition from highly
mastery oriented students to a greater concern with being judged based on ability (e.g.,
performance goal orientation). Students who have struggled with reading, however, have
not demonstrated high achievement in reading; therefore, the question of whether these
students might employ a more mastery goal orientation versus a performance goal
orientation arises. There has been limited research on achievement goal theory at the high

49
school level, but some data suggested that students do not report an increase in
performance orientation goals (more so than during middle school), as might be expected.
High school students’ reading strengths and weaknesses may be influenced by the
goal orientation to which they adhere, making achievement goal orientation theory
appropriate for examination within the context of this study. Moreover, if a student has
experienced frustration in connection with reading and school textbooks, they likely have
lower feelings of self-efficacy, competency, and autonomy (Ryan & Deci, 2009; Ryan &
Deci, 2000; Deci, Vallerand, Pelletier, & Ryan, 1991). This may exacerbate their low
reading skills, further limit their use of metacognitive strategies, and continue to limit
their background knowledge (Ivey & Guthrie, 2008). Despite the large literature base in
student motivation and motivation to read, minimal data on student motivation and
motivation for reading is collected in practice (Afflerbach, 2004). Educators must shift
their focus to achievement goal motivation in conjunction with assessment of academic
skills because the two are so inter-related (Afflerbach, 2004), especially at the high
school level.
Summary
Students face a larger workload than ever before. There is more content to learn
and more connections to be made between texts and the real world. High achievement in
a high school classroom relies on, and assumes, adequate reading skills. The assumption
that all students enter high school with quick and accurate reading, in addition to access
to a myriad of comprehension strategies, places many students at a disadvantage. The
students who are struggling to identify sight words and unfamiliar words; that are

50
inaccurate and slow when reading; and who do not carry the background knowledge or
employ self-monitoring skills, are falling behind. More than likely, they have fallen
behind their peers for many years of school (Foorman et al., 1998). These students may
not respond to a general remedial reading course. Instead, each subskill of reading must
be assessed in order to determine the best course of instruction. This is a best practice
implemented at the elementary level, but is forgotten by the time students enter high
school. The likelihood that difficulties have persisted across grade levels is evident in the
research. Research has also shown that interventions implemented at the elementary level
are not successful when applied to the secondary population. Intervention development
relies on sufficient assessment and problem analysis; this study, in the context of low
reading achievement nationwide, is the first step in the process. Thorough assessment
may provide the necessary link to successful interventions.

51
Chapter 3
Method
Participants & Setting
Eighty-three eleventh grade students from three Midwestern public schools were
selected for initial participation with the goal of collecting data from 60 students, which
was estimated to provide approximately 10 subjects per factor for the anticipated factor
analytic work (DeCoster, 1998). Each student fell below the 25th
percentile in the state on
the Spring Minnesota Comprehensive Assessment-II (MCA-II) Reading test during the
previous academic year. As such, a non-stratified sampling technique was employed. The
investigator requested students with no history or classification of Limited English
proficiency (LEP). Special Education students were included because so few students at
each school fell under the 25th
percentile that an appropriate sample size would not have
been achieved. The purpose for choosing this sampling approach was to identify profiles
of secondary students who have deficits in one or more reading subskill.
Of the 83 students selected for participation, four parents declined consent. Once
the study began, two students declined consent and one student withdrew from high
school before data collection began. Eight students opted out of participation after one
testing session was completed (either group or individual). Students who opted out of
participation after already completing one testing session provided the following reasons
for not continuing: parents told them they did not have to continue, they had too much
work to complete and could not miss instruction time, or they did not want to continue
(without specific reasoning). Two students did not complete the full battery of testing

52
because the investigator was unable to locate them on multiple occasions in order to
finish the testing sessions. Despite staggering the times at which the investigator pulled
the students from class, they were either not in the class (unverified skipping) or were
being held in disciplinary action. For two students, one subtest of vocabulary was not
completed, so their data could not be used in the analysis. Partial results from 55 students
were gathered; complete data were gathered for 43 students.
Among the 55 students, 27 were male and 18 were female. Sixty-seven percent of
students were Caucasian; 5% were African American; 7% were Hispanic; 9% were
Asian; and 5% were of other ethnicities. At one school site, students with Limited
English Proficiency (LEP) were included in the sample despite the request to exclude
them. Once the group session was completed, the investigator was confident that at least
four students had limited proficiency in English, but may not have been listed as LEP in
the school database. These students were not included in the remaining individual testing
session. One student completed all testing, but once the individual testing was completed,
it was evident that she was also LEP and was excluded from the analysis. The final
sample was comprised of 43 students.
Procedures
Participants were administered a battery of assessments by the investigator and
fellow school psychology graduate students. All participating students signed an
informed consent. Students were informed that participation was voluntary and responses
would not impact their grade in any content area.

53
Measures
All students in the participation pool were screened on four subskills of reading:
word identification (phonics), fluency, vocabulary, and comprehension. Students’ level of
motivation toward achievement in school was also assessed.
Word Identification. Two subtests from the Woodcock-Johnson Tests of
Achievement III (WJ Achievement-III) were used to assess word identification: Word
Attack and Letter Word Identification. Normative statistics for this battery range between
the ages of 2.0 and 90+. Word Attack assessed word identification skills for nonsense
words; students were given nonsense word stimuli and instructed to pronounce each one.
Thus, the examinee was required to demonstrate knowledge of phonics and word-level
structural analysis (Mather & Woodcock, 2001). Median reliability for this subtest is .87;
the standard error of measurement (SEM) was reported at 6.67 for 15 year old students.
Letter-word Identification required the examinee to identify real words and assessed
knowledge of phonics and word-level structural analysis. Median reliability for this
subtest is .91 with an SEM reported at 4.71 for 15 year old students (Mather &
Woodcock, 2001). All subtests were scored on a scaled mean of 100 with a standard
deviation of 15.
Fluency. Three eighth grade curriculum-based measurement for reading (CBM-
R) probes retrieved from AIMSweb were used to assess rate and accuracy. CBM results
are most valid when three or more probes are used to calculate the typical level of
performance, which is the median of the values observed on the three probes (Christ &
Ardoin, 2008; Christ & Coolong-Chaffin, 2007); therefore, the median score of these

54
three probes was taken as the student’s fluency score. Students were presented with a
passage and asked to read aloud for 1 minute. Their errors were marked and words read
correct per minute (WRCM) was computed. Alternate-form reliability coefficients for
CBM-R were calculated at .90, with an SEM of 13.3 for eighth grade probes (Christ &
Silberglitt, 2007; Howe & Shinn, 2002). Test-retest reliability coefficients for CBM-R
range from .82 to .97 with most above .90 (Christ & Silberglitt, 2007; Daniel, 2010).
The Sight Word Efficiency and Phonemic Decoding Efficiency subtests on the
Test of Word Reading Efficiency (TOWRE) were administered to students. Both subtests
are speeded measures. Students were given 45 seconds to read a list of sight words that
become progressively harder. On the Phonemic Decoding Efficiency subtest, students
were given 45 seconds to read a list of nonsense words that become progressively harder,
using abnormal and unfamiliar letter combinations. Test-retest reliability for the Sight
Word Efficiency subtest was .91, with an SEM of 4; test-retest reliability for the
Phonemic Decoding Efficiency subtest was .90 with an SEM of 3. All subtests were
scored on a scaled mean of 100 with a standard deviation of 15.
Vocabulary. The Vocabulary subtest of the Gates MacGinitie Reading Tests -
Fourth Edition (GMRT-4th
), Level 10/12 assessed reading vocabulary. Students
responded to 45 multiple-choice items to identify word meaning. The mean score for
eleventh grade students in the spring is 557 with a standard deviation of 36.2 (Maria &
Hughes, 2006). Internal reliability (KR-20) was reported at .91 with an SEM of 10.9
(Maria & Hughes, 2006).

55
The Reading Vocabulary subtest of the WJ Ach.-III (appropriate for use with ages
2.0 and up) was used to assess expressive vocabulary. The publisher reported reliability
coefficients of .90. The SEM was reported at 4.97 for 15 year old students. This subtest
was scored on a scaled mean of 100 with a standard deviation of 15 (Mather &
Woodcock, 2001).
Comprehension. The Passage Comprehension subtest of the WJ-Ach. III was
used to assess comprehension. Again, the age range for the WJ-Ach. III is between 2.0
and 90+. Examinees were presented with a sentence or short passage and were instructed
to identify a word that would best fit in the blank. The median reliability of the subtest is
.83 with an SEM reported at 6.84 for 15 year old students (Mather & Woodcock, 2001).
This subtest was scored on a scaled mean of 100 with a standard deviation of 15.
The Comprehension subtest of the GMRT-4th
, Level 10/12 was used to assess
reading comprehension. Students read short passages and answered three to six questions
based on the passage. This subtest was scored on a scaled mean of 563 with a standard
deviation of 37.5 (Maria & Hughes, 2006). Internal reliability (KR-20) was reported at
.93 with an SEM of 9.9 (Maria & Hughes, 2006).
Motivation. To measure motivation, the Inventory of School Motivation (ISM;
McInerney, Roche, McInerney, & Marsh, 1997) was administered. There were 43 items
on the scale that fell into one of eight motivation goals: task, effort, competition, social
power, affiliation, social concern, praise, and token. The task dimension measured an
interest in schoolwork and a desire to increase understanding, whereas effort was defined
as a desire to improve schoolwork. Competition measured whether students cared to

56
engage in any competitive behaviors in order to learn. Social power was defined as
interest in having or seeking social status, and affiliation was defined as desiring group
membership while completing work. Student desire to help others on schoolwork was
coined as social concern. Praise was measured as a desire to receive praise and
recognition for work, while token was defined as a need to receive tangible items in order
to improve on schoolwork. These goals load onto one of four general factors (mastery,
performance, social factors, and extrinsic factors) in addition to a general motivation
score. This tool fits into the goal orientation theory discussed in the literature review. See
Appendix A. Authors of the ISM consider the tool to be an exploratory instrument that
can identify motivation constructs that are relevant to the school context. The ISM is a
valid and reliable measure based on empirical studies that used the scale (McInerney &
Ali, 2006). Each dimension of motivation on the ISM has an alpha level ranging between
.66 and .81. Cronbach’s alpha for the ISM within this sample was .905, indicating that
there was internal consistency for this tool. The survey is on a 5-point Likert scale,
ranging from “strongly disagree” (1) to “strongly agree” (5). A higher score indicates a
higher level of motivation. Responses can also be pooled and scored by motivation
dimension.
Data Analyses
Prior to addressing any of the research questions, the characteristics of the data set
were evaluated to determine whether assumptions were met, in order to support each of
the analyses conducted. Next, a confirmatory factor analysis was conducted to confirm
that the measures used to assess achievement on reading subskills were appropriate and

57
related to the underlying construct of reading achievement. The following is a description
of each analysis conducted to answer each research question.
Research Question 1: To what extent can reading skills be identified profiles
at the secondary level? The first research question was answered by conducting a
hierarchical cluster analysis followed by a k-means cluster analysis. The hierarchical
cluster analysis was a more exploratory approach in which the researcher looked for
meaningful distinctions or places for a natural group separation. This was used to identify
the optimal number of clusters within a sample. Once the optimal number of clusters was
identified, a k-means cluster analysis was specified for that number of clusters (e.g., in
the present study, four clusters).
Research Question 2: What reading strengths and weaknesses are present for
each identified profile? Once profiles were identified, trends for each profile were
examined to determine the reading strengths and weaknesses characteristic of each
profile.
Research Question 3: To what extent are reading profiles for secondary
students similar to those of elementary students, as determined by Buly and
Valencia (2002)? A comparison between the profiles found in the current study and the
profiles identified in a similar study conducted at the elementary level (Buly & Valencia,
2002) was made to determine overlap. Trends in the data were examined by profile and
individual subskill. This information may provide some evidence regarding persistence of
reading strengths and weaknesses across grade levels.
Research Question 4: To what extent can subskill strengths and weaknesses

58
within each profile be used to develop targeted interventions? Examining trends in
the data were also used to determine the extent to which subskill strengths and
weaknesses could be used to develop targeted interventions. This question addressed
whether there were clear areas of weakness for which a practitioner should intervene in
order to target the skills most effectively. In addition, an ANOVA was conducted to
compare whether there was a significant difference between groups on each subskill. A
significant difference between groups would implicate the ability to develop targeted
interventions based on subskill strengths and weaknesses.
Research Question 5: To what extent will profile stability be related to group
or individual deficits? The fifth research question required a series of one-sample t-tests
to determine if sample scores on each subskill were significantly different from the mean
of that subskill within each profile. A difference between the scores and the profile mean
for each subskill would indicate that there is variability among individuals and the group
characteristics were not an adequate proxy for each individual. Findings of no difference
between individual student scores on each subskill and their cluster’s mean on the same
subskill would indicate profile stability based on individual characteristics.
Research Question 6: Does student level of motivation vary based on his/her
reading skills profile? Finally, the last research question required the use of ANOVA.
Student responses to items on each of the eight dimensions were summed in order to
conduct the ANOVA. Significant differences between groups would indicate that levels
of motivation varied across the reading profiles.
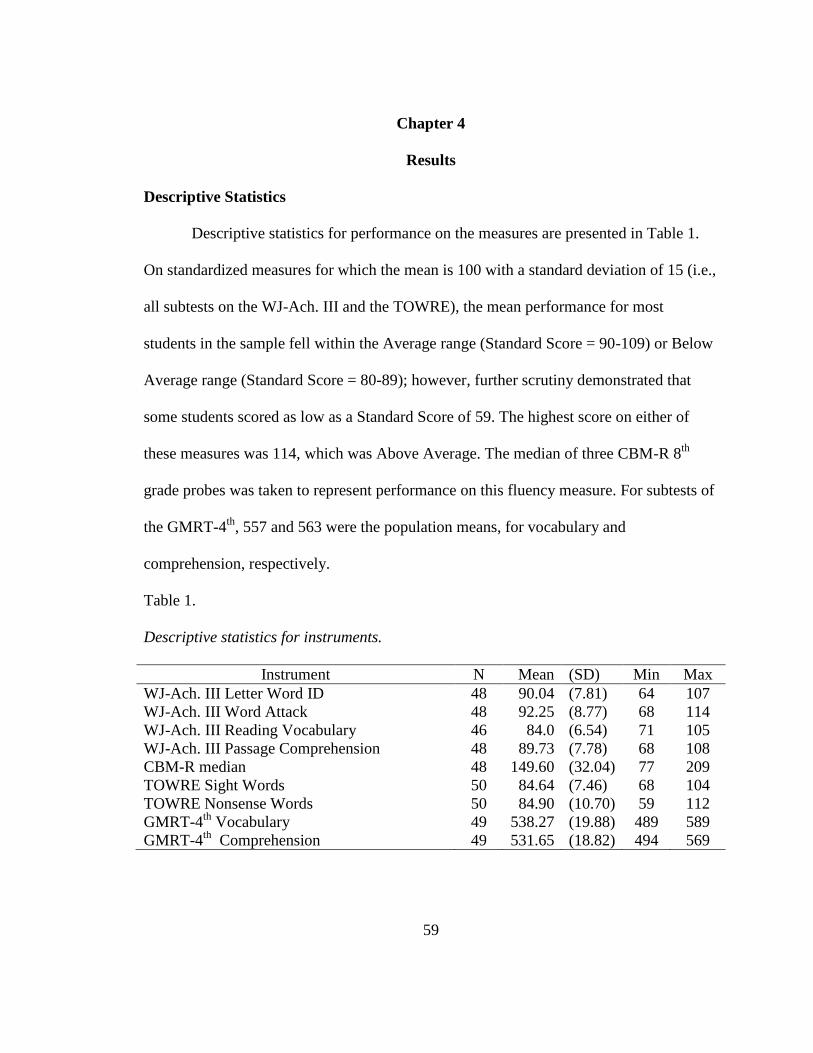
59
Chapter 4
Results
Descriptive Statistics
Descriptive statistics for performance on the measures are presented in Table 1.
On standardized measures for which the mean is 100 with a standard deviation of 15 (i.e.,
all subtests on the WJ-Ach. III and the TOWRE), the mean performance for most
students in the sample fell within the Average range (Standard Score = 90-109) or Below
Average range (Standard Score = 80-89); however, further scrutiny demonstrated that
some students scored as low as a Standard Score of 59. The highest score on either of
these measures was 114, which was Above Average. The median of three CBM-R 8th
grade probes was taken to represent performance on this fluency measure. For subtests of
the GMRT-4th
, 557 and 563 were the population means, for vocabulary and
comprehension, respectively.
Table 1.
Descriptive statistics for instruments.
Instrument N Mean (SD) Min Max
WJ-Ach. III Letter Word ID 48 90.04 (7.81) 64 107
WJ-Ach. III Word Attack 48 92.25 (8.77) 68 114
WJ-Ach. III Reading Vocabulary 46 84.0 (6.54) 71 105
WJ-Ach. III Passage Comprehension 48 89.73 (7.78) 68 108
CBM-R median 48 149.60 (32.04) 77 209
TOWRE Sight Words 50 84.64 (7.46) 68 104
TOWRE Nonsense Words 50 84.90 (10.70) 59 112
GMRT-4th
Vocabulary 49 538.27 (19.88) 489 589
GMRT-4th
Comprehension 49 531.65 (18.82) 494 569

60
Normality was evaluated for each measure and each factor (when measures were
collapsed across subskills). The optimal value for skewness is zero, within a normal
distribution. The optimal value for kurtosis is near three, within a normal distribution
(Howell, 2002). The information in Table 2 presents skewness and kurtosis for each
instrument; the information in Table 3 presents skewness and kurtosis for each factor.
When all subskills were collapsed, fluency, vocabulary, and comprehension demonstrated
a normal distribution. However, normality is not an assumption of cluster analysis.
Table 2.
Skewness and kurtosis by instrument.
Instrument Skewness St. Error Kurtosis St. Error
WJ-Ach. III Letter Word ID -1.52 .34 3.9 .67
WJ-Ach. III Word Attack -.12 .34 .45 .67
WJ-Ach. III Reading Vocabulary .63 .35 1.18 .69
WJ-Ach. III Passage Comprehension .006 .34 .85 .67
CBM median -.25 .34 -.50 .67
TOWRE Sight Words .24 .34 .40 .66
TOWRE Nonsense Words -.16 .34 .40 .66
GMRT Vocabulary .45 .34 .60 .67
GMRT Comprehension .05 .34 .85 .67
Table 3.
Skewness and kurtosis by subskill.
Subskill Skewness St. Error Kurtosis St. Error
Phonics -.98 .35 1.51 .70
Fluency .19 .35 .07 .70
Vocabulary .80 .35 .84 .70
Comprehension .06 .35 -.65 .70

61
Missing data were eliminated via list-wise deletion, which was the default option
in Lisrel and SPSS. Listwise deletion removed cases with any missing data (Albright,
2008). Missing data were found to be missing at random; students who opted out of either
testing session (group or individual) did so due to absences or deciding not to participate
for the remainder of the study (see Participants and Settings for additional
documentation). The full sample size used during the CFA was 52 students.
Transforming scores
All scores were transformed to z-scores so that they were on the same scale and
able to be compared. Any distribution of scores can be transformed to z-scores by using
the following equation:
z = X -
As a result of using this equation and transforming the scores to z-scores, the mean for all
scores on all tests administered was zero with a standard deviation of one.
Confirmatory Factor Analysis
A confirmatory factor analysis (CFA) was conducted to determine the relationship
between the observed variables and the latent variable, reading achievement. The wide
literature base and research on reading achievement allows for a CFA, rather than an
exploratory factor analysis. CFA tests theories, while EFA generates theories (Roberts,
1999). Supporting reading theories demonstrated that the subskills measured are related
to reading achievement. To confirm that the measures used in the current study do the
same, a CFA was required. Moreover, a model was predicted based on a priori theories of
reading enabling an examination of how well the data fit the model (Harrington, 2009).

62
Using CFA confirms that the data adequately fit the model. CFA was possible once
scores were transformed to the same scale because these scores then represented a
known, rather than unknown, estimate for each parameter (Harrington, 2009). Table 4
presents the instruments and indicates which subskill was measured by each instrument.
Table 4.
Instruments used to measure each subskill.
Instrument Phonics Fluency Vocabulary Comprehension
WJ-Ach. III
Letter Word Identification X
Word Attack X
Reading Vocabulary X
Passage Comprehension X
CBM-R X
TOWRE
Sight Word Efficiency X
Phonemic Decoding Efficiency X
GMRT-4th
Vocabulary X
Comprehension X
The following criteria were used to determine goodness-of-fit for the model: chi
square statistic, goodness-of-fit index, standardized root mean square residual, and the
root mean square error of approximation. A review of each statistic was used to evaluate
whether the model adequately fit the data.
A chi-square statistic should not be significant (p < .05), because it indicates that
the null hypothesis may not be rejected and the model adequately fits the data. A
goodness-of-fit index (GFI) should approach 1.0; this indicates a perfect model fit. The

63
standardized root mean square residual (Standardized RMR) should be less than .08.
Finally, the root mean square error of approximation (RMSEA) should be less than or
equal to .06 (Harrington, 2009; Hu & Bentler, 1999).
CFA models should be over-identified. Over-identified models are those in which
the number of unknowns is smaller than the number of knowns (Harrington, 2009). The
df should also be above zero, and df is calculated by the number of unknowns minus the
number of knowns. In Model 3, the df were 16, the number of knowns was 36, and the
unknowns were 20. Only when a model is over-identified can GFI statistics be evaluated
(Harrington, 2009).
CFA Results. Lisrel software was used to conduct the CFA, using Maximum
Likelihood Estimation (MLE). MLE is most commonly used because it can predict how
well the parameters can identify the relationships between the observed and latent
variables (Brown, 2006). MLE assumes normality and observed variables must be on a
continuous scale (Brown, 2006). MLE also requires a large sample size. Although the
sample size in the current study was not large, it was still appropriate to use this method
because this was a one-factor model.
Four models were tested, using a standardized (z-score) correlation matrix (Table
5).

64
Table 5.
Correlation matrix for measures using z-scores.
WJ
Letter
Word ID
WJ
Word
Attack
WJ Reading
Vocabulary
WJ Passage
Comprehension
CBM TOWRE
Sight Word
Efficiency
TOWRE
Phonemic
Decoding
Efficiency
GMRT
Vocabulary
GMRT
Comprehension
WJ-Ach. III
Letter Word ID 1
WJ-Ach. III Word
Attack .654** 1
WJ-Ach. III
Reading
Vocabulary
.346* .388* 1
WJ-Ach. III
Passage
Comprehension
.106 .069 .455** 1
CBM-R .411**
.567*
*
.333* .185 1
TOWRE Sight
Word Efficiency .338* .489*
*
.400** .274 .730*
*
1
TOWRE
Phonemic
Decoding
Efficiency
.435** .768*
*
.416** .280 .563*
*
.646** 1
GMRT -4th
Vocabulary .346* .247 .497** .193 .172 .184 .020 1
GMRT-4th
Comprehension .325* .252 .485** .393** .311* .378* .282 .513** 1

65
Each model was a one-factor model, and the latent construct was Reading
Achievement. Model 1 included nine observed variables (e.g., each measure administered
to participants) and one latent variable, reading achievement. Only one change was made
for Model 2: variables that measure each reading subskill were covaried. For example,
the WJ-Ach. III Passage Comprehension and the GMRT-4th
Edition Comprehension
subtest were covaried to demonstrate that they measured the same reading subskill and
were related. This decision was empirically based to represent the relationship between
measures that were assessing the same subskill. In Model 3, the TOWRE Phonemic
Decoding Efficiency subtest was eliminated, which left eight observed variables in the
model. The TOWRE Phonemic Decoding Efficiency subtest was eliminated as a measure
of fluency because it called upon higher level phonics skills that may confound direct
observation of reading rate and accuracy. After observing subjects struggle on this
subtest, it did not appear to tap into the domain of fluency solely. Related measures were
still covaried. In Model 4, all observed variables were included, but TOWRE Phonemic
Decoding Efficiency was covaried with the other phonics measures (Letter Word
Identification and Word Attack), rather than with the other fluency measures. See Figure
1 for the path diagram.

66
Figure 1. Confirmatory Factor Analysis: Model 3
WJ-Ach. III Letter Word
Identification
(Phonics)
WJ-Ach. III Word Attack
(Phonics)
GMRT-4th
Vocabulary
(Vocabulary)
CBM-R
(Fluency)
TOWRE Sight Words
(Fluency)
WJ-Ach. III Reading
Vocabulary (Vocabulary)
WJ-Ach. III Passage
Comprehension
(Comprehension)
GMRT-4th
Comprehension
(Comprehension)
0.37
0.24
0.29
0.30
0.30
0.32
0.30
0.33
Chi-Square = 20.32
df = 16
P-value = 0.21
RMSEA=0.076
Reading
Achievement

67
Model 3 provided an adequate fit to the data. The goodness-of-fit Chi Square statistic for
the one-factor Model 3 was not significant (p=0.20). In CFA, the null hypothesis that the
model is a good should not be rejected (Roberts, 1999), which was the case because the
p-value was not significant. The goodness-of-fit index (GFI) was 0.91, which further
provided evidence for a model with adequate fit. The standardized root mean square
residual was less than 1.0, at 0.08. This demonstrated that the relationships between
measured variables were explained by the model. The root mean square error of
approximation (RMSEA) also fell within acceptable criteria at 0.06, indicating that the
model fits ‘reasonably well’ in the population (Harrington, 2009). In all other models
tested, criteria did not fall within the acceptable range and the models did not adequately
fit the data.
In Model 3, all paths were positive, which indicated that all measures were
positively related to reading achievement. Factor loadings on Reading Achievement were
between .24 for the WJ-Ach. III Passage Comprehension and .37 for the Comprehension
subtest of the GMRT-4th
. Model 3 provided the evidence necessary to move on to the
following analyses.
Research Question 1: To what extent can reading skills profiles be identified at the
secondary level?
Four reading skills profiles emerged in this study, which demonstrated that it is
possible to identify the reading strengths and weaknesses of high school students with

68
reading deficits. The purpose of employing cluster analysis was to identify specific
patterns of reading, rather than having to depend on a pattern of the average.
Essentially, cluster analysis created a system of classification (Aldenderfer &
Blashfield, 1984). Cluster analysis paired the most similar cases, added each case to the
cluster (or profile) in which they fit best, and students were then placed into clusters that
described patterns of reading. The data were grouped into clusters that described the
objects (students) and their relationships. Thus, students within a cluster were similar to
one another, but different from students that were assigned to other clusters. Within each
cluster, the variables identified during the confirmatory factor analysis were considered
(Borgen & Barnett, 1987; Buly & Valencia, 2002).
The first step in cluster analysis was measuring the proximity of objects (Borgen
& Barnett, 1987), or in this case, students. To do this, a matrix of P x V was created
(where P is persons and V is variable), and correlations were presented. In this way,
similar individuals can be identified based on correlation (Borgen & Barnett, 1987;
Aldenderfer & Blashfield, 1984). Standardization of means must be considered when
conducting a cluster analysis (Borgen & Barnett, 1987). All scores were transformed to z-
scores prior to this step of the analysis to satisfy this requirement. The second step in
conducting cluster analysis was to determine the cluster search method (Lorr, 1983). For
this part of the analysis, a hierarchical method was utilized since there was no pre-
determined number of clusters (Borgen & Barnett, 1987). Specifically, an agglomorative
hierarchical method of cluster analysis referred to pairing the most similar cases in the
sample until all cases were assigned. This approach allowed for the researcher to

69
determine how many clusters to identify, and to apply alternate solutions. One downfall
of this approach was that there was no guidance in determining the appropriate number of
clusters (Aldenderfer & Blashfield, 1984; Borgen & Barnett, 1987). Researchers must use
the dendrogram and icicle plot to determine the optimal number of clusters and some
amount of subjectivity when interpreting these graphs. See Figure 6 in Appendix B.
Once a hierarchical cluster analysis was run and graphical presentations examined
to roughly identify the optimal number of clusters within a data set, it was appropriate to
run a k-means cluster analysis as a basis of confirming the optimal number of clusters. A
k-means cluster analysis was a form of an optimization algorithm (Everitt, Landau,
Leese, & Stahl, 2011). This algorithm relocated objects or cases into different clusters
until cases were located within the cluster to which it was closest. A k-means algorithm
placed cases within the optimal cluster by calculating the mean, or centroid, of each
cluster and compared individual cases to the centroid. This algorithm ensured that cases
within a given cluster are similar to one another. To begin, the two cases that were most
different (in z-score value in the current data set) were placed in separate clusters, using
the Euclidean distance measure. Next, individual cases were placed in one of the clusters
based on their proximity to the centroid (again, based on the Euclidean distance to the
cluster mean). The clustering followed a series of stages in which cases were placed
individually until each case was placed within the optimal cluster. Once all cases were
placed within a cluster, the k-means algorithm was used to compare individual cases to
the group’s mean in order to determine if it was appropriately placed. If a case needed to

70
be moved, this step was conducted. Case relocation was an iterative process and only
ended once all individual cases were within the optimal cluster.
In the current study, a k-means cluster analysis was conducted, specifying four
clusters. Based on the hierarchical cluster analysis, this appeared to be the optimal
number of clusters based on the dendrogram. Figures 2 through 5 are graphical
presentations of the clusters, and are presented with descriptions of each of the clusters.
There was a clear distinction between the clusters, whether this was based on level of
performance or strength (or weakness) of performance in one or more reading subksills.
Table 6 presents the mean z-score for each subskill by cluster.
Table 6.
Descriptive statistics for each subskill by cluster (profile).
Cluster N % of
Sample
Phonics Fluency Vocabulary Comprehension
Quick Word
Callers
17 39 -.57 -.73 -.97 -1.09
Lowest Readers 5 11 -1.65 -1.19 -1.12 -1.12
Quick &
Accurate
14 31 -.60 -.35 -.75 -.48
Quick
Comprehenders
9 20 -.14 .01 -.24 -.40
There were six assumptions for cluster analysis in general and an additional eight
for k-means cluster analysis. These assumptions included interval data, independence of
observations, independence of variables, and comparability (transforming scores to z-
scores) (Garson, Retrieved 12-30-11 from
http://faculty.chass.ncsu.edu/garson/PA765/cluster.htm#assume); each of these were met.

71
A large sample size was an assumption of k-means cluster analysis, with a minimum of
200 cases. This assumption was violated within this analysis, however, results can still be
interpreted with caution.
Based on the hierarchical cluster analysis and the k-means cluster analysis, four
meaningful clusters were identified for students at the secondary level. Randomization is
an assumption of k-means cluster analysis because data order impacts cluster assignment.
Data were randomized and a k-means cluster analysis specifying four clusters was
conducted again to confirm the results of the first analysis. When the cluster membership
was compared to the first four-cluster k-means cluster analysis, groups were congruent
with the exception of three students. For instance, students were assigned to cluster two
rather than cluster four. Interestingly, both of these groups demonstrated strengths in
vocabulary and comprehension. It is feasible to state that the centroids of these clusters
were quite similar making it difficult for the software to uniquely separate these three
students. Given the type of reading skills data that were collected, four reading skills
profiles were indeed identified for this population: Quick Word Callers, Lowest Readers,
Quick and Accurate, and Quick Comprehenders.
Research Question 2: What reading strengths and weaknesses were present for each
profile?
The second research question sought to qualify the identified clusters by
describing the strengths and weaknesses of each of the four reading profiles.
Characteristics of each profile were based on the level of achievement of each of the four

72
subskills assessed: phonics, fluency, vocabulary, and comprehension. The level of
achievement on each subskill was compared within each profile, and also compared
across profiles.
Profile 1, or the Quick Word Callers profile, included readers who were weaker in
vocabulary and comprehension than in phonics and fluency. The Quick Word Callers
demonstrated relative strengths in lower level reading skills, phonics and fluency. Despite
this demonstrated strength, readers in this profile had some difficulty reading familiar and
unfamiliar words, and were slow readers. Moreover, they exhibited weaker skills in the
area of vocabulary and comprehension. These readers could comprehend the text, but
may only be able to draw literal information from the text or draw lower level inferential
conclusions. Although the title of the profile may indicate great strength in the area of
phonics and fluency, this strength is relative to their weaknesses in the remaining reading
subskills. See Figure 2.

73
Quick Word Callers
-2.5
-2
-1.5
-1
-0.5
0
0.5
Phonics
Fluency
Vocabula
ry
Compre
hension
Reading Subskill
Z-s
core
1
2
6
7
9
11
12
14
17
26
29
34
36
41
49
52
57
59
1
2
6
7
9
11
12
14
17
26
29
34
36
41
49
52
57
59
c
Figure 2. Graphical presentation of Quick Word Callers profile, by z-score and subskill.
This figure illustrates how students in the Quick Word Callers profile performed on each
of the subskills.
Profile 2 was coined “Lowest Readers” because it consisted of readers who were
low across all four skills, with the most significant weakness in phonics. In most
instances of cluster analysis examined (3, 4, 5, and 6 clusters specified), these students
Student ID

74
were always grouped together. Not only were they weak across all subskills, but their
level of weakness was lower than each of the other three groups. Based on the principal
of top-down, bottom-up processing in reading (Hoover & Gough, 1990), these findings
were not surprising: phonics is the lowest level subskill examined in this study and all
higher-level skills must build upon it. Therefore, if the lowest subskill was weak, it would
follow that the remaining subskills would be quite weak as well. See Figure 3.
Lowest Readers
-2.5
-2
-1.5
-1
-0.5
0
0.5
Phonics
Fluency
Vocabula
ry
Compre
hension
Reading Subskill
Z-s
core
4
23
42
51
55
Student ID

75
Figure 3. Graphical presentation of Lowest Readers profile, by z-score and subskill. This
figure illustrates how students in the Lowest Readers profile performed on each of the
subskills.
The third profile, the Quick and Accurate Readers, included students who
performed the highest across the four subskills. This profile might actually be compared
to the first profile because they exhibited the same strengths and weaknesses: stronger in
the areas of phonics and fluency than in vocabulary and comprehension. Although the
relative strengths and weaknesses were the same as Quick Word Callers, students in this
profile performed each subskill at a higher level of achievement. This may imply that
students in this profile would be able to extract more information from a high school
level text, in addition to being able to draw inferential or even evaluative conclusions.

76
Quick and Accurate Readers
-2.5
-2
-1.5
-1
-0.5
0
0.5
Phonics
Fluency
Vocabula
ry
Compre
hension
Reading Subskill
Z-s
core
24
25
32
44
45
65
67
Figure 4. Graphical presentation of Quick and Accurate profile, by z-score and subskill.
This figure illustrates how students in the Quick and Accurate profile performed on each
of the subskills.
Profile 4 readers, or the Quick Comprehenders, demonstrated weaknesses in
phonics and vocabulary, but relative strengths in fluency and comprehension. This
Student ID

77
indicated that when these students struggled to identify words while reading, they were
unable to pair meanings with those words. They may have had a slight strength in reading
rate, which may have contributed to a slightly higher level of comprehension. If a student
can read through a text more quickly, he or she is likely to gain more information than the
student who reads more slowly, and therefore, less of the text; however, students with
this pattern of reading strengths and weaknesses were simultaneously struggling to
identify words and define those words. Perhaps these students will be able to read more
of an assigned textbook, but their level of comprehension may only extend to gathering
literal information. See Figure 5.

78
Quick Comprehenders
-2.5
-2
-1.5
-1
-0.5
0
0.5
Phonics
Fluency
Vocabula
ry
Compre
hension
Reading Subskill
Z-s
core
5
8
19
21
22
28
31
35
37
53
54
62
66
Figure 5. Graphical presentation of Quick Comprehenders profile, by z-score and
subskill. This figure illustrates how students in the Quick Comprehenders profile
performed on each of the subskills.
Student ID
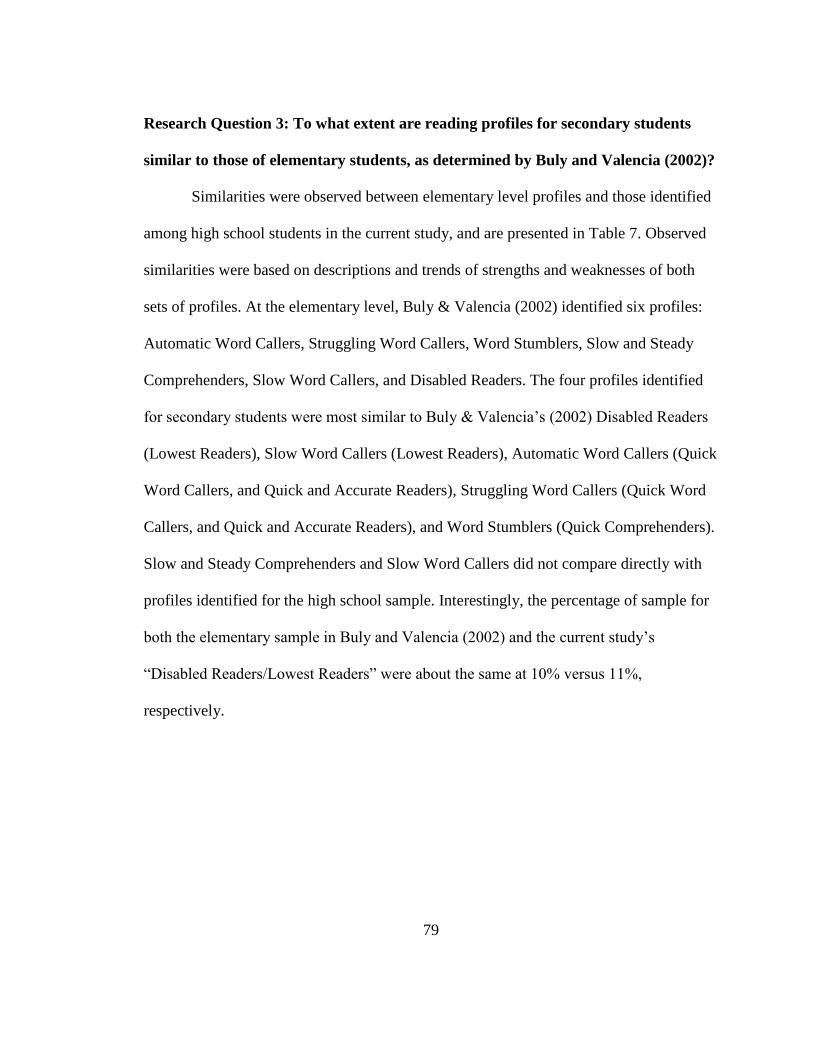
79
Research Question 3: To what extent are reading profiles for secondary students
similar to those of elementary students, as determined by Buly and Valencia (2002)?
Similarities were observed between elementary level profiles and those identified
among high school students in the current study, and are presented in Table 7. Observed
similarities were based on descriptions and trends of strengths and weaknesses of both
sets of profiles. At the elementary level, Buly & Valencia (2002) identified six profiles:
Automatic Word Callers, Struggling Word Callers, Word Stumblers, Slow and Steady
Comprehenders, Slow Word Callers, and Disabled Readers. The four profiles identified
for secondary students were most similar to Buly & Valencia’s (2002) Disabled Readers
(Lowest Readers), Slow Word Callers (Lowest Readers), Automatic Word Callers (Quick
Word Callers, and Quick and Accurate Readers), Struggling Word Callers (Quick Word
Callers, and Quick and Accurate Readers), and Word Stumblers (Quick Comprehenders).
Slow and Steady Comprehenders and Slow Word Callers did not compare directly with
profiles identified for the high school sample. Interestingly, the percentage of sample for
both the elementary sample in Buly and Valencia (2002) and the current study’s
“Disabled Readers/Lowest Readers” were about the same at 10% versus 11%,
respectively.
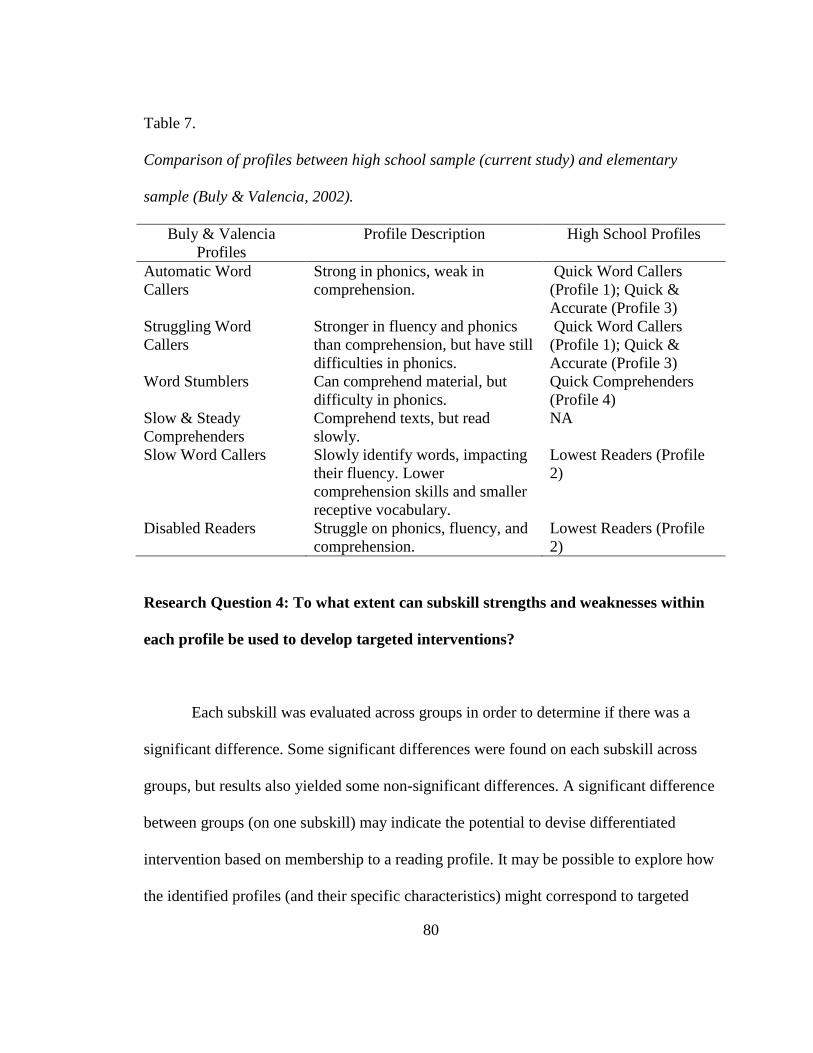
80
Table 7.
Comparison of profiles between high school sample (current study) and elementary
sample (Buly & Valencia, 2002).
Buly & Valencia
Profiles
Profile Description High School Profiles
Automatic Word
Callers
Strong in phonics, weak in
comprehension.
Quick Word Callers
(Profile 1); Quick &
Accurate (Profile 3)
Struggling Word
Callers
Stronger in fluency and phonics
than comprehension, but have still
difficulties in phonics.
Quick Word Callers
(Profile 1); Quick &
Accurate (Profile 3)
Word Stumblers Can comprehend material, but
difficulty in phonics.
Quick Comprehenders
(Profile 4)
Slow & Steady
Comprehenders
Comprehend texts, but read
slowly.
NA
Slow Word Callers Slowly identify words, impacting
their fluency. Lower
comprehension skills and smaller
receptive vocabulary.
Lowest Readers (Profile
2)
Disabled Readers Struggle on phonics, fluency, and
comprehension.
Lowest Readers (Profile
2)
Research Question 4: To what extent can subskill strengths and weaknesses within
each profile be used to develop targeted interventions?
Each subskill was evaluated across groups in order to determine if there was a
significant difference. Some significant differences were found on each subskill across
groups, but results also yielded some non-significant differences. A significant difference
between groups (on one subskill) may indicate the potential to devise differentiated
intervention based on membership to a reading profile. It may be possible to explore how
the identified profiles (and their specific characteristics) might correspond to targeted

81
interventions. For instance, because the Lowest Reader students had weaknesses across
all subskills, instruction would target each of the subskills. For Quick Word Callers and
Quick and Accurate readers, most instruction could target vocabulary and comprehension
while also facilitating progress in phonics and fluency. These observations were based on
the trend of the scores on each subskill within each cluster. Further analysis was
necessary to determine exact differences among groups on each subskill.
A series of ANOVAs was conducted. Tukey’s post hoc analysis can be
interpreted when the Levene statistic is not significant, indicating equal variances. The
Levene statistic was not significant for all subskills, so Bonferonni’s alpha was used.
Table 8 presents results of the ANOVA for all subskills. Tables 9 through 12 present
results of the ANOVA using Tukey’s post hoc analysis between groups on each subskill.
This analysis demonstrated that differentiated instruction in the targeted area of phonics
may be possible between some profiles, but not across all profiles. Based on the analysis
for fluency performance between groups, differentiated instruction may be possible based
on the significant differences between some profiles, but this does not apply to all
profiles. Fluency instruction could be differentiated across some profiles, but the same
fluency instruction may be applicable to more than one group. With regard to differences
between performance on vocabulary measures, vocabulary instruction could be
differentiated between some profiles (e.g., Quick Word Callers and Quick and Accurate,
Lowest Readers and Quick and Accurate, and Quick and Accurate and Quick
Comprehenders), but there would be limited ability to differentiate across all profiles.
Finally, performance on comprehension measures was examined to determine whether
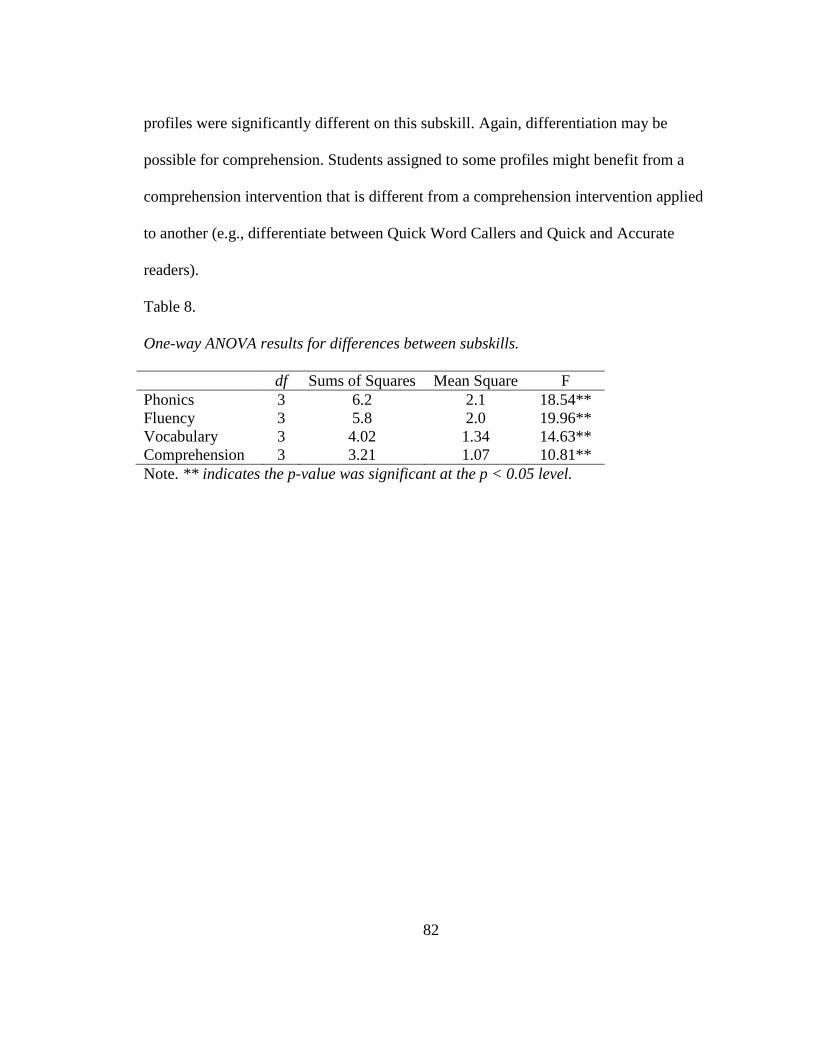
82
profiles were significantly different on this subskill. Again, differentiation may be
possible for comprehension. Students assigned to some profiles might benefit from a
comprehension intervention that is different from a comprehension intervention applied
to another (e.g., differentiate between Quick Word Callers and Quick and Accurate
readers).
Table 8.
One-way ANOVA results for differences between subskills.
df Sums of Squares Mean Square F
Phonics 3 6.2 2.1 18.54**
Fluency 3 5.8 2.0 19.96**
Vocabulary 3 4.02 1.34 14.63**
Comprehension 3 3.21 1.07 10.81**
Note. ** indicates the p-value was significant at the p < 0.05 level.

83
Table 9.
Tukey’s post hoc analysis for differences between groups on phonics measures.
Quick Word
Callers
Lowest Readers Quick &
Accurate
Readers
Quick
Comprehenders
Standard
Error
Sig. Standard
Error
Sig. Standard
Error
Sig. Standard
Error
Sig.
Quick Word Callers 0.17 0.00 0.15 0.03 0.12 1.00
Lowest Readers 0.17 0.00 0.2 0.00 0.18 0.00
Quick & Accurate
Readers
0.15 0.03 0.2 0.03 0.16 0.03
Quick Comprehenders 0.12 1.00 0.18 1.00 0.16 0.03

84
Table 10.
Tukey’s post hoc analysis for differences between groups on fluency measures.
Quick Word
Callers
Lowest Readers Quick &
Accurate
Readers
Quick
Comprehenders
Standard
Error
Sig. Standard
Error
Sig. Standard
Error
Sig. Standard
Error
Sig.
Quick Word Callers 0.15 0.26 0.14 0.00 0.11 0.00
Lowest Readers 0.16 0.26 0.18 0.00 0.16 0.00
Quick & Accurate
Readers
0.14 0.00 0.18 0.00 0.15 0.62
Quick Comprehenders 0.11 0.00 0.16 0.00 0.15 0.62

85
Table 11.
Tukey’s post hoc analysis for differences between groups on vocabulary measures.
Quick Word
Callers
Lowest Readers Quick &
Accurate
Readers
Quick Comprehenders
Standard
Error
Sig. Standard
Error
Sig. Standard
Error
Sig. Standard
Error
Sig.
Quick Word Callers 0.15 0.25 0.13 0.00 0.11 0.89
Lowest Readers 0.15 0.25 0.18 0.00 0.16 0.11
Quick & Accurate
Readers
0.13 0.13 0.18 0.00 0.14 0.00
Quick
Comprehenders
0.11 0.89 0.16 0.11 0.14 0.00

86
Table 12.
Tukey’s post hoc analysis for differences between groups on comprehension measures.
Quick Word
Callers
Lowest Readers Quick & Accurate
Readers
Quick Comprehenders
Standard
Error
Sig. Standard
Error
Sig. Standard
Error
Sig. Standard
Error
Sig.
Quick Word Callers 0.16 1.00 0.14 0.00 0.11 0.00
Lowest Readers 0.16 1.00 0.18 0.00 0.17 0.02
Quick & Accurate
Readers
0.14 0.00 0.18 0.00 0.15 0.76
Quick
Comprehenders
0.11 0.00 0.17 0.02 0.15 0.76

87
Research Question 5: To what extent will profile stability be related to group or
individual deficits?
A series of one-sample t-tests was conducted, which yielded non-significant
differences between individual scores on subskills and mean subskill scores, within each
profile. The purpose of this research question was to examine whether characteristics of
the individual would match exactly that of the characteristics of the group. This would
indicate a more stable profile based on individuals’ characteristics. A less stable profile
would be one in which students were assigned to a profile based on similarity of
characteristics, but were not an exact match to that of the group. If results indicated the
latter finding, then it would indicate great variability among individuals within a profile
and that assigning the student to such a group would not be helpful in developing skills-
based interventions.
Results are presented in Table 13. These results indicated that there were no
significant differences between the group mean and individuals, demonstrating limited
variability within groups. Therefore, the characteristics of each profile were
representative of the specific reading strengths and weaknesses of each individual within
a given profile, lending to profile stability based on individual deficits.

88
Table 13.
One-sample t-test results by profile and subskill.
Profile df t Sig. (2-tailed)
Quick Word Callers
Phonics 17 .05 .97
Fluency 17 .06 .95
Vocabulary 17 -.02 .98
Comprehension 17 -.15 .88
Lowest Readers
Phonics 4 .22 .84
Fluency 4 .11 .92
Vocabulary 4 .32 .77
Comprehension 4 -.25 .81
Quick and Accurate
Phonics 6 .00 1.0
Fluency 6 -.03 .98
Vocabulary 6 .01 .99
Comprehension 6 -.02 .99
Quick Comprehenders
Phonics 12 .04 .97
Fluency 12 -.02 .99
Vocabulary 12 -.01 .99
Comprehension 12 .04 .97
Group (cluster) stability was defined as the ability to obtain the same
characteristics (or deficits) even once students were removed from that group. To analyze
this research question, a second k-means cluster analysis could be conducted by
removing randomly selected students from each group. However, based on the limited
sample size, it would be unwise to interpret the results of this analysis.

89
Research Question 6: Does student level of motivation vary based on his/her reading
skills profile?
The Inventory of School Motivation (ISM; McInerney & Ali, 2006) survey was
administered to determine whether student level of motivation varied based on the
reading skills profile to which he or she belonged. It was expected that students who
struggled the most across the reading subskills would demonstrate the lowest levels of
motivation. Thus, it was hypothesized that students in the Lowest Readers profile would
have the lowest levels of motivation in the sample. Surveys were collected for 50
students, however, only 43 of them could be assigned to a profile. No standardized scores
were identified by the survey authors. Therefore, the survey was scored by summing all
responses to obtain eight dimension scores. Authors of the survey did not recommend
finding an “overall motivation” score (Email correspondence with Dr. McInerney, April
2011), so no scores of this kind were calculated. Frequency counts provided information
about responses by profile and each dimension: task, effort, competition, social power,
affiliation, social concern, praise, and token. Results are presented in Tables 14 through
17.

90
Table 14.
Frequency counts and descriptive statistics for Quick Word Callers responses on the ISM.
Item Strongly
Disagree
Disagree Neutral Agree Strongly
Agree
M SD
Task Dimension
I like being given the chance to do something again to make it
better.
- 1 2 6 7 4.2 .91
I try harder with interesting work. 1 - 1 8 6 4.1 1.0
I like to see that I am improving in my schoolwork. - 1 2 5 8 4.3 .93
I need to know that I am getting somewhere with my
schoolwork.
- - 6 6 4 3.9 .81
Mean of Dimension 4.1
Effort Dimension
I don’t mind working a long time at schoolwork that I find
interesting.
2 - 6 5 3 3.4 1.2
I try hard to make sure that I am good at my schoolwork. - 1 6 3 6 3.9 1.0 When I am improving in my schoolwork, I try even harder. - 1 2 10 3 3.9 .77
The harder the problem, the harder I try. - 4 6 5 1 3.2 .91
I try hard at school because I am interested in my work. 3 1 6 3 2 2.8 1.5
I work hard to try to understand new things at school. - 2 5 7 2 3.6 .89
I am always trying to do better in my schoolwork. - 2 3 8 3 3.8 .93
Mean of Dimension 3.5
Competition Dimension
Winning is important to me. - 3 5 2 4 3.1 1.6
Coming first is very important to me. 1 1 6 5 3 3.5 1.1
I like to compete with others at school. 3 2 5 2 4 3.1 1.5

91
I work harder if I’m trying to be better than others. 1 3 3 6 3 3.4 1.2
I want to do well at school to be better than my classmates. - 7 2 6 1 3.1 1.1
I am only happy when I am one of the best in class. 3 7 3 1 2 2.5 1.3
Mean of Dimension 3.1
Social Power Dimension
I work hard at school so that I will be put in charge of a group. - 2 8 6 - 3.3 .68
I want to feel important in front of my school friends. - 2 5 7 2 3.6 .89
At school, I like being in charge of a group. - 5 8 3 - 2.9 .72
It is very important for me to be a group leader. 3 5 6 2 - 2.4 .96
I work hard at school because I want the class to notice me. 1 4 8 1 - 2.3 1.1
I often try to be the leader of a group. 2 7 4 3 - 2.5 .97
Mean of Dimension 2.8
Affiliation Dimension
I do my best work at school when I am working with others. 1 1 1 9 3 3.6 1.4
I try to work with friends as much as possible at school. - 3 3 7 3 3.6 1.0
I prefer to work with other people at school rather than alone. 2 1 2 5 6 3.8 1.4
Mean of Dimension 3.7
Social Concern Dimension
It is very important for students to help each other at school. 1 1 3 3 8 4.0 1.3
I like to help other students do well at school. 1 2 4 6 3 3.5 1.2
I care about other people at school. 2 1 2 8 3 3.6 1.4
I enjoy helping others with their schoolwork even if I don’t do
so well myself.
2 4 3 7 - 2.9 1.1
It makes me unhappy if my friends aren’t doing well at school 1 2 9 4 - 3.0 .82
Mean of Dimension 3.4
Praise Dimension
Praise from my teachers for my good schoolwork is important
to me.
- 1 6 7 2 3.6 .81

92
Praise from my friends for good schoolwork is important to me. 2 2 6 4 2 3.1 1.2
At school, I work best when I am praised. - 5 4 5 1 2.9 1.2
I want to be praised for my good schoolwork. 2 3 6 4 1 2.9 1.1
Praise from my parents for good schoolwork is important to
me.
- 4 5 6 1 3.3 .93
Mean of Dimension 3.2
Token Dimension
I work best in class when I can get some kind of reward. 1 5 4 3 3 3.1 1.3
I work hard in class for rewards from the teacher. 1 4 7 4 - 2.9 .89
I work hard at school for presents from my parents. 1 5 7 3 - 2.8 .86
Getting a reward for my good schoolwork is important to me. - 5 5 4 2 3.2 1.0
Getting merit certificates helps me work harder at school. 2 4 6 4 - 2.8 1.0
Praise for good work is not enough, I like a reward. 1 8 6 - 1 2.5 .89
If I got rewards at school I would work harder. 1 5 4 2 4 3.2 1.3
Mean of Dimension 2.9

93
Table 15.
Frequency count and descriptive statistics for Lowest Readers responses on the ISM.
Item Strongly
Disagree
Disagree Neutral Agree Strongly
Agree
M SD
Task Dimension
I like being given the chance to do something again to make it
better.
- - - 1 4 4.8 .45
I try harder with interesting work. - - - 2 3 4.6 .55
I like to see that I am improving in my schoolwork. - - 1 2 2 4.2 .84
I need to know that I am getting somewhere with my
schoolwork.
- 2 - 1 2 3.6 1.5
Mean of Dimension 4.3
Effort Dimension
I don’t mind working a long time at schoolwork that I find
interesting.
- - - 3 2 4.4 .55
I try hard to make sure that I am good at my schoolwork. - - 3 1 1 3.6 .89 When I am improving in my schoolwork, I try even harder. - - 1 3 1 4.0 .71
The harder the problem, the harder I try. - 2 - 2 1 3.4 1.3
I try hard at school because I am interested in my work. 1 - 1 2 1 3.4 1.5
I work hard to try to understand new things at school. - - - 4 1 4.2 .45
I am always trying to do better in my schoolwork. - 1 - 2 2 4.0 1.2
Mean of Dimension 3.9
Competition Dimension
Winning is important to me. - 1 3 - - 2.2 1.3
Coming first is very important to me. 1 2 1 - 1 2.6 1.5
I like to compete with others at school. - 3 1 - 1 2.8 1.3
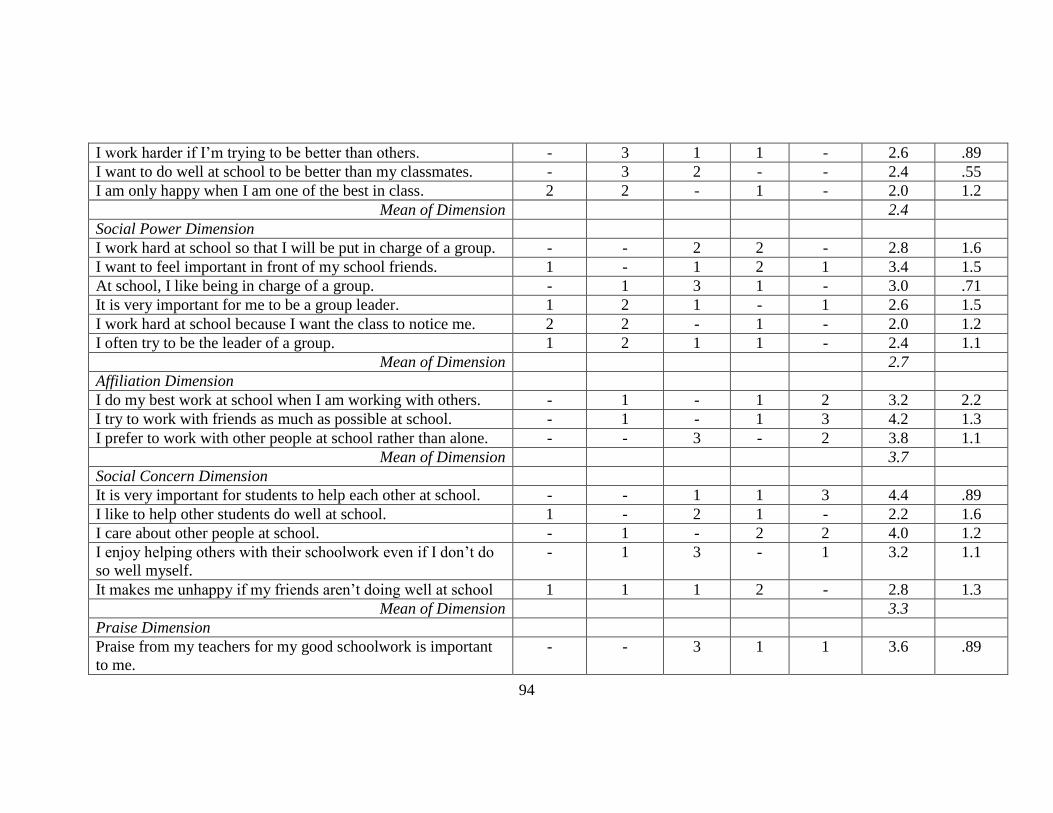
94
I work harder if I’m trying to be better than others. - 3 1 1 - 2.6 .89
I want to do well at school to be better than my classmates. - 3 2 - - 2.4 .55
I am only happy when I am one of the best in class. 2 2 - 1 - 2.0 1.2
Mean of Dimension 2.4
Social Power Dimension
I work hard at school so that I will be put in charge of a group. - - 2 2 - 2.8 1.6
I want to feel important in front of my school friends. 1 - 1 2 1 3.4 1.5
At school, I like being in charge of a group. - 1 3 1 - 3.0 .71
It is very important for me to be a group leader. 1 2 1 - 1 2.6 1.5
I work hard at school because I want the class to notice me. 2 2 - 1 - 2.0 1.2
I often try to be the leader of a group. 1 2 1 1 - 2.4 1.1
Mean of Dimension 2.7
Affiliation Dimension
I do my best work at school when I am working with others. - 1 - 1 2 3.2 2.2
I try to work with friends as much as possible at school. - 1 - 1 3 4.2 1.3
I prefer to work with other people at school rather than alone. - - 3 - 2 3.8 1.1
Mean of Dimension 3.7
Social Concern Dimension
It is very important for students to help each other at school. - - 1 1 3 4.4 .89
I like to help other students do well at school. 1 - 2 1 - 2.2 1.6
I care about other people at school. - 1 - 2 2 4.0 1.2
I enjoy helping others with their schoolwork even if I don’t do
so well myself.
- 1 3 - 1 3.2 1.1
It makes me unhappy if my friends aren’t doing well at school 1 1 1 2 - 2.8 1.3
Mean of Dimension 3.3
Praise Dimension
Praise from my teachers for my good schoolwork is important
to me.
- - 3 1 1 3.6 .89

95
Praise from my friends for good schoolwork is important to me. - 2 2 1 - 2.8 .83
At school, I work best when I am praised. - 2 2 - 5 3.0 1.2
I want to be praised for my good schoolwork. 1 2 1 1 - 2.4 1.1
Praise from my parents for good schoolwork is important to
me.
- 1 2 1 1 2.3 1.3
Mean of Dimension 2.8
Token Dimension
I work best in class when I can get some kind of reward. - 1 2 1 1 3.4 1.1
I work hard in class for rewards from the teacher. - 3 1 - 1 2.8 1.3
I work hard at school for presents from my parents. 1 2 1 - 1 2.6 1.5
Getting a reward for my good schoolwork is important to me. - 3 - 1 1 3.0 1.4
Getting merit certificates helps me work harder at school. - 2 2 - 1 3.0 1.2
Praise for good work is not enough, I like a reward. 1 1 2 - 1 2.8 1.5
If I got rewards at school I would work harder. 1 1 1 1 1 3.0 1.6
Mean of Dimension 2.9

96
Table 16.
Frequency counts and descriptive statistics for Quick and Accurate Readers responses on the ISM.
Item Strongly
Disagree
Disagree Neutral Agree Strongly
Agree
M SD
Task Dimension
I like being given the chance to do something again to make it
better.
- - - 6 1 4.1 .38
I try harder with interesting work. - - - 5 2 4.3 .49
I like to see that I am improving in my schoolwork. - - 2 4 1 3.9 .69
I need to know that I am getting somewhere with my
schoolwork.
- - 3 1 3 4.0 1.0
Mean of Dimension 4.1
Effort Dimension
I don’t mind working a long time at schoolwork that I find
interesting.
- - 1 3 3 4.3 .76
I try hard to make sure that I am good at my schoolwork. - 1 3 3 - 3.3 .76 When I am improving in my schoolwork, I try even harder. - - 5 2 - 3.3 .69
The harder the problem, the harder I try. 1 1 2 2 1 3.1 1.3
I try hard at school because I am interested in my work. - 1 4 2 - 3.1 .69
I work hard to try to understand new things at school. - 3 3 1 - 2.7 .76
I am always trying to do better in my schoolwork. - 1 4 2 - 3.1 .69
Mean of Dimension 3.3
Competition Dimension
Winning is important to me. - 1 3 3 - 3.3 .76
Coming first is very important to me. 1 4 1 1 - 2.3 .95
I like to compete with others at school. - 3 4 - - 2.6 .53

97
I work harder if I’m trying to be better than others. - 1 5 1 - 3.0 .58
I want to do well at school to be better than my classmates. 1 4 2 - - 2.1 .69
I am only happy when I am one of the best in class. 4 1 2 - - 1.7 .95
Mean of Dimension 2.5
Social Power Dimension
I work hard at school so that I will be put in charge of a group. - 2 5 - - 2.7 .49
I want to feel important in front of my school friends. - 2 4 1 - 2.9 .69
At school, I like being in charge of a group. 1 2 4 - - 2.4 .79
It is very important for me to be a group leader. 1 5 1 - - 2.0 .58
I work hard at school because I want the class to notice me. 2 5 - - - 1.7 .49
I often try to be the leader of a group. 2 4 - 1 - 2.0 1.0
Mean of Dimension 2.8
Affiliation Dimension
I do my best work at school when I am working with others. - 2 2 2 1 3.3 1.1
I try to work with friends as much as possible at school. - 1 3 2 1 3.4 .98
I prefer to work with other people at school rather than alone. - 2 2 2 1 3.3 1.1
Mean of Dimension 3.3
Social Concern Dimension
It is very important for students to help each other at school. - - 2 3 2 4.0 .82
I like to help other students do well at school. - 1 3 3 - 3.3 .76
I care about other people at school. - - 1 5 1 4.0 .58
I enjoy helping others with their schoolwork even if I don’t do
so well myself.
1 1 3 2 - 2.9 1.1
It makes me unhappy if my friends aren’t doing well at school 1 2 3 1 - 2.6 .98
Mean of Dimension 3.4
Praise Dimension
Praise from my teachers for my good schoolwork is important
to me.
- 3 1 1 1 2.6 1.6

98
Praise from my friends for good schoolwork is important to me. 1 2 3 1 - 2.6 .98
At school, I work best when I am praised. - 1 5 1 - 3.0 .58
I want to be praised for my good schoolwork. - 1 6 - - 2.9 .38
Praise from my parents for good schoolwork is important to
me.
- - 5 1 1 3.4 .79
Mean of Dimension 2.9
Token Dimension
I work best in class when I can get some kind of reward. 1 2 3 - 1 2.7 1.3
I work hard in class for rewards from the teacher. 1 4 1 1 - 2.3 .95
I work hard at school for presents from my parents. 2 2 2 - 1 2.4 1.4
Getting a reward for my good schoolwork is important to me. - 4 2 1 - 2.6 .79
Getting merit certificates helps me work harder at school. - 3 3 1 - 2.7 .76
Praise for good work is not enough, I like a reward. 2 2 2 - 1 2.4 1.4
If I got rewards at school I would work harder. 1 3 1 1 1 2.7 1.4
Mean of Dimension 2.5

99
Table 17.
Frequency counts and descriptive statistics for Quick Comprehenders responses on the ISM.
Item Strongly
Disagree
Disagree Neutral Agree Strongly
Agree
M SD
Task Dimension
I like being given the chance to do something again to make it
better.
- - 3 5 5 4.2 .80
I try harder with interesting work. - - 4 7 2 3.8 .69
I like to see that I am improving in my schoolwork. 1 - 1 4 7 4.2 1.2
I need to know that I am getting somewhere with my
schoolwork.
- - 4 6 3 3.9 .76
Mean of Dimension 4.0
Effort Dimension
I don’t mind working a long time at schoolwork that I find
interesting.
- 1 5 5 2 3.6 .87
I try hard to make sure that I am good at my schoolwork. - 2 5 4 2 3.5 .97 When I am improving in my schoolwork, I try even harder. - 1 5 4 3 3.7 .95
The harder the problem, the harder I try. 3 1 2 5 2 3.2 1.5
I try hard at school because I am interested in my work. 1 2 5 3 2 3.2 1.2
I work hard to try to understand new things at school. - 2 6 3 2 3.4 .96
I am always trying to do better in my schoolwork. - - 4 8 1 3.8 .60
Mean of Dimension 3.5
Competition Dimension
Winning is important to me. - 2 6 3 1 3.0 1.2
Coming first is very important to me. 1 3 5 4 - 2.9 .95
I like to compete with others at school. 1 4 3 3 2 3.1 1.3

100
I work harder if I’m trying to be better than others. 1 2 4 4 2 3.3 1.2
I want to do well at school to be better than my classmates. - 4 5 4 - 3.0 .82
I am only happy when I am one of the best in class. 5 6 2 - - 1.8 .73
Mean of Dimension 2.8
Social Power Dimension
I work hard at school so that I will be put in charge of a group. - 6 2 4 1 3.0 1.1
I want to feel important in front of my school friends. - 1 5 6 1 3.5 .78
At school, I like being in charge of a group. - 4 4 2 2 2.9 1.4
It is very important for me to be a group leader. 3 4 5 - 1 2.4 1.1
I work hard at school because I want the class to notice me. 2 8 3 - - 2.1 .64
I often try to be the leader of a group. 3 4 4 1 1 1.5 1.2
Mean of Dimension 2.6
Affiliation Dimension
I do my best work at school when I am working with others. - - 2 7 4 4.2 1.1
I try to work with friends as much as possible at school. - 1 1 5 6 4.2 .93
I prefer to work with other people at school rather than alone. - 2 1 4 6 4.1 1.1
Mean of Dimension 4.2
Social Concern Dimension
It is very important for students to help each other at school. - - 3 4 6 4.2 .83
I like to help other students do well at school. - 1 5 4 2 3.3 1.3
I care about other people at school. - - 2 5 5 3.9 1.4
I enjoy helping others with their schoolwork even if I don’t do
so well myself.
- 5 6 2 - 2.8 .73
It makes me unhappy if my friends aren’t doing well at school 3 2 3 3 2 2.9 1.4
Mean of Dimension 3.4
Praise Dimension
Praise from my teachers for my good schoolwork is important
to me.
1 1 5 3 2 3.1 1.4

101
Praise from my friends for good schoolwork is important to me. 1 4 5 2 - 2.5 1.1
At school, I work best when I am praised. 2 1 8 1 - 2.5 1.1
I want to be praised for my good schoolwork. 1 2 5 4 1 3.2 1.1
Praise from my parents for good schoolwork is important to
me.
1 3 4 2 4 3.2 1.3
Mean of Dimension 2.9
Token Dimension
I work best in class when I can get some kind of reward. 3 2 2 2 3 2.8 1.7
I work hard in class for rewards from the teacher. 2 5 1 4 1 2.8 1.3
I work hard at school for presents from my parents. 3 3 4 3 - 2.5 1.1
Getting a reward for my good schoolwork is important to me. 2 4 4 2 1 2.7 1.2
Getting merit certificates helps me work harder at school. 2 3 7 1 - 2.5 .88
Praise for good work is not enough, I like a reward. 5 4 3 - 1 2.1 1.2
If I got rewards at school I would work harder. 3 1 3 4 2 3.1 1.4
Mean of Dimension 2.6

102
Means of responses on ISM dimensions are also presented by profile in Table 18.
A fair amount of similarity across clusters was evident when examining these means of
frequency by profile. Moreover, Figures 6 through 13 display the trends of responses by
profile and dimension See Appendix B. It is interesting to note that, among the
dimensions, only Social Power, Competition, and Token trended toward “Strongly
Disagree,” which indicated that students were not motivated by these factors of
motivation at school. In contrast, all students were more highly motivated on the Task
and Effort dimensions. This was particularly interesting when considering that these
students all struggled with some subskill of reading. Even students who had difficulty
across the subskills demonstrated a relatively high level of motivation.
Table 18.
Means of responses (based on a Likert scale of 1-5) on ISM dimensions by profiles.
Profile Task Effort Competition Social
Power
Affiliation Social
Concern
Praise Token
Quick Word
Callers
4.1 3.5 3.1 2.8 3.7 3.4 3.2 2.9
Lowest
Readers
4.3 3.9 2.0 2.7 3.7 3.3 2.8 2.9
Quick &
Accurate
Readers
4.1 3.3 2.5 2.3 3.3 3.4 2.9 2.5
Quick
Comprehenders
4.0 3.5 2.8 2.6 4.2 3.4 2.9 2.6
Note. Task is defined as interest in schoolwork and desire to increase understanding.
Effort is defined as desire to improve schoolwork.
Competition is defined as whether students cared to engage in any competitive
behaviors in order to learn.
Social power is defined as interest in having or seeking social status.
Affiliation was defined as desiring group membership while completing work.
Social Concern is defined as desire to help others on schoolwork.
Praise is defined as a desire to receive praise and recognition for work.

103
Token is defined as a need to receive tangible items in order to improve
schoolwork.
Values presented here are mean responses across items within each domain, by
profile.
A series of ANOVAs were run in order to test the difference between profiles by
dimension. The number of analyses performed required the use of Tukey’s post hoc
analysis to control for error. If profile membership was related to student level of
motivation on each dimension, then significant difference between groups would be
observed. It was hypothesized that students in the Lowest Readers profile, who struggled
across all subskills of reading, would demonstrate the lowest levels of motivation on each
dimension. No significant differences were found, indicating that profile membership did
not have an impact on level of motivation on each dimension. There was no effect of
profile membership on the Task dimension [F(3, 37) = .21, p=.89]. Effort was not related
to profile membership [F(3, 37) = .58, p=.63]. There was no relationship between
Competition and profile membership [F(3, 37) = .86, p=.47]. On the dimension of Social
Power, there was no relationship with profile membership [F(3, 37) = .94, p=.43]. The
same was true for Affiliation [F(3, 37) = 1.67, p=.19]. In terms of Social Concern, there
was no relationship with profile membership [F(3,37) = .03, p=.99]. There was no
relationship between profile membership and Praise (a desire to receive praise and
recognition for work) [F(3,37) = 1.8, p=.16]. Finally, there was no relationship between
profile membership and Token [F(3, 37) = .44, p= .73].

104
Chapter 5
Discussion
The purpose of the current study was to identify and evaluate profiles of reading
strengths and weaknesses among high school students with reading deficits. Moreover,
the purpose was to evaluate the potential utility for placing students in such profiles, in
order to inform programmatic change. Research questions explored the feasibility of
identifying profiles, strength of group profiles, and comparison of these profiles to those
previously identified in the literature (Buly & Valencia, 2002). Lastly, given that level of
student motivation is highly related to academic achievement, it was necessary to also
explore this construct among this sample of high school students who achieved poorly on
the statewide reading assessment. Analyses yielded four distinct reading profiles that
were significantly different from one another and that each demonstrated stability. At
least two of the profiles identified among the high school sample had similarities to
profiles found in samples of elementary age students. Interestingly, levels of academic
motivation did not vary across groups, despite the varying levels of reading achievement
present.
This study may be framed within the context of problem analysis. Identifying
reading strengths and weaknesses is consistent with identifying “salient characteristics”
of the problem (Christ, 2008); in this study, the identified problem was low reading
achievement. Identifying salient characteristics of low reading achievement was
necessary to identify potential solutions to the problem, such as reading interventions or
differentiated reading instruction. This process is rarely conducted at the high school

105
level (Rubinson, 2002), and limited research in the area of high school reading
assessment and intervention highlights this gap in the literature. Results from this study
begin to address the need to target subskills of reading among high school students.
Summary of Findings
Research Question 1: To what extent can reading skills profiles be identified
at the secondary level? In general, there is limited research on adolescent literacy,
making it difficult for educators to implement evidence-based instruction and
interventions. The current study sought to explore whether collecting reading data from
high school students would result in meaningful reading profiles. Indeed, four profiles of
reading strengths and weaknesses emerged: Quick Word Callers, Lowest Readers, Quick
and Accurate Readers, and Quick Comprehenders. The assessment methodology used in
this study revealed a pattern of strengths and weaknesses that may be useful for
informing instruction and intervention. As such, there was evidence to support the use of
this methodology among high school students who have not performed well on statewide
reading assessments. Therefore, the current study fits well within the problem analysis
context: identifying a pattern of strengths and weaknesses enables the identification of the
cause of the problem, which may enable the educator to develop and implement an
intervention based on that hypothesized cause. In schools, however, the typical practice is
to place all students with deficit reading skills within a homogeneous remedial reading
class, without regard to the specific reason they may need supplemental support in
reading (Alvermann & Rush, 2004; Buly & Valencia, 2002). The problem solving

106
process is ignored in this scenario. As a result, students may not make progress and may
continue to struggle to comprehend technical content in the classroom. Therefore, the
ability to identify reading skills profiles at the secondary level lends support to this
assessment methodology as a means of developing interventions and impacting reading
progress at the high school level.
Research Question 2: What reading strengths and weaknesses are present for
each identified profile? Within the four profiles that emerged from this sample, unique
patterns of reading skills explained the differences among the set of profiles. The Quick
Word Callers demonstrated relative strengths in lower level skills (phonics and fluency),
but relative weaknesses in vocabulary and comprehension. The Lowest Readers were low
across all subskills, with a relative weakness in phonics. In contrast, the Quick and
Accurate Readers demonstrated the highest level of achievement across each of the
subskills. Their relative areas of strengths were in phonics and fluency. Lastly, the Quick
Comprehenders were unique in that they exhibited strengths in the areas of fluency and
comprehension, while phonics and vocabulary were relative weaknesses.
The importance of identifying strengths and weaknesses can be considered within
the contexts of reading acquisition and problem analysis. To begin, if a student is
struggling with phonics, the lowest subskill examined in the current study, he or she is
probably having difficulty decoding multi-syllabic words (Archer et al., 2003; Curtis,
2004; NIL, 2007), and it would be challenging to overcome difficulties with word
identification in order to engage in higher level comprehension. A student who is

107
struggling with fluency and using too many cognitive resources (LaBerge & Samuels,
1974), will not comprehend much of the information presented. Vocabulary is
particularly relevant to high school students who struggle with reading, even more so
than elementary age students. At the high school level, textbooks usually include
‘jargon,’ or technical vocabulary; if a student has difficulty decoding unfamiliar words or
using context clues to understand word meaning, textbook comprehension will be
difficult (Harmon et al., 2005). Without the ability to identify challenging words that are
technical and directly related to the concept, the reader may find it difficult to draw the
higher level conclusions that are necessary to fully grasp a new concept. Each student in
this sample struggled with comprehension, even those in the Quick and Accurate Readers
and Quick Comprehenders groups who demonstrated a relative strength in
comprehension. An individual who displays comprehension difficulties is probably
disengaged from the text and likely has limited background information (Dole et al.,
1991; Taylor & Ysseldyke, 2007). These students may lack the strategies necessary to
extract information from the text, and they do not self-monitor these strategies (Dole et
al., 1991; Nokes & Dole, 2004; NRP, 2000; Rapp et al., 2007). For the students in this
sample, regardless of the profile in which they were placed, reading is likely to be
laborious, and, in the end, limited information may be acquired.
The strengths and weaknesses present for students in each profile may have a
direct impact on comprehension of new information. Moreover, reading success and
further progress in reading acquisition itself may be impacted; successful reading requires
top down and bottom up processing (Hoover & Gough, 1991). That is, for the successful

108
reader, subskills build upon and support one another to raise each one up to higher levels
(Afflerbach, 2004; Ehri, 2005). For the reader who is less successful, there is limited
opportunity for skills to build upon one another, resulting in lower reading achievement.
Although each of the students in this sample had relative subskill strengths, each
student’s overall level of performance made it difficult for them to obtain high levels of
reading achievement. Comprehension is the ultimate goal of reading; without adequate
skill levels, or progress toward adequate skill levels, comprehension may not be achieved
at the level necessary to be successful in high school reading activities. This research
highlights the need for educators to engage in problem analysis at this level in order to
better inform instruction, regardless of the specific profiles identified. Without specific
information regarding students’ weaknesses, it is impossible to develop instruction that
will lead to progress in reading skills.
Research Question 3: To what extent are reading profiles for secondary
students similar to those of elementary students, as determined by Buly and
Valencia (2002)? In part, the current study sought to extend the findings of reading
profiles at the elementary level to a new population: high school students who
demonstrated low reading achievement. The four reading profiles identified in the current
study were compared to Buly and Valencia’s (2002) six unique reading profiles, yielding
some overlap. Reading profiles for high school students had some overlap with profiles
identified for elementary age students, but unique profiles were also found. In addition to
direct comparisons made between the elementary and secondary profiles, one profile

109
identified in this study may be a combination of two of the elementary profiles. The
Quick Word Callers readers may fall under “Automatic Word Callers” and “Struggling
Word Callers” (Buly & Valencia, 2002). The “Automatic Word Callers” had a relative
strength in word identification and an overall weakness in comprehension; “Struggling
Word Callers” in the elementary study were stronger in phonics and fluency than in
comprehension, but still encountered difficulties with phonics. High school students
placed within the Quick Word Callers profile were indeed stronger in phonics and
fluency than in vocabulary and comprehension, but their overall reading achievement
suggested they still struggled with phonics. The small sample size may have impacted the
presence of combined profiles; perhaps with more subjects, more profiles would have
been identified. The combined profiles might also be a result of compounded reading
difficulties over time. As the subskills are interrelated and limited progress had been
made within each subskill, the growth of the other subskills may be impacted. Students
struggled on all subskills, rather than just one or two in particular. The existence of
unique profiles between the grade levels (elementary and high school) may provide
further evidence that high school students face different reading challenges than students
in elementary schools (Edmonds et al., 2009). This also indicated a need for developing
interventions that are specific to the secondary level, as previous evidence suggested that
high school students do not respond to interventions that are typically effective for
elementary age students (Edmonds et al., 2009). Again, the need for identifying the
salient characteristics of the problem, in order to best devise interventions, was
highlighted (Christ, 2008).

110
Research Question 4: To what extent can subskill strengths and weaknesses
within each profile be used to develop targeted interventions? This research question
has a direct link to problem analysis because intervention or differentiated instruction is
based on identifying the salient characteristics of the problem (Christ, 2008; Rapp et al.,
2007). There was some evidence of significant differences between groups on each
subskill, although there were also non-significant differences. For instance, there was a
significant difference between skill level on phonics between the Quick and Accurate
readers, the Lowest Readers, and the Highest Readers; there was no significant difference
on skill level of phonics between the Quick Word Callers and the Quick Comprehenders.
These differences may lend to the development of a targeted phonics intervention (based
on level of phonics skill) specific to each profile. The same may be done based on each
subskill.
Research Question 5: To what extent will profile stability be related to group
or individual deficits? It was hypothesized that profile characteristics would be robust
enough to match individual student’s characteristics, which indicates limited variability
among students within one profile. Results from this study indicated that profile stability
was based on individual student characteristics. This means that a student who was
assigned to the Quick Word Callers profile is likely to respond to the same type of
intervention given to the other students in that profile, which indicated that these students
may benefit from similar interventions that could be delivered in small groups. The

111
practitioner could be confident that the same intervention delivered to the small group (all
previously assigned to the same profile) would affect progress for most students in the
group. This implicated application to the problem solving model as well. Increasing the
feasibility of small group interventions to meet the individual needs of students is
imperative at the high school level, although it may not be pursued very often in practice.
Research Question 6: Does student level of motivation vary based on his/her
reading skills profile? Student level of motivation was also examined, and it was
hypothesized that students in the lowest performing profile (Lowest Readers) would
indicate the lowest level of motivation. Results did not confirm the hypothesis. In fact,
there were no differences in level of motivation across all dimensions and across all
groups. All students responded positively on the dimensions of Task and Effort, which
indicated an orientation toward mastery goals (Ames & Archer, 1988; Anderman et al.,
2001; Meece et al., 2006; Meece et al., 1988). Even students in the Lowest Readers
profile, who demonstrated low achievement across all subskills, indicated that they were
motivated to increase their learning and did not mind putting effort into their work.
Students across the sample responded low on items that fell under the Competition,
Praise, or Token dimensions. For instance, one Competition domain item stated, “I work
harder if I’m trying to be better than others.” It is possible that since these students have
struggled in the classroom, they are uncomfortable with competing with classmates who
might be higher achievers than themselves. This may also indicate that these students
align with performance-avoidance goal orientation (Meece et al., 2006). Interestingly,

112
most students responded either “Disagree” or “Strongly Disagree” to items that indicated
a need for praise for schoolwork or rewards for schoolwork (on the Praise and Token
dimensions). These factors were not endorsed as important to students in the sample. The
age of students within the sample should be considered within this context; during
adolescence, students have built an identity based on past experiences (e.g., continued
school failure) and are motivated by opportunities for autonomy (Foorman et al, 2004;
Covington & Dray, 2001; Ryan & Deci, 2009; Ryan & Deci, 2000; Deci et al., 1991).
These experiences may impact students’ choice of goal orientation to which they adhere.
Moreover, because these students are reading at levels lower than is expected for high
school students, some level of choice in reading may be taken away, again contributing to
diminished feelings of autonomy (Ryan & Deci, 2009; Ryan & Deci, 2000; Deci et al.,
1991). In addition, these students are aware that they are not high achieving readers,
which contributes to diminished feelings of competency (Ryan & Deci, 2009; Ryan &
Deci, 2000; Deci et al., 1991). Overall, levels of motivation did not vary across reading
profiles, possibly because they were all low readers or possibly due to the characteristics
of the sample (e.g., developmental age).
Implications
Overall, this study provided evidence for the ability to assess basic reading skills,
and then to identify strengths and weaknesses in reading among high school students.
Results demonstrated the need to improve the link between assessment and intervention
for this population. By assessing specific reading skills, there may be potential to identify

113
targeted and intensive reading interventions that are effective for high school students.
As reflected in the summary of findings, this study has implications for problem
analysis within this population. The same process must be followed for high school
students as is typically in place for elementary-aged students. Data must be collected in
order to determine the greatest area of need, rather than placing a student within a
remedial class that addresses struggling readers in general. The same data-based decision
making must occur. Without the implementation of these best practices, there are many
students who will make little academic progress. There is also a need to change high
school teacher perceptions and expectations of students in their classrooms. Teachers
cannot continue to rely on high levels of comprehension for all students. Instead, they
must be aware of the need for support at more basic levels in order to bring students
through the problem solving process within the structures already in place at the school.
Limitations
The primary limitation of this study was the sample size. The investigator
attempted to work with 60 students, however, data from only 43 students was used in the
analysis. High school students were a difficult population to work with because they had
more independence than younger students and were more likely to opt out of study
participation. They were also more difficult to work with because of their schedules and
heavy workloads. Also, because this sample included students who fell below the 25th
percentile on the MCA-II and likely found reading to be a challenging task, it was
difficult to motivate them to participate. Furthermore, there were some students who may

114
qualify as students with LEP in the sample, despite requests to high school administrators
to exclude them. This had a direct impact on the sample size because subjects and data
had to be eliminated. A larger sample size might have born out more than four profiles,
and perhaps profiles that were more specific. Similarly, students in the current sample
were somewhat homogeneous (suburban and rural Midwestern high schools). A greater
variation in the characteristics of each profile and a greater number of profiles might arise
if a different population of students were included. Finally, there was limited background
information collected due to constraints of working within an unfamiliar school system.
This limited the investigator’s ability to expand qualitatively on the identified profiles.
The assessment methodology, despite yielding encouraging results, was quite
time consuming. Outside of the realm of a research study, school staff must be trained on
the assessment tools used, limiting the number of people who can implement the same
methodology. If a time-intensive methodology were included in the schools, it would be
helpful to know that it would result in positive outcomes for students. However, given
that this was only a study of assessment, there was no capacity in determining
intervention responsiveness. This may be a limitation of the study and methodology;
however, there was still promise and apparent utility in this approach.
In addition to time restraints, the assessments administered may not have tapped
into the four reading subskills as expected. For instance, scores on the Phonemic
Decoding Efficiency subtest on the TOWRE did not fit the model well when the CFA
was conducted. The purpose of this subtest was to tap into fluency skills, but unfamiliar
letter combinations and words appeared to inhibit fluency, and this subtest did not load

115
onto the latent construct of reading achievement. As another example, the Passage
Comprehension subtest on the WJ-III Achievement test may not be similar to the
comprehension tasks or demands of the regular classroom. In some cases, this may have
been an overestimation of comprehension skill for some students because students were
only asked to provide one word to fill in a blank in a very short passage; the subtest
requires limited inferential and evaluative analysis. Lastly, an eighth grade CBM-R probe
was used in this study. There were no standardized CBM-R probes for the high school
level. This may have been an overestimation of fluency skill for some students, as this
was a lower level of reading than students were typically required to engage in in the
classroom. Across all four profiles, fluency was a strength, which again may indicate an
overestimation of this subskill. Moreover, there was no population mean for these
reading probes, as it was administered to a population other than was intended. Creating a
sample specific "population" mean may have skewed some results.
Results of the motivation survey were surprising: there was no variation across
profiles on level of motivation for school. These results might have been more
meaningful if this survey was collected for a matched sample of high achieving readers.
Without a comparison group, it was difficult to determine if these responses were typical
of all high school students, or just of high school students with reading deficits. With
regard to the motivation instrument chosen for the study, it did not address the
psychological needs of adolescence (i.e., autonomy, competence, and belonging; Ryan &
Deci, 2009; Ryan & Deci, 2000; Deci et al., 1991). The chosen tool (ISM) might have
disregarded the developmental stage of the sample, which is another limitation.

116
The last limitation to consider is the subskills of vocabulary and comprehension.
In some literature, the two subskills were combined because they were difficult to parse
apart. Given that there were individual subtests for each subskill, the investigator chose to
treat them as separate entities. Characteristics of profiles may have been different had
these subskills been combined. It may have also been appropriate to combine these
subskills because of the nature of the assessments administered. It is difficult to develop a
test of vocabulary without having the influence of the test of comprehension (and vice
versa). For instance, the Vocabulary subtest on the GMRT-4th Edition provided a phrase
with an underlined word, and students were to determine the best synonym for the
underlined word. Comprehension of the stem phrase may have impacted student
response, whereas giving a student a word and asking for its synonym may be a more
explicit measure of vocabulary.
Future Directions and Conclusions
Future research should seek to replicate and extend these findings. A few recently
published studies (Brausseur-Hock et al., 2011; Hock et al., 2009; Lesaux & Kieffer,
2010) investigated profiles of struggling readers at the middle and high school levels and
provided the context for the current study. There was some similarity in profiles between
the current study and those identified by Brausseur-Hock et al. (2011), but they did not
converge completely and were not generalizable beyond the sample (Brausseur-Hock et
al., 2011). The current study utilized a similar methodology, and both implicated the need
to further assess adolescents’ reading strengths and weaknesses. Based on the limitation

117
that this was a time intensive process, future research could focus on gathering the same
data with the intent of identifying profiles, but using more efficient tests or screeners.
Similarly, different assessments could be used in the future that would tap into some
constructs more appropriately. A pilot study would be necessary to determine what the
most informative assessments would be for students at the high school level.
This study identified profiles at the high school level, and there was some overlap
with previously identified elementary reading profiles. Despite this overlap in profiles,
there was no evidence for determining whether there was a true persistence of reading
difficulties across grade levels. Future research could include a longitudinal study in
which struggling readers are followed through high school, in order to identify whether
there is a persistence of reading challenges across the grade levels. Results from this type
of study may add to the gap in the literature regarding adolescent reading acquisition.
The assessment methodology used in this study may represent the type of research
necessary to provide a link to intervention that is sought in the literature, but it did not
provide specific evidence for determining whether the profiles would result in an skills-
by-treatment-interaction (STI) or a differential response to interventions. This
comprehensive collection of reading data, whereby the primary deficit skill was
identified, may be necessary, but not sufficient, in order to improve interventions. To
advance research and students’ achievement, educators must have access to evidence-
based practices for secondary students who are not proficient readers. Therefore, a series
of intervention studies for high school students would serve educators well. Small group
interventions that are based on characteristics of each profile provided in the current

118
study must be designed and tested. Moreover, once evidence-based practices are
developed, researchers must ensure that these interventions generalize outside of specific
intervention sessions so that secondary students succeed in the classroom (Edmonds et
al., 2009). In general, there is still a great need for increased research productivity at the
secondary level.
Although results of the motivation survey did not confirm the proposed
hypothesis, the area of motivation should still be examined among this population and
within the context of struggling readers. Perhaps the shortcomings of the motivation
instrument impacted these findings. As such, future research should seek an instrument of
motivation that adequately addresses the psychological needs of students and takes
particular consideration of the developmental age of the students (Ryan & Deci, 2000;
Deci et al., 1991). Adolescents can reflect upon their feelings of competence and
autonomy, and this would be interesting to learn about within a sample of students who
may have a lower sense of self-efficacy.
Finally, research may expand into secondary education preparation programs.
Many teachers admittedly have limited training in explicit reading instruction if they are
receiving a certificate for teaching at the high school level. In order to increase the impact
of the current findings, teachers must be aware that not all of their students come to their
classroom with the higher level skills necessary to comprehend texts, or they may not
have a toolbox of comprehension strategies that are necessary to decompose texts. It is
not realistic to suggest that teachers should all receive training in determining what

119
reading skills students may be missing, but it is feasible to spread awareness of the levels
of difficulty many students face.
The current study provided one approach for identifying reading strengths and
weaknesses within the problem analysis framework, with the intent of informing
intervention development in future research. Regardless of the approach or methodology
used, it is clear that a stronger link between assessment and intervention must be
established for secondary students who experience a breakdown in comprehension (NIL,
2007; Pressley, 2004). The current study served as such an approach to solving this
problem. There is indeed ample need and opportunity to work with this population to
improve literacy and to improve their own post-secondary opportunities (Pressley, 2004).
Emphasizing skills-based and comprehensive assessments at this level is imperative for
more effective problem analysis, and in turn, for student progress and success.

120
References
Afflerbach, P. (2004). Assessing adolescent literacy. In T.L. Jetton & J.A. Dole (Eds.).
Adolescent literacy research and practice (pp. 369-391). New York: Guilford
Press.
Albright, J. J. (2008). Confirmatory factor analysis using Amos, Lisrel, and Mplus.
Retrieved from http://www.indiana.edu/~statmath on 1/5/12.
Aldenderfer, M. S. & Blashfield, R. K. (1984). Cluster analysis. Newbury Park, CA:
Sage Publications.
Alonzo, J., Basaraba, D., Tindal, G., & Carriveau, R. S. (2009). They read, but how well
do they understand? An empirical look at the nuances of measuring reading
comprehension. Assessment for Effective Intervention, 35(1), 34-44.
Alvermann, D. E. (2002). Effective literacy instruction for adolescents. Paper
commissioned by the National Reading Conference. Retrieved from
http://www.nrconline.org/publications/alverwhite2.pdf on November 22, 2009.
Alvermann, D. E., & Rush, L. S. (2004). Literacy intervention programs at the middle
and high school levels. In T. L. Jetton & J. A. Dole (Eds.), Adolescent literacy
research and practice (pp. 210-227). New York: Guilford Press.
Ames, C. & Archer, J. (1988). Achievement goals in the classroom: students’ learning
strategies and motivation processes. Journal of Educational Psychology, 80(3),
260-267.
Archer, A. L., Gleason, M. M., & Vachon, V. L. (2003). Decoding and fluency:
Foundation skills for struggling older readers. Learning Disability Quarterly, 26,
89-101.
Baker, S. K., Simmons, D. C., & Kamee’nui, E. J. (1998). Prepared by the National
Center to Improve the Tools of Educators. Vocabulary acquisition: Synthesis of
the research. Washington, DC: Office of Special Education Programs.
Ball, E. W., & Blachman, B. A. (1991). Does phoneme awareness training in
kindergarten make difference in early word recognition and developmental
spelling? Reading Research Quarterly, 26(1), 49-66.
Bentin, S. & Leshem, H. (1993). On the interaction between phonological awareness and
reading acquisition: It’s like a two-way street. Annals of Dyslexia, 43, 125-148.
Bhat, P. B., Griffin, C. C., & Sindelar, P. T. (2003). Phonological awareness instruction
for middle school students with learning disabilities. Learning Disability
Quarterly, 26, 73-87.
Bhattacharya, A., & Ehri, L. C. (2004). Graphosyllabic analysis helps adolescent
struggling readers read and spell words. Journal of Learning Disabilities, 37(4),
331-348.
Blanton, W. E., Wood, K. D., & Taylor, D. B. (2007). Rethinking middle school reading
instruction: A basic literacy activity. Reading Psychology, 28, 75-95.
Borgin, F. H., & Barnett, D. C. (1987). Applying cluster analysis in counseling
psychology research. Journal of Counseling Psychology, 34(4), 456-468.

121
Boyle, E. A., Rosenberg, M. S., Connelly, V. J., Washburn, S. G., Brinckerhoff, L. C., &
Banerjee, M. (2003). Effects of audio texts on the acquisition of secondary-level
content by students with mild disabilities. Learning Disability Quarterly, 26, 203-
214.
Brasseur-Hock, I. F., Hock, M. F., Kieffer, M. J., Biancarosa, G., & Deshler, D. D.
(2011). Adolescent struggling readers in urban schools: Results of a latent class
analysis. Learning and Individual Differences, 21, 438-452.
Brophy, J. (2004). Motivating students to learn. New York, NY: Routledge.
Brown, T. A. (2006). Confirmatory factor analysis for applied research. New York, NY:
Guilford.
Buly, M. R., & Valencia, S. W. (2002). Below the bar: Profiles of students who fail state
reading assessments. Educational Evaluation and Policy Analysis, 24(3), 219-
239.
Buly, M. R., & Valencia, S. W. (2003). Meeting the needs of failing readers: Cautions
and considerations for state policy, an occasional paper.
Buly, M. R., & Valencia, S.W. (2005). Behind test scores: What struggling readers really
need. The Reading Teacher, 57(6), 520-531.
Burns, M. K., & Gibbons, K. A. (2008). Implementing response-to-intervention in
elementary and secondary schools. New York, NY: Routledge.
Burns, M. K., Tucker, J. A., Hauser, A., Thelen, R. L., Holmes, K. L., & White, K.
(2002). Minimum reading fluency rate necessary for comprehension: A potential
criterion for curriculum-based assessments. Assessment for Effective Intervention,
28(1), 1-7.
Chall, J. S. (1983). Literacy: Trends and explanations. Educational Researcher, 12(9), 3-
8.
Christ, T. J. (2008). Problem Analysis. In A. Thomas & J. Grimes (Eds). Best practices in
school psychology, 5th
edition (pp. 159-176). Bethesda, MD: National Association
of School Psychologists.
Christ, T. J., & Ardoin, S. P. (2008). Curriculum-based measurement of oral reading:
Passage equivalence and probe-set development. Journal of School Psychology,
47, 55-75.
Christ, T. J., & Coolong-Chaffin, M. (2007). Interpretations of curriculum-based
measurement outcomes: Standard error and confidence intervals. School
Psychology Forum, 1, 75-86.
Christ, T. J., & Silberglitt, B. (2007). Estimates of the standard error of measurement for
curriculum-based measures of oral reading fluency. School Psychology Review,
36(1), 130-146.
Cronbach, L. J. (1957). The two disciplines of scientific psychology. American
Psychologist, 12, 671-684.
Cronbach, L. J., & Snow, R. E. (1977). Aptitudes and instructional methods: A handbook
for research on interactions. New York, NY: Irving Publishers, Inc.

122
Curtis, M. E. (2004). Adolescents who struggle with word identification: Research and
practice. In T.L. Jetton & J.A. Dole (Eds.). Adolescent literacy research and
practice (pp. 119-134). New York: Guilford Press.
Cutting, L. E., & Scarborough, H. S. (2006). Prediction of reading comprehension:
Relative contributions of word recognition, language proficiency, and other
cognitive skills can depend on how comprehension is measured. Scientific Studies
of Reading, 10(3), 277-299.
Daly, E. J., Martens, B. K., Witt, J. C., & Dool, E. J. (1997). A model for conducting a
functional analysis of academic performance problems. School Psychology
Review, 26(4), 554-574.
Daniel, M. H. (2010). Reliability of AIMSweb reading curriculum-based measurement
(R-CBM) (Oral reading fluency). Bloomington, MN: NCS Pearson, Inc.
Deci, E. L., Vallerand, R. J., Pelletier, L. G., & Ryan, R. M. (1991). Motivation and
education: The self-determination perspective. Educational Psychologist,
26(3&4), 325-346.
Deno, S. L. (1986). Formative evaluation of individual student programs: A new role for
school psychologists. School Psychology Review, 15(3), 358-374.
Deno, S. L. (2005). Problem solving assessment. In R. Brown-Chidsey (Ed.). Assessment
for intervention: A problem-solving approach. New York, NY: Guilford.
Deno, S. L., Fuchs, L. S., Marston, D., & Shin, J. (2001). Using curriculum-based
measurement to establish growth standards for students with learning disabilities.
School Psychology Review, 30(4), 507-524.
Denti, L. (2004). Introduction: Pointing the way: Teaching reading to struggling readers
at the secondary level. Reading & Writing Quarterly, 20, 103-112.
Denti, L., & Guerin, G. (2004). Confronting the problem of poor literacy: Recognition
and action. Reading & Writing Quarterly, 20, 113-122.
Department of Education. Institute of Education Sciences. National Center for Education
Statistics. (2009). National Association for Educational Progress (NAEP). The
nation’s report card: Long-term trend. Washington, DC: U.S. Government
Printing Office.
Department of Education. Institute of Education Sciences. National Institute on Literacy.
(2007). What content area teachers should know about adolescent literacy.
Washington, DC: U.S. Government Printing Office.
Department of Education. Institute of Education Sciences. (2008). Improving adolescent
literacy: Effective classroom and intervention practices (IES practice guide).
Retrieved on May 3, 2010, from
http://ies.ed.gov/ncee/wwc/pdf/practiceguides/adlit_pg_082608.pdf.
Deschler, D. D., Schumaker, J. B., Lenz, B. K., Bulgren, J. A., Hock, M. F., Knight, J., &
Ehren, B.J. (2001). Ensuring content-area learning by secondary students with
learning disabilities. Learning Disabilities Research & Practice, 16(2), 96-108.
Dole, J. A., Duffy, G. G., Roehler, L. R., & Pearson, P. D. (1991). Moving from the old
to the new: Research on reading comprehension instruction. Review of
Educational Research, 61(2), 239-264.

123
Douglass, J. E., & Guthrie, J. T. (2008). Meaning is Motivating. In J.T. Guthrie (Ed.)
Engaging adolescents in reading. Thousand Oaks, CA: Corwin Press.
Edmonds, M. S., Vaughn, S., Wexler, J., Reutebuch, C., Cable, A., Tackett, K. K.,
Schnakenberg, J.W. (2009). A synthesis of reading interventions and effects on
reading comprehension outcomes for older struggling readers. Review of
Educational Research, 79(1), 262-300.
Ehri, L. C. (2005). Learning to read words: Theory, findings, and issues. Scientific
Studies of Reading, 9(2), 167-188.
Ehri, L. C., & Wilce, L.S. (1987). Cipher versus cue reading: An experiment in decoding
acquisition. Journal of Educational Psychology, 79(1), 3-13.
Everitt, B. S., Landau, S., Leese, M., & Stahl, D. (2011). Cluster analysis, 5th
Edition.
West Sussex, United Kingdom: John Wiley & Sons.
Fang, Z. (2008). Beyond the fab five: Helping students cope with the unique linguistic
challenges of expository reading in intermediate grades. International Reading
Association, 478-487.
Foorman, B. R., Francis, D. J., Fletcher, J. M., Schatschneider, C., & Mehta, P. (1998).
The role of instruction in learning to read: Preventing reading failure in at-risk
children. Journal of Educational Psychology, 90(1), 37-55.
Fuchs, L. S., Fuchs, D., & Compton, D. L. (2010). Rethinking response to intervention at
middle and high school. School Psychology Review, 39(1), 22-28.
Garson, G. D. (2012). “Cluster Analysis”, from Statnotes: Topics in multivariate
analysis. Retrieved 12-30-11 from
http://faculty.chass.ncsu.edu/garson/PA765/statnote.htm
Guthrie, J. T. (2008). Reading motivation and engagement in middle and high school. In
J.T. Guthrie (Ed.) Engaging Adolescents in reading. Thousand Oaks, CA: Corwin
Press.
Harmon, J. M., Hedrick, W. B., & Wood, K. D. (2005). Research on vocabulary
instruction in the content areas: Implications for struggling readers. Reading &
Writing Quarterly, 21, 261-280.
Harrington, D. (2009). Confirmatory factor analysis: Picket guide to social work
research methods. New York, New York: Oxford University Press.
Hart, B., & Risley, T. R. (1995). Meaningful differences in the everyday experience of
young American children. Baltimore: Paul H. Brookes.
Hasselbring, T. S., & Goin, L. I. (2004). Literacy instruction for older struggling readers:
What is the role of technology? . Reading & Writing Quarterly, 20, 123-144.
Hawkins, R. O., Hale, A. D., Sheeley, W., & Ling, S. (2011). Repeated reading and
vocabulary-previewing intervention to improve fluency and comprehension for
struggling high-school readers. Psychology in the Schools, 48(1), 59-77.
Hock, M. F., Brasseur, I. F., Deshler, D. D., Catts, H. W., Marquis, J. G., Mark, C. A., &
Wu Stribling, J. (2009). What is the reading component skill profile of adolescent
struggling readers in urban schools? Learning Disability Quarterly, 32, 21-38.
Hoover, W. A., & Gough, P. B. (1990). The simple view of reading. Reading and
Writing, 2(2), 127-160.

124
Howe, K. B., & Shinn, M. M. (2002). Standard reading assessment passages for use in
general outcome measurement: A manual describing development and technical
features. Eden Prairie, MN: Edformation.
Howell, D. C. (2002). Statistical methods for psychology, 5th
Edition. Pacific Grove, CA:
Duxbury.
Hu, L., & Bentler, P. M. (1999). Cutoff criteria for fit indexes in covariance structure
analysis:Conventional criteria versus new alternatives. Structural Equation
Modeling, 6(1), 1-55.
Ivey, S. J., & Guthrie, J.T. (2008). Struggling readers: boosting motivation in low
achievers. In J.T. Guthrie (Ed.) Engaging Adolescents in reading. Thousand Oaks,
CA: Corwin Press.
Jitendra, A. K., Edwards, L. L., Sacks, G., & Jacobson, L. A. (2004). What research says
about vocabulary instruction for students with learning disabilities. Exceptional
Children, 70(3).
Jitendra, A. K., Hoppes, M. K., & Xin, Y. P. (2000). Enhancing main idea
comprehension for students with learning problems: The role of a summarization
strategy and self-monitoring instruction. Journal of Special Education, 34(3),
127-139.
Johnston, A. M., Barnes, M. A., & Desrochers, A. (2008). Reading comprehension:
Developmental processes, individual differences, and interventions. Canadian
Psychology, 49(2), 125-132.
Juel, C. (1988). Learning to read and write: A longitudinal study of 54 children from first
through fourth grades. Journal of Educational Psychology, 80(4), 437-447.
Juel, C., Griffith, P. L., & Gough, P. B. (1986). Acquisition of literacy: A longitudinal
study of children in first and second grade. Journal of Educational Psychology,
78(4), 243-255.
Kamil, M. L., Mosenthal, P. B., Pearson, P. D., & Barr, R. (2000). Handbook of reading
research: Volume III. Mahwah, New Jersey: Lawrence Erlbaum Associates,
Publishers.
LaBerge, D., & Samuels, S. J. (1974). Towards a theory of automatic information
processing in reading. Cognitive Psychology, 6, 293-323.
Lesaux, N. K. & Kieffer, M. J. (2010). Exploring sources of reading comprehension
difficulties among language minority learners and their classmates in early
adolescence. American Educational Research Journal, 47(3), 596-632.
Lorr, M. (1983). Cluster analysis for social scientists. San Francisco, CA: Jossey Bass.
Lovett, M. W., Lacerenza, L. De Palma, M., Benson, N. J., Steinbach, K. A., & Frijters,
J. C. (2008). Preparing teachers to remediate reading disabilities in high school:
What is needed for effective professional development? Teaching and Teacher
Education, 24, 1083-1097.
Lovett, M. W., & Steinbach, K. A. (1997). The effectiveness of remedial programs for
reading disabled children of different ages: Does the benefit decrease for older
children? Learning Disability Quarterly, 20(3), 189-210.

125
Maria, K., & Hughes, K. E. (2006). Technical report supplement: Forms S and T, 2005-
2006 renorming, print and online equating. Rolling Meadows, IL: Riverside
Publishing
Mastropieri, M. A., Scruggs, T. E., & Mushinski Fulk, B. J. (1990). Teaching abstract
vocabulary with the keyword method: Effects on recall and comprehension.
Journal of Learning Disabilities, 23, 92-97.
Mather, N., & Woodcock, R. W. (2001). Test administration and owner’s manual. Itasca,
IL: Riverside Publishing.
McInerney, D. M. & Ali, J. (2006). Multidimensional and hierarchical assessment of
school motivation: Cross-cultural validation. Educational Psychology, 26(6), 717-
734.
McInerney, D. M., Roche, L. A., McInerney, V., & Marsh, H. W. (1997). Cultural
perspectives on school motivation. American Educational Research Journal, 34,
207-236.
Meece, J. L., Blumenfield, P. C., & Hoyle, R. H. (1988). Students’ goal orientations and
cognitive engagement in classroom activities. Journal of Educational Psychology,
80(4), 514-523.
Mercer, C. D., Campbell, K. U., Miller, M. D., Mercer, K. D., & Lane, H. B. (2000).
Effects of a reading fluency intervention for middle schoolers with specific
learning disabilities. Learning Disabilities Research & Practice, 15(4), 179-189.
Moats, L. (2004). Efficacy of a structured, systematic language curriculum for adolescent
poor readers. Reading & Writing Quarterly, 20, 145-159.
National Institute of Child Health and Human Development. (2000). Report of the
national reading panel. Teaching children to read: An evidence-based assessment
of the scientific research literature on reading and its implications for reading
instruction (NIH Publication No. 00-4769). Washington, DC: U.S. Government
Printing Office.
Nichols, W. D., Young, C. A., & Rickelman, R. J. (2007). Improving middle school
professional development by examining middle school teachers’ application of
literacy strategies and instructional design. Reading Psychology, 28, 97-130.
Nokes, J. D., & Dole, J. A. (2004). Helping adolescent readers through explicit strategy
instruction. In T.L. Jetton & J.A. Dole (Eds.). Adolescent literacy research and
practice (pp. 162-182). New York: Guilford Press.
O’Brien, D., Beach, R., & Scharber, C. (2007). “Struggling” middle schoolers:
Engagement and literate competence in a reading writing intervention class.
Reading Psychology, 28, 51-73.
Pressley, M. (1998). Reading instruction that works. New York: The Guilford Press.
Pressley, M., & Wharton-McDonald, R. (1997). Skilled comprehension and its
development through instruction. School Psychology Review, 26(3), 448-466.
Rapp, D. N., van den Broek, P., McMaster, K. L., Kendeou, P., & Espin, C. A. (2007).
Higher-order comprehension processes in struggling readers: A perspective for
research and intervention. Scientific Studies of Reading, 11(4), 289-312.

126
Rasinski, T. V., Padak, N. D., McKeon, C. A., Wilfong, L. G., Friedauer, J. A., & Heim,
P. (2005). Is reading fluency a key for success in high school reading?
International Reading Association, 22-27.
Reschly, D. J., & Ysseldyke, J. E. (2002). Paradigm shift: The past is not the future. In A.
Thomas & J. Grimes (Eds.). Best practices in school psychology, 4th
edition.
Bethesda, MD: National Association of School Psychologists.
Rhodes, R. L., Ochoa, S. H., & Ortiz, S. O. (2005). Assessing Culturally and
Linguistically Diverse Students: A Practical Guide. New York, NY: The Guilford
Press.
Roberts, J. K. (1999, January). Basic concepts of confirmatory factor analysis. Paper
presented at the Annual Meeting of the Southwest Educational Research
Association, San Antonio, TX.
Rubinson, F. (2002). Lessons learned from implementing the problem-solving model in
urban high schools. Journal of Educational and Psychological Consultation,
13(3), 185-217.
Ryan, R. M., & Deci, E. L. (2000). Self-determination theory and the facilitation of
intrinsic motivation, social development, and well-being. American Psychologist,
55(55)1, 68-78.
Ryan, R. M. & Deci, E. L. (2009). Promoting self-determined school engagement:
Motivation, learning, and well-being. In K. R. Wenzel and A. Wigfield (Eds.).
Handbook of motivation at school. New York, NY: Routledge/Taylor & Francis
Group.
Saenz, L. M., & Fuchs, L. S. (2002). Examining the reading difficulty of secondary
students with learning disabilities: Expository versus narrative text. Remedial and
Special Education, 23(1), 31-41.
Snow, C. E., Burns, M. S., & Griffin, P. (1998). Preventing reading difficulties in young
children. Washington, DC: National Academy Press.
Stahl, S. A., & Murray, B. A. (1994). Defining phonological awareness and its
relationship to early reading. Journal of Educational Psychology, 86(2), 221-234.
Stanovich, K. E. (1986). Matthew effects in reading: Some consequences of individual
differences in the acquisition of literacy. Reading Research Quarterly, 21, 360-
407.
Taylor, B. M., & Ysseldyke, J. E. (Eds.) (2007). Effective instruction for struggling
readers, K-6. New York: Teachers College Press.
Ticha, R., Espin, C. A., & Wayman, M. M. (2009). Reading progress monitoring for
secondary-school students: Reliability, validity, and sensitivity to growth of
reading-aloud and maze-selection measures. Learning Disabilities Research &
Practice, 24(3), 132-142.
Underwood, T., & Pearson, P. D. (2004). Teaching struggling adolescent readers to
comprehend what they read. In T.L. Jetton & J.A. Dole (Eds.). Adolescent literacy
research and practice (pp. 135-161). New York: Guilford Press.
Vaughn, S., Cirino, P. T., Wanzek, J., Wexler, J., Fletcher, J. M., Denton, C. D., …
Francis, D. J. (2010). Response to intervention for middle school students with
127
reading difficulties: Effects of primary and secondary intervention. School
Psychology Review, 39(1), 3-21.
Wayman, M. M., Wallace, T., Wiley, H. I., Ticha, R., & Espin, C. A. (2007). Literature
synthesis on curriculum-based measurement in reading. The Journal of Special
Education, 41(2), 85-120.
Wexler, J., Vaughn, S., Edmonds, M., & Reutebuch, C. K. (2008). A synthesis of fluency
interventions for secondary struggling readers. Reading and Writing, 21, 317-347.

128
Appendix A
Inventory of School Motivation (McInerney & Ali, 2006)
Item Strongly
Disagree
Disagree Neutral Agree Strongly
Agree
I like being given the chance to do something again to make it
better.
1 2 3 4 5
I don’t mind working a long time at schoolwork that I find
interesting. 1 2 3 4 5
Winning is important to me. 1 2 3 4 5
I work hard at school so that I will be put in charge of a group. 1 2 3 4 5
I do my best work at school when I am working with others. 1 2 3 4 5
It is very important for students to help each other at school. 1 2 3 4 5 Praise from my teachers for my good schoolwork is important to me. 1 2 3 4 5
I work best in class when I can get some kind of reward. 1 2 3 4 5
I try harder with interesting work. 1 2 3 4 5
I try hard to make sure that I am good at my schoolwork. 1 2 3 4 5
Coming first is very important to me. 1 2 3 4 5
I like to compete with others at school. 1 2 3 4 5
I want to feel important in front of my school friends. 1 2 3 4 5
I try to work with friends as much as possible at school. 1 2 3 4 5
I like to help other students do well at school. 1 2 3 4 5
Praise from my friends for good schoolwork is important to me. 1 2 3 4 5
I work hard in class for rewards from the teacher. 1 2 3 4 5
I like to see that I am improving in my schoolwork. 1 2 3 4 5
When I am improving in my schoolwork I try even harder. 1 2 3 4 5

129
I work harder if I’m trying to be better than others. 1 2 3 4 5
At school I like being in charge of a group. 1 2 3 4 5
I prefer to work with other people at school rather than alone. 1 2 3 4 5
I care about other people at school. 1 2 3 4 5
At school I work best when I am praised. 1 2 3 4 5
I work hard at school for presents from my parents. 1 2 3 4 5
I need to know that I am getting somewhere with my
schoolwork.
1 2 3 4 5
The harder the problem the harder I try. 1 2 3 4 5
I want to do well at school to be better than my classmates. 1 2 3 4 5
It is very important for me to be a group leader. 1 2 3 4 5
I enjoy helping others with their schoolwork even if I don’t do
so well myself.
1 2 3 4 5
I want to be praised for my good schoolwork. 1 2 3 4 5
Getting a reward for my good schoolwork is important to me. 1 2 3 4 5
I try hard at school because I am interested in my work. 1 2 3 4 5
I am only happy when I am one of the best in class. 1 2 3 4 5
I work hard at school because I want the class to notice me. 1 2 3 4 5
I often try to be the leader of a group. 1 2 3 4 5
It makes me unhappy if my friends aren’t doing well at school. 1 2 3 4 5
Praise from my parents for good schoolwork is important to
me.
1 2 3 4 5
Getting merit certificates helps me work harder at school. 1 2 3 4 5
I work hard to try to understand new things at school. 1 2 3 4 5
Praise for good work is not enough I like a reward. 1 2 3 4 5
I am always trying to do better in my schoolwork. 1 2 3 4 5
If I got rewards at school I would work harder. 1 2 3 4 5

130
Appendix B
Figure 6. Dendrogram using average linkage, derived from hierarchical cluster analysis.
This graphic illustrates case groupings in order to specify the optimal number of clusters.

131
Appendix C
Graphical Presentations of Responses to Each Dimension on the ISM by Profile
Task
0%
10%
20%
30%
40%
50%
60%
5 4 3 2 1
Likert Response Level
Fre
qu
en
cy o
f R
esp
on
e
Overall
Cluster 1
Cluster 2
Cluster 3
Cluster 4
Figure 7. Responses to task dimension (ISM) overall and by profile.
Effort
0%
10%
20%
30%
40%
50%
60%
5 4 3 2 1
Likert Reponse Level
Fre
qu
en
cy o
f R
esp
on
e
Overall
Cluster 1
Cluster 2
Cluster 3
Cluster 4
Figure 8. Responses to effort dimension (ISM) overall and by profile.

132
Competition
0%
10%
20%
30%
40%
50%
60%
5 4 3 2 1
Likert Response Level
Fre
qu
en
cy o
f R
esp
on
e
Overall
Cluster 1
Cluster 2
Cluster 3
Cluster 4
Figure 9. Responses to competition dimension (ISM) overall and by profile.
Social Power
0%
5%
10%
15%
20%
25%
30%
35%
40%
45%
50%
5 4 3 2 1
Likert Response Level
Fre
qu
en
cy o
f R
esp
on
e
Overall
Cluster 1
Cluster 2
Cluster 3
Cluster 4
Figure 10. Responses to social power dimension (ISM) overall and by profile.

133
Affiliation
0%
10%
20%
30%
40%
50%
60%
5 4 3 2 1
Likert Response Level
Fre
qu
en
cy o
f R
esp
on
e
Overall
Cluster 1
Cluster 2
Cluster 3
Cluster 4
Figure 11. Responses to affiliation dimension (ISM) overall and by profile.
Social Concern
0%
5%
10%
15%
20%
25%
30%
35%
40%
45%
5 4 3 2 1
Likert Response Level
Fre
qu
en
cy o
f R
esp
on
e
Overall
Cluster 1
Cluster 2
Cluster 3
Cluster 4
Figure 12. Responses to social concern dimension (ISM) overall and by profile.

134
Praise
0%
10%
20%
30%
40%
50%
60%
70%
5 4 3 2 1
Likert Response Level
Fre
qu
en
cy o
f R
esp
on
e
Overall
Cluster 1
Cluster 2
Cluster 3
Cluster 4
Figure 13. Responses to praise dimension (ISM) overall and by profile.
Token
0%
5%
10%
15%
20%
25%
30%
35%
40%
45%
5 4 3 2 1
Likert Response Level
Fre
qu
en
cy o
f R
esp
on
e
Overall
Cluster 1
Cluster 2
Cluster 3
Cluster 4
Figure 14. Responses to token dimension (ISM) overall and by cluster.


![[PPT]SWOT (Strengths, Weaknesses, Opportunities & …pharmasy.weebly.com/.../0/37303361/swot_analysis_final.pptx · Web viewThe overall evaluation of a company’s strengths, weaknesses,](https://static.fdocuments.us/doc/165x107/5afb31747f8b9ad22090396e/pptswot-strengths-weaknesses-opportunities-viewthe-overall-evaluation-of.jpg)

