Identifying Opportunities for Climate-Smart Agriculture ... · Identifying Opportunities for...
102
1 Identifying Opportunities for Climate-Smart Agriculture Investments in Africa by Giacomo Branca, Timm Tennigkeit, Wendy Mann, Leslie Lipper with contributions from Rym Benzid, Paul Borsy, Yamina Cherrou, Alberta Mascaretti, Hermann Pfeiffer, Julia Seevinck, Garry Smith, Andreas Wilkes, Johannes Woelcke FAO & World Bank Final report September 2011
Transcript of Identifying Opportunities for Climate-Smart Agriculture ... · Identifying Opportunities for...
1
Identifying Opportunities for Climate-Smart Agriculture Investments in Africa
by
Giacomo Branca, Timm Tennigkeit, Wendy Mann, Leslie Lipper
with contributions from
Rym Benzid, Paul Borsy, Yamina Cherrou, Alberta Mascaretti, Hermann Pfeiffer, Julia Seevinck, Garry Smith, Andreas Wilkes, Johannes Woelcke
FAO & World Bank
Final report
September 2011

2
Table of Contents
Abbreviations and acronyms ............................................................................................ 4
Executive summary .......................................................................................................... 5
1. Introduction ................................................................................................................. 6
1.1 The context ................................................................................................................................... 6
1.2 The paper ...................................................................................................................................... 9
2. The analytical framework for Climate-smart agriculture .............................................. 10
2.1 Climate-Smart Agriculture and development ............................................................................. 10
2.2 Adaptation .................................................................................................................................. 11
2.3 Mitigation .................................................................................................................................... 12
3. Agriculture investment needs and options for climate-smart agriculture financing in Africa ............................................................................................................................. 16
3.1. Agricultural investment needs and barriers .............................................................................. 16
3.2 Available financing instruments in the agricultural sector ......................................................... 18
3.3. Climate investment needs and financing instruments in the agricultural sector ...................... 19
3.4. Climate-smart agriculture and potential role of climate financing in Africa ............................. 21
4. A methodology to identify climate-smart activities in CAADP investment plans ........... 22
4.1 Proposed phases for identification of CSA investments potential in CAADP countries ............. 22
4.2 Detailed methodology for phase 1 (screening) .......................................................................... 23
5. Preliminary results from the screening of Agricultural Investment Plans ...................... 26
6. Discussion of the results ............................................................................................. 31
6.1 Potential climate benefits of NAIP programs ............................................................................. 31
6.2 Investment readiness for Climate-smart agriculture in screened NAIPs .................................... 32
6.3 Linking NAIPs with financing sources .......................................................................................... 33
6.4 The way forward ......................................................................................................................... 34
7. References .................................................................................................................. 36
8. Annexes: Results from the Climate-smart Agriculture Screening of the National Agricultural Investment Plans. Country profiles in alphabetical order .............................. 39
8.1. Benin ....................................................................................................................... 40
8.2. Ethiopia ................................................................................................................... 47
8.3. Gambia .................................................................................................................... 51
8.4 Ghana ....................................................................................................................... 56
8.5 Kenya ....................................................................................................................... 60
3
8.6 Liberia ...................................................................................................................... 64
8.7 Malawi ..................................................................................................................... 68
8.8 Niger ........................................................................................................................ 73
8.9 Nigeria ...................................................................................................................... 78
8.10 Rwanda .................................................................................................................. 82
8.11 Senegal ................................................................................................................... 86
8.12 Sierra Leone ............................................................................................................ 90
8.13 Togo ....................................................................................................................... 94
8.14 Uganda ................................................................................................................... 99
4
Abbreviations and acronyms AU African Union A-SWAp Agriculture Sector-Wide Approach CAADP Comprehensive Africa Agriculture Development Program C Carbon CH4 Methane CO2 Carbon Dioxide CO2e Carbon Dioxide Equivalent CSA Climate-Smart Agriculture CDM Clean Development Mechanism COP Conference of the Parties CSIF Country Sustainable land management Investment Framework EAP Environmental Action Plan EU European Union FAO Food and Agriculture Organization of the United Nations FDI Foreign Direct Investments GAFSP Global Agriculture and Food Security Program GCF Gross Capital Formation GDP Gross Domestic Product GEF Global Environment Facility GHG Green House Gas IPCC Intergovernmental Panel on Climate Change LCA Life Cycle Analysis LDC Least Developed Countries MDGs Millennium Development Goals Mt Million tons MRV Measuring, Reporting and Verification NAIPs National Agriculture and Food Security Investment Plans NAPA National Adaptation Program of Action N2O Nitrous Oxide ODA Official Development Assistance OECD-DAC Development Assistance Committee of the Organization for Economic Co-operation and
Development REDD Reduction of Emissions from Deforestation and Forest Degradation SSA Sub-Saharan Africa SBSTA Subsidiary Body on Scientific, Technical and Technological Advice UNFCCC UN Framework Convention on Climate Change

5
Executive summary The agricultural sector in Africa is called to increase food production in order to meet food demand for a growing population. This formidable challenge will be further exacerbated by climate change which will have significant impacts on the different dimensions and determinants of food security. African policymakers are thus challenged to ensure that agriculture contributes to addressing food security, development and climate change. National Agriculture and Food Security Investment Plans (NAIPs) - prepared by a number of African countries within the AU-NEPAD Comprehensive Africa Agriculture Development Program (CAADP) - provide the opportunity to integrate into an existing continentally and country-owned sustainable agriculture development framework the up-scaling of practices that potentially benefit development, food security and climate change adaptation and mitigation. This paper proposes a methodology to examine the potential of existing NAIPs to generate climate change benefits. A rapid screening methodology is presented and applied to 14 CAADP NAIPs. All investment plans screened include agricultural development programs/sub-programs that benefit both adaptation to slow-onset climatic change and extreme events, and climate change mitigation: on average about 60% of the activities planned are expected to generate climate benefits in terms of slow-onset climate change, 18% adaptation to extreme events and 19% climate change mitigation.
6
1. Introduction
1.1 The context Africa's population has just passed 1 billion and is due to double by 2050. FAO estimated that Sub-Saharan Africa remains the region with the highest proportion of undernourished people in the population (30% in 2010), compared with a 16% average for developing countries (FAO, 2011a). FAO (2009c) estimated that Africa will need to provide adequate food supplies for more than 20 million additional people each year and improve the nutritional status of the more than 239 million people currently undernourished. This is equivalent to achieving a 4.6% growth in food supplies. Thus increasing food production will be an important part of addressing food insecurity in the 21st century in Africa.
Agriculture constitutes the mainstay of most African economies. It is frequently the largest contributor to GDP and about two-thirds of manufacturing value-added is based on agricultural raw materials. Agriculture is also a main source of employment, remaining essential for pro-poor economic growth in most African countries, as rural areas support around 70-80% of the total population. Despite increasing urbanization, Africa’s poorest households are rural and smallholder agriculture remains essential for lifting large numbers of Africans out of poverty and hunger (NEPAD, 2002).
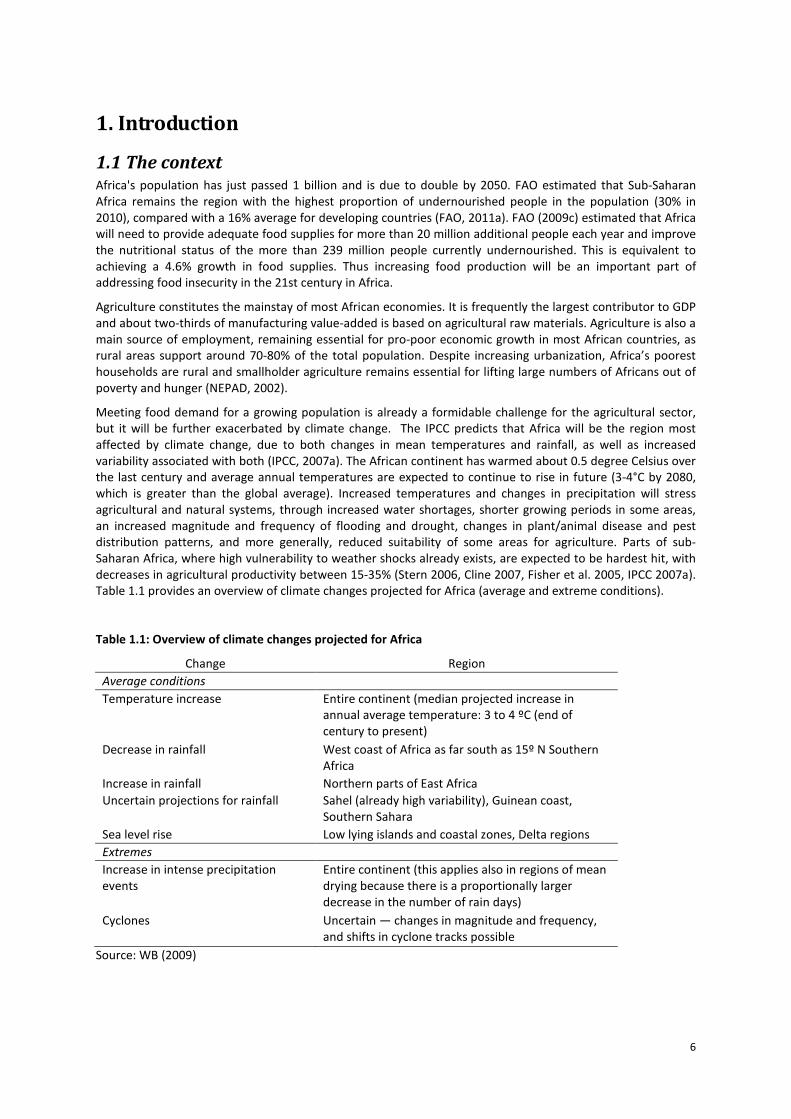
Meeting food demand for a growing population is already a formidable challenge for the agricultural sector, but it will be further exacerbated by climate change. The IPCC predicts that Africa will be the region most affected by climate change, due to both changes in mean temperatures and rainfall, as well as increased variability associated with both (IPCC, 2007a). The African continent has warmed about 0.5 degree Celsius over the last century and average annual temperatures are expected to continue to rise in future (3-4°C by 2080, which is greater than the global average). Increased temperatures and changes in precipitation will stress agricultural and natural systems, through increased water shortages, shorter growing periods in some areas, an increased magnitude and frequency of flooding and drought, changes in plant/animal disease and pest distribution patterns, and more generally, reduced suitability of some areas for agriculture. Parts of sub-Saharan Africa, where high vulnerability to weather shocks already exists, are expected to be hardest hit, with decreases in agricultural productivity between 15-35% (Stern 2006, Cline 2007, Fisher et al. 2005, IPCC 2007a). Table 1.1 provides an overview of climate changes projected for Africa (average and extreme conditions).
Table 1.1: Overview of climate changes projected for Africa
Change Region Average conditions Temperature increase Entire continent (median projected increase in
annual average temperature: 3 to 4 ºC (end of century to present)
Decrease in rainfall West coast of Africa as far south as 15º N Southern Africa
Increase in rainfall Northern parts of East Africa Uncertain projections for rainfall Sahel (already high variability), Guinean coast,
Southern Sahara Sea level rise Low lying islands and coastal zones, Delta regions Extremes Increase in intense precipitation events
Entire continent (this applies also in regions of mean drying because there is a proportionally larger decrease in the number of rain days)
Cyclones Uncertain — changes in magnitude and frequency, and shifts in cyclone tracks possible
Source: WB (2009)
7
These climatic changes will have significant effects on the different dimensions and determinants of African food security. Climate change will affect the productivity of rain-fed crops and forage, reduce water availability and change the severity and distribution of crop, livestock and human diseases. The impacts of climate change on agriculture across Africa will vary:
• at mid-to-high latitudes, depending on the crop, crop productivity may increase slightly with local mean temperature increases of up to 1–3°C, while at lower latitudes crop productivity is projected to decrease with small local temperature increases of 1–2°C (IPCC, 2007a);
• by 2050 in the tropics and subtropics, crop yields may fall by 10–20% because of warming and drying, but there are places where yield losses may be more severe (Thornton et al., 2008).
• Work carried out by Lobell et al. (2011) used combined historical crop production and weather data to model yield response to climate change for several key African crops. It was found that by mid-century, the mean estimates of aggregate production changes in sub-Saharan Africa would be − 22, − 17, − 17, − 18, and − 8% for maize, sorghum, millet, groundnut, and cassava, respectively. In all cases except cassava, there is a 95% probability that damages exceed 7%, and a 5% probability that they exceed 27%. Countries with the highest average yields showed the largest projected yield losses.
It is expected that climatic changes will be more rapid and intense, requiring adaptation that is faster and more profound than in the past. It is also foreseen that the imperative for agriculture in Africa to meet food security and development needs will result in increasing greenhouse gas emissions from the sector, which is currently only 4% of global greenhouse gas emissions. While adaptation is recognized as being of greater immediate importance to Africa than mitigation, there are possibilities for devising growth strategies that entail lower emissions than a “business-as-usual” scenario of development and for facilitating the planning, implementation and financing of such strategies that may form part of climate-smart agricultural efforts.
Recent food volatility showed that climate change can be an important threat multiplier to food security and that it is introducing another source of risk and uncertainty into food systems from farms to global levels. The compounding effects of spiking food and fuel prices and the global economic downturn in 2009 and weather anomalies are estimated to have reversed the steady decline in the proportion of undernourished in the population (FAO 2009a). Also, they could reverse the economic gains obtained by a number of African countries in recent years. Increasing agriculture’s adaptive capacity could help to ensure that these gains are maintained or enhanced under climatic change and that sliding back into poverty and hunger is avoided. Food security and climate change have moved up the development agenda, and they are likely to remain major development concerns for Africa, especially Sub-Saharan Africa, for the foreseeable future.
African policymakers are thus challenged to ensure that agriculture contributes to addressing food security, development and climate change (adaptation and mitigation). Approaches that seek to maximize the benefits and minimize the trade-offs across these multiple objectives (which are closely linked within the agriculture sector) require more integrated and coordinated planning, policies, institutional arrangements, as well as financing and investment. Such approaches and their related enabling requirements are sometimes referred to as climate-smart agriculture.
African leadership at the highest level has already recognized and responded to this challenge at the thirteenth African Union Summit (Sirte, Libya July 2009). The Summit recognized the urgency and imperative of addressing these multiple objectives in more integrated ways and called for the development of a framework to achieve this. The AUC-NEPAD Agriculture Climate Change Adaptation-Mitigation Framework derives from the Summit’s call and is envisaged as an integral part of the AU-NEPAD Comprehensive Africa Agriculture Development Program (CAADP) and Environmental Action Plan (EAP) 1. The Framework was endorsed by the Ministers of Agriculture Conference in Lilongwe last October 2010.
The goal of CAADP, which is owned and led by African governments, is to help reach and sustain higher economic growth through agriculture-led development that reduces hunger and poverty and enables food and nutrition security2. To achieve these goals, more strategic and integrated planning, as well as increased
1 The framework provides strategic guidance to national and regional level initiatives along programmatic approaches on technology transfer, knowledge management and financing to scale up agriculture-based adaptation and mitigation measures including sustainable land and agricultural water management. 2 CAADP supports agriculture-led development to reduce hunger and poverty and enable food and nutrition security and growth in exports through better strategic planning and increased investment in the sector by engaging with state and non-state actors and stakeholders at all levels. As a program of the African Union (AU), it enjoys a broad consensus world-wide on objectives, implementation processes, and
8
investment in the sector is advocated. For the latter, National Agriculture and Food Security Investment Plans (NAIPs) have been prepared by a number of African countries3. These Plans provide the opportunity to integrate into an existing continentally and country-owned sustainable agriculture development framework the up-scaling of practices that potentially benefit development, food security and climate change adaptation and mitigation.
CAADP guiding principles include adopting agriculture-led growth as the main strategy for achieving the first Millennium Development Goal of halving the proportion of people living on less than a dollar a day and the proportion of hungry people by 2015 and accelerating agricultural productivity growth. In fact NAIPs are built around four mutually reinforcing pillars, i.e. 1) extending the area under sustainable land management and reliable water control systems; 2) improving rural infrastructure and trade-related capacities for market access; 3) increasing food supply, reducing hunger, and improving responses to food emergency crises; and 4) improving agriculture research, technology dissemination and adoption (Omilola et al., 2010).
The AUC-NEPAD Agriculture Climate Change Adaptation-Mitigation Framework includes sections on measures, policies, institutional arrangements and financing, among others. Section 5 of the AUC-NEPAD Agriculture Climate Change Adaptation Mitigation Framework addresses “Financing the scaling up of adaptation-mitigation measures in agriculture”. It is recognized in this section that the “CAADP country national agriculture, food and nutrition security investment plans will be the primary window and avenue to engage and support application of instruments and tools developed within the context of the framework....” and further states that “Greater efforts are needed to ensure complementarities between agriculture, climate change and existing development finance.” FAO has also suggested consideration of the same in its recent publications on agriculture, food security and climate change.
The agricultural sector in Africa requires substantial investments, public and private, to increase agricultural productivity and achieve food security. Both agricultural and climate investments are largely privately financed and the important role of public funding is to support capacity building, correct market failures, ensure equity - including reducing vulnerability of the poor - and to leverage and align private investments with government policies. The implementation of the AUC-NEPAD Agriculture Climate Change Adaptation-Mitigation Framework requires strengthening public sector capacity, coordination and planning as well as African leadership and coordination, which rests with national governments, supported by AUC-NEPAD and regional economic communities in the context of the CAADP.
It is also noteworthy that African work on integration of agriculture and climate change issues has taken place without commensurate international policy advances within UN Framework Convention on Climate Change (UNFCCC) processes4. The UNFCCC 16th conference of the parties (COP16) in December 2010 endorsed the Cancun Agreements that have been widely considered as a modest achievement, although it underlines the commitment of the international community to finance meaningful action on climate change in particular in
partnership principles. The AU’s New Partnership for Africa’s Development Planning and Coordinating Agency (NPCA), provides technical leadership to the overall CAADP process. CAADP fully reflects NEPAD’s broad principles of mutual review and dialogue, accountability, and partnership. 3 In 2010, the foundation laid by CAADP supported processes within which 15 countries signed CAADP Compacts, taking the total to 24 across the continent. 18 countries drafted CAADP investment plans (Benin, Burkina Faso, Burundi, Ethiopia, Gambia, Ghana, Liberia, Kenya, Malawi, Mali, Niger, Nigeria, Rwanda, Senegal, Sierra Leone, Tanzania, Togo, Uganda), and 15 of these underwent an external technical review. A total of 12 countries held business meetings to agree on a financing strategy for their investment plans. In a number of countries incremental financing has already been committed, and work has been initiated to put in place the more detailed program (and in some cases project) plans and structures that will be used to secure the committed financing and to guide implementation of the proposed investments. The CAADP’s implementation work falls under 4 pillars: Pillar 1: Land & water management; Pillar 2: Market access; Pillar 3: Food supply and hunger; and Pillar 4: Agricultural research. 4 The UNFCCC ultimate objective is “to stabilize greenhouse gas emissions at a level that would prevent dangerous greenhouse gas concentrations in the atmosphere. Such a level should be achieved within a time-frame sufficient to allow ecosystems to adapt to climate change, to ensure that food production is not threatened and to enable economic development in a sustainable manner.” In the UNFCCC process the challenges and opportunities for mitigation in the agricultural sector have been addressed in a technical paper commissioned by UNFCCC in 2008. In April 2009, the UNFCCC Secretariat held an in-session workshop on agriculture to present the technical paper and to invite parties to express their views. Draft text on agriculture, including the proposal for a work program on agriculture under the UNFCCC Subsisdiary Body for Scientific and Technological Advice was not retained in the outcome documents of COP 15 in Copenhagen and COP16 In Cancun. Negotiators are again working on a draft text on agriculture within the Ad hoc Working Group on Long-term Cooperative Action, under the item Cooperative sectoral approaches and sector-specific actions in order to enhance implementation of Article 4, paragraph 1 of the Convention.

9
LDCs5. However, text on agriculture was not incorporated into the Cancun Agreements. At the most recent session of the UNFCCC Climate Talks, a proposal by New Zealand and Canada to include agriculture on the agenda of the SBSTA was not approved. However, agriculture has now reappeared on the agenda of the AWG-LCA under sectoral approaches. An African negotiator is facilitating the relevant contact group.
1.2 The paper In light of the context described above, this paper proposes a methodology to examine the potential of existing NAIPs to generate climate change benefits. The paper proposes a two-phase approach: (i) an initial scoping phase to review financing/ investment issues and to develop a rapid screening methodology for CAADP investment plans in order to identify programs and activities that generate adaptation and mitigation benefits; (ii) a second phase of in-depth analysis, including estimation of adaptation/mitigation potentials using baseline emissions levels and identification of possible eligibility criteria for climate smart programs and activities, linked to CAADP investment plans, to enable access to existing, emerging and dedicated financing mechanisms.
The screening of activities identified in CAADP investment plans for their adaptation and mitigation relevance and/or eventual adjustment for their possible eligibility to use climate finance for climate smart agriculture would seem to be in line with African and international ideas on blending and leveraging different financing/investment streams (public and private) in order to give greater flexibility and required resource levels for relevant activities in the agriculture sector. Such a screening process could also increase the awareness, including within Ministries of Agriculture, of what the agricultural sector can do to address climate change. It would also provide the opportunity for Governments and Development Partners to allocate urgently needed additional resources for an explicit and comprehensive transformation to nationally appropriate forms of climate-smart agriculture through relevant programs and activities. The identification of such programs and activities might assist countries to access existing and emerging sources of climate finance.
The paper is structured as followed: section 1 provides the continental and international context in which the paper is situated. The analytical framework for climate-smart agriculture is described in section 2 while section 3 discusses the investment needs of the agricultural sector in Africa providing also an overview of financing opportunities, barriers and options for climate smart agricultural investments. Section 4 outlines a rapid screening methodology to identify climate smart activities in CAADP investment plans and section 5 summarizes preliminary findings from the screening of the agriculture sector investment plan of a set of countries which has been used as tests for building the methodology (full country profiles are reported in the Annex). Finally, section 6 summarizes main findings of the screening and provides some elements for a possible – country in-depth – analysis to identify opportunities for climate-smart agriculture investments.
5 The Cancun agreements include provision to establish an Adaptation Framework and a Green Climate Fund. Both mechanisms are expected to be implemented even if a post 2012 international binding agreement on climate change is not achievable in Durban in December 2011.
10
2. The analytical framework for Climate-smart agriculture
2.1 Climate-Smart Agriculture and development “Climate-Smart Agriculture” (CSA) addresses the challenges of building synergies among climate change mitigation, adaptation and food security that are closely related within agriculture, and minimizing their potential negative trade-offs. It seeks to enhance the capacity of the agricultural sector to sustainably support food security, incorporating the need for adaptation and the potential for mitigation into development strategies. The specific conditions, circumstances, and capacities within countries will define opportunities and barriers to implementation, and hence policy choices (FAO 2011c).
CSA will: (i) sustainably intensify production systems to achieve productivity increases thereby supporting the achievement of national food security and development goals; (ii) increase the resilience of production systems and rural livelihoods (adaptation), (iii) reduce agriculture’s GHGs emissions (including through increased production efficiency) and increase carbon sequestration (mitigation). There is no blueprint for climate-smart agriculture and the specific contexts of countries and communities would need to shape how it is ultimately implemented. Climate-smart agricultural production technologies are therefore aimed at maximizing food security benefits and, at the same time, they can deliver significant climate change mitigation and adaptation co-benefits (Branca et al, 2011).
However, care must be taken when formulating policies to support climate smart agriculture to avoid compromising policy efficiency6. For developing countries highly dependent on agriculture and with a large share of food insecure people in the agricultural sector, the main objective of CSA is to improve food security, incorporating adaptation as required to meet this objective. In this context opportunities for mitigation shall be considered as additional co benefits that could potentially be financed by external mitigation funding sources.
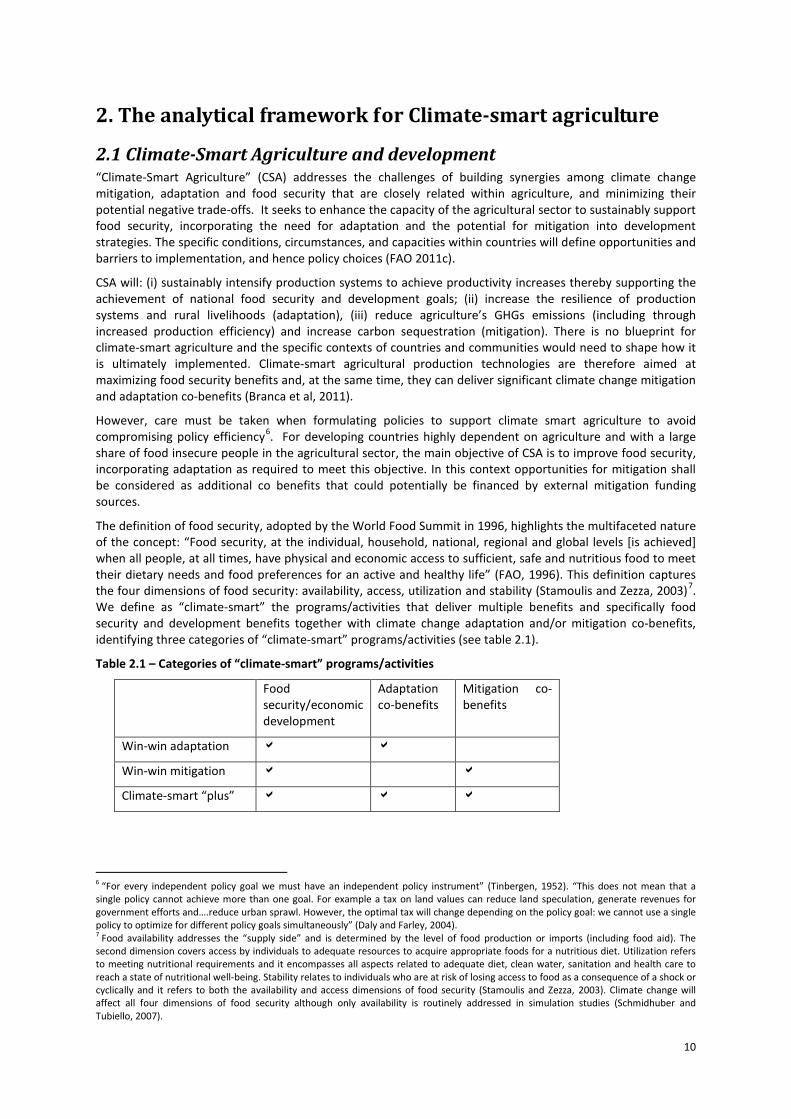
The definition of food security, adopted by the World Food Summit in 1996, highlights the multifaceted nature of the concept: “Food security, at the individual, household, national, regional and global levels [is achieved] when all people, at all times, have physical and economic access to sufficient, safe and nutritious food to meet their dietary needs and food preferences for an active and healthy life” (FAO, 1996). This definition captures the four dimensions of food security: availability, access, utilization and stability (Stamoulis and Zezza, 2003)7. We define as “climate-smart” the programs/activities that deliver multiple benefits and specifically food security and development benefits together with climate change adaptation and/or mitigation co-benefits, identifying three categories of “climate-smart” programs/activities (see table 2.1).
Table 2.1 – Categories of “climate-smart” programs/activities
Food security/economic development
Adaptation co-benefits
Mitigation co-benefits
Win-win adaptation
Win-win mitigation
Climate-smart “plus”
6 “For every independent policy goal we must have an independent policy instrument” (Tinbergen, 1952). “This does not mean that a single policy cannot achieve more than one goal. For example a tax on land values can reduce land speculation, generate revenues for government efforts and….reduce urban sprawl. However, the optimal tax will change depending on the policy goal: we cannot use a single policy to optimize for different policy goals simultaneously” (Daly and Farley, 2004). 7 Food availability addresses the “supply side” and is determined by the level of food production or imports (including food aid). The second dimension covers access by individuals to adequate resources to acquire appropriate foods for a nutritious diet. Utilization refers to meeting nutritional requirements and it encompasses all aspects related to adequate diet, clean water, sanitation and health care to reach a state of nutritional well-being. Stability relates to individuals who are at risk of losing access to food as a consequence of a shock or cyclically and it refers to both the availability and access dimensions of food security (Stamoulis and Zezza, 2003). Climate change will affect all four dimensions of food security although only availability is routinely addressed in simulation studies (Schmidhuber and Tubiello, 2007).

11
2.2 Adaptation Adaptation is defined as activities that aim “to reduce the vulnerability8 of human or natural systems to the impacts of climate change and climate-related risks, by maintaining or increasing adaptive capacity and resilience” (OECD-DAC, 2011). The vulnerability of a system depends on its exposure and sensitivity to changes, and on its ability to manage these changes (IPCC, 2001, 2007a,b; WB, 2010a). We consider here both household vulnerability (i.e. vulnerability of physical, financial, human and social capital) and vulnerability of agricultural systems (i.e. vulnerability of natural capital in different agro-ecosystems)9.
Vulnerability could be reduced by altering exposure, reducing sensitivity, and improving the adaptive capacity of the system (Adger et al., 2004; OECD, 2009). IPCC (2007a) defines adaptive capacity as the ability or potential of a human or natural system to respond successfully to climate variability and change so as to moderate potential risks or cope with consequences of extreme events (floods, heavy hail/snow events, heavy wind and dust storms, droughts and dry spells, heat waves and warm spells, cold spells). Among the main determinants of adaptive capacity are financial resources, technology, access to information and skills, infrastructure, social institutions and policies and equity (Swanson et al 2007).
Adaptation strategies and measures increase the range of climate conditions farmers can cope with. These could include a specific action (e.g. switching from one crop variety to another) or a systemic change (e.g. diversifying livelihoods against risks or an institutional reform to create incentives for better resource management) (FAO, 2009a). Although there is no general consensus on indicators for adaptation activities, the contribution of such strategies to increasing systems’ adaptive capacity could be estimated by means of increased physical, economic, social and human resilience which summarize the determinants of adaptive capacity and, for the purpose of this analysis, will be selected as proxy indicators for adaptation (see table 2.2).
Table 2.2 – Resilience as proxy indicators for adaptation
Dimensions of systems’ resilience Critical elements of systems’ resilience
Physical resilience Water quantity and quality, soil resource & soil fertility, seed resources, livestock
Economic resilience Income diversification, equity (income distribution), risk management (crop insurances, safety nets), off-farm earnings, diversity of employment opportunities, health and social services, markets
Social and human resilience Extension and research, technical know-how, connection to social networks, education and training, information management
Economic development is a central element of adaptation to climate change, and the best way to reduce vulnerability to (current and future) climate events is often through basic development (Fankhauser and Burton, 2011)10. Overlaps in fact exist between ‘development as usual’ and adaptation activities (Brown et al., 2010), and different categories of activities are identified within the adaptation-development continuum (e.g. McGray et al., 2007; Olhoff and Schaer, 2010), ranging from interventions aimed at increasing coping capacity that resemble pure development activities to explicit adaptation measures which may either be a response to extreme events or represent a slow onset climate change adaptation process11. In the present analysis we
8 Vulnerability is defined as the degree to which a system is susceptible to the adverse effects of such change (IPCC, 2007a). 9 A distinction between general vulnerability (which is not related to climate change impacts) and specific climate vulnerability (in view of specific climate change impacts) is often made (FAO, 2011). However, for the purposes of this analysis we consider specific climate vulnerability only. 10 This is the fundamental principle of adaptive capacity (IPCC, 2007a): more developed countries possess more adaptive capacity than less developed societies and are therefore less vulnerable to climate change (OECD, 2009). In agriculture-based countries, where agriculture is critical for economic development, adaptation in smallholder systems is important for food security and poverty reduction, as well as for growth and structural change (FAO, 2010). Adaptation needs to be made an integral part of sustainable development, with climate change implications factored into all development planning, decision-making and implementation (FAO, 2011). 11 There is a strong demand from the developing countries for adaptation to be supported over and above mainstream ODA. Developed countries in turn want to ensure that additional finance is used specifically to reduce vulnerability to climate change, and no other purposes (Fankhauser and Burton, 2011).
12
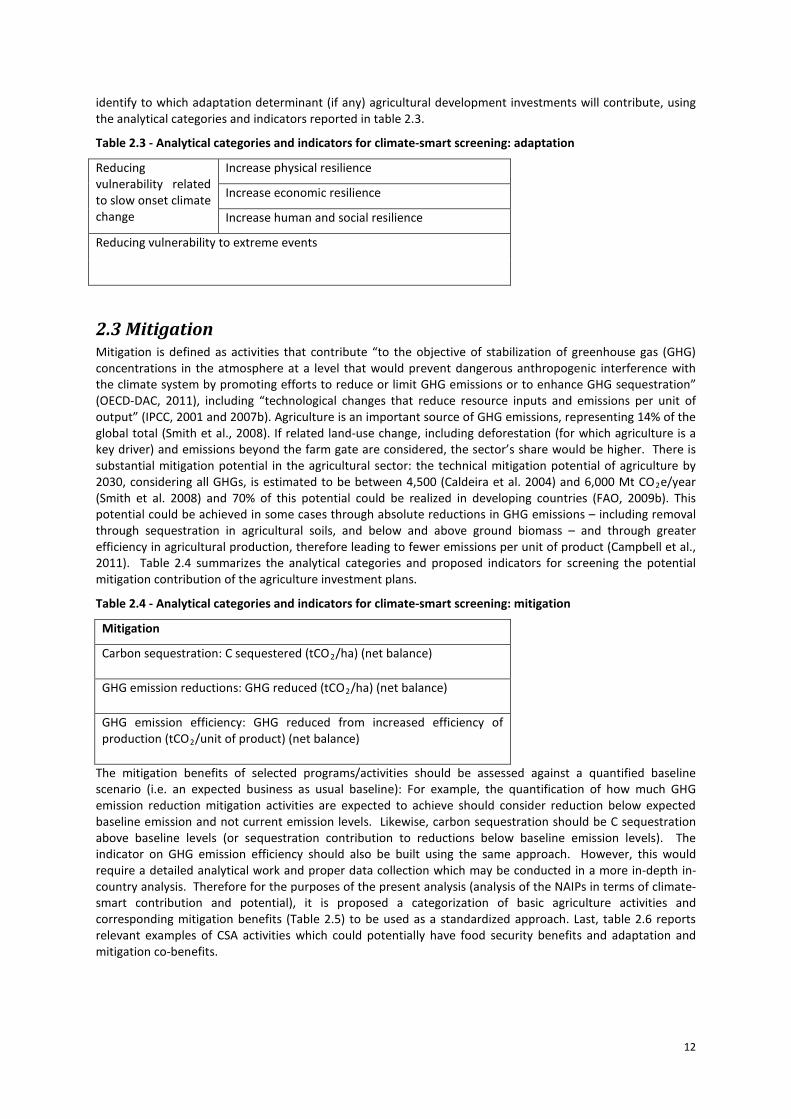
identify to which adaptation determinant (if any) agricultural development investments will contribute, using the analytical categories and indicators reported in table 2.3.
Table 2.3 - Analytical categories and indicators for climate-smart screening: adaptation
Reducing vulnerability related to slow onset climate change
Increase physical resilience
Increase economic resilience
Increase human and social resilience
Reducing vulnerability to extreme events
2.3 Mitigation Mitigation is defined as activities that contribute “to the objective of stabilization of greenhouse gas (GHG) concentrations in the atmosphere at a level that would prevent dangerous anthropogenic interference with the climate system by promoting efforts to reduce or limit GHG emissions or to enhance GHG sequestration” (OECD-DAC, 2011), including “technological changes that reduce resource inputs and emissions per unit of output” (IPCC, 2001 and 2007b). Agriculture is an important source of GHG emissions, representing 14% of the global total (Smith et al., 2008). If related land-use change, including deforestation (for which agriculture is a key driver) and emissions beyond the farm gate are considered, the sector’s share would be higher. There is substantial mitigation potential in the agricultural sector: the technical mitigation potential of agriculture by 2030, considering all GHGs, is estimated to be between 4,500 (Caldeira et al. 2004) and 6,000 Mt CO2e/year (Smith et al. 2008) and 70% of this potential could be realized in developing countries (FAO, 2009b). This potential could be achieved in some cases through absolute reductions in GHG emissions – including removal through sequestration in agricultural soils, and below and above ground biomass – and through greater efficiency in agricultural production, therefore leading to fewer emissions per unit of product (Campbell et al., 2011). Table 2.4 summarizes the analytical categories and proposed indicators for screening the potential mitigation contribution of the agriculture investment plans.
Table 2.4 - Analytical categories and indicators for climate-smart screening: mitigation
Mitigation
Carbon sequestration: C sequestered (tCO2/ha) (net balance)
GHG emission reductions: GHG reduced (tCO2/ha) (net balance)
GHG emission efficiency: GHG reduced from increased efficiency of production (tCO2/unit of product) (net balance)
The mitigation benefits of selected programs/activities should be assessed against a quantified baseline scenario (i.e. an expected business as usual baseline): For example, the quantification of how much GHG emission reduction mitigation activities are expected to achieve should consider reduction below expected baseline emission and not current emission levels. Likewise, carbon sequestration should be C sequestration above baseline levels (or sequestration contribution to reductions below baseline emission levels). The indicator on GHG emission efficiency should also be built using the same approach. However, this would require a detailed analytical work and proper data collection which may be conducted in a more in-depth in-country analysis. Therefore for the purposes of the present analysis (analysis of the NAIPs in terms of climate-smart contribution and potential), it is proposed a categorization of basic agriculture activities and corresponding mitigation benefits (Table 2.5) to be used as a standardized approach. Last, table 2.6 reports relevant examples of CSA activities which could potentially have food security benefits and adaptation and mitigation co-benefits.

13
Table 2.5 - Examples of agriculture activities and proposed categorization method of mitigation benefits for current analysis
general program areas activity types C sequestration GHG emission reduction GHG emission efficiency
land managementprotect against soil degradation; terracing; soil fertility restoration measures
assume reduced degradation will prevent soil C stock losses 0 0
water harvestingassume improved water availability increases yields and residue that is incorporated into soils
0 0
crop livestock integrationassume increased productivity and thus lower GHGs per unit yield
forage / grass planting assume it increases soil C 0 0
agroforestry & tree planting assume baseline is no trees, so increase in C stock 0 0
crop diversification assume intercropping and rotation improves soil C 0 0
Introduce planting materials and other inputs; expand application of integrated plant nutrients
assume improved nutrient improvement sequesters soil C 0 0
promote fertilizer use0 0
assume N "efficiently" applied to existing fields, so higher yield means lower GHGs per unit of output
pest management 0 0 lower yield loss means less GHG per unit yield
promote improved seeds 0 0 assume higher yields means less GHGs per unit output
water management construct irrigation systems 0 0smallscale gravity irrigation of existing fields means higher yields, so less GHGs per unit of input
wetland managementinvest in / encourage development and management of wetlands (e.g. for rice production)
0 0drainage may mean loss of GHGs, but additional yield would in aggregate mean lower GHGs per unit of output (deep drainage can generate large emissions)
post-harvest storage, processing, marketing Improve post-harvest activities to minimize losses 0 0 lower yield loss means less GHG per unit yield
Provide storage and processing facilities 0 0 less loss means lower GHGs per unit output
nutrition / food securitypromote the local production and consumption of micronutrient-dense food crops (e.g. fruits and vegetables)
assume fruit trees are additional and sequester carbon 0 0
Fisheriesfisheries activities in general
0 0assume interventions improve productivity, so less GHGs per unit of protein provided
Livestock veterinary / animal health activities 0 0 reduced disease burden means less GHGs per unit output
Improved management ofcommon property / pastoral resourcesassume less vegetation and soil degradation, so C sequestered 0 0
improved livestock husbandry; zero grazing; breed improvement0 0 increased efficiency of production
Market and Enterprise Developmentgeneral activities to support marketing
0 0assume improved marketing means less loss of yield, so reduced GHGs per unit output
improving production of export crops 0 0 assume increases efficiency of production
Rehabilitation and Expansion of Rural Roads
i. Assessment of strategic rural roads linking major production areas to markets; ii. Formulation of a policy on construction, rehabilitation and maintenance of rural roads;iii. Construction and rehabilitation of strategic rural roads into all-weather roads.
0 0 0
Rural Agricultural Infrastructure and EnergySupport the development and utilization of a renewable energy source in each county within five years
0assume it replaces some existing energy source and reduces emissions compared to baseline
0
capacity building skills-based training 0 0 assume increases efficiency of production
financial services financial services, credit groups etc 0 0 0
mechanization v. Make labor-saving intermediate technologies and devices available
0 0 assume increased efficiency reduces GHGs per unit of output
institutional developmentcapacity building or institution building for MoA and other organizations
0 0 0
agricultural research 0 0 0
general extension activities 0 0 0
agricultural education 0 0 0
building farmer organizations 0 0 0
MoA planning / coordination 0 0 0
land reform, tenure reform 0 0 0
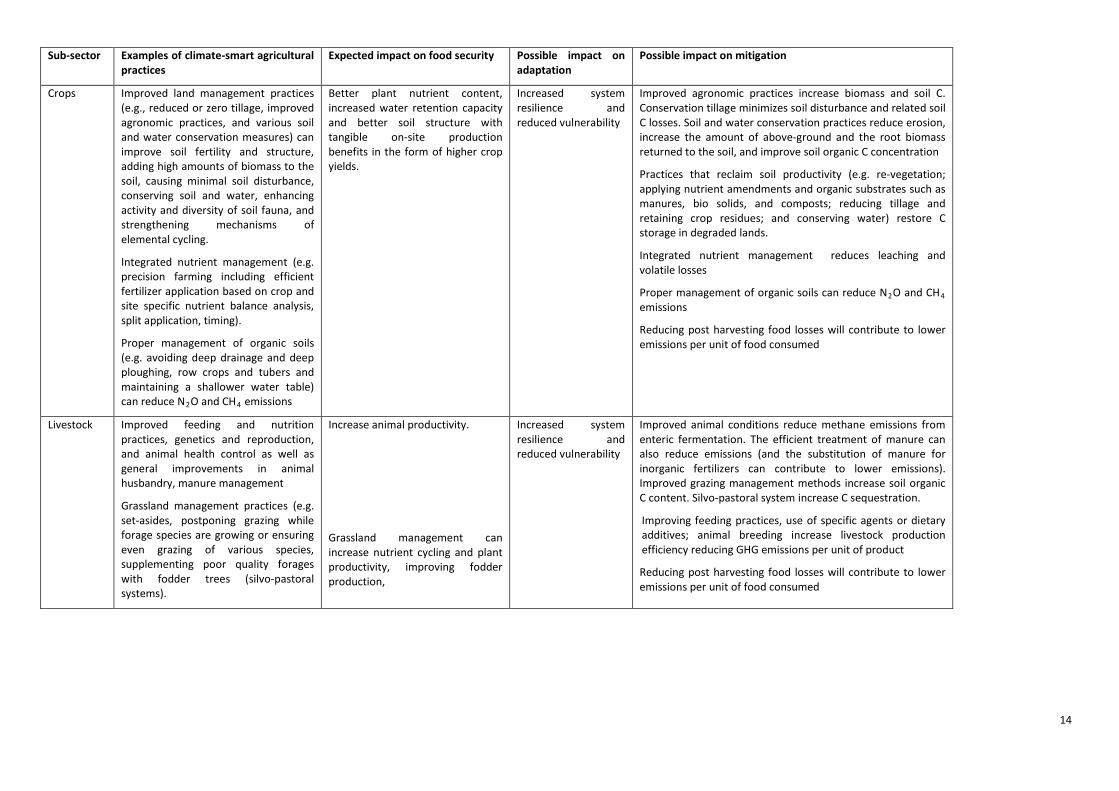
Table 2.6: Examples of synergies between food security, adaptation and mitigation of selected CSA technologies in different sub-sectors
14
Sub-sector Examples of climate-smart agricultural practices
Expected impact on food security Possible impact on adaptation
Possible impact on mitigation
Crops Improved land management practices (e.g., reduced or zero tillage, improved agronomic practices, and various soil and water conservation measures) can improve soil fertility and structure, adding high amounts of biomass to the soil, causing minimal soil disturbance, conserving soil and water, enhancing activity and diversity of soil fauna, and strengthening mechanisms of elemental cycling.
Integrated nutrient management (e.g. precision farming including efficient fertilizer application based on crop and site specific nutrient balance analysis, split application, timing).
Proper management of organic soils (e.g. avoiding deep drainage and deep ploughing, row crops and tubers and maintaining a shallower water table) can reduce N2O and CH4 emissions
Better plant nutrient content, increased water retention capacity and better soil structure with tangible on-site production benefits in the form of higher crop yields.
Increased system resilience and reduced vulnerability
Improved agronomic practices increase biomass and soil C. Conservation tillage minimizes soil disturbance and related soil C losses. Soil and water conservation practices reduce erosion, increase the amount of above-ground and the root biomass returned to the soil, and improve soil organic C concentration
Practices that reclaim soil productivity (e.g. re-vegetation; applying nutrient amendments and organic substrates such as manures, bio solids, and composts; reducing tillage and retaining crop residues; and conserving water) restore C storage in degraded lands.
Integrated nutrient management reduces leaching and volatile losses
Proper management of organic soils can reduce N2O and CH4 emissions
Reducing post harvesting food losses will contribute to lower emissions per unit of food consumed
Livestock Improved feeding and nutrition practices, genetics and reproduction, and animal health control as well as general improvements in animal husbandry, manure management
Grassland management practices (e.g. set-asides, postponing grazing while forage species are growing or ensuring even grazing of various species, supplementing poor quality forages with fodder trees (silvo-pastoral systems).
Increase animal productivity.
Grassland management can increase nutrient cycling and plant productivity, improving fodder production,
Increased system resilience and reduced vulnerability
Improved animal conditions reduce methane emissions from enteric fermentation. The efficient treatment of manure can also reduce emissions (and the substitution of manure for inorganic fertilizers can contribute to lower emissions). Improved grazing management methods increase soil organic C content. Silvo-pastoral system increase C sequestration.
Improving feeding practices, use of specific agents or dietary additives; animal breeding increase livestock production efficiency reducing GHG emissions per unit of product
Reducing post harvesting food losses will contribute to lower emissions per unit of food consumed

15
Fishery and aquaculture
Use of fishing practices that adhere to the principles of the Code of Conduct for Responsible Fisheries, adoption of improved aquaculture management approaches (e.g. selection of suitable stock, improved energy efficiency, increasing feeding efficiency switching to herbivorous or omnivorous species reducing the need for fish feed inputs), the integration of aquaculture within broader farming (e.g. sludge produced during the treatment of aquaculture wastewater or pond sediments can be used to fertilize agricultural crops), and replanting mangroves in aquaculture areas.
Increase fish productivity Protect coastline and increase aquaculture and mariculture resilience
Higher input/output ratios therefore increasing GHG efficiency rates
Reduction in the use of inputs that are the main C footprint in aquaculture systems, increasing marine “blue carbon” sinks
Reducing post harvesting food losses will contribute to lower emissions per unit of food consumed
Agroforestry:
Use of trees and shrubs in agricultural farming systems (improved fallows, growing multipurpose trees and shrubs, boundary planting, farm woodlots, plantation/crop combinations, shelterbelts, windbreaks, conservation hedges, fodder banks, live fences, trees on pasture and tree apiculture
Improve soil fertility and soil moisture through increasing soil organic matter, and can help increase farm incomes and diversify production with food security benefits
Trees and shrubs can diminish the effects of extreme weather events, prevent erosion, stabilize soils, raise infiltration rates and halt land degradation, reducing vulnerability
Agro forestry systems tend to sequester much greater quantities of carbon than agricultural systems without trees. Agro-forestry measures increase C storage and may also reduce soil C losses stemming from erosion

16
3. Agriculture investment needs and options for climate-smart agriculture financing in Africa
3.1. Agricultural investment needs and barriers Total agricultural investments in Africa, measured as gross capital formation (GCF)12 increased only from US$20bn to 35bn during the last three decades (UNCTAT, 2009), corresponding to a decrease from 19% to 14% of GDP, despite the fact that the economy in most African countries is agriculture-based, the majority of poor people directly depend on agriculture and this sector is a powerful engine for economic development. Stagnating agricultural commodity prices and low long-term productivity in the sector have not attracted significant private investment in smallholder agriculture and private commercial investments have been skewed towards high value added and non-traditional products (Mhlanga et al. 2010).
Domestic private investments are dominant in scale and scope in the agricultural sector. Governments play an important role in financing agricultural research, extension, monitoring and evaluation, helping link, pool, and crowd-in private flows and making direct strategic investments (Schmidhuber et al. 2009). In most African countries ODA inflows are significantly larger than foreign direct investments (FDI), while FDI are almost 10 times the size of official aid flows in other developing regions (Ratha et al. 2008).
However, FDI in African agriculture are increasing rapidly, posing a number of challenges as well as opportunities. For example, large-scale farmland investments in Africa can promote sustainable agricultural development by financing e.g. investments in road and irrigation infrastructure, inputs, advanced technology and efficient management for sustainable agricultural intensification, even if a World Bank report recently highlighted that farming activities have only started on 21% of the announced farmland investments deals and that local rights were often not respected (WB, 2011).
In general, information on investment needs related to agriculture and climate finance at regional and country level is very limited and may not consider all related investment needs. Basic data come from the work conducted by FAO on agricultural investment requirements until 2050 which considered additional investment needs to address climate change (Schmidhuber et al. 2009), the agriculture-based adaptation cost scenario modeling work conducted by IFPRI for the World Bank report on the Economics of Adaptation to Climate Change (World Bank, 2010), and the IPCC 4th assessment report to estimate agriculture-based mitigation abatement costs (Smith et al. 2009). Also, the analysis of the CAADP investment plans can provide more detailed information on the agricultural investment needs, although such plans usually do not differentiate between public and private investments and unfortunately do not indicate the leveraging capabilities of public investments.
Schmidhuber et al. (2009) estimated that the cumulated agriculture investment needs in Sub-Saharan Africa, North Africa and Near East amounts to US$ 2.1 trillion over the period 2005/07 to 2050 (see Table 3.1), i.e. US$ 48.5 billion per year considering the 44 years time span of the modeling exercise. About half of the investment demand is related to food storage and processing. In the Near East and North Africa substantial investments in irrigation are required. Compared to other regions, agricultural development in Sub-Saharan Africa will depend heavily on additional labor due to predominantly small-scale farming systems. Farms of <2 hectares are pre-dominant in Sub-Saharan Africa13 and therefore offer the biggest potential for climate-smart agricultural development and poverty reduction, as production in the region could be tripled by 2050 (Schmidhuber et al. 2009). In fact, CAADP investment strategies mainly focus on improving the productivity of smallholder family farms. About 70% of the current investment is private, mainly from domestic resources. However, 94% of the research and development is covered from public finance indicating a huge challenge to attract private sector investments to scale up research innovations.
12 Gross capital formation is measured by the total value of the gross fixed capital formation, changes in inventories and acquisitions less disposals of valuables for a unit or sector. 13 Median farm size near 1 hectare in most countries and is expected to decline.

17
Table 3.1: Cumulated agricultural investment needs over 2005/07 to 2050 in billion 2009 US$ in Sub-Saharan Africa, North Africa and Near East
Sub-Saharan Africa Near East/North Africa
Total investment in primary production 496 771
of which in crop production 319 619
- Land development, soil conservation and
flood control
48 7
- Expansion and improvement of irrigation 45 267
- Permanent crops establishment 45 17
- Mechanization 59 300
- Other power sources and equipment 115 14
- Working capital 6 15
of which in livestock production 178 152
- Herd increases 67 37
- Meat and milk production 110 115
total investment in downstream support services 444 422
- Cold and dry storage 78 66
- Rural and wholesale market facilities 159 136
- First stage processing 207 220
Total 940 1193
Source: Schmidhuber et al. 2009
Most agricultural investments in Africa are from smallholder households. Nevertheless, smallholders also face the greatest investment barriers, since they often lack collateral in the form of land titles and fixed asset investments to qualify for loans. In many African countries bank lending to agriculture is smaller 10% (Mhlanga, 2010) and interest rates are relatively high. Physical access to rural banking facilities is still very limited, few banking staff is familiar with agricultural investment requirements and therefore transaction costs related to small individual loans are prohibitive and are major investment barriers. Smallholder farmers also lack skills in book keeping and farm business planning that would enable them to make more informed investment decisions and insurance products to manage production and market risks at the required scale are rarely available despite the existence of demand. Agribusiness companies in Africa often face investment barriers such as poor infrastructure, limited access to venture capital and information on commercially oriented climate-smart technology investment opportunities. Also, the poor business environment causing low risk adjusted returns limits foreign direct investments despite plenty of business opportunities, in particular related to food processing and value adding where foreign know-how and expertise is strongly desired.
In many African countries financial sector reforms and innovative financial services for smallholder farmers are already contributing to overcome such investment barriers as outlined in the next section.

18
3.2 Available financing instruments in the agricultural sector Innovations in rural and agricultural finance and risk management are rapidly evolving in Africa with positive effects in terms of better risk management and lower transaction costs (IFPRI, 2010). Microfinance institutions as well as commercial banks are starting to serve farmers in rural areas and crop insurance products are evolving and structured finance is increasingly providing options for use of alternative collateral to finance investments (FAO, 2009c). However, the pre-condition for smallholder farmers to access finance is that they organize themselves in groups or that finance provider offer cost effective aggregation mechanisms or technologies that lower transaction costs such as mobile phone based payment, loan and saving systems.
Table 3.2 presents financing instruments and their operational modalities at farm level, including requirements for access. Most smallholder farmers can only reinvest profits and their family labor and this of course limits their investment capability and capacity to cope with climate related threats. Debt finance based on loans from microfinance institutions, commercial banks or saving groups are increasingly available for post-harvesting investments (e.g. through the USAID Development Credit Authority where immediate value adding benefits can be generated and the future revenues are predictable). Equity finance requires transparent business cases and a strong legal framework. Therefore, this financing instrument is mainly applied in large-scale agribusiness. However, farmer cooperatives could potentially benefit from equity investments as well. Last, grants and subsidies are important instruments to provide incentives and leverage private sector finance flows in sustainable intensification, forest conservation and adaptation and mitigation investments, and productive safety nets (e.g. food/cash for work programs) can support farmers making long-term investments.
Table 3.2. Financing instruments at farm level
Financing instrument
Modalities
In kind Smallholder farmer can often only invest labor to increase farm productivity. Opportunity costs and basic needs that require cash severely limits investment capabilities
Reinvestment of profits
Important to build capital stocks and to finance inputs and small capital items. Saving schemes operated by groups or women are often most effective due to their financial discipline
Food/cash for work
(productive safety nets)
Enables farmers to invest in climate-smart agricultural practices with long-term benefits in terms of increased productivity and climate benefits (e.g. terracing, small-scale dams and integrated irrigation systems).
Debt finance Loans are not widely accessible for farm productivity and climate resilience enhancing activities. Joint liability groups, structured finance to secure lending, risk insurance and innovative mobile phone financial transaction services can reduce transaction costs and risks, increase access and adoption rates
Equity finance Direct investments in smallholder farming systems are feasible if strong cooperative or social business aggregation structures exist. Respective funding from investors are increasingly available based on supportive governance and regulatory systems
Grants and subsidies Governments can provide incentives and leverage private capital for agricultural and climate-smart investments. Temporary support and complex grant management procedures are often barriers for successful up-scaling
19
3.3. Climate investment needs and financing instruments in the agricultural sector Agricultural adaptation and mitigation investment requirements in Africa
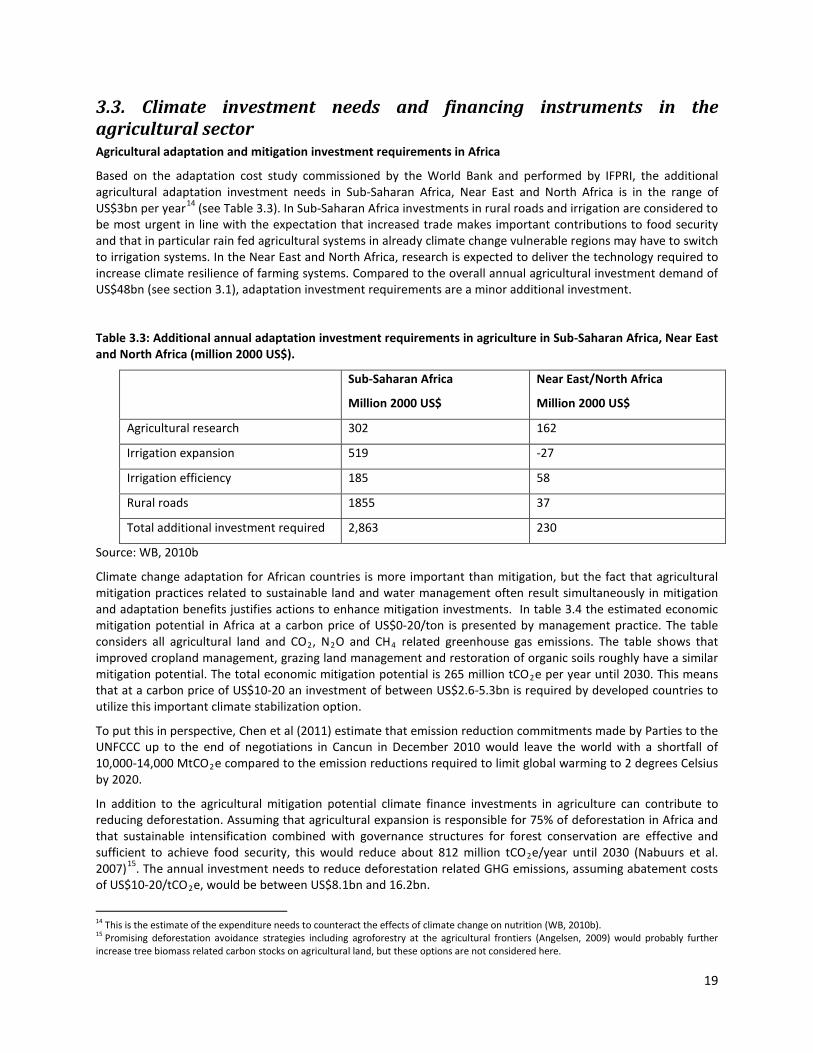
Based on the adaptation cost study commissioned by the World Bank and performed by IFPRI, the additional agricultural adaptation investment needs in Sub-Saharan Africa, Near East and North Africa is in the range of US$3bn per year14 (see Table 3.3). In Sub-Saharan Africa investments in rural roads and irrigation are considered to be most urgent in line with the expectation that increased trade makes important contributions to food security and that in particular rain fed agricultural systems in already climate change vulnerable regions may have to switch to irrigation systems. In the Near East and North Africa, research is expected to deliver the technology required to increase climate resilience of farming systems. Compared to the overall annual agricultural investment demand of US$48bn (see section 3.1), adaptation investment requirements are a minor additional investment.
Table 3.3: Additional annual adaptation investment requirements in agriculture in Sub-Saharan Africa, Near East and North Africa (million 2000 US$).
Sub-Saharan Africa
Million 2000 US$
Near East/North Africa
Million 2000 US$
Agricultural research 302 162
Irrigation expansion 519 -27
Irrigation efficiency 185 58
Rural roads 1855 37
Total additional investment required 2,863 230
Source: WB, 2010b
Climate change adaptation for African countries is more important than mitigation, but the fact that agricultural mitigation practices related to sustainable land and water management often result simultaneously in mitigation and adaptation benefits justifies actions to enhance mitigation investments. In table 3.4 the estimated economic mitigation potential in Africa at a carbon price of US$0-20/ton is presented by management practice. The table considers all agricultural land and CO2, N2O and CH4 related greenhouse gas emissions. The table shows that improved cropland management, grazing land management and restoration of organic soils roughly have a similar mitigation potential. The total economic mitigation potential is 265 million tCO2e per year until 2030. This means that at a carbon price of US$10-20 an investment of between US$2.6-5.3bn is required by developed countries to utilize this important climate stabilization option.
To put this in perspective, Chen et al (2011) estimate that emission reduction commitments made by Parties to the UNFCCC up to the end of negotiations in Cancun in December 2010 would leave the world with a shortfall of 10,000-14,000 MtCO2e compared to the emission reductions required to limit global warming to 2 degrees Celsius by 2020.
In addition to the agricultural mitigation potential climate finance investments in agriculture can contribute to reducing deforestation. Assuming that agricultural expansion is responsible for 75% of deforestation in Africa and that sustainable intensification combined with governance structures for forest conservation are effective and sufficient to achieve food security, this would reduce about 812 million tCO2e/year until 2030 (Nabuurs et al. 2007)15. The annual investment needs to reduce deforestation related GHG emissions, assuming abatement costs of US$10-20/tCO2e, would be between US$8.1bn and 16.2bn.
14 This is the estimate of the expenditure needs to counteract the effects of climate change on nutrition (WB, 2010b). 15 Promising deforestation avoidance strategies including agroforestry at the agricultural frontiers (Angelsen, 2009) would probably further increase tree biomass related carbon stocks on agricultural land, but these options are not considered here.

20
Table 3.4: Economic agricultural mitigation potential in Africa
Economic Mitigation Potential by 2030 at 0-20 US$/tonCO2e (Mt CO2e / yr)
Cropland mgt.
Grazing land mgt.
Restoration organic soils
Restoration degraded land
Other practices
Total
East Africa 28 27 25 13 15 109
Middle Africa 13 12 11 6 7 49
North Africa 6 6 6 3 3 25
South Africa 6 5 5 3 3 22
West Africa 16 15 14 7 8 60
Total 69 (26%) 65 (25%) 61 (23%) 33 (12%) 37 (14%) 265
Source: estimates calculated from data provided by Smith et al (2008)
Existing climate finance instruments: an overview
Under the UNFCCC mitigation and adaptation negotiations, the respective financing streams are treated separately, basically to reduce complexity of negotiations. In the agriculture sector, where a differentiation between adaptation and mitigation benefits is often not possible, this provides challenges but also opportunities to tap into both adaptation and mitigation financing mechanisms.
Climate finance still lacks an internationally agreed definition, but broadly speaking it refers to resources that catalyze low-carbon and climate-resilient development. Financing needs are related to creating an enabling environment including policy development and cross-sectoral planning; capacity building; research and technology transfer; and the implementation and monitoring of mitigation and adaptation practices. Climate finance flows from developed countries to Africa are currently related to the following instruments:
• Clean Development Mechanism (CDM): it successfully leveraged private sector investment in low carbon technology but this did not significantly benefit Africa because it was designed to reduce emissions in large emitting countries and - apart from afforestation/reforestation activities - the land-use sector (agriculture and forestry) was excluded. The CDM commitments 2002-2010 totaled US$27bn and leveraged probably US$100bn in private investment in low carbon technologies. The African continent had a market share of about 4% in the CDM, though most of the CDM projects in Africa were in South Africa.
• Adaptation Fund: mainly financed by a 2 % levy on CDM transactions, it has mobilized globally US$120 million over the period 2002-2010 and funds a number of agriculture-based adaptation projects in Africa.
• Concessional loans and grants related to agriculture-based mitigation and adaptation actions: they are difficult to quantify. Overall aid specifically targeted for climate change according to the OECD-DAC climate markers was US$9.3bn per year between 2008 and 2009, of which Africa received 20% or US$1.86bn (OECD-DAC, 2011). For example, the Green Climate Fund, established to secure long-term climate finance with the goal of mobilizing US$100 billion per year by 2020, has been committed under the Cancun Agreements and is earmarked in the context of meaningful mitigation actions. There are a number of crucial climate-smart agricultural practices that primarily have adaptation benefits and therefore a window for agriculture in these evolving adaptation funds is also important.
In summary, Africa received US$1.86bn in bilateral climate aid in 2009 while adaptation and mitigation costs in the agricultural sector alone are already estimated at US$3bn and US$10.7 respectively (using the lower cost estimate for mitigation abatement costs). This highlights the need to mobilize more international public resources and considering the financial constraints faced by a number of developed countries, it is suggested that leveraging

21
domestic and international private financial flows will be key for climate resilient and low carbon agricultural development in Africa.
3.4. Climate-smart agriculture and potential role of climate financing in Africa Table 3.5 summarizes the agriculture and climate finance related investment needs in Africa. The table of course only provides a first rough indication of investment needs. Some agricultural investments will also have climate benefits and vice versa, which will likely reduce the overall investment needs. Planning, capacity building, research and transaction costs may result in additional investments but these are not considered here.
Table 3.5. Investment needs for agriculture and climate finance potential in Africa
Investment needs in US$/yr Remarks
Agriculture 48bn Without considering climate related investment needs
Adaptation 3bn
Mitigation
- Mitigation potential related to better land and agricultural waste mgmt
2.6 - 5.3bn Assuming abatement costs of US$10-20/tCO2e
- Avoiding 75% of total deforestation in Africa 8.1bn - 16.2bn
Total 61.7bn - 72.5bn
The ability of the majority of smallholders to realize such investments is limited, and private sector investments in smallholder agriculture are constrained by low returns. Also, investments such as in soil fertility or climate resilience in production systems often require upfront investments, while a few years are often needed until the soil fertility and climate resilience benefits lead to increased climate risk adjusted crop yields and higher revenues. However, international climate finance may be able to leverage additional private sector investments, as well as regular national public sector expenditures and overcome investment adoption barriers which can slow down the implementation of innovative agricultural technologies at smallholder level. Also, climate finance could eventually be used to provide loan guarantees for investments with high upfront payments and delayed benefits.
Climate-smart agriculture may constitute an opportunity for the sector to receive additional funding and make up for the lack of resources to access the technology and overcome cost barriers. Also, where adaptation and mitigation practices can increase the returns to or reduce the risk of agricultural investments, and where mitigation benefits can be accounted for and create an additional asset return from the investment (i.e. carbon credits), climate finance may increase the attractiveness to the private sector of investment in agriculture. Climate investments in the sector - if well designed - will mainly benefit small rural households to increase or at least stabilize their capital stocks, which will contribute to accelerate agriculture-led economic development and poverty reduction. However, innovative mechanisms for the delivery of financial services and for blending public and private finance will be required (see section 5.4).
In this frame, there is the need to identify the potential adaptation and mitigation potential of climate-smart agriculture investments. A methodology to analyze agriculture investments plans – with specific reference to CAADP investment plans – and identify climate-related benefits of development activities that could potentially qualify for climate finance is proposed and discussed in the next section.
22
4. A methodology to identify climate-smart activities in CAADP investment plans
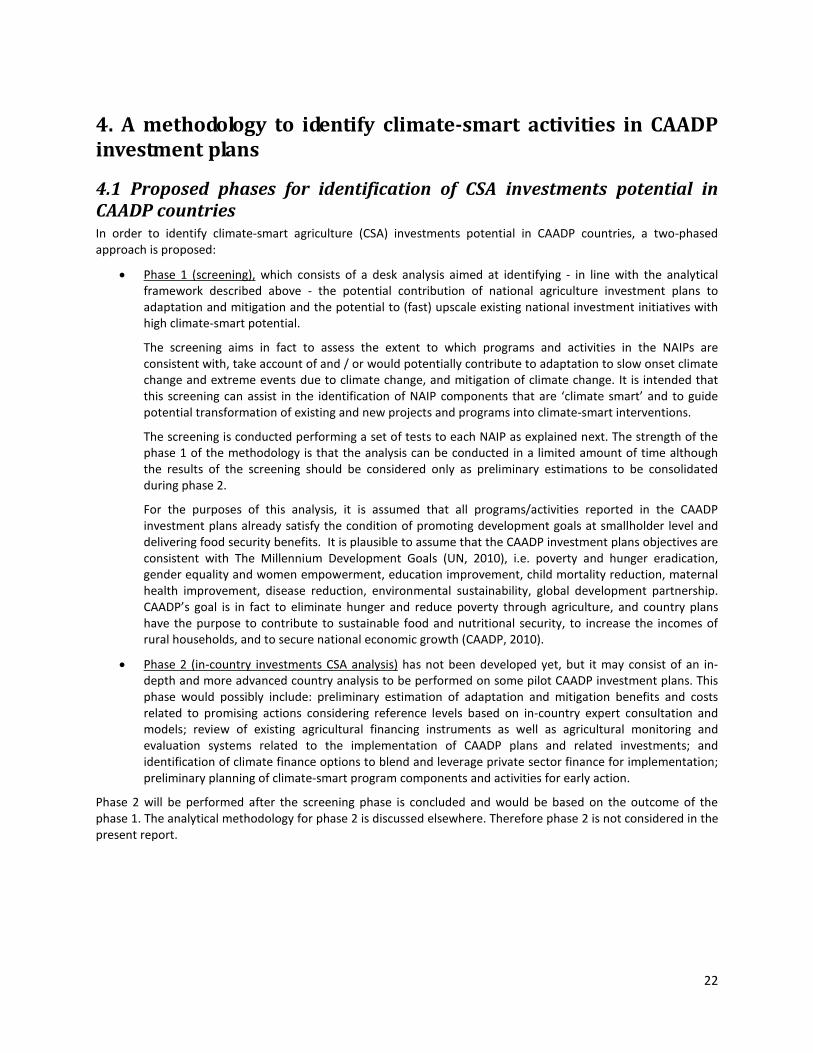
4.1 Proposed phases for identification of CSA investments potential in CAADP countries In order to identify climate-smart agriculture (CSA) investments potential in CAADP countries, a two-phased approach is proposed:
• Phase 1 (screening), which consists of a desk analysis aimed at identifying - in line with the analytical framework described above - the potential contribution of national agriculture investment plans to adaptation and mitigation and the potential to (fast) upscale existing national investment initiatives with high climate-smart potential.
The screening aims in fact to assess the extent to which programs and activities in the NAIPs are consistent with, take account of and / or would potentially contribute to adaptation to slow onset climate change and extreme events due to climate change, and mitigation of climate change. It is intended that this screening can assist in the identification of NAIP components that are ‘climate smart’ and to guide potential transformation of existing and new projects and programs into climate-smart interventions.
The screening is conducted performing a set of tests to each NAIP as explained next. The strength of the phase 1 of the methodology is that the analysis can be conducted in a limited amount of time although the results of the screening should be considered only as preliminary estimations to be consolidated during phase 2.
For the purposes of this analysis, it is assumed that all programs/activities reported in the CAADP investment plans already satisfy the condition of promoting development goals at smallholder level and delivering food security benefits. It is plausible to assume that the CAADP investment plans objectives are consistent with The Millennium Development Goals (UN, 2010), i.e. poverty and hunger eradication, gender equality and women empowerment, education improvement, child mortality reduction, maternal health improvement, disease reduction, environmental sustainability, global development partnership. CAADP’s goal is in fact to eliminate hunger and reduce poverty through agriculture, and country plans have the purpose to contribute to sustainable food and nutritional security, to increase the incomes of rural households, and to secure national economic growth (CAADP, 2010).
• Phase 2 (in-country investments CSA analysis) has not been developed yet, but it may consist of an in-depth and more advanced country analysis to be performed on some pilot CAADP investment plans. This phase would possibly include: preliminary estimation of adaptation and mitigation benefits and costs related to promising actions considering reference levels based on in-country expert consultation and models; review of existing agricultural financing instruments as well as agricultural monitoring and evaluation systems related to the implementation of CAADP plans and related investments; and identification of climate finance options to blend and leverage private sector finance for implementation; preliminary planning of climate-smart program components and activities for early action.
Phase 2 will be performed after the screening phase is concluded and would be based on the outcome of the phase 1. The analytical methodology for phase 2 is discussed elsewhere. Therefore phase 2 is not considered in the present report.

23
4.2 Detailed methodology for phase 1 (screening) The screening is realized at program/sub-program level, i.e. activities, costs (and physical targets) are reported by program/sub-program16. For each NAIP, the analyst sets a matrix with all the programs/sub-programs of the NAIP, listing the activities foreseen in each program/sub-program, the costs17 (and physical targets) and, possibly, available funds and funding gap. The matrix reports the programs and sub-programs foreseen in CAADP investment plans, following the structure of each NAIP, together with the planned activities (in order to make easier to highlight the CSA implications). With reference to a specific program/sub-program, the analyst will also note if there are major projects (at national level or implemented at wide scale) already ongoing in the country and, possibly, if specific financing mechanisms (e.g. subsidies or other economic incentives) are in place18. The NAIPs refer to year periods which are often different among countries: e.g. Rwanda NAIP refers to 2009-12 period, while the Liberia Agriculture Sector Investment Plan makes reference to 2009-2014. However, this does not affect the final results of the screening. The matrix built as described above is used to perform a set of CSA tests:
i. ‘Climate-smartness’ of planned investments ii. CSA investments priority areas iii. Country policy environment for CSA investments
i) Climate-smartness of planned investments test
This test on the climate-smartness of the CAADP National Agriculture Investment Plans (NAIPs), is based on estimating the contribution of programs/sub-programs to adaptation and mitigation. The test consists of identifying the potential adaptation (slow onset and extreme events) and mitigation (absolute GHG reduction, C sequestration, and GHG reduction through increased production efficiency) contribution of each program/sub-program of the investment plans. NAIPs are screened using the following matrix on adaptation and mitigation:
slow onset extreme events GHG reduction C sequestration Efficiency
Adaptation
Climate-smart ag screening matrix
Indicators: resilience, extreme events, GHG reduction and C sequestration, efficiency
Mitigation
The test is conducted on the basis of the general international consensus of the impacts of various agricultural activities on adaptation and mitigation, based on available literature and discussed in the analytical framework for Climate-smart agriculture (see section 2). However, in order to make sure that the identification of the climate benefits is done in a comparable way, the analyst can refer to the tables 2.5 and 2.6.
The matrix highlights if the programs/activities potentially contribute to climate change adaptation (slow onset and extreme events)19 and how, indicating which dimension of systems’ resilience will be increased or which mitigation mechanism is involved (GHG reduction, Carbon sequestration, efficiency increase). The matrix also provides useful elements on the possible financing options, describing expected investment costs and, when possible, the available funds and resource gap (which could provide useful elements on the additionality side). An additional indication of ongoing programs or existing financing mechanisms in place is provided too.
16 For the NAIPs available in French, the programs/sub-programs are reported in French, exactly as in the NAIP, but the analytical matrix (indicators etc.) are in English, together with the final country profiles reporting the results of the analysis. 17 Costs are reported in US$. However, if in the NAIP the costs are reported in local currency, the analyst reports the costs both in local currency and US$, using the official exchange rate. 18 Information about existing financing mechanisms in agriculture is very important to highlight the potential nexus between climate finance and domestic agri-finance, when investigating in terms of how climate finance can provide additional impact to agricultural development, as already discussed in section 2 of the report. 19 There is clearly a wide range of specific situations in farm production systems and adaptation to climate variability appears to be the key element for tropical farming systems, at least in the short to medium term. These issues are not considered at this stage as they require a more in-depth analysis at farming system level so to obtain more specific and system--oriented results. This may be considered in phase 2 of this methodology.

24
Each program/sub-program is screened taking into account the activities planned and checking if they are contributing to adaptation and/or mitigation. Resulting scores are then synthesized through an index representing the total climate benefits potentially gained as a result of the implementation of the NAIP activities, expressed as % of total number of program/sub-program (for ease of computation of the index we assume that 1% = 1).
The plans are also screened in order to verify if there are programs/sub-programs with explicit adaptation and/or mitigation goals factored in, or if the plan has identified climate variability and change as a problem, either explicitly/directly or indirectly (e.g. increased water shortages; increased land degradation; increased pest and diseases which may be caused by climate change etc), but only in a qualitative way. The analysis is completed by suggesting elements which could make the programs/sub-programs more climate-smart (and explaining the rationale). An example of the climate-smartness of planned investments test matrix (and hypothetical indexes) is provided below:
Increased physical
resilience
Increased economic resilience
Increased human and
social resilience
Slow onsetExtreme events
Programs, sub-programs,activities
1 1 1 2 0 1
GHG emissions reduced from
increased efficiency of production (net
balance)
1. Climate-smartness of planned agriculture investments test
Slow onset
Extreme events
Carbon sequest.
(net balance)
GHG emissions reduction
(net balance)
Adaptation
Mitigation
Contribution to climate resilience (adaptation) Contribution to mitigation Summary climate benefits
Activities with explicit adaptation
and/or mitigation
goals factored in
ii) CSA investments priority areas test
This second test takes into account the investment areas which are considered as CSA priorities both at general level (for all farming systems in all agro ecological zones) and at national level (i.e. specific priorities identified with reference to the local climate conditions). The test is therefore made of two components:
a) Global – The analyst examines the NAIPs estimating how much of the plan resources/costs is allocated to investment areas which are considered as strategic priorities for CSA production, namely: sustainable land management (SLM) including pasture and grazing management, improved water management (including irrigation), increased fertilizer efficiency, improved seed production and use, improved livestock management, enhanced fishery production, improved marketing/storage/processing, research and technical support to farmers, institutional support, enhanced infrastructure, social welfare improvement and disaster management. The analyst quantifies the investments planned (targets or costs depending on the data available) in those priority areas20 and builds an index which measures how much of the plan is oriented to those priority investment areas. For example, giving the costs per investment areas, it is estimated which % of total costs is allocated to priority investment areas and an index is computed accordingly (for ease of computation of the index it is assumed that 1% = 1).
b) National – The analyst tests if the NAIPs are contributing to the National Adaptation Programs of Action (NAPAs). NAPAs provide in fact an important way to prioritize urgent and immediate adaptation needs for Least Developed Countries-LDC21. The analyst will check if the investments planned in NAIPs are
20 Being this categorization of priority investment areas different from the one provided in the NAIP, the allocation of costs will be done by the analyst based on expert judgment. Costs will be divided among priority investment areas proportionally to the physical targets (when available) or simply splitting the costs among the thematic areas (e.g. 50% of the costs to 2 thematic areas, 25% of the costs to 4 thematic areas, etc.). The analyst will make a note explaining the cost allocation rule applied. 21 Article 4.9 of the United Nations Framework Convention on Climate Change (UNFCCC) recognizes the special situations of the Least Developed Countries (LDCs), and states: "The Parties shall take full account of the specific needs and special situations of the Least Developed Countires in their actions with regard to funding and transfer of technology". NAPAs provide a process for LDCs to identify priority activities that respond to their urgent and immediate needs with regard to adaptation to climate change and focus on urgent and immediate needs - those for which further delay could increase vulnerability or lead to increased costs at a later stage. Source: http://unfccc.int/adaptation/items/4159.php.

25
contributing to the NAPAs. For example, if NAPA includes agriculture in general as a priority vulnerable sector, then it is possible to include all investments aimed at increasing agricultural production and exclude investments e.g. in roads, storage and processing, marketing and credit. On a more operational side, the analyst may refer to the NAPA priorities. The database of all submitted NAPAs is available online at the UNFCCC22, together with all NAPA priority adaptation projects sorted by country and sector23. In case the NAPA plan is not available for a specific country, this second part of the CSA investments priority areas test is not performed.
iii) Country policy environment for CSA investments test
This test considers aspects which are key in driving investment choices in agriculture, such as: private sector readiness, country policy environment, successful experiences of ongoing agriculture projects/programs and institutional capacity. The test is made of two components:
a) Private sector readiness – Although not specifically related to agriculture, the test makes reference to the “Doing business economy ranking”24 developed by the World Bank. Country economies are ranked on their ease of doing business (from 1 to 183): a high ranking on the ease of doing business index means the regulatory environment is more conducive to the starting and operation of a local firm. This index provides a quantitative measure of regulations for starting a business, dealing with construction permits, registering property, getting credit, protecting investors, paying taxes, trading across borders, enforcing contracts and closing a business—as they apply to domestic small and medium-size enterprises. It also looks at regulations on employing workers. The rankings for all economies are benchmarked to June 201025.
b) ‘Potential for quick deployment’ – This is a qualitative test which takes into account the ‘potential for quick deployment’ of climate-smart agriculture investments in the country and includes different elements: first, consistency of NAIP activities with policies and development strategies/plans in the agriculture sector (e.g. food security and nutrition strategy, rural credit, land tenure) and with policies in other closely related sectors (e.g. enterprise and business policy, trade); second, presence of a successful basis to draw on such as ongoing donor projects - which are national or large in scale - that might demonstrate what works and how or other initiatives which could make easier and faster scaling up of climate-smart programs (e.g. CSIF - Country sustainable land management investment framework developed by a number of countries under the NEPAD-TerrAfrica support; GAFSP active windows - Global Agriculture and Food Security Program; A-SWAp implementation - Agriculture Sector-Wide Approach); third, strengths and weaknesses of country institutional capacity of agricultural sector (which may be key for the implementation of up scaled climate-smart agriculture investments).
Running this test properly is therefore not an easy task as this would require in-country experience and knowledge of national institutions capacity and appropriate desk-research on additional documentation, e.g. a list of other agriculture strategies and policies which are consistent with the NAIP, a list of ongoing national or donor projects which directly contribute to the NAIP’s sub-programs, a list of supportive policies in other sectors. However, for the purposes of the quick screening of CAADP NAIPs, the test only consists of a quick qualitative assessment based on expert judgment (a proper country analysis may be developed in phase 2). The analyst ranks the NAIP from ‘low’ to ‘high’ depending on the perceived level of favorableness of the policy environment and of the potential to upscale existing programs, providing a rationale for it.
Here is an example of the Country policy environment for climate-smart agriculture investments test matrix:
Private sector readinessPotential for quick deployment of climate-smart
agriculture investmentsRationale
Doing Business 2011 Rank Expert judgment: low/medium/high qualitative information 22 http://unfccc.int/cooperation_support/least_developed_countries_portal/submitted_napas/items/4585.php 23 http://unfccc.int/cooperation_support/least_developed_countries_portal/napa_priorities_database/items/4583.php 24 http://www.doingbusiness.org/rankings 25 Source: http://www.doingbusiness.org/methodology/methodology-note#Ease%20of%20DB

26
5. Preliminary results from the screening of Agricultural Investment Plans The screening methodology described above (see section 4.2) has been applied to the national agricultural investment plans (NAIPs) of 14 countries. The NAIPs were prepared in the context of CAADP compacts, part of an initiative to pursue higher economic growth through agriculture-led development. The screening has been conducted on the country plans for which the CAADP process has been finalized and the NAIPs reviewed, as reported in the following table 5.1.
Table 5.1. List of the NAIPs taken into account in Phase 1 (screening)
Benin NigerEthiopia NigeriaGambia RwandaGhana SenegalKenya Sierra LeoneLiberia TogoMalawi Uganda
Table 5.2 reports main findings of the screening by country while a comprehensive discussion of these findings is reported in section 6. Full description of the results by country NAIP is provided in the country profiles reported in the Annexes to this report (see section 8).
Table 5.2. Main findings of the screening: a synoptic table
Benin (see section 8.1)
Benin Agricultural Investment Plan (PIA, 2010-15)
All programs of the PIA contribute to adaptation to climate change, mostly to slow onset adaptation. According to the plan there is little potential for carbon sequestration and GHG emissions reduction, but there is a potential to GHG emissions per unit of production. The PIA contributes mainly to improved production systems (56% of total planned investment costs) with a focus on water management which is key for CSA development. The Benin PIA is not very consistent with the NAPA as it only contributes to NAPA priority number 3 on the mobilization to surface water. It is remarkable that the establishment of a climate risk, early warning system has not been budgeted for in the PIA, although this also is a priority in the NAPA
Ethiopia (see section 8.2)
Ethiopian Agricultural Sector Policy and Investment Framework (PIF, 2010-20)
Adaptation to climate variability and slow onset climate change is the major potential benefit of the PIF, mainly because in this highly food insecure country, most PIF components would improve food production, productivity, food availability and agriculture-based income generation. None of the programs has direct implications on GHG emission reduction. However, by emitting less GHG per unit produced through more efficient production and greater productivity (higher yields per area) there is a potential positive effect on mitigation. With major sub-components focused on irrigation, soil fertility and input supply about half of the investment is supposed to be directed to the production side, whereas the bulk is foreseen in irrigation investments (28%). PIF is in line with NAPA priorities and consistent with its overall goals and objectives

27
Gambia (see section 8.3)
Gambia National Agricultural Investment Program (GNAIP, 2010-15)
GNAIP could potentially deliver significant benefits for adaptation to slow onset climate change while some programs also have strong benefits for adaptation to extreme events. A relatively larger proportion of components have potential mitigation benefits, mainly because the GNAIP includes agroforestry, rangeland development, forestry and parks management (increased carbon sequestration). Irrigation and water management activities are assumed to reduce the GHGs emitted per unit of grain produced if they can succeed in increasing the area under high productivity rice production. With major sub-components focused on ‘Integrated Soil Fertility Management’ as well as production in relation to development of agricultural food chains, irrigation and water management, about a quarter of the planned investment would contribute directly to improved agricultural production practices. GNAIP is quite consistent with The Gambia’s NAPA.
Ghana (see section 8.4)
Ghana Medium Term Agriculture Sector Investment plan (METASIP) (2011-15)
All components of METASIP have been identified as contributing to climate change adaptation, mostly enhancing human and economic resilience to climate variability and gradual climate change (some components enhance abilities to cope with extreme events). A number of components have potential mitigation benefits (carbon sequestration and unitary reduction of emissions due to increased production efficiency) although there is no component with direct impact to reduce GHG emissions in absolute terms. Major investments are foreseen to improve production (42%) and infrastructures (30%) with the intention to improve transport system and feeder roads (improvements in the value chain, from production to storage and processing).
Kenya (see section 8.5)
Kenya Medium Term Investment Plan (MTIP, 2010-2015)
Adaptation to climate variability is the major potential climate benefit of the MTIP, realized mostly through agriculture production improvements, rangeland management, improved water management, fertilizer and seed programs and improved breeding and fishing. Early warnings systems and climate change adaptation measures are specifically addressed and programs have been differentiated between high rainfall areas, semi arid and dry areas. Major climate related issues have been considered and there is a fairly well consistency with other plans. Some activities have potential mitigation benefits, e.g. through better livestock and range management or conservation agriculture
Liberia (see section 8.6)
Liberia Agricultural Sector Investment Plan (LASIP, 2009-14)
Most of the climate benefits of LASIP are in adaptation to climate change and extreme events. Sub-program 2 Food and Nutrition Security’ also has some potential mitigation benefits. LASIP, consistently with other food, nutrition and poverty reduction strategies, has a balanced focus of investment on support for agricultural production and improving the institutional and physical infrastructure for productive agriculture. As suggested in the NAPA, aspects of agricultural production to be promoted under LASIP that could contribute to enhanced climate resilience include: timing of crop cultivation in response to changing patterns of rainfall; intercropping, irrigation, and the optimization of lowland/swamp farming practices; pest control; and maintaining fast growing nitrogen fixing tree species to improve soil fertility and using multiple-purpose tree species on farmlands to maintain forest cover. Another area of integration between the NAPA and LASIP relates to the promotion of and investment in wetlands.
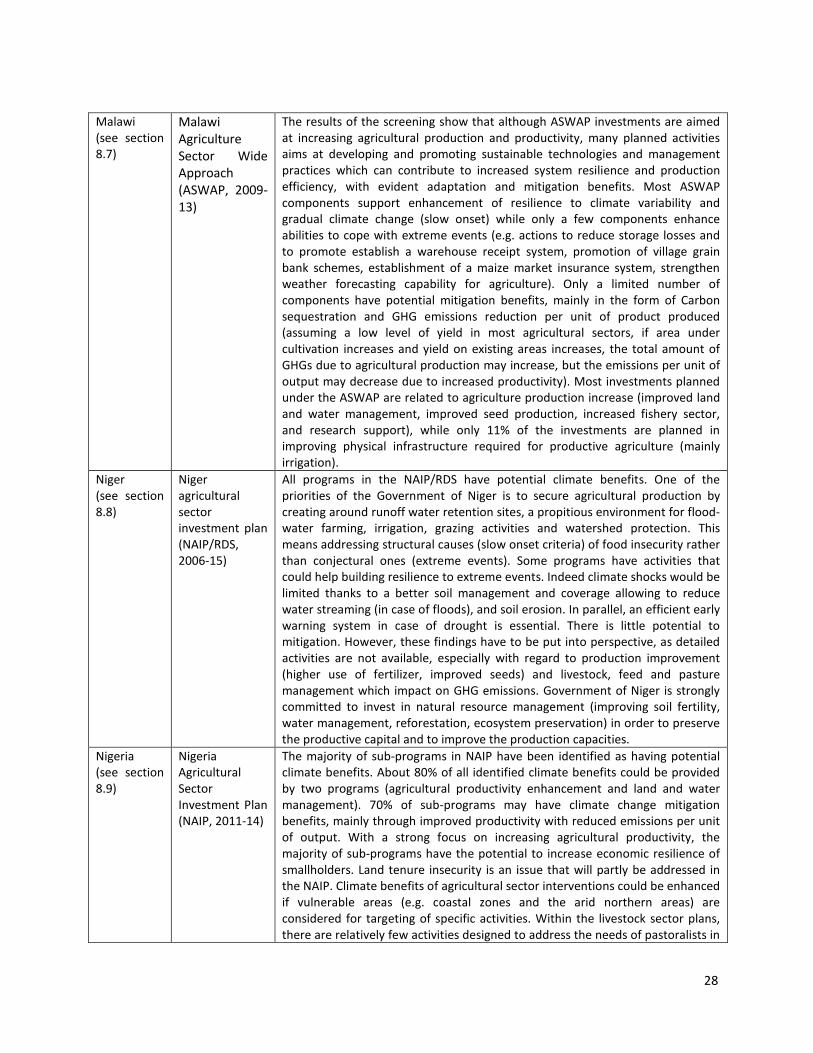
28
Malawi (see section 8.7)
Malawi Agriculture Sector Wide Approach (ASWAP, 2009-13)
The results of the screening show that although ASWAP investments are aimed at increasing agricultural production and productivity, many planned activities aims at developing and promoting sustainable technologies and management practices which can contribute to increased system resilience and production efficiency, with evident adaptation and mitigation benefits. Most ASWAP components support enhancement of resilience to climate variability and gradual climate change (slow onset) while only a few components enhance abilities to cope with extreme events (e.g. actions to reduce storage losses and to promote establish a warehouse receipt system, promotion of village grain bank schemes, establishment of a maize market insurance system, strengthen weather forecasting capability for agriculture). Only a limited number of components have potential mitigation benefits, mainly in the form of Carbon sequestration and GHG emissions reduction per unit of product produced (assuming a low level of yield in most agricultural sectors, if area under cultivation increases and yield on existing areas increases, the total amount of GHGs due to agricultural production may increase, but the emissions per unit of output may decrease due to increased productivity). Most investments planned under the ASWAP are related to agriculture production increase (improved land and water management, improved seed production, increased fishery sector, and research support), while only 11% of the investments are planned in improving physical infrastructure required for productive agriculture (mainly irrigation).
Niger (see section 8.8)
Niger agricultural sector investment plan (NAIP/RDS, 2006-15)
All programs in the NAIP/RDS have potential climate benefits. One of the priorities of the Government of Niger is to secure agricultural production by creating around runoff water retention sites, a propitious environment for flood-water farming, irrigation, grazing activities and watershed protection. This means addressing structural causes (slow onset criteria) of food insecurity rather than conjectural ones (extreme events). Some programs have activities that could help building resilience to extreme events. Indeed climate shocks would be limited thanks to a better soil management and coverage allowing to reduce water streaming (in case of floods), and soil erosion. In parallel, an efficient early warning system in case of drought is essential. There is little potential to mitigation. However, these findings have to be put into perspective, as detailed activities are not available, especially with regard to production improvement (higher use of fertilizer, improved seeds) and livestock, feed and pasture management which impact on GHG emissions. Government of Niger is strongly committed to invest in natural resource management (improving soil fertility, water management, reforestation, ecosystem preservation) in order to preserve the productive capital and to improve the production capacities.
Nigeria (see section 8.9)
Nigeria Agricultural Sector Investment Plan (NAIP, 2011-14)
The majority of sub-programs in NAIP have been identified as having potential climate benefits. About 80% of all identified climate benefits could be provided by two programs (agricultural productivity enhancement and land and water management). 70% of sub-programs may have climate change mitigation benefits, mainly through improved productivity with reduced emissions per unit of output. With a strong focus on increasing agricultural productivity, the majority of sub-programs have the potential to increase economic resilience of smallholders. Land tenure insecurity is an issue that will partly be addressed in the NAIP. Climate benefits of agricultural sector interventions could be enhanced if vulnerable areas (e.g. coastal zones and the arid northern areas) are considered for targeting of specific activities. Within the livestock sector plans, there are relatively few activities designed to address the needs of pastoralists in
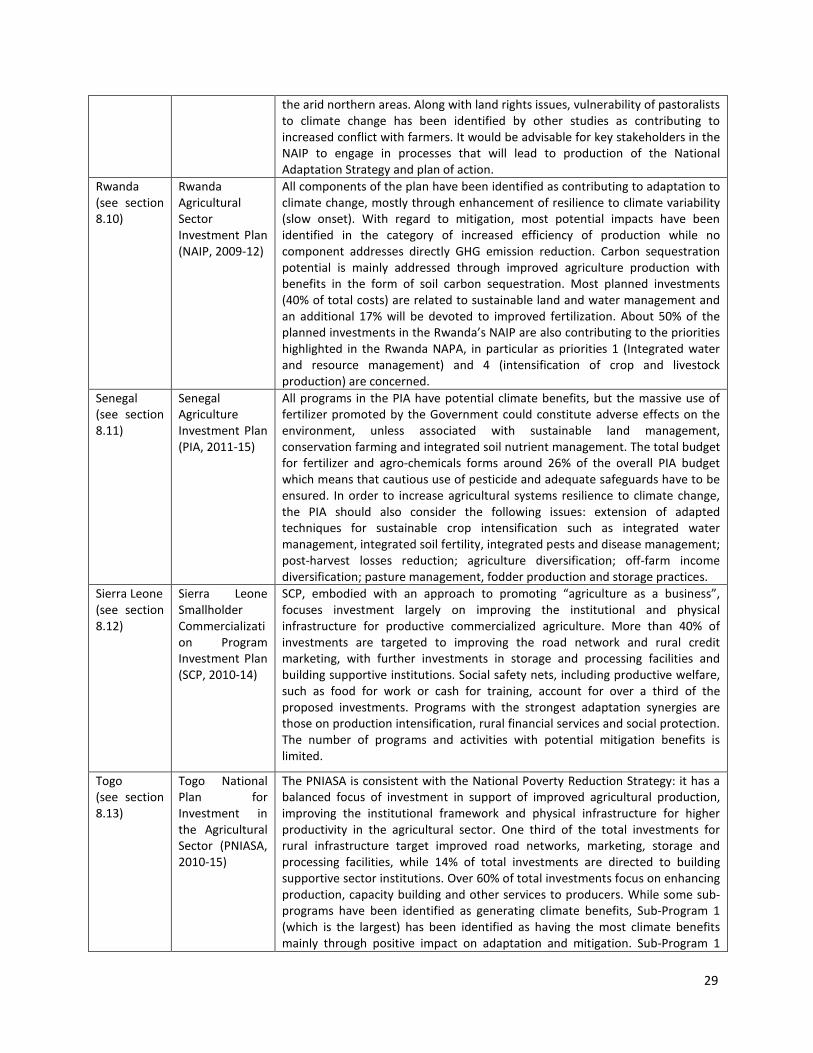
29
the arid northern areas. Along with land rights issues, vulnerability of pastoralists to climate change has been identified by other studies as contributing to increased conflict with farmers. It would be advisable for key stakeholders in the NAIP to engage in processes that will lead to production of the National Adaptation Strategy and plan of action.
Rwanda (see section 8.10)
Rwanda Agricultural Sector Investment Plan (NAIP, 2009-12)
All components of the plan have been identified as contributing to adaptation to climate change, mostly through enhancement of resilience to climate variability (slow onset). With regard to mitigation, most potential impacts have been identified in the category of increased efficiency of production while no component addresses directly GHG emission reduction. Carbon sequestration potential is mainly addressed through improved agriculture production with benefits in the form of soil carbon sequestration. Most planned investments (40% of total costs) are related to sustainable land and water management and an additional 17% will be devoted to improved fertilization. About 50% of the planned investments in the Rwanda’s NAIP are also contributing to the priorities highlighted in the Rwanda NAPA, in particular as priorities 1 (Integrated water and resource management) and 4 (intensification of crop and livestock production) are concerned.
Senegal (see section 8.11)
Senegal Agriculture Investment Plan (PIA, 2011-15)
All programs in the PIA have potential climate benefits, but the massive use of fertilizer promoted by the Government could constitute adverse effects on the environment, unless associated with sustainable land management, conservation farming and integrated soil nutrient management. The total budget for fertilizer and agro-chemicals forms around 26% of the overall PIA budget which means that cautious use of pesticide and adequate safeguards have to be ensured. In order to increase agricultural systems resilience to climate change, the PIA should also consider the following issues: extension of adapted techniques for sustainable crop intensification such as integrated water management, integrated soil fertility, integrated pests and disease management; post-harvest losses reduction; agriculture diversification; off-farm income diversification; pasture management, fodder production and storage practices.
Sierra Leone (see section 8.12)
Sierra Leone Smallholder Commercialization Program Investment Plan (SCP, 2010-14)
SCP, embodied with an approach to promoting “agriculture as a business”, focuses investment largely on improving the institutional and physical infrastructure for productive commercialized agriculture. More than 40% of investments are targeted to improving the road network and rural credit marketing, with further investments in storage and processing facilities and building supportive institutions. Social safety nets, including productive welfare, such as food for work or cash for training, account for over a third of the proposed investments. Programs with the strongest adaptation synergies are those on production intensification, rural financial services and social protection. The number of programs and activities with potential mitigation benefits is limited.
Togo (see section 8.13)
Togo National Plan for Investment in the Agricultural Sector (PNIASA, 2010-15)
The PNIASA is consistent with the National Poverty Reduction Strategy: it has a balanced focus of investment in support of improved agricultural production, improving the institutional framework and physical infrastructure for higher productivity in the agricultural sector. One third of the total investments for rural infrastructure target improved road networks, marketing, storage and processing facilities, while 14% of total investments are directed to building supportive sector institutions. Over 60% of total investments focus on enhancing production, capacity building and other services to producers. While some sub- programs have been identified as generating climate benefits, Sub-Program 1 (which is the largest) has been identified as having the most climate benefits mainly through positive impact on adaptation and mitigation. Sub-Program 1
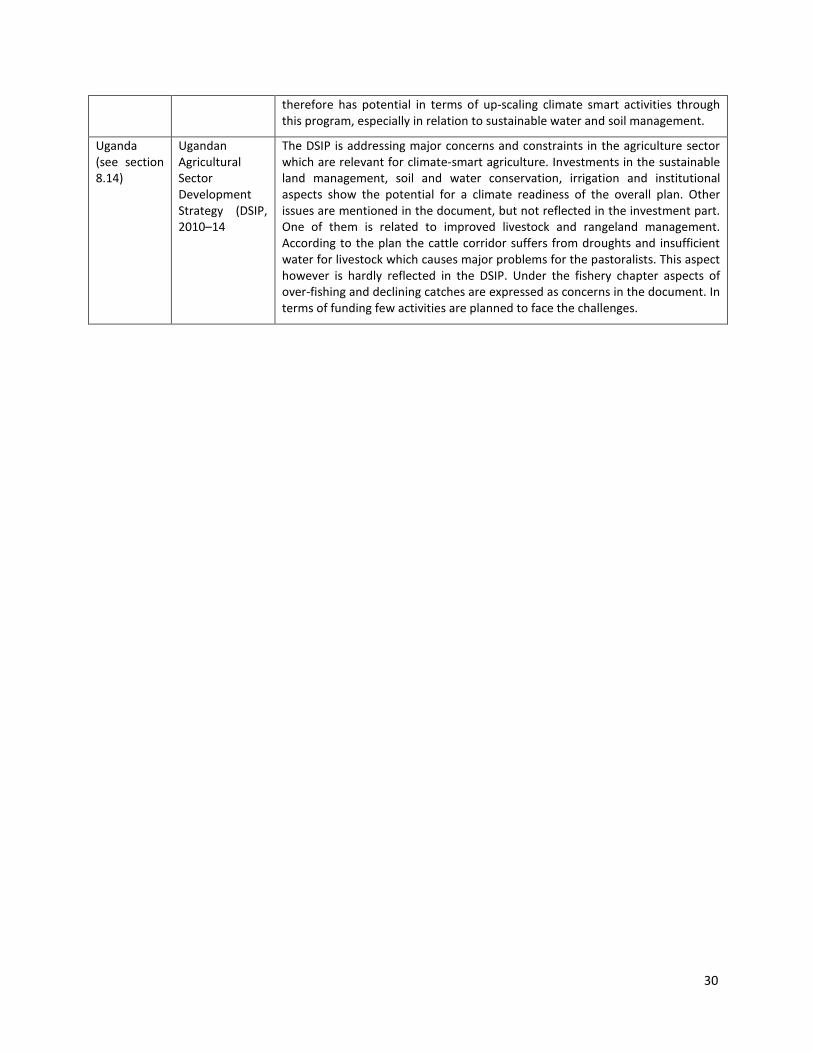
30
therefore has potential in terms of up-scaling climate smart activities through this program, especially in relation to sustainable water and soil management.
Uganda (see section 8.14)
Ugandan Agricultural Sector Development Strategy (DSIP, 2010–14
The DSIP is addressing major concerns and constraints in the agriculture sector which are relevant for climate-smart agriculture. Investments in the sustainable land management, soil and water conservation, irrigation and institutional aspects show the potential for a climate readiness of the overall plan. Other issues are mentioned in the document, but not reflected in the investment part. One of them is related to improved livestock and rangeland management. According to the plan the cattle corridor suffers from droughts and insufficient water for livestock which causes major problems for the pastoralists. This aspect however is hardly reflected in the DSIP. Under the fishery chapter aspects of over-fishing and declining catches are expressed as concerns in the document. In terms of funding few activities are planned to face the challenges.
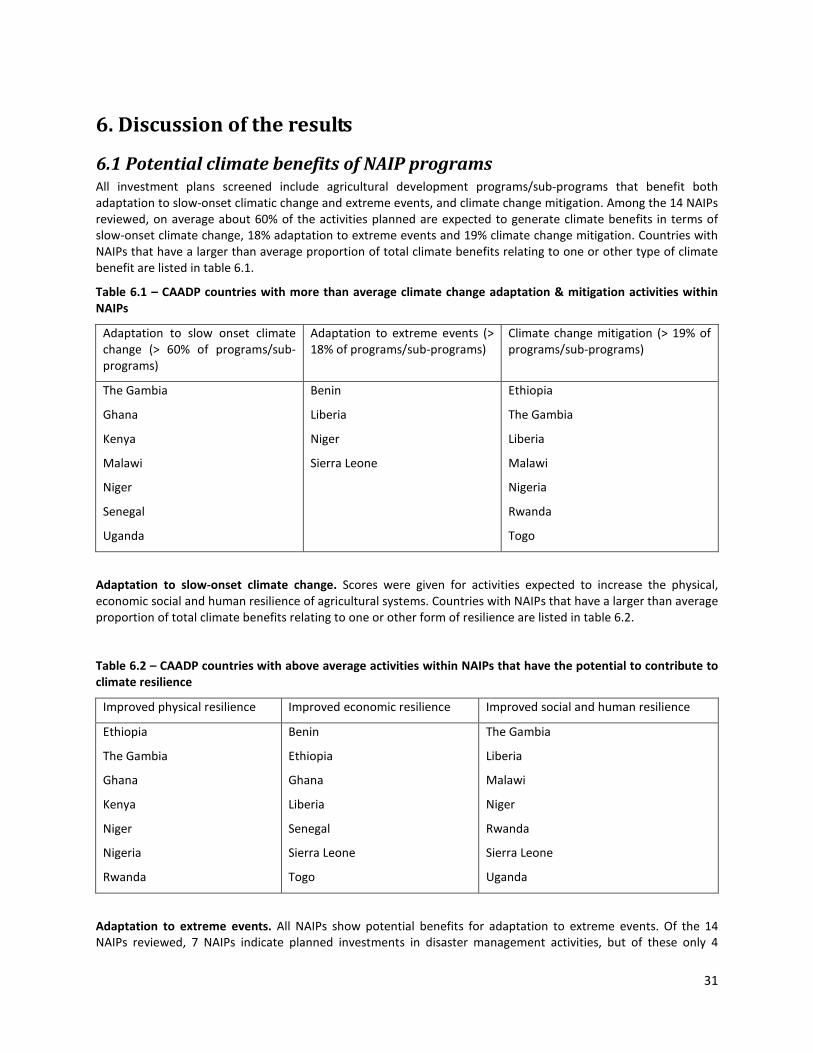
31
6. Discussion of the results
6.1 Potential climate benefits of NAIP programs All investment plans screened include agricultural development programs/sub-programs that benefit both adaptation to slow-onset climatic change and extreme events, and climate change mitigation. Among the 14 NAIPs reviewed, on average about 60% of the activities planned are expected to generate climate benefits in terms of slow-onset climate change, 18% adaptation to extreme events and 19% climate change mitigation. Countries with NAIPs that have a larger than average proportion of total climate benefits relating to one or other type of climate benefit are listed in table 6.1.
Table 6.1 – CAADP countries with more than average climate change adaptation & mitigation activities within NAIPs
Adaptation to slow onset climate change (> 60% of programs/sub-programs)
Adaptation to extreme events (> 18% of programs/sub-programs)
Climate change mitigation (> 19% of programs/sub-programs)
The Gambia
Ghana
Kenya
Malawi
Niger
Senegal
Uganda
Benin
Liberia
Niger
Sierra Leone
Ethiopia
The Gambia
Liberia
Malawi
Nigeria
Rwanda
Togo
Adaptation to slow-onset climate change. Scores were given for activities expected to increase the physical, economic social and human resilience of agricultural systems. Countries with NAIPs that have a larger than average proportion of total climate benefits relating to one or other form of resilience are listed in table 6.2.
Table 6.2 – CAADP countries with above average activities within NAIPs that have the potential to contribute to climate resilience
Improved physical resilience Improved economic resilience Improved social and human resilience
Ethiopia
The Gambia
Ghana
Kenya
Niger
Nigeria
Rwanda
Benin
Ethiopia
Ghana
Liberia
Senegal
Sierra Leone
Togo
The Gambia
Liberia
Malawi
Niger
Rwanda
Sierra Leone
Uganda
Adaptation to extreme events. All NAIPs show potential benefits for adaptation to extreme events. Of the 14 NAIPs reviewed, 7 NAIPs indicate planned investments in disaster management activities, but of these only 4

32
countries (Ethiopia, The Gambia, Sierra Leone and Liberia) foresee significant investments on disaster risk reduction and prevention, e.g. by establishing early warning systems and storage systems for emergency food supplies. Many NAIPs include planned investments in irrigation which may also support adaptation to droughts and floods, but these investments are not categorized together with disaster management investments. A number of countries may have disaster risk prevention policies and plans outside the agriculture sector, but these were not within the scope of this screening exercise.
Consistency with NAPAs. 11 of the 14 countries screened have NAPAs. On average about 54% of planned NAIP investments are consistent with the priorities of the NAPAs. Some NAIPs have a high proportion of planned investments that are consistent with NAPA priorities. Countries where more than half of NAIP planned investments are consistent with their NAPA include The Gambia, Liberia, Malawi, Niger, Rwanda, Senegal and Togo. Several NAPAs list agriculture as a priority vulnerable sector and some priority actions raised within the context of NAPA funding target agricultural activities. A comparison of NAPAs and NAIPs for several countries suggests, however, that there has been limited attempt to link or coordinate climate and agricultural planning in the development of these documents.
Climate change mitigation. All NAIPs have some potential benefits for mitigation of climate change. Around 70% of the potential mitigation benefits are related to reduction of GHG emissions per unit of output and about 30% to carbon sequestration (mainly soil carbon sequestration). Only 3 NAIPs propose activities that might deliver absolute decreases in GHG emissions. In addition to cropland mitigation options (e.g. soil fertility management) and other sustainable land management activities (e.g. agro forestry, rangeland management) that might sequester carbon, some NAIPs include activities in the forestry and national parks sectors focusing on unsustainable agriculture as the main driver for deforestation and forest degradation. Activities that have potential to reduce absolute emissions of GHGs are mainly renewable energy ones. Given that agricultural output is growing in most of the countries considered in the analysis, and that the NAIPs aim to further enhance yields, the majority of potential climate benefits could potentially be accounted for in terms of lower GHG emissions per unit of output, although internationally agreed methodologies to account for these benefits have yet to be developed. Countries with NAIPs that show a larger than average proportion of total mitigation related benefits from sequestration, GHG emission reductions and reductions in emission intensity are listed in table 6.3.
Table 6.3 – CAADP countries with above average climate change mitigation activities within NAIPs
Carbon sequestration Reduced absolute emissions Reduced emission intensity
Ethiopia
Ghana
Niger
Rwanda
Kenya
Senegal
Togo
Benin
The Gambia
Liberia
Nigeria
Rwanda
Sierra Leone
Togo
Uganda
6.2 Investment readiness for Climate-smart agriculture in screened NAIPs Many NAIPs contain programs designed to support commercialization in the agricultural sector, either directly involving smallholders or through support to agriculture related businesses along the value chains. Some NAIPs specifically mention the adoption of Public Private Partnerships as a modality for engaging the private sector in implementation of the NAIP, while some others mention policies and plans outside the agriculture sector that

33
would be supportive of private sector investments in the agricultural sector. The NAIPs of several countries are integrated and consistent with wider national long-term development strategies (e.g. PRSPs), and some are operating sector-widely adopting specific mechanisms such as basket-funding approaches proposed for implementation of the NAIP.
Table 6.4 gives an indication of the ease of doing business in each of the countries screened and a subjective assessment of the potential for quick deployment of climate smart agricultural practices in each country. The specific justifications for the qualitative judgment are included in the screening matrixes but the quick deployment potential was more likely to be categorized as ‘medium’ or ‘high’ for countries:
• that allocate a higher proportion of budgets to agriculture;
• whose NAIP is well integrated into other agricultural and cross-government strategies, policies and programs;
• where NAIP documents include activities explicitly addressing the potential implementation risks; and
• where government implementation capacities appear to be stronger.
These tend also to be countries that have been ranked relatively higher in the ease of doing business analysis.
Table 6.4 – CAADP countries doing business ranking and quick climate-smart activity deployment potential
Doing business rank Quick deployment potential
Benin 170 Low
Ethiopia 104 Medium
The Gambia 146 Low
Ghana 67 High
Kenya 98 High
Liberia 155 Low
Malawi 133 Medium-High
Niger 173 Low
Nigeria 137 Medium-High
Rwanda 58 Medium-high
Senegal 152 Low
Sierra Leone 143 Medium
Togo 160 Medium
Uganda 122 Medium
6.3 Linking NAIPs with financing sources Interest in supporting climate-smart development comes from a range of sources. While much traditional ODA remains focused on the basics of development and to achieve the MDGs, there is also interest among development partners to make their ODA investments more climate-smart, and to support national governments in linking agriculture and climate adaptation planning. Some development partners and international financial agencies have specific interest in disaster risk reduction, which may be closely linked to adaptation to extreme
34
events. Beyond ODA and traditional international development finance, climate finance options to support adaptation and mitigation are emerging. Also, the fragmented and diverse financial resources and mechanisms available for the implementation of the CAADP investment plans highlight the need to strengthen related financial, as well as agricultural monitoring and evaluation, capacity within existing government institutions and the private sector.
While also NAIPs present an estimate of planned expenditures, data which might enable estimation of a financing gap was not presented in sufficiently consistent manners to enable a summary of the financial gaps of the 14 countries screened. This prevents a detailed assessment of finance gaps that might be met from different sources of finance. However, the following general points can be made:
• all countries propose that national funds contribute to implementation of the NAIP. Not all countries have yet met the 10% budget allocation to agriculture called for in the Maputo Declaration;
• most NAIPs explicitly aim to increase private sector investment through supportive NAIP investments. However, countries differ greatly in the extent to which they have demonstrated an ability to attract foreign or domestic private investment in their agriculture sectors, and in some cases, such investment is mostly in export-oriented sectors, where the potential benefits for climate adaptation among smallholders are low;
• some NAIPs propose to incorporate existing donor funded projects in the potential funding sources, and some countries propose a basket-funding strategy that brings existing donor commitments together with potential future donor finance;
• most NAIPs plan significant investments in public agricultural institutions and infrastructure. Such investments, if designed in a climate-smart way, can provide strong climate benefits;
• all NAIP components with agriculture development goals. The components with strong synergies with climate change adaptation or mitigation would therefore provide good opportunities for traditional ODA funds to support climate-smart development actions;
• on average, about half of NAIP planned investments are consistent with NAPAs that were specifically designed to address climate change adaptation (for some NAIPs, more than 80% of planned investments are consistent with the NAPA). This suggests that in some countries, climate adaptation funding could very well support implementation of the NAIPs; and
• mitigation benefits accounted for about 20% of the potential climate benefits identified. Also, 70% of these potential mitigation benefits relate to decreased GHG emissions per unit of output, and internationally agreed methodologies for accounting for these kind of mitigation benefits do not yet exist. This implies that mitigation finance has limited opportunities to support implementation of the NAIPs.
6.4 The way forward Preliminary results of phase I analysis (desk screening) highlight that NAIPs already include many climate-smart activities. However, there is the need to consolidate and integrate these findings by providing country-specific inputs such as:
• analyzing the most promising CSA agricultural investment options based on the NAIPs and estimating their cost-effectiveness also considering the expected climate benefits;
• outlining investments needed to transform ongoing and planned programs, activities and projects into proper climate-smart interventions, also identifying the corresponding (public and private) financing sources;
• analyzing the profitability of the investments in order to determine the type of finance required. Different cases exist with different implications in terms of financing options and needs:
35
- CSA investments with risk adjusted returns allowing access to finance at reasonable commercial rates (only capacity building and knowledge barriers need to be removed to enable farmers to adopt CSA technologies);
- CSA investments eventually profitable but requiring transition cost support (short term transfer needs);
- CSA investments publically desirable (positive externalities generated) and economically viable, but not profitable (long term transfer needs, including international); and
- CSA investments in farming systems which are already very vulnerable to climate change (where farming may not be viable anymore in the future at least for the same groups of people. This special case may require resources for a radical change (e.g. education to allow people to transition to alternative income generation activities).
• exploring existing agricultural financing vehicles and institutional settings and examining options to link, blend and leverage existing financing instruments in agriculture with innovative climate financing mechanisms which would be suitable for NAIPs. For example, existing financing vehicles that could be used to implement CSA within the framework of the NAIP range from dedicated funds under the Ministry of Agriculture, national community and social development funds that can finance local initiatives that contribute to climate resilience, World Bank managed climate investment funds such as the pilot program for climate resilience, CSA credit lines from local commercial banks or microfinance institutions potentially with loan guarantees from international climate finance or private sector managed climate funds providing transition subsidize such as the Africa Enterprise Challenge Fund (AECF); and
• designing result-based monitoring and accounting procedures and national registries related to identified financing options. For example, it will be important to review existing agricultural monitoring and evaluation systems and related capacity at national level and define climate finance related monitoring requirements26.
In-country analysis foreseen under phase II of the proposed methodology may provide useful elements in this direction.
26 For mitigation monitoring IPCC standards are available at national level and carbon accounting methodologies at project level are available only for some CSA practices (see FAO, 2009b). The latter will limit the opportunity to access carbon markets. For adaptation monitoring general approaches to measure vulnerability and adaptation capacity are evolving. Adaptation monitoring at national scales is complex, and there is no consensus on indicators or methods (Meridian 2011). Results-based adaptation frameworks can be used where specific adaptation actions are well defined.
36
7. References Adger, W. N., N. Brooks, et al. (2004). New Indicators of Vulnerability and Adaptive Capacity. Technical Report 7. Norwich, University of East Anglia. Tyndall Centre for Climate Change Research.
Angelsen, A., Ed. (2009). Realizing REDD+: National Strategy and Policy Options. Bogor, Center for International Forestry Research.
Angelsen, A., D. Boucher, et al. (2011). Modalities for REDD+ Reference Levels: technical and Procedural Issues, Meridian Institute.
AUC-NEPAD (2010). The AUC-NEPAD Agriculture Climate Change Adaptation-Mitigation Framework.
Branca, G., N. McCarthy, et al. (2011). Climate Smart Agriculture: A Synthesis of Empirical Evidence of Food Security and Mitigation Benefits from Improved Cropland Management. Working paper. Rome, FAO.
Brown, J., N. Cantore, et al. (2010). Climate financing and Development Friends or foes? Paper commissioned by The ONE Campaign. London, Overseas Development Institute.
CAADP. (2010). "The Comprehensive Africa Agriculture Development Program - a programme of the New Partnership for Africa's Development (NEPAD)." Retrieved 6 June 2011, from http://www.nepad-caadp.net/index.php.
Caldeira, K., M. Granger Morgan, et al. (2004). A Portfolio of Carbon Management Options. The Global Carbon Cycle: Integrating Humans, Climate and the Natural World. C. B. Field and M. R. Raupach. Washington DC, Scope 62, Island Press.
Campbell, B., W. Mann, et al. (2011). Addressing Agriculture in Climate Change Negotiations: A Scoping Report, Meridian Institute.
Chen C, H. B., Hagemann M, Höhne N, Moltmann S and Schaeffer M. (2011). Cancun Climate Talks: keeping the options open to close the gap. Climate Action Tracker Briefing Paper.
Cline, W., Ed. (2007). Global Warming and Agriculture: Impact Estimates by Country. . Washington, DC, Center for Global Development and Peterson Institute for International Economics.
Daly, H. E., Farley, J., Ed. (2004). Ecological Economics: Principles and Applications.
Fankhauser, S. and I. Burton (2011). Spending adaptation money wisely, Centre for Climate Change Economics and Policy.
FAO (1996). Rome Declaration on World Food Security and World Food Summit Plan of Action. Rome, FAO.
FAO (2009a). Coping with a Changing Climate: Considerations for Adaptation and Mitigation in Agriculture. Rome, FAO.
FAO (2009b). Food Security and Agricultural Mitigation in Developing Countries: Options for Capturing Synergies. Rome, FAO.
FAO (2009c). The use of Structured Finance instruments in agriculture in Eastern Europe and Central Asia. Rome, FAO.
FAO (2010). "Climate-Smart" Agriculture. Policies, Practices and Financing for Food Security, Adaptation and Mitigation. Rome, FAO.
FAO (2011a). The State of Food Insecurity in the World. Rome, FAO.
FAO (2011b). FAO-Adapt: FAO’s Framework Program on Climate Change Adaptation. Rome, FAO.
FAO (2011c). Climate Smart Agriculture: Capturing the Synergies between Mitigation, Adaptation and Food Security Rome, FAO. FAO Project Document
Fischer, G., M. Shah, F.N. Tubiello, H van Velhuizen (2005). "Socio-economic and climate change impacts on

37
agriculture: an integrated assessment, 1990–2080." Philosophical Transactions of the Royal Society B Biological Sciences (360): 2067-2083.
Follett, R. F., J. M. Kimble, et al. (2001). The potential of U.S. grazing lands to sequester soil carbon. The Potential of U.S. Grazing Lands to Sequester Carbon and Mitigate the Greenhouse Effect. R. F. Follett, J. M. Kimble and L. R. Boca Raton, Florida, Lewis Publishers: 401-430.
Freibauer, A., M. Rounsevell, et al. (2004). "Carbon sequestration in the agricultural soils of Europe." Geoderma 122: 1-23.
IFPRI (2010). Innovations in Rural and Agricultural Finance.
IPCC (2001). Contribution of Working Group III to the Third Assessment Report of the Intergovernmental Panel on Climate Change Climate Change 2001, Third Assessment Report. Cambridge, United Kingdom and New York , NY, USA, Cambridge University Press.
IPCC (2007a). Contribution of Working Group II to the Fourth Assessment Report of the Intergovernmental Panel on Climate Change Climate Change 2007, Fourth Assessment Report. M. L. Parry, O. F. Canziani, J. P. Palutikof, P. J. van der Linden and C. E. Hanson. Cambridge, United Kingdom and New York , NY, USA, Cambridge University Press.
IPCC (2007b). Contribution of Working Group III to the Fourth Assessment Report of the Intergovernmental Panel on Climate Change. Climate Change 2007, Fourth Assessment Report. B. Metz, O. R. Davidson, P. R. Bosch, R. Dave and L. A. Meyer. Cambridge, United Kingdom and New York, NY, USA, Cambridge University Press.
Lal, R. (1997). "Residue management, conservation tillage and soil restoration for mitigating greenhouse effect by CO2-enrichment." Soil and Tillage Research 43: 81-107.
Lal, R., Bruce J.P. (1999). "The potential of world cropland soils to sequester C and mitigate the greenhouse effect." Environmental Science and Policy 2: 177-185.
Lal, R. (2004). "Carbon emissions from farm operations." Environment International 30: 981- 990.
Leiva, F. R., J. Morris, et al. (1997). Precision farming techniques for sustainable agriculture. First European Conference on Precision Agriculture, Warwick.
Lobell, D., W. Schlenker, et al. (2011). "Climate Trends and Global Crop Production Since 1980." Science.
McCarthy, N., L. Lipper, et al. (2011). Climate Smart Agriculture: Smallholder Adoption and Implications for Climate Change Adaptation and Mitigation. Working paper. Rome, FAO.
McGray, H., A. Hammill, et al. (2007). Weathering the Storm, Options for Framing Adaptation and Development. Washington DC, World Resources Institute.
Mhlanga, N., Blalock, G., Christy, R. (2010). "Understanding foreign direct investment in the southern African development community: an analysis based on project-level data" Agricultural Economics 41(3-4): 337-347.
Monteny, G.-J., A. Bannink, et al. (2006). "Greenhouse gas abatement strategies for animal husbandry." Agriculture, Ecosystems and Environment 112: 163-170.
Murray, B., B. Sohngen, et al. (2007). "Economic consequences of consideration of permanence, leakage and additionality for soil carbon sequestration projects." Climatic Change 80(1): 127-143.
Nabuurs, G. J., O. Masera, K. Andrasko, P. Benitez-Ponce, R. Boer, M. Dutschke, E. Elsiddig, J. Ford-, P. F. Robertson, T. Karjalainen, O. Krankina, W.A. Kurz, M. Matsumoto, W. Oyhantcabal, N.H., et al. (2007). Forestry. Climate Change 2007: Mitigation. Contribution of Working Group III to the Fourth Assessment Report of the Intergovernmental Panel on Climate Change. O. R. D. B. Metz, P.R. Bosch, R. Dave, L.A. Meyer, Cambridge University Press, Cambridge, United Kingdom and New York, NY, USA.
OECD (2009). Integrating Climate Change Adaptation into Development Co-operation: Policy Guidance, OECD.
OECD-DAC. (2011, March). "Tracking aid in support of climate change mitigation and adaptation in developing countries." Retrieved 10 June 2001, from http://www.oecd.org/dac/stats/rioconventions.

38
Oelbermann, M., Voroney R.P, Gordon A.M. (2004). "Carbon sequestration in tropical and temperate agroforestry systems: a review with examples from Costa Rica and southern Canada. ." Agriculture, Ecosystems and Environment 104: 359-377.
Olhoff, A. and C. Schaer (2010). Screening Tools and Guidelines to Support the Mainstraeming of Climate Change Adaptation into Development Assistance. A Stocktaking Report. New York, UNDP.
Omilola, B., M. Yade, et al. (2010). Monitoring and Assessing Targets of the Comprehensive Africa Agriculture Development Program (CAADP) and the First Millennium Development Goal (MDG) in Africa. ReSAKSS Working Paper No. 31, International Food Policy Research Institute (IFPRI).
Ratha, D., S. Mohapatra, S. Plaza (2008). Beyond aid: new sources and innovative mechanism for financing development in Sub-Saharan Africa. Policy Research Working Paper. Washington, World Bank.
Schmidhuber, J. and F. N. Tubiello (2007). "Global food security under climate change." PNAS 104(50): 19703-19708.
Smith, P., D. Martino, et al. (2008). "Greenhouse gas mitigation in agriculture." Philosophical Transactions of the Royal Society B 363(1492): 789-813.
Soliva, C. R., J. Takahashi, et al., Eds. (2006). Greenhouse Gases and Animal Agriculture: An Update. International Congress Series No.1293. The Netherlands, Elsevier.
Stamoulis, K. and A. Zezza (2003). A Conceptual Framework for National Agricultural, Rural Development, and Food Security Strategies and Policies. ESA Working Paper No. 03-17. Rome, FAO.
Stern, N. (2006). Stern Review Report on the Economics of Climate Change, HM Treasury.
Thornton, P. K., P.G. Jones, T. Owiyo, R.L. Kruska, M. Herrero, V. Orindi, S. Bhadwal, P. Kristjanson, Notenbaert, N. Bekele, A. Omolo (2008). "Climate change and poverty in Africa: Mapping hotspots of vulnerability." AfJARE 2(1).
Tinbergen, J., Ed. (1952). The Theory of Economic Policy. Amsterdam, North Holland Publishing.
UN (2009). State of World Population 2009, Facing a Changing World: Women, Population and Climate. New York, NY, UNFPA.
UN. (2010). "UN Summit 20-22 september 2010, New York. High Level Plenary Meeting of the General Assembly." Retrieved 5 june 2011, from http://www.un.org/en/mdg/summit2010/.
UNCTAT (2009). World Investment Report.
WB (2010a). Economics of Adaptation to Climate Change: Synthesis Report. Washington DC, The World Bank.
WB (2010b). The Costs of Agricultural Adaptation to Climate Change. Development and Climate Change. Discussion Paper No 4.
WB (2011). Rising global interest in farmland: Can it yield sustainable and equitable benefits?
WB (undated). Mainstreaming Adaptation to Climate Change in Agriculture and Natural Resources Management Projects. Washington DC, The World Bank.
WB (to be published). SAP-based system to track WB development actions for climate adaptation and mitigation: a guide for TTLs. Washington DC, The World Bank.
39
8. Annexes: Results from the Climate-smart Agriculture Screening of the National Agricultural Investment Plans. Country profiles in alphabetical order27
27Country profiles have been built on the basis of the information reported in the NAIPs and, when available, in the NAPAs. In case additional references have been used, these are listed at the end of the country profile.
40
8.1. Benin Results from the CSA screening of the Benin Agricultural Investment Plan (PIA, 2010-15)
8.1.1 Brief background
Benin went through a major political crisis from mid 1990s to late 2000s: the cooperation with development partners was suspended from 1995 to 2008. The economy in Benin has been expanding annually at an estimated rate of 5.1%, 3.8% and 2.5% respectively over the years 2008 to 201028. This modest growth has mostly been attributed to the services sector, while smallholder subsistence farmers continue to struggle. The contribution of the agricultural sector to the total gross domestic product accounted for 34% in 1995 and decreased to 32.3% in 2005. In 2009 the percentage of the total population depending on agriculture was 45.3%, while in 1995 this figure was 58.7%. Subsistence farming remains the main source of food and income for about half the population. Benin produces maize, sorghum, millet, rice, cassava, yams and beans as food crops while palm oil, cashew and peanuts, livestock and fish are main cash commodities, although mainly for local consumption. Traditional cotton is also an important cash commodity, but profits largely depend on trade with Nigeria, which occasionally limits cotton imports. Benin is still a net importer of food products from abroad: it also imports the majority of its energy from Nigeria, but oil supplies are often interrupted.
Some of the major constraints facing the agricultural sector in Benin are: land degradation, low adaptive capacity to climate variability and extreme weather; underdeveloped local markets; unavailability and inaccessibility of quality seeds adapted to new climatic realities; low consumption of chemical fertilizers for crops other than cotton, limited extension support to farmers; inadequate policy environment and financing.
Reviving the agricultural sector is a high priority for the government of Benin. A strategic plan to revitalize the agricultural sector (Plan Stratégique de relance du Secteur Agricole - PSRSA) was developed in 2008, which is the leading strategic document for the agricultural sector. In the PSRSA the government places particular emphasis on the promotion of 13 commodities (maize, rice, cassava, yams, cotton, pineapple, cashew, oil palm, vegetables, meat, milk, egg, fish and shrimps). The PSRSA identifies 8 strategies in support of the development of the agricultural sector at large and the priority value chains in particular: (i) availability of and access to quality seeds; (ii) access to improved inputs; (iii) availability of improved technologies; (iv) access to finance (including insurance); (v) access to professional knowledge and innovations; (vi) land and water management; (vii) securing an managing access to land; and (viii) access to markets. In addition, ten cross cutting priorities are identified: agricultural research; extension and advice; infrastructure and agricultural equipment; irrigation; rural finance; land tenure security; gender; the institutional environment; information and communication; and monitoring and evaluation. Other priorities of the government of Benin are the promotion of food security through the National Plan for Food Security and the development and enhancement of natural resources of the country's five major valleys (valleys Ouémé, Niger, Couffo, Pendjari and Mono).
8.1.2 The national agricultural investment plan
The National Agricultural Investment Plan (Plan d’Investissement Agricole – PIA) is based on the PSRSA priorities and presents the quantification of the investments required for the implementation of PSRSA. In June 2011, Government, Development Partners, private sector, civil society and other stakeholder met in Cotonou for the Business meeting to discuss the PIA and financing modalities of the plan. The Benin PIA is based on 4 programs:
1. Development of (crop based) agriculture provides support to 4 priority value chains: maize, rice, pineapple and other horticultural products. Activities under this component include the promotion of irrigation, availability and access to seeds, fertilizer and other inputs;
2. Development of the livestock sector envisages support to small livestock development, in particular poultry and support to the milk and meat value chains;
28 Country Report Benin July 2011, Economic Intelligence Unit

41
3. Development of the fisheries and aquaculture sector, in particular shrimps;
4. Institutional support for agriculture and food security, including the prevention of food security risks.
The PIA prioritizes 6 out of the 13 value chains identified in the PSRSA, namely: maize, rice, pineapple, vegetables, chicken, and fish/shrimps, which are expected to have the greatest potential added value. The structure of the PIA budget does not match exactly the program and sub-program structure described in the PIA. As the level of analysis for this screening exercise has been set at the sub-program level, all budgeted activities have been aggregated and attributed to the relevant sub-programs to facilitate the comparison with the other Investment Plans. Therefore, two sub-programs (rural infrastructure/irrigation and research, extension farmer support) were transferred from Program 4 (Institutional support) to Program 1 (Crop Development). The following sub- programs were identified and analyzed:
1. Development of (crop based) agriculture:
1.1 Rural infrastructure and irrigation,
1.2 Access to seeds and other inputs,
1.3 Research, training and farmer support,
1.4 Development of mechanization.
2. Development of the livestock sector
2.1 Development of small stock, particularly poultry,
2.2 Development of milk and meat value chains.
3. Development of the fisheries and aquaculture sector, in particular shrimps
3.1 Development of fisheries value chain,
3.2 Development of shrimps value chain.
4. Institutional support for agriculture and food security and prevention of food security risks.
4.1 Prevention of food security risks;
4.2 Market access and information;
4.3 Sector management and M&E.
Interestingly, although the plan specifically notes the need to include activities related to food security and the mitigation of risks (Sub-Program 4.1), this has not been budgeted for, and no specific activities have been identified to address this. The scores for this sub-program are therefore not included.
The detailed budget identifies priority investments in line with the four programs above. The total budget requirements for these priority investments for the period 2010–2015 amount to a total of US$ 982.5 million. The envisaged available PIA resources, including the contributions from the private sector and farmers and farmer organizations, adds up to about US$ 275 million, leaving a substantial investment gap of US$ 706.5 million. However, the actual funds allocated to the agricultural sector differ somewhat, as on-going programs financed by different multi- and bi-laterals have not been fully included in the PIA budget (see table 8.1.1 for an overview of all donor financed projects in agriculture in Benin). For example, the total budget for sub-component 2.2 (development of the milk and meat value chains) amounts to US$ 48.7 million, of which 80% is financed by AfDB (PAFILAV). Furthermore, on-going projects and programs appear: (i) only partially available for the targeted period (project implementation started earlier) and/or (ii) not moving through the public budget (thus not accounted for in the investment plan).
42
For the purpose of this screening exercise, the following assumptions were made: the AfDB financed PAFILAV project (US$ 48 million), covering all activities under component 2.2 has been added to the budget29; and all other project/program contributions are assumed to be already incorporated in the budget. If this is considered the total agricultural budget comes to a total of US$ 1031.3 million with available resources of US$ 324.7 million (which includes private sector and farmer contributions), leaving a financing gap of US$ 706.6 million. (Figure 7.1.1)
Table 8.1.1: On-going multi- and bi-lateral investments in Benin's agricultural sector in 2010
GTZ: more than 3,000 mi l l ion FCFA in support to agricul tura l research programs,promotion of agricul tura l and conservation of natura l resources ;IFAD: 435 mi l l ion FCFA for agricul tura l research and more than 8,000 mi l l ion FCFA formicrocredi t, the promotion of smal l rura l enterprises and promotion of industries rice,cassava, vegetables , cashew and pineapple; DANIDA: 5,147 mi l l ion CFA francs for the promotion of agricul tura l sectors in genera lwith a focus on capaci ty bui lding of stakeholders , promotion of standards of qual i tyand gender; French Development Agency (AFD): 1,277 mi l l ion FCFA in support of dynamic productionin agricul ture;African Development Bank (AfDB): with 1,484 mi l l ion FCFA for research, 8,837 mi l l ionFCFA for integrated development actions and 6,100 mi l l ion CFA francs to support thedevelopment of the cotton sector;le Fond Africa in de Développement (FAD - grant) for 106 mi l l ion CFA francs to invest inresearch on NERICA;The Netherlands : 1,194 mi l l ion CFA francs for pi loting the farmer field schoolsapproach in crop protection for rice, corn, vegetables and cotton;
Banque Ouest Africa ine Développement (BOAD): 2,500 mi l l ion FCFA for food production;Banque Is lamique de Développement (IDB): with 8,416 mi l l ion CFA francs for theconstruction of smal l i rrigation schemes;Banque Arabe pour le Développement Economique en Afrique (BADEA): 2,684 mi l l ionFCFA in Spatia l agricul tura l water in the lower va l ley of the River Mono; KfW (Germany): intervening in the natura l resource conservation and land securi ty;World Bank i s involved in agricul tura l divers i fi cation; European Union, which funds food production, particularly rice and maize; Belgian Cooperation supports development of rice, cashew nuts and vegetables forover 6,500 mi l l ion FCFA; andUNDP provides support to capaci ty bui lding techniques .The main contributor to the component is the AfDB with 17,140 mi l l ion FCFA for thedevelopment of meat and da iry sectors ;
The World Bank is financing 3,901 mi l l ion FCFA to strengthen compl iance of theveterinary services of Benin qual i ty s tandards of the OIE.IFAD with 4,500 mi l l ion CFA francs and ADF with 4,900 mi l l ion CFA francs fund therestoration of fi sheries and aquaculture development in the arti sanal fi sheriesthroughout the PADPPA. Belgium is committed to supporting the promotion of the fi shing industry.
Program 4: Insti tutional Support for Agricul ture and Food Securi ty
Belgium has mobi l i zed 2,296 mi l l ion FCFA for insti tutional support to the Minis try ofAgricul ture, Livestock and Fisheries .
Program 1: Development of (crop based) Agricul ture
Program 2: Livestock Development
Program 3: Development of Fisheries and Aquaculture
29 PAFILAV is 80% AfDB financed with 20% government and beneficiaries contributions, in figure 1 the 20% has been assumed to be government contribution
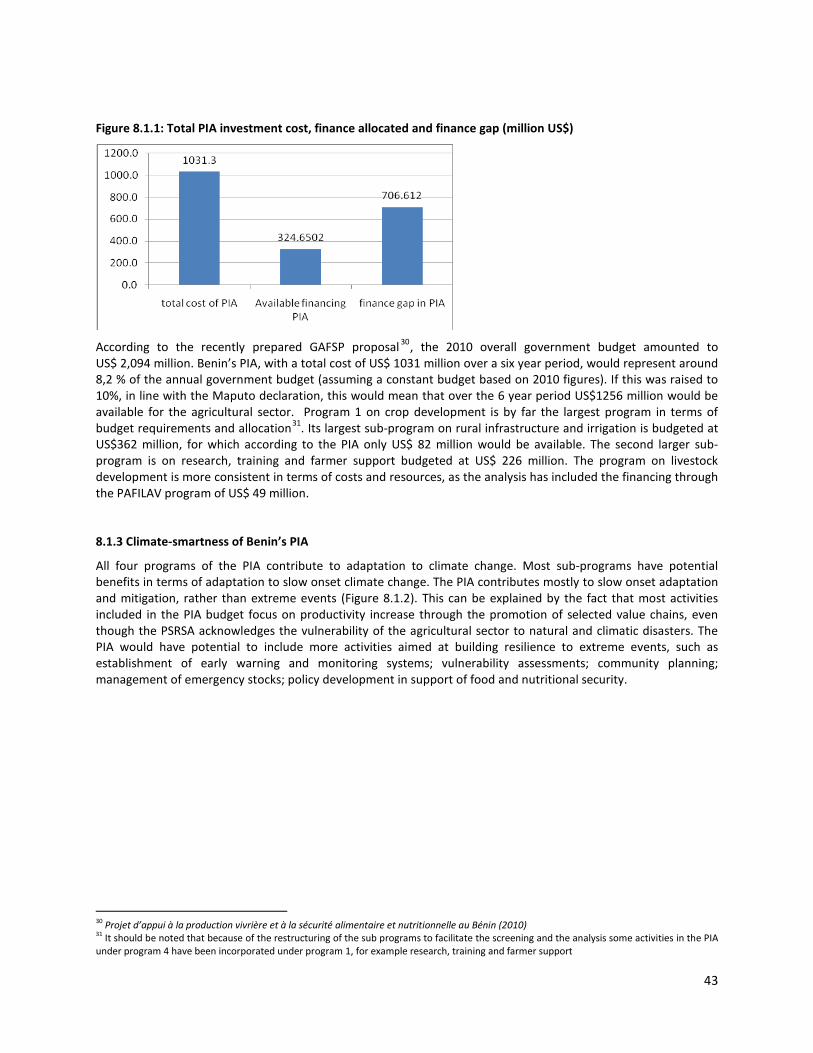
43
Figure 8.1.1: Total PIA investment cost, finance allocated and finance gap (million US$)
According to the recently prepared GAFSP proposal 30, the 2010 overall government budget amounted to US$ 2,094 million. Benin’s PIA, with a total cost of US$ 1031 million over a six year period, would represent around 8,2 % of the annual government budget (assuming a constant budget based on 2010 figures). If this was raised to 10%, in line with the Maputo declaration, this would mean that over the 6 year period US$1256 million would be available for the agricultural sector. Program 1 on crop development is by far the largest program in terms of budget requirements and allocation31. Its largest sub-program on rural infrastructure and irrigation is budgeted at US$362 million, for which according to the PIA only US$ 82 million would be available. The second larger sub-program is on research, training and farmer support budgeted at US$ 226 million. The program on livestock development is more consistent in terms of costs and resources, as the analysis has included the financing through the PAFILAV program of US$ 49 million.
8.1.3 Climate-smartness of Benin’s PIA
All four programs of the PIA contribute to adaptation to climate change. Most sub-programs have potential benefits in terms of adaptation to slow onset climate change. The PIA contributes mostly to slow onset adaptation and mitigation, rather than extreme events (Figure 8.1.2). This can be explained by the fact that most activities included in the PIA budget focus on productivity increase through the promotion of selected value chains, even though the PSRSA acknowledges the vulnerability of the agricultural sector to natural and climatic disasters. The PIA would have potential to include more activities aimed at building resilience to extreme events, such as establishment of early warning and monitoring systems; vulnerability assessments; community planning; management of emergency stocks; policy development in support of food and nutritional security.
30 Projet d’appui à la production vivrière et à la sécurité alimentaire et nutritionnelle au Bénin (2010) 31 It should be noted that because of the restructuring of the sub programs to facilitate the screening and the analysis some activities in the PIA under program 4 have been incorporated under program 1, for example research, training and farmer support

44
Figure 8.1.2: Potential contribution of PIA to adaptation and mitigation (n. sub-programs/activities)
16
4
8
0 2 4 6 8 10 12 14 16 18
Slow onset
Extreme events
Mitigation
Overall, both the programs on crop based agriculture and livestock development generate the greatest number of potential climate benefits, particularly related to slow onset. For the crop based agriculture program most benefits are potentially realized through irrigation, access to inputs and research and extension activities. Both sub-programs in the livestock development program contribute to building resilience to extreme events, by proposing activities related to disease monitoring and vaccination campaigns (which also contribute to increase physical resilience). With regard to slow onset adaptation, 73% of the sub-programs contribute to increased economic resilience (Figure 8.1.3). This is due to the fact that many activities focus on increasing productivity. Irrigation development, natural resource management, access to inputs and the promotion of livestock productivity all contribute to increased physical resilience. Activities related to research and extension, support to farmer organizations (including livestock keepers) and improved policy and legislative environment will contribute to increased human and social resilience.
Figure 8.1.3: Potential contribution of PIA to system’s resilience (% sub-programs/activities)
According to the plan there is little potential for carbon sequestration and GHG emissions reduction. There is however a potential to GHG emissions per unit of production. Agriculture development would enhance production and productivity in the rural areas and thus potentially contribute to mitigation. Assuming a low level of yield in most agricultural sectors, and a limited area under cultivation at present, if area under cultivation increases and yield on existing areas increases, the total amount of GHGs due to agricultural production may increase, but the emissions per unit of output may decrease due to increased productivity. In fact, examined by sub-program, the vast majority (about 75%) of all identified climate benefits with regard to mitigation will be provided by the first program by increasing production efficiency and determining less carbon emissions per unit. Although some of the livestock sub-program would have potential climate benefits, it must be noted that expansion of the livestock sector overall could increase GHG emissions. However, livestock methane emissions are not expected to increase substantially, because in addition to supporting traditional livestock keeping, promotion of improved cross-breeds and improved livestock husbandry practices for increased productivity are foreseen (Figures 8.1.4 and 8.1.5).
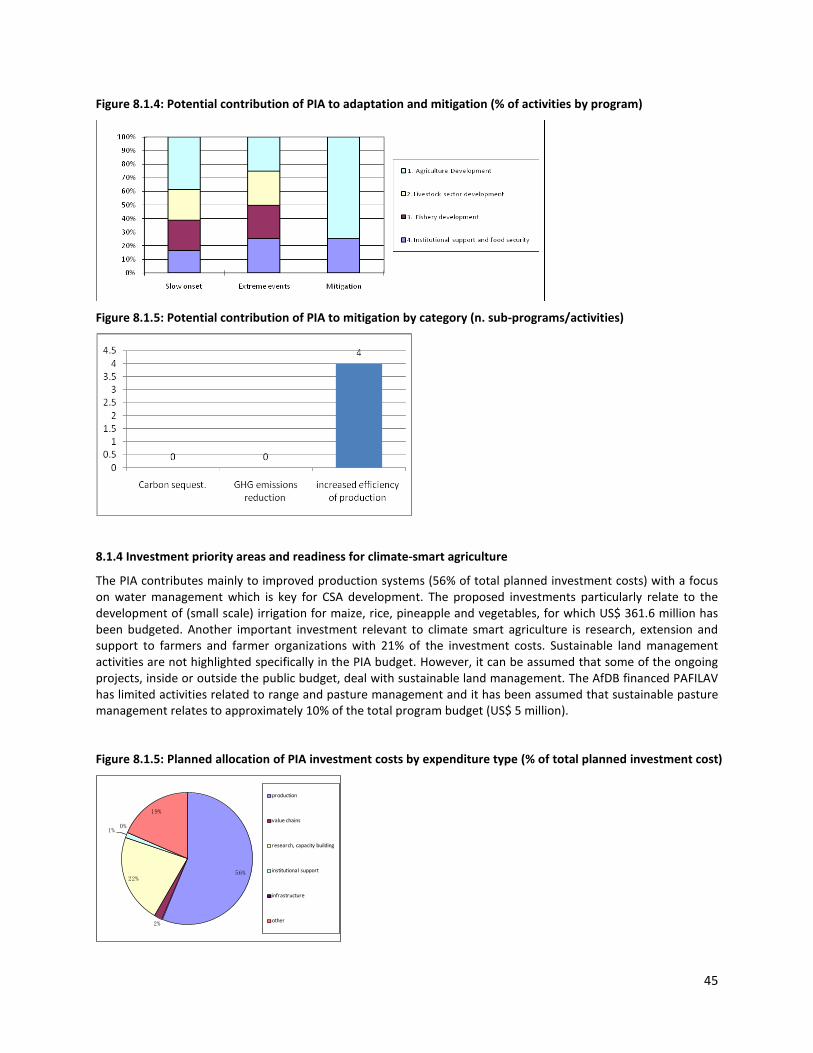
45
Figure 8.1.4: Potential contribution of PIA to adaptation and mitigation (% of activities by program)
Figure 8.1.5: Potential contribution of PIA to mitigation by category (n. sub-programs/activities)
8.1.4 Investment priority areas and readiness for climate-smart agriculture
The PIA contributes mainly to improved production systems (56% of total planned investment costs) with a focus on water management which is key for CSA development. The proposed investments particularly relate to the development of (small scale) irrigation for maize, rice, pineapple and vegetables, for which US$ 361.6 million has been budgeted. Another important investment relevant to climate smart agriculture is research, extension and support to farmers and farmer organizations with 21% of the investment costs. Sustainable land management activities are not highlighted specifically in the PIA budget. However, it can be assumed that some of the ongoing projects, inside or outside the public budget, deal with sustainable land management. The AfDB financed PAFILAV has limited activities related to range and pasture management and it has been assumed that sustainable pasture management relates to approximately 10% of the total program budget (US$ 5 million).
Figure 8.1.5: Planned allocation of PIA investment costs by expenditure type (% of total planned investment cost)
56%
2%
22%
1%0%
19%
production
value chains
research, capacity building
institutional support
infrastructure
other

46
Overall, Benin’s investment environment is not considered to be very conducive, ranking 170 out of 183 countries in 2011, in terms of ease of doing business (up from 172th position in 2010) (see section 4.2 above). The potential for quick deployment is classified as ‘low’.
8.1.5 Consistency with the NAPA
Benin’s NAPA has the following priorities:
• establishment of a climate risk and early warning system to enhance food security in four vulnerable agro-ecological zones;
• support household adaptation by promoting renewable energy, energy efficient stoves and pressure cookers in areas vulnerable to climatic changes conditions and where the land has severely degraded water resources;
• mobilization of surface water for adaptation for the most vulnerable communities in the centre and north;
• protection of children under 5 years and pregnant women against malaria in the areas most vulnerable to climatic change; and
• protection of the coastal zone against the rising sea level.
The Benin PIA is not very consistent with the NAPA as it only contributes to NAPA priority number 3 on the mobilization to surface water. It is remarkable that the establishment of a climate risk, early warning system has not been budgeted for in the PIA, although this also is a priority in the NAPA. Only 35% of the planned investments in Benin’s PIA are also contributing to the priorities highlighted in the NAPA, primarily through the proposed investments in irrigation and water management.
8.1.6 Conclusions
Benin’s PIA is neither particularly focused nor comprehensive although it is based on the priorities of the country’s agricultural strategic framework (PSRSA) and the structure of programs and sub-programs could be improved substantially. Several elements of the various sub-programs are duplicated, particularly in case of Program 1 on crop development and P4 on institutional support for agriculture and food security and prevention of food security risks. In addition, it is not clear which of the multi- and bi-lateral funding is included in the PIA. A more comprehensive analysis of the PIA and the ongoing agricultural programs would be required. Initial findings of this screening exercise should therefore be cautiously interpreted.
Important activities both highlighted in the narrative of the PIA as well as in the NAPA are omitted from the budget, such as the activities related to the prevention of risks. Even though the PSRSA identifies land and water management as one of its core strategies, no activities have been included in the PIA that focus particularly on the management of natural resources (for example water and soil management techniques linked to irrigation). Overall the PSRSA proposes various strategies that would contribute to adaptation and mitigation, which unfortunately have not been included in the PIA, such as land tenure and management.
Not all of the programs in the PIA have potential climate benefits and some can have adverse effects, such as the use of fertilizers. The total budget for fertilizer and phytosanitary products is around 10% of the overall PIA and efficient use of these inputs should be ensured. In line with the PSRSA, the components of the PIA and the NAPA, the budget should include activities and financing related to climatic risk management, including the establishment of a (climate-risk) early warning system. The PSRSA presents several potentially positive activities that could be considered when improving Benin’s adaptive capacity and mitigation potential. Further analysis would be required, but aspects to be considered for inclusion in the PIA could be: targeted sustainable land management activities, such as water harvesting, conservation agriculture; timing of crop cultivation in response to changing patterns of rainfall; availability and access of improved quality seeds; intercropping, irrigation, and the optimization farming practices; integrated pest and disease management; integrated soil fertility management; access to finance and (climate) risk insurance; and reduction of post-harvest losses and value addition.

47
8.2. Ethiopia Results from the CSA screening of the Ethiopian Agricultural Sector Policy and Investment Framework (PIF, 2010-20)
8.2.1 Brief background
Ethiopia is one of the poorest countries in the world, with an annual per capita income of US$ 170. Ethiopia was ranked 171st out of 182 countries on the UNDP Human Development Index in 2009. Life expectancy at birth is only 54.7 years. Ethiopia has undertaken a far-reaching program of economic reforms over the last 19 years which have delivered strong economic growth. Measures of human development have improved but remain low. Poverty and food insecurity are concentrated in rural areas, and the poorest sub-sector of rural households are chronically reliant on social safety net programs and food aid. The economy has registered rapid growth rates averaging 11% per annum over the past seven years, placing Ethiopia among the top performing economies in sub-Saharan Africa. These rates also exceed the economic growth rate of 7% required to achieve the MDGs. The new Five-Year Growth and Transformation Plan (FYGTP) envisages continuing GDP growth at a minimum 10% per annum.
The agricultural sector accounts for roughly 43% of GDP, and 90% of exports. Cereals dominate Ethiopian agriculture, accounting for about 70% of agricultural GDP. Livestock production accounts for about 32% of agricultural GDP. The agricultural sector, critically important to both overall economic performance and poverty alleviation, has performed strongly over most of the last decade, but there is still substantial scope to sustainably improve productivity, production and marketing. Government has demonstrated strong commitment to the sector through allocation of more than 15% of the total budget, although a significant portion of this is spent on the Disaster Risk Management and Food Security (DRMFS) program. The sector remains dominated by a subsistence, low input- low output rainfed farming system in which droughts periodically reverse performance gains with devastating effects on household food security and poverty levels.
Increasing productivity in smallholder agriculture is Government’s top priority, recognizing the importance of the smallholder sub-sector, the high prevalence of rural poverty and the large productivity gap. About 11.7 million smallholder households account for approximately 95% of agricultural GDP and 85% of employment. About 25% of rural households earn some income from non-farm enterprises, but less than 3% rely exclusively on income from such enterprises. Nearly 55% of all smallholder farmers operate on one hectare or less but only 20% of the total arable area is currently under cultivation.
Droughts periodically reverse agricultural sector performance gains with devastating effects on household food security and poverty levels. Vulnerability to droughts is greatest in the pastoral areas of the lowlands and the densely populated, food-insecure districts of the highlands. Drought-induced famines are further exacerbated by limited coping mechanisms and inadequate contingency planning for drought mitigation and the threat of climate change.
8.2.2 The plan
The Ethiopian Agricultural Sector Policy and Investment Policy (PIF) defines 4 main strategic objectives (SOs) based on the CAADP pillars:
• Increase sustainable increase in agricultural productivity and production
• Accelerate agricultural commercialization and agro industrial development
• Reduce degradation and improve productivity of natural resources
• Achieve universal food security and protect vulnerable households from natural disasters
The total budget estimated for the 10 year plan totals US$ 15.5 billion of which around US$ 2.5 billion is already committed under existing programs and projects. Most (80%) of the additional funding will be required during the second half of the PIF period. Government funds 60% of total investment costs, while remaining 40% is funded by donors (30% grants, and 10% concessional loans), indicating a contribution of around US$ 8.4 billion from

48
Government and US$ 5.6 billion from donors. Between 13 and 17% of government expenditure (equivalent to over 5% of GDP) has been channeled towards agriculture (including natural resource management) in recent years - far more than the average for sub-Saharan African countries and well in excess of the recommended CAADP minimum of 10% (figure 8.2.1). Government is expected to continue its strong commitment to financing agriculture and rural development over the next decade, and the expectation of continued strong economic growth will increase the agricultural sector budget from around US$ 0.75 billion in 2010/11 to as much as US$ 2.74 billion per annum by the end of the PIF period.
Figure 8.2.1: Total PIF investment cost, finance allocated and finance gap in million US$
8.2.3 Climate-smartness of PIF
All components of PIF have been identified as contributing to adaptation to climate change, supporting enhancement of resilience to climate variability and gradual climate change. Adaptation to climate variability and slow onset climate change is the major potential benefit of the PIF, mainly because in this highly food insecure country, most planned components would improve food production, productivity, food availability and agriculture-based income generation. 75% of the sub programs contribute to increased human and economic resilience, about 42% of the sub-programs contribute to increased physical resilience. Most components have potential mitigation benefits, too (figures 8.2.2 and 8.2.3).
Figure 8.2.2: Potential contribution of PIF to adaptation and mitigation (n. sub-programs/activities)
Figure 8.2.3: Potential contribution of PIF to system’s resilience (% sub-programs/activities)
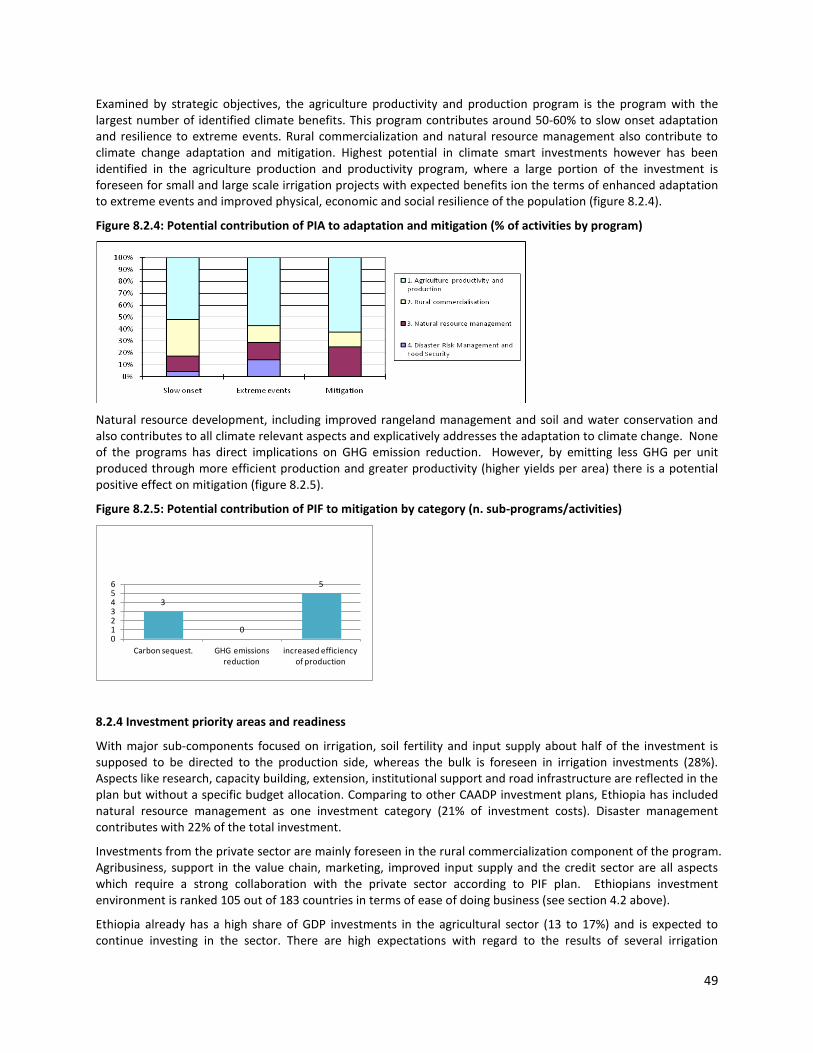
49
Examined by strategic objectives, the agriculture productivity and production program is the program with the largest number of identified climate benefits. This program contributes around 50-60% to slow onset adaptation and resilience to extreme events. Rural commercialization and natural resource management also contribute to climate change adaptation and mitigation. Highest potential in climate smart investments however has been identified in the agriculture production and productivity program, where a large portion of the investment is foreseen for small and large scale irrigation projects with expected benefits ion the terms of enhanced adaptation to extreme events and improved physical, economic and social resilience of the population (figure 8.2.4).
Figure 8.2.4: Potential contribution of PIA to adaptation and mitigation (% of activities by program)
Natural resource development, including improved rangeland management and soil and water conservation and also contributes to all climate relevant aspects and explicatively addresses the adaptation to climate change. None of the programs has direct implications on GHG emission reduction. However, by emitting less GHG per unit produced through more efficient production and greater productivity (higher yields per area) there is a potential positive effect on mitigation (figure 8.2.5).
Figure 8.2.5: Potential contribution of PIF to mitigation by category (n. sub-programs/activities)
3
0
5
0123456
Carbon sequest. GHG emissions reduction
increased efficiency of production
8.2.4 Investment priority areas and readiness
With major sub-components focused on irrigation, soil fertility and input supply about half of the investment is supposed to be directed to the production side, whereas the bulk is foreseen in irrigation investments (28%). Aspects like research, capacity building, extension, institutional support and road infrastructure are reflected in the plan but without a specific budget allocation. Comparing to other CAADP investment plans, Ethiopia has included natural resource management as one investment category (21% of investment costs). Disaster management contributes with 22% of the total investment.
Investments from the private sector are mainly foreseen in the rural commercialization component of the program. Agribusiness, support in the value chain, marketing, improved input supply and the credit sector are all aspects which require a strong collaboration with the private sector according to PIF plan. Ethiopians investment environment is ranked 105 out of 183 countries in terms of ease of doing business (see section 4.2 above).
Ethiopia already has a high share of GDP investments in the agricultural sector (13 to 17%) and is expected to continue investing in the sector. There are high expectations with regard to the results of several irrigation

50
investments which are supposed to increase agriculture area, productivity and decrease dependency on rainfed agriculture. FIP is consistent with a number of other supportive policies in the agriculture sector, such as the draft FYGTP 2010/11-2014/15; the strategy of Agricultural Development-Led Industrialization (ADLI); the (PASDEP) for 2005/06-2009/10; Ethiopia’s Millennium Development Goals (MDGs); Rural Development Policy and Strategies (RDPS); and CAADP Compact.
Figure 8.2.6: Planned allocation of PIF investment costs by expenditure type (% of total planned investment cost)
49%
8%
0%
0%0%
22%
21% production
value chains
research, capacity building
institutional support
infrastructure
welfare / disaster mgt
other
8.2.5 Consistency with NAPA
PIF is in line with NAPA priorities and consistent with its overall goals and objectives. Almost all PIF investments are in fact reflected in NAPA, again with the highest budget allocation in irrigation. The project with highest priority in NAPA (crop insurance) however has not directly been reflected in PIF. Other NAPA priorities are in the area of agriculture, rangeland development and meteorological monitoring.
8.2.6 Conclusions
Consistently with other food, nutrition and poverty reduction strategies, FIP has a balanced focus of investment on support for agricultural production, natural resources and rural commercialization. Most investments are foreseen in irrigation schemes with the expectation to boost production and productivity. Comparing to other countries little attention is given to institutional strengthening and investments in road infrastructure. While all programs have been identified as having climate benefits, program 1 (‘Production and productivity’) is the program identified as having the highest climate-smart agriculture potential. Additional elements of agricultural production to be promoted under PIF that could contribute to enhance this potential include: crop insurance schemes; agroforestry systems with nitrogen fixing trees and green manure; fuel wood promotion and improved stoves; measures to maintain or increase forest cover; and improved pasture management.

51
8.3. Gambia Results from the CSA screening of The Gambia National Agricultural Investment Program (GNAIP, 2010-15)
8.3.1 Brief background
The Gambia is a country of 11,000 sq km and 1.7 million population. Agriculture contributes about 30% of GDP, employs around 70% of the population and generates about 30% of foreign exchange earnings, mainly through export of groundnuts. Livelihoods of 91% of the extremely poor and 72% of the poor are based on agriculture. Agricultural production is characterized by subsistence rain-fed production of food crops comprising cereals (mainly coarse grains and rice), semi-commercial production of groundnuts, cotton and sesame, traditional livestock production, fishing, and horticultural production (GNAIP, 2010-15).
The Gambia’s NAPA identifies vulnerable sectors as: agriculture (crop and livestock production sub-sectors), fisheries, energy, water resources, forestry and health. Climate hazards in The Gambia include: torrential rainfall, storms, drought, cold spells, intra-seasonal-drought, heat waves, and unseasonal rains. Changes in rainfall and temperature are expected to limit productivity of some crops, and some crops (e.g. groundnut) may have a drop in yields. Overall impacts on food security are hard to identify as they depend on policy scenarios, but inter-annual variability of yields is likely to increase. Soil salinization in lowland areas resulting from sea level rise are likely to impact negatively on rice production. Impacts on livestock and fisheries are of major concern, particularly given that fish form about 40% of protein consumption for Gambians.
8.3.2 The plan
The Gambia NAIP is consistent with the agriculture plans that form an integral part of the Second PSRP - the main national development and donor dialogue framework – and is also written with reference to prospective regional agriculture investment plans of ECOWAS member states. The GNAIP is based around 6 components:
1. improvement of water management, including construction of water control structures and irrigation facilities to boost rice production;
2. improved management of other shared resources, such as rangelands, forests, fisheries and parks;
3. development of Agricultural Chains and Market Promotion in food crops, horticulture, agroforestry, livestock and export crops;
4. prevention and management of food crisis and other natural disasters through establishment of an early warning system, emergency preparedness, crisis management systems and social protection mechanisms such as seed banks;
5. sustainable farm management, including integrated soil fertility management through agroforestry and cereal / legume rotations for soil fertility improvement, improved soil nutrient and fertilizer management and soil conservation practices; and
6. institutional capacity building for program implementation.
The budget estimates for the GNAIP total US$266 million over 2010-2015. GNAIP notes that the government’s allocations to agriculture are around 5% and declining, and calls for an increase to the CAADP-recommended 10%. The GNAIP document does not provide information enabling an estimate of the current or future financing gap. However, a number of potential sources of finance are identified, but most of these options are not firmly agreed (Table 8.3.1). It is not certain whether the GOTG contribution of $26.7 million (which would imply a GNAIP funding gap of $240.1 million) is based on current projected budgets or an assumed achievement of a 10% allocation to agriculture.

52
Table 8.3.1: GNAIP budget and sources of funds
Source: GNAIP. NB: ADF is ‘agriculture development fund’ a basket funding mechanism; GOTG is government of The Gambia.
8.3.3 Climate-smartness of GNAIP
All components of GNAIP were identified as directly contributing to adaptation to climate change. Most components support enhancement of resilience to climate variability and gradual climate change. Some components enhance abilities to cope with extreme events. A relatively larger proportion of components have potential mitigation benefits, mainly because the GNAIP includes rangeland, forestry and parks management in its ‘shared resources’ sub-program. Adaptation to climate variability and slow onset climate change is the major potential benefit of the GNAIP, mainly because many components address potential impacts of changing climate and water resources on rice production and riverine environments. About a third of sub-programs would enhance resilience of physical systems, half enhance economic resilience and more than 80% of sub-programs would enhance social resilience.
Figure 8.3.1: Potential contribution of GNAIP to adaptation and mitigation (n. sub-programs/activities)
48
11
15
0 10 20 30 40 50 60
Slow onset
Extreme events
Mitigation
Figure 8.3.2: Potential contribution of GNAIP to system’s resilience (% sub-programs/activities)
37
56
85
0
10
20
30
40
50
60
70
80
90
Increased physical resilience
Increased economic resilience
Increased human and social resilience
Examined by sub-program, around three quarters of the potential slow onset adaptation benefits come from three programs: improvement of water management, management of shared resources (with its activities in range management, forestry and fisheries) and sustainable farm management (with its activities on ‘Integrated Soil Fertility Management’ addressing physical resilience). The improvement of water management program makes particular contributions to adapting to potentially increasing extreme events, including flooding and drought.

53
Figure 8.3.3: Potential contribution of GNAIP to adaptation and mitigation (% of activities by program)
0%
10%
20%
30%
40%
50%
60%
70%
80%
90%
100%
slow onset extreme event mitigation
1. Improvement of watermanagement
2. Management of sharedresources
3. Agricultural Chains and MarketPromotion
4. Prevention of Food Crisis andNatural Disasters
5. Sustainable Farm Management
6. Institutional Capacity
A number of GNAIP activities have been identified as potentially having climate change mitigation benefits. Agroforestry (part of Sub-program 5), rangeland management and forest management (both in Sub-program 2) would most likely sequester carbon. Irrigation and water management activities are assumed to reduce the GHGs emitted per unit of grain produced if they can succeed in increasing the area under high productivity rice production.
Figure 8.3.4: Potential contribution of GNAIP to mitigation by category (n. sub-programs/activities)
4
0
11
02468
1012
Carbon sequest. GHG emissions reduction
increased efficiency of production
8.3.4 Investment priority areas and readiness
With major sub-components focused on ‘Integrated Soil Fertility Management’ as well as production in relation to development of agricultural food chains, irrigation and water management, about a quarter of the planned investment would contribute directly to improved agricultural production practices. Value chain investments account for over one third of planned investments. Other significant investments are planned targeting disaster / crisis management (15%) and research and capacity building (10%) (figure 8.3.5).

54
Figure 8.3.5: Planned allocation of GNAIP investment costs by expenditure type (% of total planned investment cost)
23%
37%10%
8%
0%
15%
7%
Planned allocation of investments
production
value chains
research, capacity building
institutional support
infrastructure
welfare / disaster mgt
other
The Gambia is ranked fairly low on the Doing Business rankings, being 146 out of 183 countries ranked (see section 4.2 above). However, in the GNAIP there is awareness of the importance of private sector investments. Some existing investors are reported in the vegetable and poultry sectors, and future plans to attract investment in production of field crops, livestock and horticulture are mentioned in GNAIP. The GNAIP is consistent with the main framework strategies for The Gambia’s development, and ensuring synergies with the programs of significant donors and other regional initiatives is stressed in the GNAIP document. The document itself is inconsistent (activities listed in the text are different from activities listed in the budget table), suggesting that the plan may require more thinking through before key aspects of it can be assessed for up scaling.
8.3.5 Consistency with NAPA
GNAIP is quite consistent with The Gambia’s NAPA, and with the list of 10 priority adaptation projects identified by GOTG. Priority actions listed in the NAPA include projects to strengthen early warning systems, diversify and intensify agricultural production, processing and marketing, promote community forestry and agroforestry, and to improve rangeland management. These are all activities that are supported within the GNAIP. Considering the relative focus of planned financial investments, overall, about 70% of planned GNAIP investments could contribute to implementation of NAPA priorities.
8.3.6 Conclusions
GNAIP could potentially deliver significant benefits for adaptation to slow onset climate change. Some programs also have strong benefits for adaptation to extreme events, and some programs have potential adaptation benefits. Almost half of all climate benefits are identified as arising from two programs: improvement of water management and management of shared resources. NAIP is integrated with PSRP and other framework documents, including a national disaster reduction plan under implementation. However, the text and tables in the GNAIP are inconsistent suggesting that more thorough analysis and planning should be done before potentials for up scaling can be considered. The plan itself identifies "inadequate administrative, financial, and planning capacities at the local level" as a major challenge.
There are significant areas of overlap and potential integration between the GNAIP and The Gambia’s NAPA. If integration in these areas is paid attention to, aspects of agricultural production to be promoted under GNAIP could contribute more significantly to enhanced climate resilience. Particular areas to consider include:
• Irrigation systems and water management for rice production: given the very low degree of self-sufficiency in rice production in The Gambia, the rationale for the focus on water management for rice production is clear. The GNAIP analyzes a lot of reasons for failure with past rice production, irrigation and
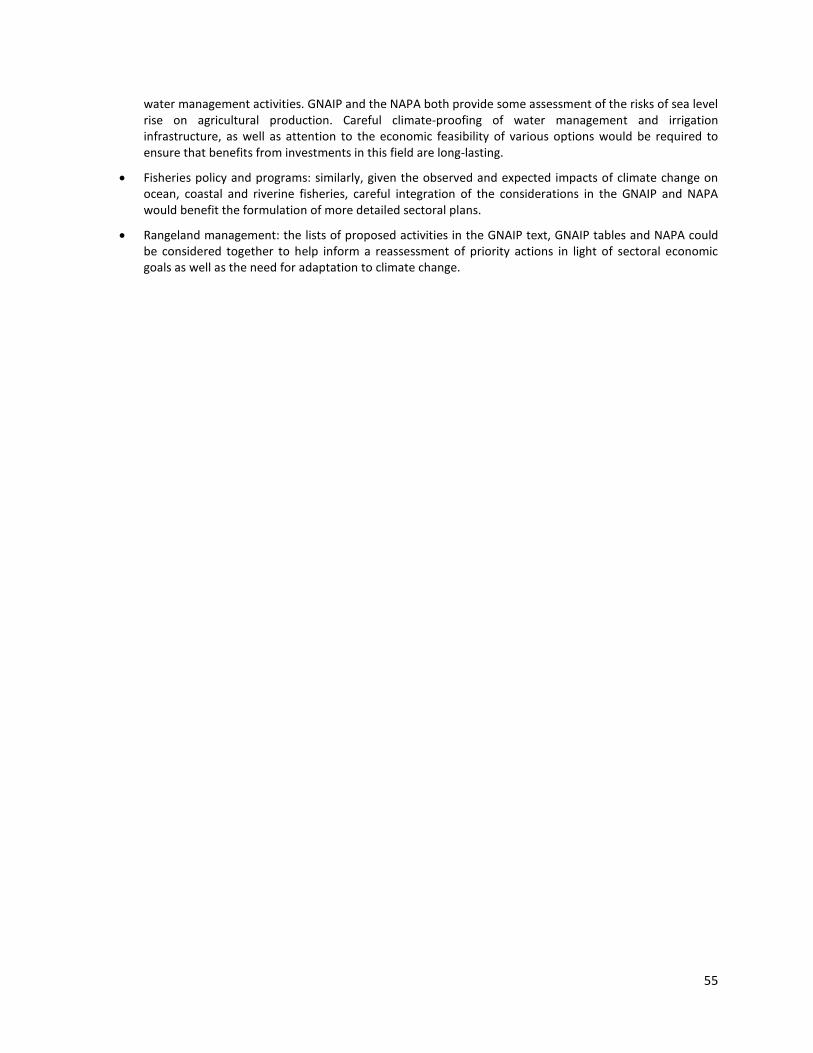
55
water management activities. GNAIP and the NAPA both provide some assessment of the risks of sea level rise on agricultural production. Careful climate-proofing of water management and irrigation infrastructure, as well as attention to the economic feasibility of various options would be required to ensure that benefits from investments in this field are long-lasting.
• Fisheries policy and programs: similarly, given the observed and expected impacts of climate change on ocean, coastal and riverine fisheries, careful integration of the considerations in the GNAIP and NAPA would benefit the formulation of more detailed sectoral plans.
• Rangeland management: the lists of proposed activities in the GNAIP text, GNAIP tables and NAPA could be considered together to help inform a reassessment of priority actions in light of sectoral economic goals as well as the need for adaptation to climate change.
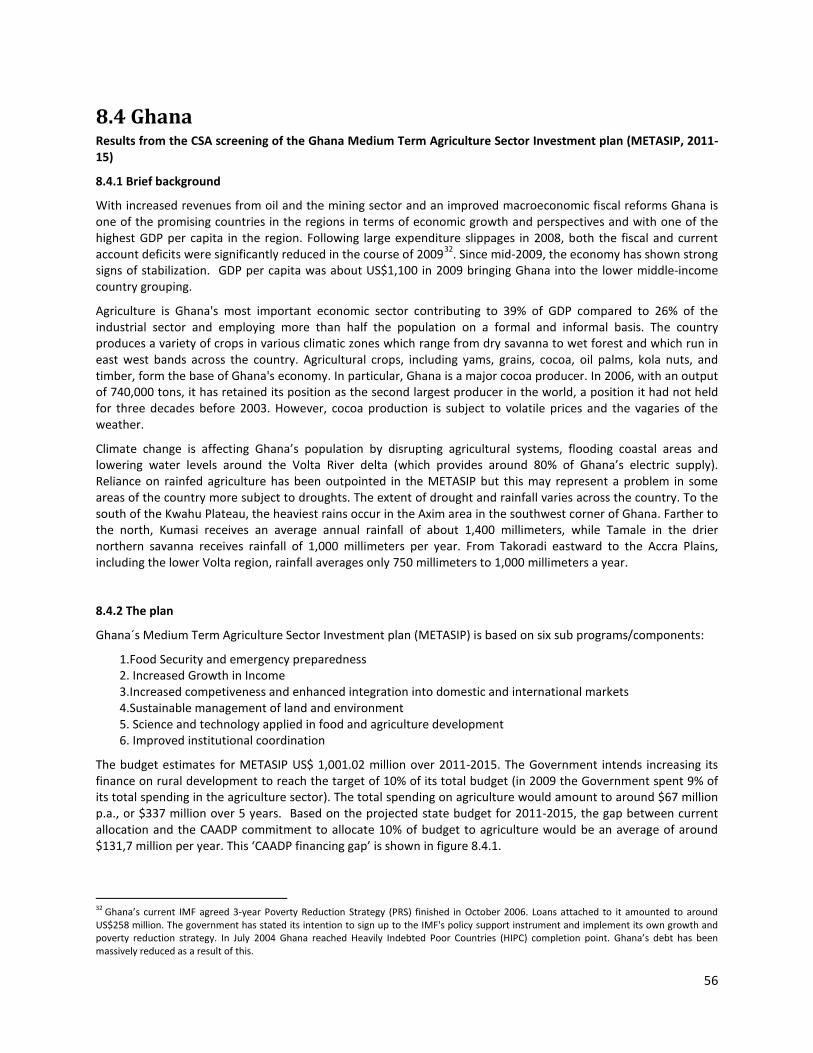
56
8.4 Ghana Results from the CSA screening of the Ghana Medium Term Agriculture Sector Investment plan (METASIP, 2011-15)
8.4.1 Brief background
With increased revenues from oil and the mining sector and an improved macroeconomic fiscal reforms Ghana is one of the promising countries in the regions in terms of economic growth and perspectives and with one of the highest GDP per capita in the region. Following large expenditure slippages in 2008, both the fiscal and current account deficits were significantly reduced in the course of 200932. Since mid-2009, the economy has shown strong signs of stabilization. GDP per capita was about US$1,100 in 2009 bringing Ghana into the lower middle-income country grouping.
Agriculture is Ghana's most important economic sector contributing to 39% of GDP compared to 26% of the industrial sector and employing more than half the population on a formal and informal basis. The country produces a variety of crops in various climatic zones which range from dry savanna to wet forest and which run in east west bands across the country. Agricultural crops, including yams, grains, cocoa, oil palms, kola nuts, and timber, form the base of Ghana's economy. In particular, Ghana is a major cocoa producer. In 2006, with an output of 740,000 tons, it has retained its position as the second largest producer in the world, a position it had not held for three decades before 2003. However, cocoa production is subject to volatile prices and the vagaries of the weather.
Climate change is affecting Ghana’s population by disrupting agricultural systems, flooding coastal areas and lowering water levels around the Volta River delta (which provides around 80% of Ghana’s electric supply). Reliance on rainfed agriculture has been outpointed in the METASIP but this may represent a problem in some areas of the country more subject to droughts. The extent of drought and rainfall varies across the country. To the south of the Kwahu Plateau, the heaviest rains occur in the Axim area in the southwest corner of Ghana. Farther to the north, Kumasi receives an average annual rainfall of about 1,400 millimeters, while Tamale in the drier northern savanna receives rainfall of 1,000 millimeters per year. From Takoradi eastward to the Accra Plains, including the lower Volta region, rainfall averages only 750 millimeters to 1,000 millimeters a year.
8.4.2 The plan
Ghana´s Medium Term Agriculture Sector Investment plan (METASIP) is based on six sub programs/components:
1.Food Security and emergency preparedness 2. Increased Growth in Income 3.Increased competiveness and enhanced integration into domestic and international markets 4.Sustainable management of land and environment 5. Science and technology applied in food and agriculture development 6. Improved institutional coordination
The budget estimates for METASIP US$ 1,001.02 million over 2011-2015. The Government intends increasing its finance on rural development to reach the target of 10% of its total budget (in 2009 the Government spent 9% of its total spending in the agriculture sector). The total spending on agriculture would amount to around $67 million p.a., or $337 million over 5 years. Based on the projected state budget for 2011-2015, the gap between current allocation and the CAADP commitment to allocate 10% of budget to agriculture would be an average of around $131,7 million per year. This ‘CAADP financing gap’ is shown in figure 8.4.1.
32 Ghana’s current IMF agreed 3-year Poverty Reduction Strategy (PRS) finished in October 2006. Loans attached to it amounted to around US$258 million. The government has stated its intention to sign up to the IMF's policy support instrument and implement its own growth and poverty reduction strategy. In July 2004 Ghana reached Heavily Indebted Poor Countries (HIPC) completion point. Ghana’s debt has been massively reduced as a result of this.
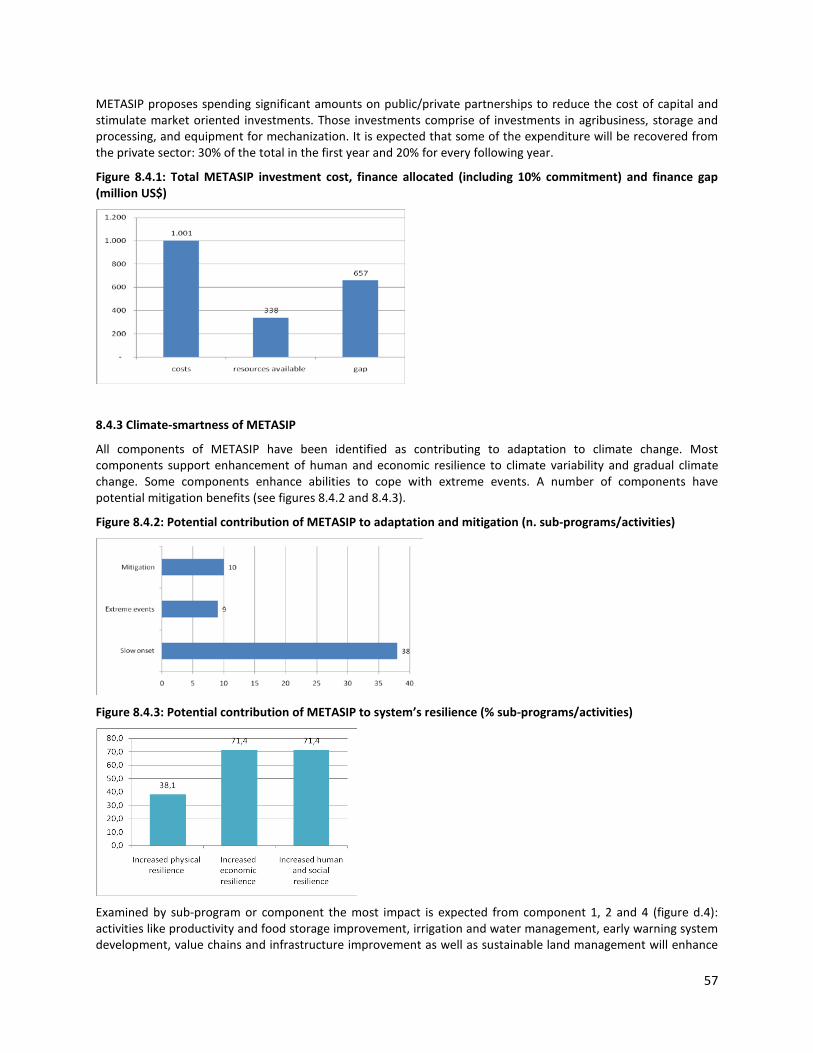
57
METASIP proposes spending significant amounts on public/private partnerships to reduce the cost of capital and stimulate market oriented investments. Those investments comprise of investments in agribusiness, storage and processing, and equipment for mechanization. It is expected that some of the expenditure will be recovered from the private sector: 30% of the total in the first year and 20% for every following year.
Figure 8.4.1: Total METASIP investment cost, finance allocated (including 10% commitment) and finance gap (million US$)
8.4.3 Climate-smartness of METASIP
All components of METASIP have been identified as contributing to adaptation to climate change. Most components support enhancement of human and economic resilience to climate variability and gradual climate change. Some components enhance abilities to cope with extreme events. A number of components have potential mitigation benefits (see figures 8.4.2 and 8.4.3).
Figure 8.4.2: Potential contribution of METASIP to adaptation and mitigation (n. sub-programs/activities)
Figure 8.4.3: Potential contribution of METASIP to system’s resilience (% sub-programs/activities)
Examined by sub-program or component the most impact is expected from component 1, 2 and 4 (figure d.4): activities like productivity and food storage improvement, irrigation and water management, early warning system development, value chains and infrastructure improvement as well as sustainable land management will enhance
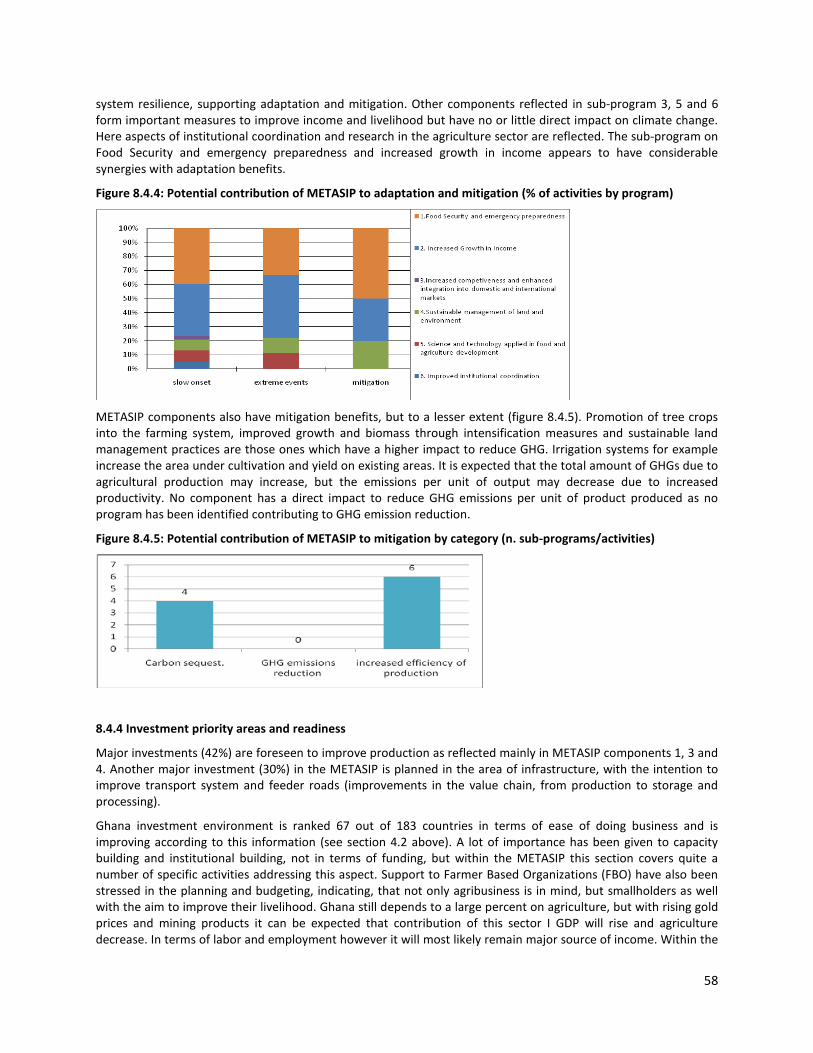
58
system resilience, supporting adaptation and mitigation. Other components reflected in sub-program 3, 5 and 6 form important measures to improve income and livelihood but have no or little direct impact on climate change. Here aspects of institutional coordination and research in the agriculture sector are reflected. The sub-program on Food Security and emergency preparedness and increased growth in income appears to have considerable synergies with adaptation benefits.
Figure 8.4.4: Potential contribution of METASIP to adaptation and mitigation (% of activities by program)
METASIP components also have mitigation benefits, but to a lesser extent (figure 8.4.5). Promotion of tree crops into the farming system, improved growth and biomass through intensification measures and sustainable land management practices are those ones which have a higher impact to reduce GHG. Irrigation systems for example increase the area under cultivation and yield on existing areas. It is expected that the total amount of GHGs due to agricultural production may increase, but the emissions per unit of output may decrease due to increased productivity. No component has a direct impact to reduce GHG emissions per unit of product produced as no program has been identified contributing to GHG emission reduction.
Figure 8.4.5: Potential contribution of METASIP to mitigation by category (n. sub-programs/activities)
8.4.4 Investment priority areas and readiness
Major investments (42%) are foreseen to improve production as reflected mainly in METASIP components 1, 3 and 4. Another major investment (30%) in the METASIP is planned in the area of infrastructure, with the intention to improve transport system and feeder roads (improvements in the value chain, from production to storage and processing).
Ghana investment environment is ranked 67 out of 183 countries in terms of ease of doing business and is improving according to this information (see section 4.2 above). A lot of importance has been given to capacity building and institutional building, not in terms of funding, but within the METASIP this section covers quite a number of specific activities addressing this aspect. Support to Farmer Based Organizations (FBO) have also been stressed in the planning and budgeting, indicating, that not only agribusiness is in mind, but smallholders as well with the aim to improve their livelihood. Ghana still depends to a large percent on agriculture, but with rising gold prices and mining products it can be expected that contribution of this sector I GDP will rise and agriculture decrease. In terms of labor and employment however it will most likely remain major source of income. Within the

59
METASIP the Government is explicitly highlighting the importance of the private sector, is looking for public private partnerships and is expecting an economic return after investing in this sector. Agribusiness, storage and processing, and equipment for mechanization are some of the investments foreseen in this area.
Ghana does not have a NAPA; therefore there is no comment with regard to consistency with this plan like in other countries screened.
Figure 8.4.6: Planned allocation of METASIP investment costs by expenditure type (% of total planned investment cost)
42%
15%
10%1%
29%
3%
production
value chains
research, capacity building
institutional support
infrastructure
welfare / disaster mgt
8.4.5 Conclusions
METASIP focuses investment largely on physical infrastructure and improvement of agriculture production and intensification. About 46% of total investments are targeted to improving the road network and 42% in agriculture production and intensification. The private sector is an important column in the plan. Sub programs 1, 2 and 4 are focusing on improved production and will therefore have most climate benefits. Most of the climate benefits are in adaptation to climate change but the plan has also a relevant mitigation potential.
Additional elements of agricultural production to be promoted under METASIP that could contribute to enhanced climate resilience include: agroforestry and fruit tree promotion into the farming system with fast growing nitrogen fixing trees; crop/ input insurance system for farmers; conservation agriculture including green manure and low tillage measures; intercropping and pest control; and soil and water conservation measures. Improvement of livestock and range management as well as livestock nutrition would enhance livestock production and held to minimize current meat imports by improving income of poor rural households at the same time.

60
8.5 Kenya Results from the CSA Screening of the Kenya Medium Term Investment Plan (MTIP, 2010-2015)
8.5.1 Brief Background
Kenya went through a major political crisis in 2007, when presidential elections were followed by violence. A large number of people were displaced as a result of re-emerging tensions over land distribution. Nevertheless, political consensus was reached in the following years and the new constitution passed in 2010.
Agriculture is the mainstay of the Kenyan economy, directly contributing 24% of the national GDP, valued at US$ 4,275 million per annum, and another 27% indirectly valued at US$ 4,813 million. The sector accounts for 65% of Kenya’s total exports and provides more than 60% of informal employment in the rural areas. Therefore, the sector is not only the driver of Kenya’s economy, but also the means of livelihood for the majority of the Kenyan people (see Kenya Agricultural Sector Development Strategy, ASDS 2009-20). Although less impressive than other parts of the economy, agriculture has performed well in recent years, growing faster than the rural population. The sector recovered from negative 3% growth in 2002 to positive 5.4%t by 2006. From 2007 to 2009, prolonged drought and civil unrest negatively impacted on the sector; nevertheless, the sector has returned to a positive growth and development path. Key to the recovery has been vibrant internal demand for major staples, livestock products, and horticultural goods, and a return to growth in key export sub-sectors such as coffee, tea, pyrethrum, horticulture, and cut flowers (see MTIP, 2010-2015). However, growth does not automatically translate into sustained improvements in food security and Kenya faces major food security challenges. Poor or failed cropping seasons from 2007 on resulted in continued deterioration of national food security.
8.5.2 The Agricultural Sector Medium Term Investment Plan (MTIP)
The framework for Kenya’s Medium-Term Investment Plan (MTIP, 2010–2015) for Growth and Food Security through increased Agricultural Productivity and Trade is fully aligned with the ASDS and CAADP. It reflects the Government’s comprehensive sector-wide approach to agricultural development and food security enhancement. It captures the diversity of agro-ecological facing sector participants. Its proposed investment areas emerge from the strategic thrusts prioritized in the ASDS and CAADP Compact. The aim of the ASDS and the MTIP is to achieve enhanced productivity in key sub sectors through targeted investments. Given the central role of agriculture in Kenya’s economy, such investments would contribute to GDP growth, poverty reduction, and food security enhancement that match national targets. In the Kenya context, the agricultural sector comprises the following sub-sectors: crops, livestock, fisheries, land, water, cooperatives, environment, regional development and forestry. The Kenyan MTIP is formulated around 6 pillars. (Figure 8.5.1).
Figure 8.5.1: MTIP Investment Pillars (source: MTIP)
Targeted investments will be made according to agro-ecological zones, differentiating between high rainfall areas (HRAs), semi-arid lands and arid lands:
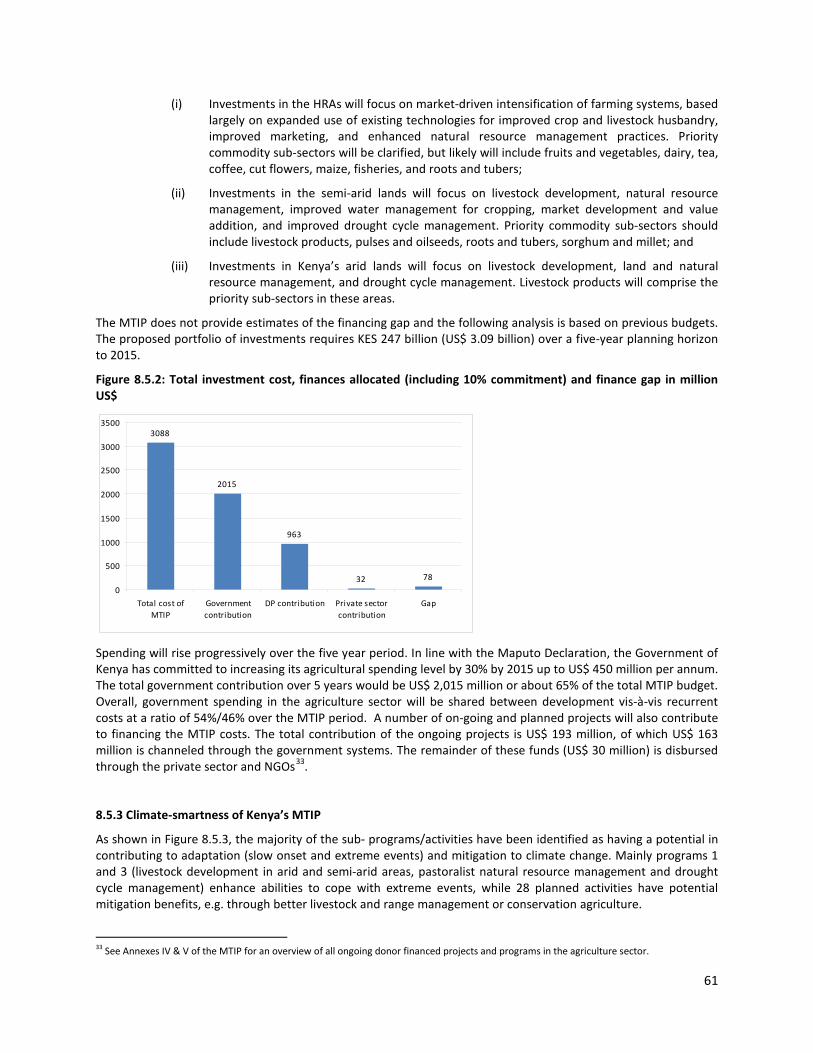
61
(i) Investments in the HRAs will focus on market-driven intensification of farming systems, based largely on expanded use of existing technologies for improved crop and livestock husbandry, improved marketing, and enhanced natural resource management practices. Priority commodity sub-sectors will be clarified, but likely will include fruits and vegetables, dairy, tea, coffee, cut flowers, maize, fisheries, and roots and tubers;
(ii) Investments in the semi-arid lands will focus on livestock development, natural resource management, improved water management for cropping, market development and value addition, and improved drought cycle management. Priority commodity sub-sectors should include livestock products, pulses and oilseeds, roots and tubers, sorghum and millet; and
(iii) Investments in Kenya’s arid lands will focus on livestock development, land and natural resource management, and drought cycle management. Livestock products will comprise the priority sub-sectors in these areas.
The MTIP does not provide estimates of the financing gap and the following analysis is based on previous budgets. The proposed portfolio of investments requires KES 247 billion (US$ 3.09 billion) over a five-year planning horizon to 2015.
Figure 8.5.2: Total investment cost, finances allocated (including 10% commitment) and finance gap in million US$
3088
2015
963
32 78
0
500
1000
1500
2000
2500
3000
3500
Total cost ofMTIP
Governmentcontribution
DP contribution Private sectorcontribution
Gap
Spending will rise progressively over the five year period. In line with the Maputo Declaration, the Government of Kenya has committed to increasing its agricultural spending level by 30% by 2015 up to US$ 450 million per annum. The total government contribution over 5 years would be US$ 2,015 million or about 65% of the total MTIP budget. Overall, government spending in the agriculture sector will be shared between development vis-à-vis recurrent costs at a ratio of 54%/46% over the MTIP period. A number of on-going and planned projects will also contribute to financing the MTIP costs. The total contribution of the ongoing projects is US$ 193 million, of which US$ 163 million is channeled through the government systems. The remainder of these funds (US$ 30 million) is disbursed through the private sector and NGOs33.
8.5.3 Climate-smartness of Kenya’s MTIP
As shown in Figure 8.5.3, the majority of the sub- programs/activities have been identified as having a potential in contributing to adaptation (slow onset and extreme events) and mitigation to climate change. Mainly programs 1 and 3 (livestock development in arid and semi-arid areas, pastoralist natural resource management and drought cycle management) enhance abilities to cope with extreme events, while 28 planned activities have potential mitigation benefits, e.g. through better livestock and range management or conservation agriculture.
33 See Annexes IV & V of the MTIP for an overview of all ongoing donor financed projects and programs in the agriculture sector.
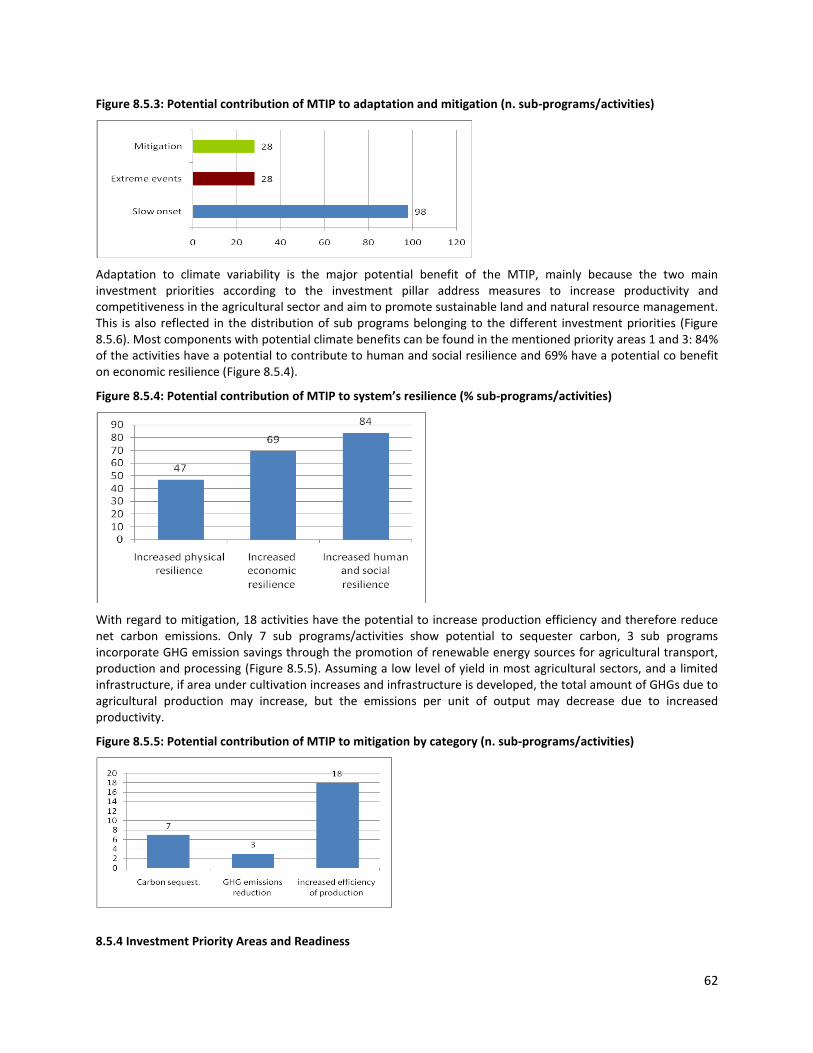
62
Figure 8.5.3: Potential contribution of MTIP to adaptation and mitigation (n. sub-programs/activities)
Adaptation to climate variability is the major potential benefit of the MTIP, mainly because the two main investment priorities according to the investment pillar address measures to increase productivity and competitiveness in the agricultural sector and aim to promote sustainable land and natural resource management. This is also reflected in the distribution of sub programs belonging to the different investment priorities (Figure 8.5.6). Most components with potential climate benefits can be found in the mentioned priority areas 1 and 3: 84% of the activities have a potential to contribute to human and social resilience and 69% have a potential co benefit on economic resilience (Figure 8.5.4).
Figure 8.5.4: Potential contribution of MTIP to system’s resilience (% sub-programs/activities)
With regard to mitigation, 18 activities have the potential to increase production efficiency and therefore reduce net carbon emissions. Only 7 sub programs/activities show potential to sequester carbon, 3 sub programs incorporate GHG emission savings through the promotion of renewable energy sources for agricultural transport, production and processing (Figure 8.5.5). Assuming a low level of yield in most agricultural sectors, and a limited infrastructure, if area under cultivation increases and infrastructure is developed, the total amount of GHGs due to agricultural production may increase, but the emissions per unit of output may decrease due to increased productivity.
Figure 8.5.5: Potential contribution of MTIP to mitigation by category (n. sub-programs/activities)
8.5.4 Investment Priority Areas and Readiness

63
Given the weather-driven cyclical nature of food insecurity in Kenya with pastoral and marginal agricultural areas being especially vulnerable, not surprisingly the largest share (68%) of investments are foreseen for increased production, where improved water management, mainly irrigation is the bulk of the investment foreseen (Figure 8.5.6). Other investment categories significantly fall behind as regards their dimension: research and capacity building (10,5%) and improved livestock management are other main investment categories.
Figure 8.5.6 : Planned allocation of MTIP investment costs by expenditure type (% of total planned investment cost)
production68%
value chains7%
research, capacity building
11%
institutional support
2%
infrastructure12%
other0% 0%
Overall, Kenya’s investment environment is considered to be fairly conducive, ranking 98 out of 183 countries in 2011, in terms of ease of doing business (down from 94th position in 2010) (see section 4.2 above). The potential for quick deployment is classified as ‘high’.
8.5.5 Consistency with NAPA
Kenya is not a Least Developed Country (LDC); therefore no NAPA has been prepared. However, a National Climate Change Response Strategy proposes strategic interventions in the following areas: (i) adaptation and mitigation measures; (ii) climate change communication, education and awareness; (iii) vulnerability assessment, impact monitoring and capacity building; (iv) research technology development, adoption and diffusion; (v) climate change governance; and (vi) action plan, resource mobilization plan and implementation framework. Several actions are proposed in the National Climate Change Response Strategy, such as promotion of improved crop varieties and livestock breeds, NRM, early warning systems, water management and irrigation, promotion conservation agriculture, etc.
The MTIP investment pillars integrate four foundations of successful climate change adaptation frameworks, namely: (i) information for effective planning and forecasting; (ii) infrastructure and management practices for climate proofing and resilience (e.g., such as flood defense and drainage systems; reservoirs, wells and irrigation channels, and soil restoration and conservation); (iii) resilience-enhancing measures for vulnerable groups; and (iv) institutions for disaster risk management, including early warning and response systems
8.5.6 Conclusions
The majority of Kenya s sub-programs have been identified of having a potential climate benefits. Program 1 (increased productivity) and program 3 (natural resource management) have the biggest potential addressing agriculture production, rangeland management, improved water resources, fertilizer and seed programs and improved breeding and fishing. Capacity building, infrastructure and institutional strengthening are also addressed. Early warnings systems and climate change adaptation measures are specifically addressed and programs have been differentiated between high rainfall areas, semi arid and dry areas. Major climate related issues have been considered and there is a fairly well consistency with other plans.
64
8.6 Liberia Results from the CSA screening of the Liberia Agricultural Sector Investment Plan (LASIP, 2009-14)
8.6.1 Brief background
Liberia is in a process of renewal after a 14-year conflict (1989-2003). Economic growth rates are high, but a severe ‘development deficit’ still affects much of agriculture and economic infrastructure.
Liberian agriculture comprises food and tree crops, fisheries and livestock. Rice and cassava are the main food crops and rubber, oil palm and cocoa are the dominant export-oriented tree crops. Food production is growing in post-conflict Liberia. However, crop yields are low, value chains are undeveloped, and institutions providing support services are very weak. Despite post-war increases in grain production, Liberia is a net importer of rice (60% of rice consumed in 2007), with per hectare yields half the Sub-Saharan average. Rubber, oil palm, cocoa and coffee accounted for 22% of GDP in 2005 and are a significant element of export earnings and employment. It is estimated that more than half of the agricultural households may currently be directly or indirectly involved in tree crop production and in related down-stream activities. Approximately half of the population is either food insecure or highly vulnerable to food insecurity, and it is estimated that at least two-thirds of Liberians live in poverty (i.e. < 1 US$ per day).
The NAPA does not provide detail on climate change impacts, since the national meteorology system was destroyed in the war. However, the groups most vulnerable to climate risks are identified as those that live in coastal areas and whose livelihoods consist of fishing, farming and trade. They are typically the least able to cope with climate-related shocks due primarily to a combination of extreme poverty levels and household income-generating activities that are highly limited. Liberia currently has abundant rainfall (4770 mm along the coast and 2030 mm in the interior). The impact of changing precipitation patterns are a concern, since this might impact on farming, municipal water and electricity supply and vector-water borne diseases (e.g. malaria).
8.6.2 The plan
Liberia Agricultural Sector Investment Plan (LASIP) is based around 4 components:
• Land and water development: land policy and tenure reform; enhanced land husbandry; expansion of irrigated agriculture; improved management of wetlands.
• Food and Nutrition Security: Food crop production and productivity; improved nutritional status and management of food emergencies; smallholder tree crops; fisheries development; livestock development; and a special initiative targeting youth and women.
• Competitive Value Chains and Market Linkages: rehabilitation and expansion of roads; rural infrastructure and energy; rural financial services; labor saving devices; and market and enterprise development.
• Institutional development: Rebuilding the agriculture ministry; revitalizing agricultural research; technology extension; agricultural education and training; promoting farm-based organizations; and improved coordination and management.
The budget estimates for LASIP total US$277.5 million over 2009-2014. There are different ways to estimate the financing gap faced. Liberia currently invests just 2.5% of government budget in agriculture, and most of this is used to cover recurrent expenditures of the ministry. Assuming the budget allocation for agriculture remains at 2.5% (i.e. an average of $8.55 million p.a.), based on the projected state budget for 2009-2012, the gap between current allocation and the CAADP commitment to allocate 10% of budget to agriculture would be an average of around $26.4 million per year. This is called the ‘CAADP financing gap’. If Liberia meets the CAADP 10% commitment, then the total spending on agriculture would amount to around $35 million p.a., or $175 million over 5 years. So even if the 10% commitment is achieved, there would be a financing gap for LASIP of $102.5 million over 5 years. If the agriculture budget remains at 2.5% of government spending, then the financing gap would be around $205 million over 5 years. These estimates have not considered existing donor commitments in Liberia’s agriculture sector.
65
Figure 8.6.1: Total investment cost, finance allocated (including 10% commitment) and finance gap in million US$
227.5
175
132
52.5
0
50
100
150
200
250
total cost ofLASIP
CAADP 10%finance
potential CAADPgap
potentialadditional
finance gap
8.6.3 Climate-smartness of LASIP
All components of LASIP have been identified as contributing to adaptation to climate change. Most components support enhancement of resilience to climate variability and gradual climate change. Some components enhance abilities to cope with extreme events. A number of components have potential mitigation benefits. Adaptation to climate variability and slow onset climate change is the major potential benefit of the LASIP, mainly because in this highly feed insecure country, most planned components would improve food production, productivity, food availability and agriculture-based income generation.
Figure 8.6.2: Potential contribution of LASIP to adaptation and mitigation (n. sub-programs/activities)
37
18
15
0 5 10 15 20 25 30 35 40
Slow onset
Extreme events
Mitigation
Figure 8.6.3: Potential contribution of LASIP to system’s resilience (% sub-programs/activities)
33
67
76
0
10
20
30
40
50
60
70
80
Increased physical resilience
Increased economic resilience
Increased human and social resilience
Examined by sub-program, the sub-program on Food Security and Nutrition is the sub-program that delivers the largest number of identified climate benefits. Three quarters of these benefits are in adaptation to slow onset climate change and resilience to extreme events. A large proportion of the total mitigation benefits identified in the plan are also due to activities proposed under the sub-program on Food Security and Nutrition, suggesting this program has the highest potential for identifying climate-smart investments. This is mainly due to the program’s focus on rehabilitation and diversification of smallholder farming systems, which would improve the physical, economic and social resilience of the population. Other sub-programs also contribute to physical resilience (e.g. by addressing soil erosion and improving irrigation and management of wetlands), economic resilience (e.g. by improving market linkages and credit) and social resilience (e.g. by revitalizing the institutions working with and supporting farmers).
Some sub-programs may have climate change mitigation benefits. Agroforestry and tree-based livelihoods would most likely sequester carbon. The majority of the mitigation benefits have been identified as having the potential to reduce the GHG emissions per unit of product produced.
66
Figure 8.6.4: Potential contribution of LASIP to adaptation and mitigation (% of activities by program)
0%
10%
20%
30%
40%
50%
60%
70%
80%
90%
100%
Slow onset Extreme events Mitigation
1. Land and Water Development
2. Food and Nutrition Security
3. Competetive Value Chains andMarket Linkages
4. Institutional Development
Assuming a low level of yield in most agricultural sectors, and a limited area under cultivation at present, if area under cultivation increases and yield on existing areas increases, the total amount of GHGs due to agricultural production may increase, but the emissions per unit of output may decrease due to increased productivity.
Figure 8.6.5: Potential contribution of LASIP to mitigation by category (n. sub-programs/activities)
4
0
11
0
2
4
6
8
10
12
Carbon sequest. GHG emissions reduction
increased efficiency of production
8.6.4 Investment priority areas and readiness
With major sub-components focused on addressing soil erosion, agroforestry, irrigation, wetland rice production, fertilizer and seeds and livestock production, just over one quarter of the planned investment would contribute directly to improved agricultural production practices (including fisheries), and another 15% plans investment in research and capacity building support to producers (see figure 8.6.6). Given the large ‘development deficit’ due to protracted war, significant investments (22%) are planned in rebuilding the physical infrastructure required for productive agriculture, including a large program to rehabilitate and expand rural roads. Limited capacity is identified in LASIP as a major constraint to up scaling, and 22% of planned investments are focused on institutional support.
Liberia has attracted several international commercial investments in the tree-crop sector (mainly rubber and oil palm), but with the recent rise in grain prices, international investors are also beginning to invest in rice production. In international comparison, Liberia’s investment environment is relatively unattractive, ranking 155 out of 183 countries in terms of ease of doing business (see section 4.2 above). However, LASIP is consistent with a number of other supportive policies in the agriculture sector, such as Liberia Poverty Reduction Strategy (LIFT Liberia, 2008), National Food Security and Nutrition Strategy (2008); Food and Agriculture Policy and Strategy (FAPS, 2009), suggesting overall coherence in the immediate policy sectors. Some issues such as land tenure and policy development are to be addressed within the framework of LASIP, which may improve the agricultural investment environment in coming years.
LASIP is explicit that there is a need to expand the share of agriculture in the national budget and to enhance the ministry of agriculture’s absorptive capacity if and when additional resources are made available. “It is also evident that the implementation capacity of MOA and its related institutions has to be enhanced otherwise they might be

67
unable to implement large programs. Building the capacity of these agricultural institutions should be done as a matter of priority if the level of financing to agriculture is to become meaningful as intended.” Rebuilding the institutional framework for coordinated agricultural development is a main component of LASIP. Planned activities include training for staff and restructuring of the ministry of agriculture. Many other components include development of inventories, guidelines and policies to guide interventions. This suggests that at present, there may be limited capacity in the relevant Liberian institutions for rapid up scaling of the program of activities outlined in LASIP.
Figure 8.6.6: Planned allocation of LASIP investment costs by expenditure type (% of total planned investment cost)
29%
11%
14%
22%
22%
2%
production
value chains
research, capacity building
institutional support
infrastructure
welfare / disaster mgt
8.6.5 Consistency with NAPA
Major components of LASIP are consistent with the NAPA, and with priority adaptation projects identified by the Liberian government. Agriculture (integrated crop and livestock farming), rural energy and fisheries are listed as priority sectors in the NAPA, and each of these sectors has planned investments in the LASIP. The top priority project submitted to UNFCCC in relation to the NAPA is “Enhancing resilience to increasing rainfall variability through the diversification of crop cultivation and small ruminants rearing”, which is supported by several LASIP sub-components (e.g. 2.1 Food Crops Production and Productivity Enhancement; 2.3 Smallholder Tree Crops and Agro-forestry Development; 2.5 Livestock Development and Promotion, as well as LASIP components to enhance rural financial services and marketing infrastructure).
8.6.6 Conclusions
LASIP, consistently with other food, nutrition and poverty reduction strategies, has a balanced focus of investment on support for agricultural production and improving the institutional and physical infrastructure for productive agriculture. Just over half of total investments are targeted to improving the road network, marketing, storage and processing facilities and building supportive institutions, and over 40% of investments focus on support to production and capacity building or other support to producers. While all programs have been identified as having climate benefits, sub-program 2 (‘Food and Nutrition Security’) is the sub-program identified as having the most climate benefits. Most of the climate benefits of LASIP are in adaptation to climate change and extreme events. Sub-program 2 also has some potential mitigation benefits, so there is potential to identify climate smart (food security + adaptation + mitigation) activities in this program. As suggested in the NAPA, aspects of agricultural production to be promoted under LASIP that could contribute to enhanced climate resilience include: timing of crop cultivation in response to changing patterns of rainfall; intercropping, irrigation, and the optimization of lowland/swamp farming practices; pest control; and maintaining fast growing nitrogen fixing tree species to improve soil fertility and using multiple-purpose tree species on farmlands to maintain forest cover. Another area of integration between the NAPA and LASIP relates to the promotion of and investment in wetlands. Increased cultivation in wetland areas may increase exposure to water borne diseases affecting farmers and livestock. Further integration of the results of risk assessments and abatement trials with the planning of agricultural development activities in these regions may be required.

68
8.7 Malawi Results from the CSA screening of the Malawi Agriculture Sector Wide Approach (ASWAP, 2009-13)
8.7.1 Brief background
Since Malawi’s independence, development resources, strategies and policies have been heavily biased towards agricultural development. Malawi has benefited from substantial donor programs over many years but, until very recently, has suffered from chronic food insecurity at both household and national levels. Most Malawians are poor, with 52.4% of the population living below the poverty line.
Agriculture is the most important sector of the Malawi economy. It employs about 80% of the total workforce, contributes over 80 per cent to foreign exchange earnings, accounts for 39% of gross domestic product (GDP) and contributes significantly to national and household food security. The agricultural sector is composed by the smallholder sub-sector (contributing 70% to agricultural GDP), and the estate sub-sector (30% of agricultural GDP). Smallholders cultivate mainly food crops such as maize (the main starchy staple), cassava and sweet potatoes to meet subsistence requirements. Estates focus on high value cash crops for export such as tobacco, tea, sugar, coffee and macadamia. Smallholder farmers cultivate small and fragmented land holdings under customary land tenure with yields lower than in the estate sector. Furthermore there has been low uptake of improved farm inputs by smallholders and smallholder agriculture remains unprofitable. Due to high risks in agricultural production and poor access to credit, investment and re-investment have been poor (see ASWAP, 2009-2013).
Malawi is heavily dependent on natural resources, mainly soils, water, fisheries from inland lakes and fuel wood from forests and changes in climatic patterns and an increase in extremes resulted in serious impacts. Malawi relies in fact on rain-fed agriculture, and in the past drought events have resulted in poor crop yields or total crop failure, leading to serious food shortages, hunger and malnutrition. Flooding has also severely disrupted food production in several districts of the country. Droughts and floods are the major climatic hazards affecting the fisheries sector, and have been responsible for the declining, or even drying up, of water bodies resulting in low fish production and loss of biodiversity. The major climatic hazards that threaten the forestry sector are extended droughts, which lead to land degradation and loss of soil fertility, as well as forest fires (see NAPA).
8.7.2 The plan
Malawi’s ASWAP 2010-14 proposes interventions to achieve the common aspirations of the Vision 2020 and the CAADP goals of attaining a robust agriculture sector growth and reduction of food insecurity sufficient to meet Malawi’s target under the first MDG of reducing poverty and hunger. The Malawi ASWAp has three Focus Areas:
(i) Food Security and Risk Management: promote maize self sufficiency (implementing the seed and fertilizer subsidy program and good agricultural practices, training in seed multiplication, constructing silos for seeds and strengthening migratory pests monitoring and control), diversification of food production and dietary diversification for improved nutrition at household level with focus on Crops, Livestock, and Fisheries, and improved post-harvest and risk management;
(ii) Commercial Agriculture, Agro-processing and Market Development: Increase agricultural export for improved balance of trade and income, promote commercial production and agro-processing for import substitution and domestic market development, input and output market development through public-private partnerships,; and
(iii) Sustainable Agricultural Land and Water Management: promote technologies that maintain soil fertility, water and wetland management, irrigation schemes construction and rehabilitation, water users association, prevent river banks degradation
These three Focus Areas will be strengthened by two Key Support Service areas which are cross-cutting actions namely:

69
(i) Technology Generation and Dissemination: results and market oriented research on priority technology needs and provision of technical and regulatory services, development of efficient farmer-led extension and training services; and
(ii) Institutional Strengthening and Capacity Building: strengthen public management systems; build capacity of the public and private sectors and mainstream gender and HIV/AIDS.
The budget estimates for Malawi ASWAP total US$1,752 million over 2009-2014. Resources available are US$1,137 million of which US$704 million from the Government budget and US$433 million from donors. This means that the Government budget is funding 8.3% of ASWAP. The ASWAP funding gap over the 5 years period (2009-14) amounts to US$614 million. However, the state budget for 2010/11 shows that Malawi currently invests 11% of government budget in agriculture, which is above the CAADP commitment to allocate 10% of budget to agriculture.
Figure 8.7.1: Total investment cost, finance allocated and finance gap in million US$
1,752.00
1,137.66
614.35
-
200.00
400.00
600.00
800.00
1,000.00
1,200.00
1,400.00
1,600.00
1,800.00
2,000.00
costs resources available gap
8.7.3 Climate-smartness of ASWAP
Most ASWAP components support enhancement of resilience to climate variability and gradual climate change (slow onset) while only a few components enhance abilities to cope with extreme events (e.g. actions to reduce storage losses and to promote establish a warehouse receipt system, promotion of village grain bank schemes, establishment of a maize market insurance system, strengthen weather forecasting capability for agriculture). Only a limited number of components have potential mitigation benefits. Adaptation to climate variability and slow onset climate change is the major potential benefit of the ASWAP, mainly because in this highly feed insecure country, most planned components would improve food productivity and agriculture-based income generation, water management, inputs availability (seeds and fertilizers) and overall technical capacity (at farm and institutional levels), with expected benefits in terms of increased physical and human/social resilience.
Figure 8.7.2: Potential contribution of ASWAP to adaptation and mitigation (n. sub-programs/activities)
26
4
6
0 5 10 15 20 25 30
Slow onset
Extreme events
Mitigation

70
Figure 8.7.3: Potential contribution of ASWAP to system’s resilience (% sub-programs/activities)
69
46
85
0102030405060708090
Increased physical resilience
Increased economic resilience
Increased human and social resilience
‘Food security and risk management’, ‘Technology generation and dissemination’ and ‘Commercial agriculture and market development’ are the focus areas of the Malawi ASWAP that deliver the largest number of identified climate benefits, mostly on adaptation to slow onset climate change (improved productivity, increased income diversification and market opportunities, development of research and extension activities). Focus area ‘Sustainable land and water management’ is the most relevant in terms of contribution to extreme events adaptation (restoration of soil fertility, improved water management, expanded irrigation) and is also identified as key to increasing agricultural productivity in Malawi.
Figure 8.7.4: Potential contribution of ASWAP to adaptation and mitigation (% of activities by program)
0%
10%
20%
30%
40%
50%
60%
70%
80%
90%
100%
Slow onset Extreme events
Mitigation
1. Food security and risk management
2. Commercial agriculture and market development
3. Sustainable land and water management
4. Key support service: technology generation and dissemination
5. Institutional strenghtening and Capacity building
6. Cross cutting issues
The mitigation contribution of the ASWAP is limited. Mitigation benefits derive mainly from ‘Technology generation and dissemination’ (improved varieties, crop and livestock production technologies, and post-harvest management). Other activities contributing to mitigation are related to sustainable land and water management (reduced land degradation, improved wetland management) and to improved seed development and use. The majority of the mitigation benefits have been identified as having the potential to sequester Carbon and to reduce the GHG emissions per unit of product produced. Assuming a low level of yield in most agricultural sectors, if area under cultivation increases and yield on existing areas increases, the total amount of GHGs due to agricultural production may increase, but the emissions per unit of output may decrease due to increased productivity.

71
Figure 8.7.5: Potential contribution of ASWAP to mitigation by category (n. sub-programs/activities)
23
0
23
0
5
10
15
20
25
Carbon sequest. GHG emissions reduction
increased efficiency of production
8.7.4 Investment priority areas and readiness
Most investments planned under the ASWAP are related to agriculture production increase (improved land and water management, improved seed production, increased fishery sector, and research support), while only 11% of the investments are planned in improving physical infrastructure required for productive agriculture (mainly irrigation). A significant amount of resources (10%) is devoted to research, capacity building and institution support, which are considered as key elements in supporting the activities which focus on production increase.
Figure 8.7.6: Planned allocation of investment by expenditure type (% of total planned investment cost)
74%
3%
6%
4%
11%
2%
production
value chains
research, capacity building
institutional support
infrastructure
other
Overall Malawi’s investment environment is relatively unattractive, ranking 133 out of 183 countries in terms of ease of doing business (see section 4.2 above). However, Malawi’s legal system, which is based on the English common law, protects investment regardless of ownership and the country is a signatory to international treaties for the protection of foreign investment. Also, ASWAP is explicitly promoting cooperation with private sector and building of public-private partnerships. There are various sectors which provide opportunities for foreign investors especially in agri-business: cotton (growing, ginning, spinning, weaving and knitting), tobacco, tea, sugar and rice. ASWAP builds upon strong ongoing programs currently being implemented in Malawi (e.g. Farmer Input Supply Program - FISP and Green Belt Initiative - GBI), showing a medium/high potential for quick deployment of climate-smart agriculture investments. Nevertheless, ASWAP acknowledges the primary institutional challenges facing implementation and capacity constraints of the numerous institutional actors within the sector and is also explicit that there is a need to launch an institutional reform process and to improve capacity of staff in the ministry. However, only 4% of the total budget is devoted to strengthening public management systems and capacity building of the public and private sector. This is probably an underestimate of the resources needed for a comprehensive upgrading of human capacity and management systems within the agriculture sector. This suggests that at present, there may be limited capacity in the relevant Liberian institutions for rapid up scaling of the program of activities outlined in ASWAP.
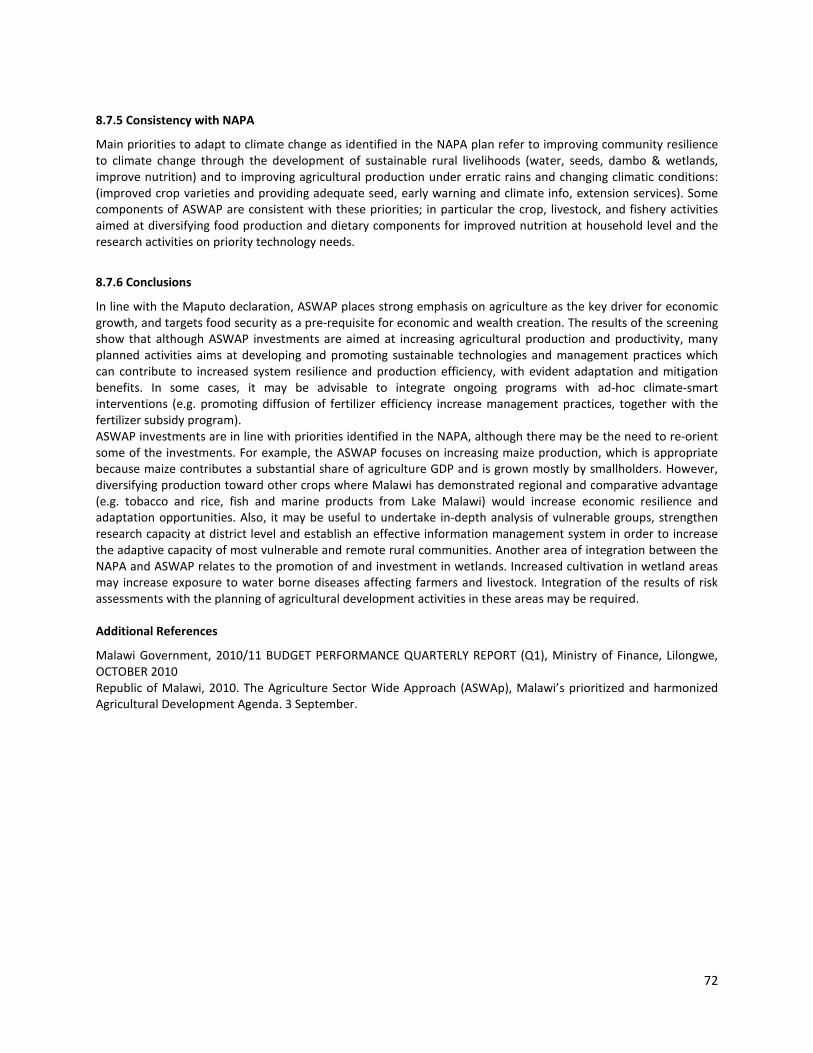
72
8.7.5 Consistency with NAPA
Main priorities to adapt to climate change as identified in the NAPA plan refer to improving community resilience to climate change through the development of sustainable rural livelihoods (water, seeds, dambo & wetlands, improve nutrition) and to improving agricultural production under erratic rains and changing climatic conditions: (improved crop varieties and providing adequate seed, early warning and climate info, extension services). Some components of ASWAP are consistent with these priorities; in particular the crop, livestock, and fishery activities aimed at diversifying food production and dietary components for improved nutrition at household level and the research activities on priority technology needs.
8.7.6 Conclusions
In line with the Maputo declaration, ASWAP places strong emphasis on agriculture as the key driver for economic growth, and targets food security as a pre-requisite for economic and wealth creation. The results of the screening show that although ASWAP investments are aimed at increasing agricultural production and productivity, many planned activities aims at developing and promoting sustainable technologies and management practices which can contribute to increased system resilience and production efficiency, with evident adaptation and mitigation benefits. In some cases, it may be advisable to integrate ongoing programs with ad-hoc climate-smart interventions (e.g. promoting diffusion of fertilizer efficiency increase management practices, together with the fertilizer subsidy program). ASWAP investments are in line with priorities identified in the NAPA, although there may be the need to re-orient some of the investments. For example, the ASWAP focuses on increasing maize production, which is appropriate because maize contributes a substantial share of agriculture GDP and is grown mostly by smallholders. However, diversifying production toward other crops where Malawi has demonstrated regional and comparative advantage (e.g. tobacco and rice, fish and marine products from Lake Malawi) would increase economic resilience and adaptation opportunities. Also, it may be useful to undertake in-depth analysis of vulnerable groups, strengthen research capacity at district level and establish an effective information management system in order to increase the adaptive capacity of most vulnerable and remote rural communities. Another area of integration between the NAPA and ASWAP relates to the promotion of and investment in wetlands. Increased cultivation in wetland areas may increase exposure to water borne diseases affecting farmers and livestock. Integration of the results of risk assessments with the planning of agricultural development activities in these areas may be required. Additional References
Malawi Government, 2010/11 BUDGET PERFORMANCE QUARTERLY REPORT (Q1), Ministry of Finance, Lilongwe, OCTOBER 2010 Republic of Malawi, 2010. The Agriculture Sector Wide Approach (ASWAp), Malawi’s prioritized and harmonized Agricultural Development Agenda. 3 September.
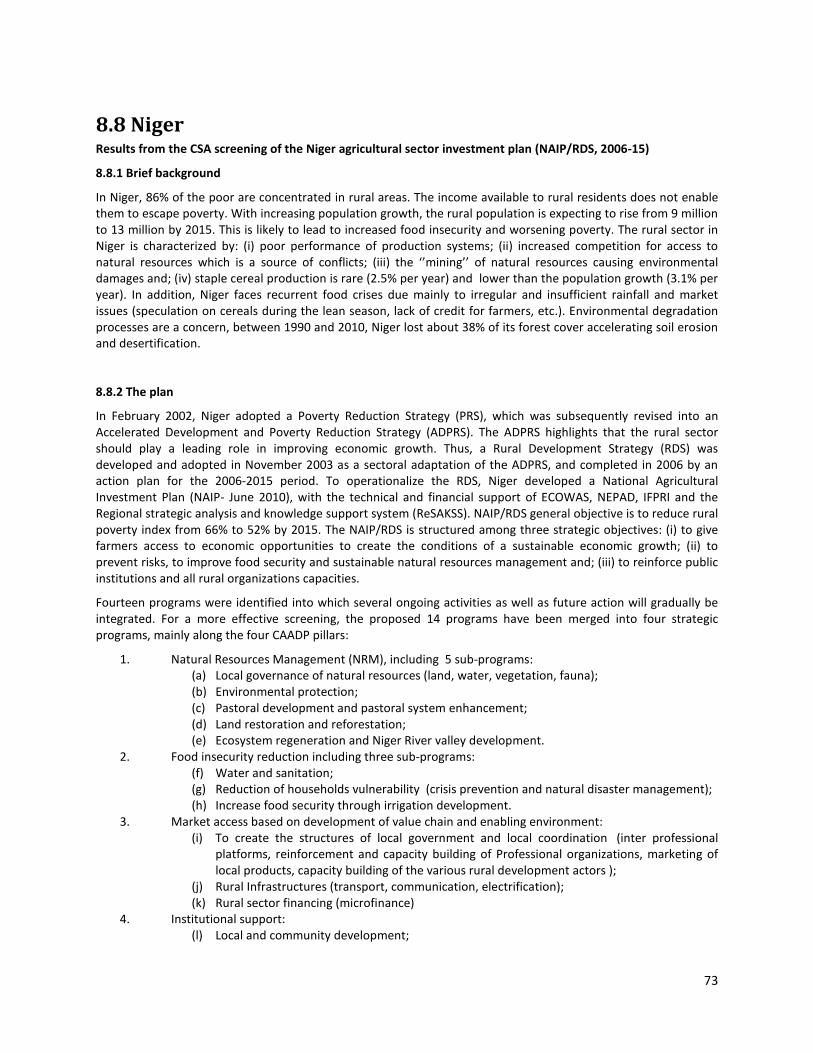
73
8.8 Niger Results from the CSA screening of the Niger agricultural sector investment plan (NAIP/RDS, 2006-15)
8.8.1 Brief background
In Niger, 86% of the poor are concentrated in rural areas. The income available to rural residents does not enable them to escape poverty. With increasing population growth, the rural population is expecting to rise from 9 million to 13 million by 2015. This is likely to lead to increased food insecurity and worsening poverty. The rural sector in Niger is characterized by: (i) poor performance of production systems; (ii) increased competition for access to natural resources which is a source of conflicts; (iii) the ‘’mining’’ of natural resources causing environmental damages and; (iv) staple cereal production is rare (2.5% per year) and lower than the population growth (3.1% per year). In addition, Niger faces recurrent food crises due mainly to irregular and insufficient rainfall and market issues (speculation on cereals during the lean season, lack of credit for farmers, etc.). Environmental degradation processes are a concern, between 1990 and 2010, Niger lost about 38% of its forest cover accelerating soil erosion and desertification.
8.8.2 The plan
In February 2002, Niger adopted a Poverty Reduction Strategy (PRS), which was subsequently revised into an Accelerated Development and Poverty Reduction Strategy (ADPRS). The ADPRS highlights that the rural sector should play a leading role in improving economic growth. Thus, a Rural Development Strategy (RDS) was developed and adopted in November 2003 as a sectoral adaptation of the ADPRS, and completed in 2006 by an action plan for the 2006-2015 period. To operationalize the RDS, Niger developed a National Agricultural Investment Plan (NAIP- June 2010), with the technical and financial support of ECOWAS, NEPAD, IFPRI and the Regional strategic analysis and knowledge support system (ReSAKSS). NAIP/RDS general objective is to reduce rural poverty index from 66% to 52% by 2015. The NAIP/RDS is structured among three strategic objectives: (i) to give farmers access to economic opportunities to create the conditions of a sustainable economic growth; (ii) to prevent risks, to improve food security and sustainable natural resources management and; (iii) to reinforce public institutions and all rural organizations capacities.
Fourteen programs were identified into which several ongoing activities as well as future action will gradually be integrated. For a more effective screening, the proposed 14 programs have been merged into four strategic programs, mainly along the four CAADP pillars:
1. Natural Resources Management (NRM), including 5 sub-programs: (a) Local governance of natural resources (land, water, vegetation, fauna); (b) Environmental protection; (c) Pastoral development and pastoral system enhancement; (d) Land restoration and reforestation; (e) Ecosystem regeneration and Niger River valley development.
2. Food insecurity reduction including three sub-programs: (f) Water and sanitation; (g) Reduction of households vulnerability (crisis prevention and natural disaster management); (h) Increase food security through irrigation development.
3. Market access based on development of value chain and enabling environment: (i) To create the structures of local government and local coordination (inter professional
platforms, reinforcement and capacity building of Professional organizations, marketing of local products, capacity building of the various rural development actors );
(j) Rural Infrastructures (transport, communication, electrification); (k) Rural sector financing (microfinance)
4. Institutional support: (l) Local and community development;
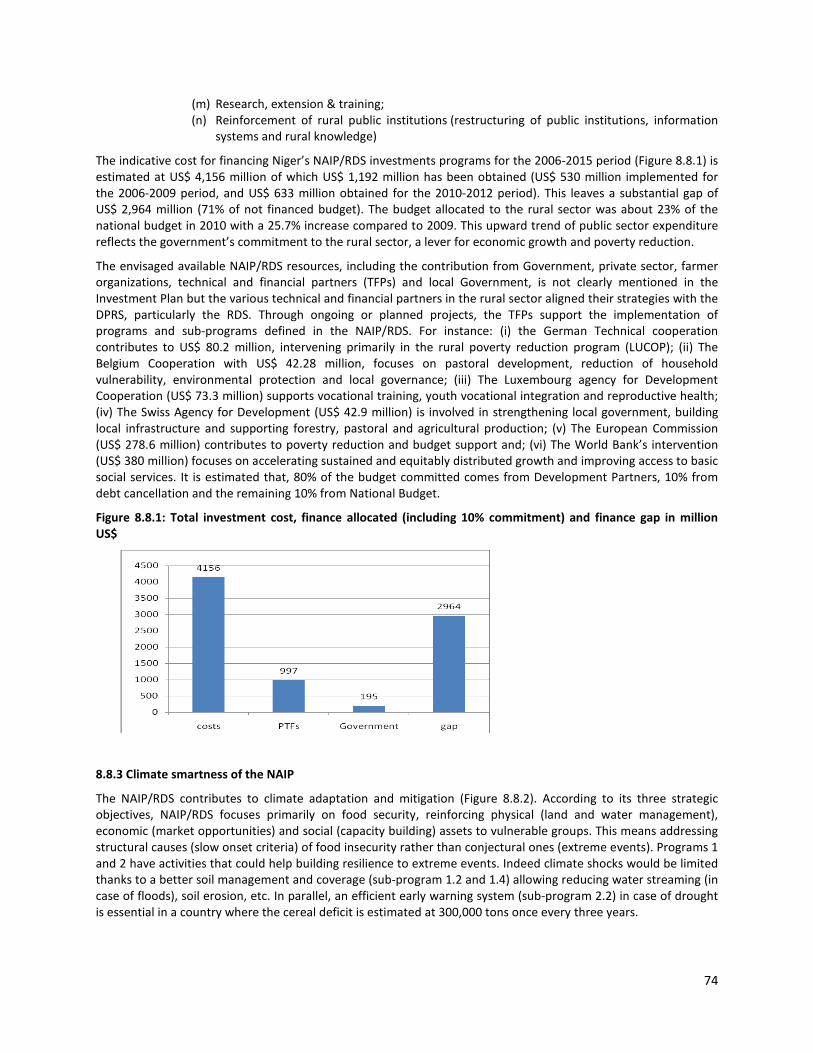
74
(m) Research, extension & training; (n) Reinforcement of rural public institutions (restructuring of public institutions, information
systems and rural knowledge)
The indicative cost for financing Niger’s NAIP/RDS investments programs for the 2006-2015 period (Figure 8.8.1) is estimated at US$ 4,156 million of which US$ 1,192 million has been obtained (US$ 530 million implemented for the 2006-2009 period, and US$ 633 million obtained for the 2010-2012 period). This leaves a substantial gap of US$ 2,964 million (71% of not financed budget). The budget allocated to the rural sector was about 23% of the national budget in 2010 with a 25.7% increase compared to 2009. This upward trend of public sector expenditure reflects the government’s commitment to the rural sector, a lever for economic growth and poverty reduction.
The envisaged available NAIP/RDS resources, including the contribution from Government, private sector, farmer organizations, technical and financial partners (TFPs) and local Government, is not clearly mentioned in the Investment Plan but the various technical and financial partners in the rural sector aligned their strategies with the DPRS, particularly the RDS. Through ongoing or planned projects, the TFPs support the implementation of programs and sub-programs defined in the NAIP/RDS. For instance: (i) the German Technical cooperation contributes to US$ 80.2 million, intervening primarily in the rural poverty reduction program (LUCOP); (ii) The Belgium Cooperation with US$ 42.28 million, focuses on pastoral development, reduction of household vulnerability, environmental protection and local governance; (iii) The Luxembourg agency for Development Cooperation (US$ 73.3 million) supports vocational training, youth vocational integration and reproductive health; (iv) The Swiss Agency for Development (US$ 42.9 million) is involved in strengthening local government, building local infrastructure and supporting forestry, pastoral and agricultural production; (v) The European Commission (US$ 278.6 million) contributes to poverty reduction and budget support and; (vi) The World Bank’s intervention (US$ 380 million) focuses on accelerating sustained and equitably distributed growth and improving access to basic social services. It is estimated that, 80% of the budget committed comes from Development Partners, 10% from debt cancellation and the remaining 10% from National Budget.
Figure 8.8.1: Total investment cost, finance allocated (including 10% commitment) and finance gap in million US$
8.8.3 Climate smartness of the NAIP
The NAIP/RDS contributes to climate adaptation and mitigation (Figure 8.8.2). According to its three strategic objectives, NAIP/RDS focuses primarily on food security, reinforcing physical (land and water management), economic (market opportunities) and social (capacity building) assets to vulnerable groups. This means addressing structural causes (slow onset criteria) of food insecurity rather than conjectural ones (extreme events). Programs 1 and 2 have activities that could help building resilience to extreme events. Indeed climate shocks would be limited thanks to a better soil management and coverage (sub-program 1.2 and 1.4) allowing reducing water streaming (in case of floods), soil erosion, etc. In parallel, an efficient early warning system (sub-program 2.2) in case of drought is essential in a country where the cereal deficit is estimated at 300,000 tons once every three years.
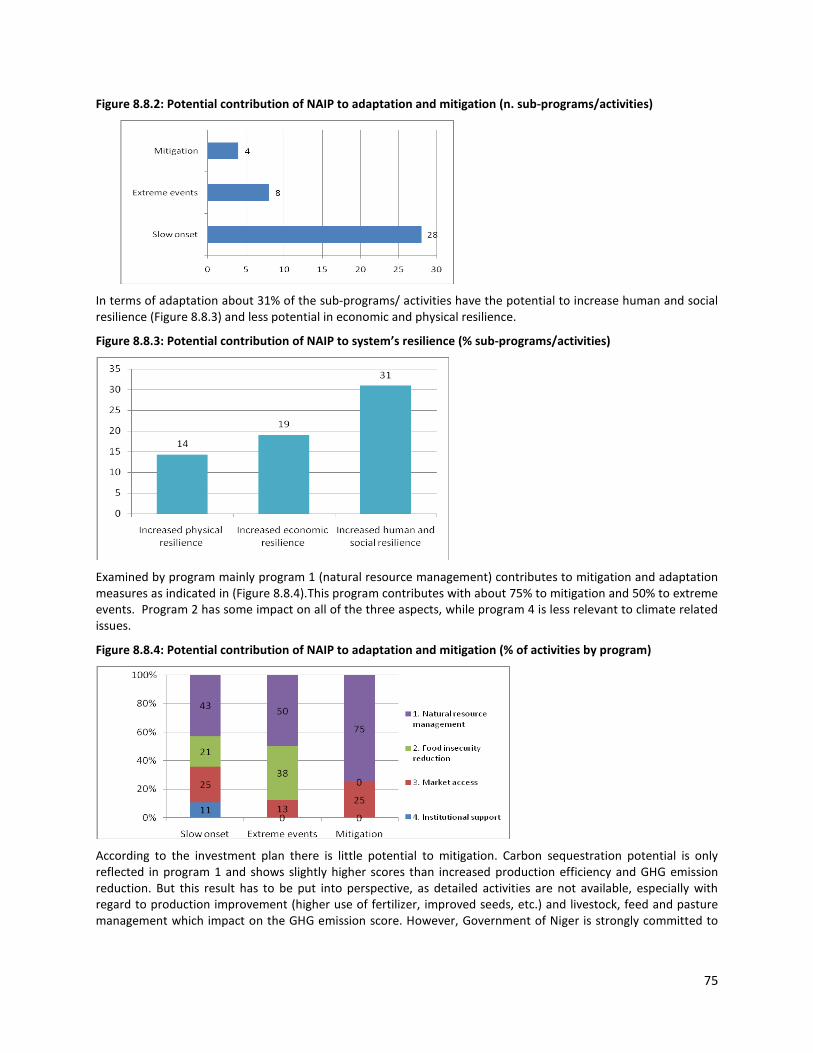
75
Figure 8.8.2: Potential contribution of NAIP to adaptation and mitigation (n. sub-programs/activities)
In terms of adaptation about 31% of the sub-programs/ activities have the potential to increase human and social resilience (Figure 8.8.3) and less potential in economic and physical resilience.
Figure 8.8.3: Potential contribution of NAIP to system’s resilience (% sub-programs/activities)
Examined by program mainly program 1 (natural resource management) contributes to mitigation and adaptation measures as indicated in (Figure 8.8.4).This program contributes with about 75% to mitigation and 50% to extreme events. Program 2 has some impact on all of the three aspects, while program 4 is less relevant to climate related issues.
Figure 8.8.4: Potential contribution of NAIP to adaptation and mitigation (% of activities by program)
According to the investment plan there is little potential to mitigation. Carbon sequestration potential is only reflected in program 1 and shows slightly higher scores than increased production efficiency and GHG emission reduction. But this result has to be put into perspective, as detailed activities are not available, especially with regard to production improvement (higher use of fertilizer, improved seeds, etc.) and livestock, feed and pasture management which impact on the GHG emission score. However, Government of Niger is strongly committed to
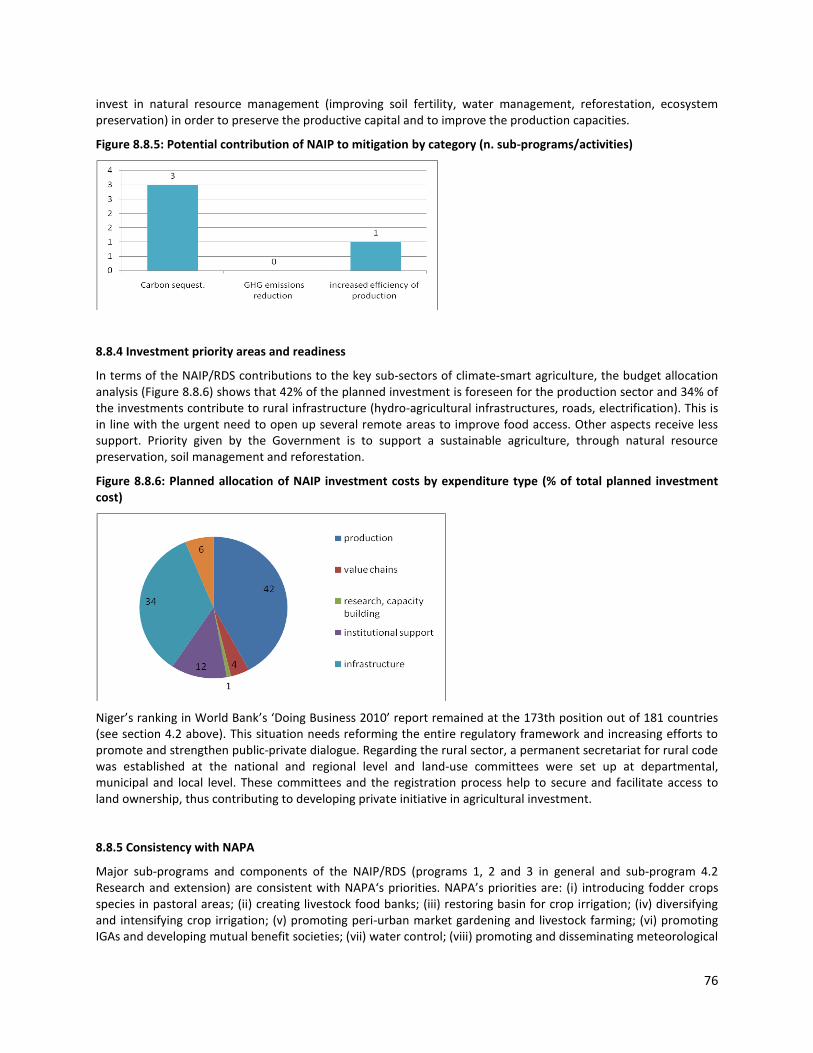
76
invest in natural resource management (improving soil fertility, water management, reforestation, ecosystem preservation) in order to preserve the productive capital and to improve the production capacities.
Figure 8.8.5: Potential contribution of NAIP to mitigation by category (n. sub-programs/activities)
8.8.4 Investment priority areas and readiness
In terms of the NAIP/RDS contributions to the key sub-sectors of climate-smart agriculture, the budget allocation analysis (Figure 8.8.6) shows that 42% of the planned investment is foreseen for the production sector and 34% of the investments contribute to rural infrastructure (hydro-agricultural infrastructures, roads, electrification). This is in line with the urgent need to open up several remote areas to improve food access. Other aspects receive less support. Priority given by the Government is to support a sustainable agriculture, through natural resource preservation, soil management and reforestation.
Figure 8.8.6: Planned allocation of NAIP investment costs by expenditure type (% of total planned investment cost)
Niger’s ranking in World Bank’s ‘Doing Business 2010’ report remained at the 173th position out of 181 countries (see section 4.2 above). This situation needs reforming the entire regulatory framework and increasing efforts to promote and strengthen public-private dialogue. Regarding the rural sector, a permanent secretariat for rural code was established at the national and regional level and land-use committees were set up at departmental, municipal and local level. These committees and the registration process help to secure and facilitate access to land ownership, thus contributing to developing private initiative in agricultural investment.
8.8.5 Consistency with NAPA
Major sub-programs and components of the NAIP/RDS (programs 1, 2 and 3 in general and sub-program 4.2 Research and extension) are consistent with NAPA‘s priorities. NAPA’s priorities are: (i) introducing fodder crops species in pastoral areas; (ii) creating livestock food banks; (iii) restoring basin for crop irrigation; (iv) diversifying and intensifying crop irrigation; (v) promoting peri-urban market gardening and livestock farming; (vi) promoting IGAs and developing mutual benefit societies; (vii) water control; (viii) promoting and disseminating meteorological

77
data; (ix) creating food banks; (x) contributing to fight against climate-related diseases; (xi) improving erosion control actions for agricultural, forestry and pastoral purposes; (xii) disseminating animal and crop species that are most adapted to climate conditions; (xiii) watershed protection and rehabilitation of dump-off ponds and; (xiv) building of material, technical and organizational capacities of rural producers. For that reason, about 83% of NAIP/RDS costs are consistent with NAPA priorities.
8.8.6 Conclusions
All programs in the NAIP/RDS have potential climate benefits. Despite the lack of detailed activities within the investment document, it is clear that one of the priorities of the Government of Niger is to secure agricultural production by creating around runoff water retention sites, a propitious environment for flood-water farming, irrigation, grazing activities and watershed protection. However, the lack of details on main activities leaves open whether agricultural intensification will be accompanied by climate-friendly practices.
To better ensure climate resilience, the NAIP/RDS should also consider the following aspects: extension of adapted techniques for sustainable crop intensification such as integrated water management, integrated soil fertility, integrated pests and disease management; promoting the use of improved seeds to protect agro biodiversity; Promoting the introduction of innovative techniques that reduce negative impact on the environment such as localized fertilization, green fertilizers; post-harvest losses reduction; agriculture diversification; off-farm income diversification.
All this actions can be taken in an effective and efficient way if at the institutional level the following challenges would have to be discussed: the way to manage a complicated “donors driven” and heavy structure at central and regional levels; consensus among Development Partners and Government of Niger on response/approaches (project based, programmatic, sector based) and financials tools (basket funding, budgetary, non budgetary common funds..); a framework to promote more sophisticated financial tools (budgetary support) in order to raise more funds but a major risk in case of poor public expenditure and financial management; and the risk of development partners ‘stop and go’ policies on the opposite of RDS objectives (efficiency, effectiveness).
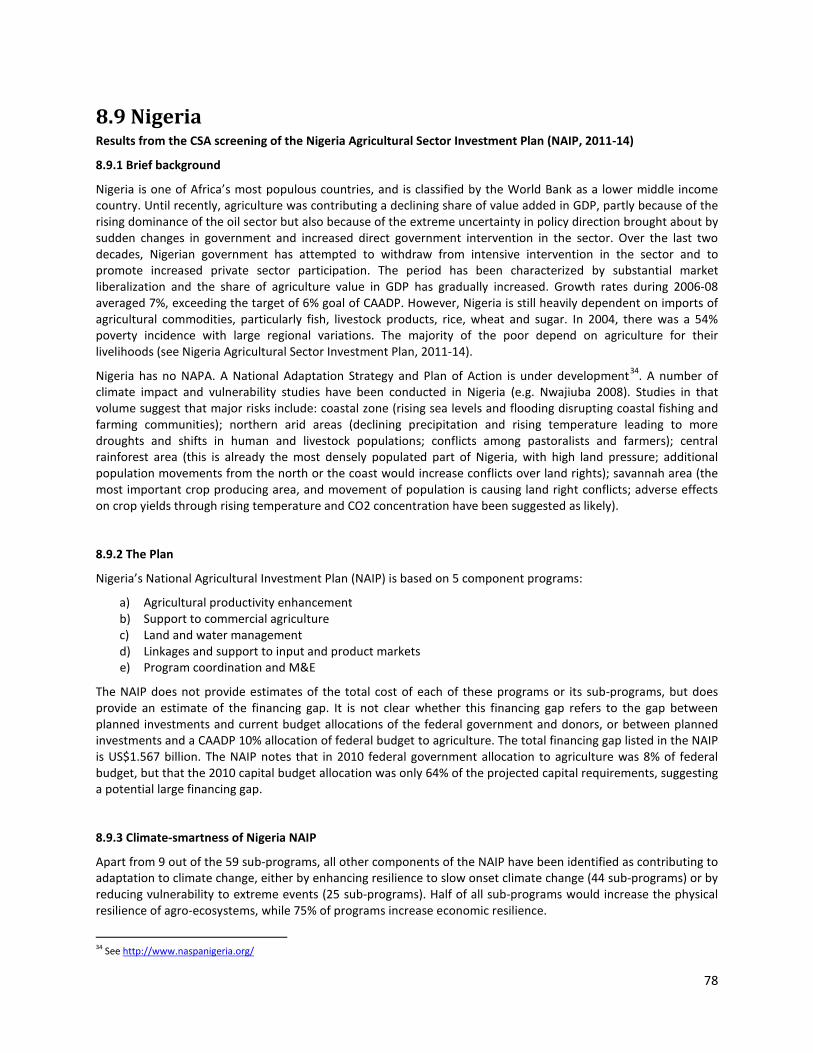
78
8.9 Nigeria Results from the CSA screening of the Nigeria Agricultural Sector Investment Plan (NAIP, 2011-14)
8.9.1 Brief background
Nigeria is one of Africa’s most populous countries, and is classified by the World Bank as a lower middle income country. Until recently, agriculture was contributing a declining share of value added in GDP, partly because of the rising dominance of the oil sector but also because of the extreme uncertainty in policy direction brought about by sudden changes in government and increased direct government intervention in the sector. Over the last two decades, Nigerian government has attempted to withdraw from intensive intervention in the sector and to promote increased private sector participation. The period has been characterized by substantial market liberalization and the share of agriculture value in GDP has gradually increased. Growth rates during 2006-08 averaged 7%, exceeding the target of 6% goal of CAADP. However, Nigeria is still heavily dependent on imports of agricultural commodities, particularly fish, livestock products, rice, wheat and sugar. In 2004, there was a 54% poverty incidence with large regional variations. The majority of the poor depend on agriculture for their livelihoods (see Nigeria Agricultural Sector Investment Plan, 2011-14).
Nigeria has no NAPA. A National Adaptation Strategy and Plan of Action is under development34. A number of climate impact and vulnerability studies have been conducted in Nigeria (e.g. Nwajiuba 2008). Studies in that volume suggest that major risks include: coastal zone (rising sea levels and flooding disrupting coastal fishing and farming communities); northern arid areas (declining precipitation and rising temperature leading to more droughts and shifts in human and livestock populations; conflicts among pastoralists and farmers); central rainforest area (this is already the most densely populated part of Nigeria, with high land pressure; additional population movements from the north or the coast would increase conflicts over land rights); savannah area (the most important crop producing area, and movement of population is causing land right conflicts; adverse effects on crop yields through rising temperature and CO2 concentration have been suggested as likely).
8.9.2 The Plan
Nigeria’s National Agricultural Investment Plan (NAIP) is based on 5 component programs:
a) Agricultural productivity enhancement b) Support to commercial agriculture c) Land and water management d) Linkages and support to input and product markets e) Program coordination and M&E
The NAIP does not provide estimates of the total cost of each of these programs or its sub-programs, but does provide an estimate of the financing gap. It is not clear whether this financing gap refers to the gap between planned investments and current budget allocations of the federal government and donors, or between planned investments and a CAADP 10% allocation of federal budget to agriculture. The total financing gap listed in the NAIP is US$1.567 billion. The NAIP notes that in 2010 federal government allocation to agriculture was 8% of federal budget, but that the 2010 capital budget allocation was only 64% of the projected capital requirements, suggesting a potential large financing gap.
8.9.3 Climate-smartness of Nigeria NAIP
Apart from 9 out of the 59 sub-programs, all other components of the NAIP have been identified as contributing to adaptation to climate change, either by enhancing resilience to slow onset climate change (44 sub-programs) or by reducing vulnerability to extreme events (25 sub-programs). Half of all sub-programs would increase the physical resilience of agro-ecosystems, while 75% of programs increase economic resilience.
34 See http://www.naspanigeria.org/

79
Figure 8.9.1: Potential contribution of NAIP to adaptation and mitigation (n. sub-programs/activities)
101
25
42
0 20 40 60 80 100 120
Slow onset
Extreme events
Mitigation
Figure 8.9.2: Potential contribution of NAIP to system’s resilience (% sub-programs/activities)
49
75
44
0
10
20
30
40
50
60
70
80
Increased physical resilience
Increased economic resilience
Increased human and social resilience
Examined by sub-program, the vast majority (about 80%) of all identified climate benefits could be provided by two programs: the program on agricultural productivity enhancement and the program on land and water management. These two programs account for 74% of slow onset adaptation benefits and 92% of extreme event adaptation benefits. This is mainly because these programs include planned investments to upscale sustainable land management programs (e.g. the Fadama III program and the National Program for Food Security) and a number of irrigation projects.
Figure 8.9.3: Potential contribution of NAIP to adaptation and mitigation (% of activities by program)
0%10%20%30%40%50%60%70%80%90%
100%
s low onset extreme events mitigation
1. Agricul tura l Productivi tyEnhancement
2.Support to Commercia lAgricul ture
3. Land & water management
4. Linkages and Support toInputs and Products Markets
5. Programme coordination,M&E
70% of sub-programs may have climate change mitigation benefits. A small number of programs may sequester carbon (mainly those with agroforestry, land reclamation or grass planting, and soil fertility interventions), while the majority of potential mitigation benefits are due to improved productivity with reduced emissions per unit of output. Increasing agricultural productivity is the focus of program 1 of the NAIP.
Figure 8.9.4: Potential contribution of NAIP to mitigation by category (n. sub-programs/activities)
8
0
34
0
5
10
15
20
25
30
35
40
Carbon sequest. GHG emissions reduction
increased efficiency of production
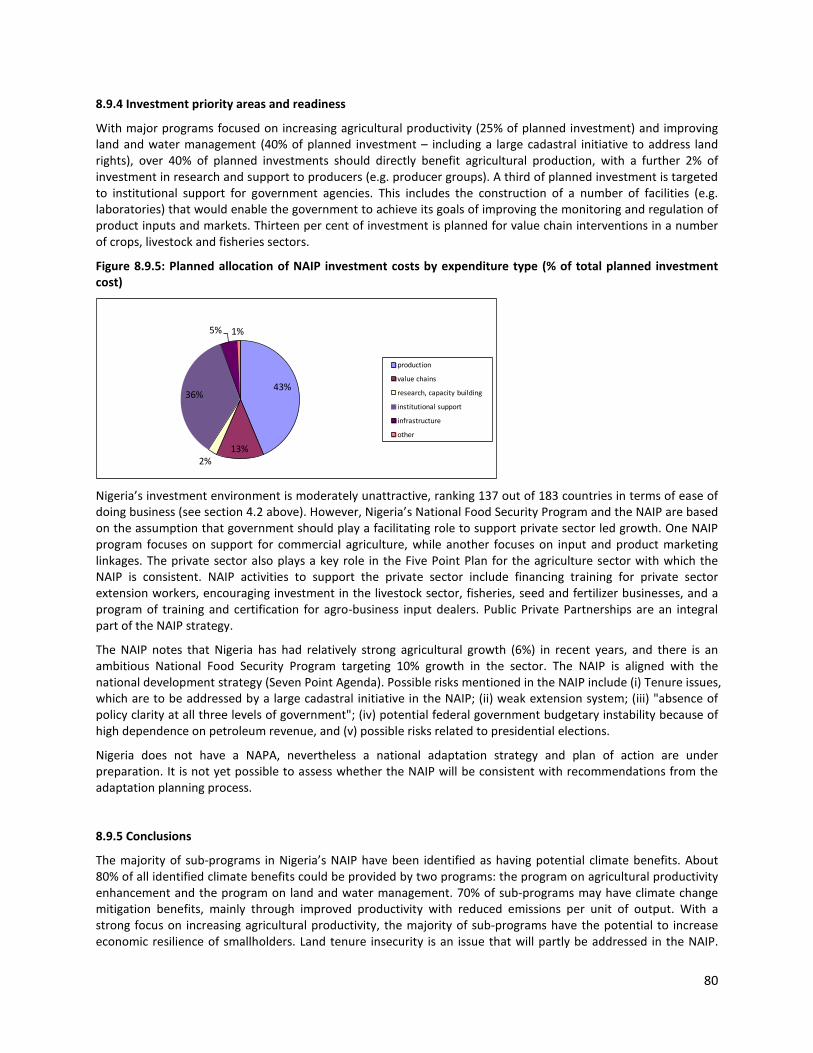
80
8.9.4 Investment priority areas and readiness
With major programs focused on increasing agricultural productivity (25% of planned investment) and improving land and water management (40% of planned investment – including a large cadastral initiative to address land rights), over 40% of planned investments should directly benefit agricultural production, with a further 2% of investment in research and support to producers (e.g. producer groups). A third of planned investment is targeted to institutional support for government agencies. This includes the construction of a number of facilities (e.g. laboratories) that would enable the government to achieve its goals of improving the monitoring and regulation of product inputs and markets. Thirteen per cent of investment is planned for value chain interventions in a number of crops, livestock and fisheries sectors.
Figure 8.9.5: Planned allocation of NAIP investment costs by expenditure type (% of total planned investment cost)
43%
13%2%
36%
5% 1%
production
value chains
research, capacity building
institutional support
infrastructure
other
Nigeria’s investment environment is moderately unattractive, ranking 137 out of 183 countries in terms of ease of doing business (see section 4.2 above). However, Nigeria’s National Food Security Program and the NAIP are based on the assumption that government should play a facilitating role to support private sector led growth. One NAIP program focuses on support for commercial agriculture, while another focuses on input and product marketing linkages. The private sector also plays a key role in the Five Point Plan for the agriculture sector with which the NAIP is consistent. NAIP activities to support the private sector include financing training for private sector extension workers, encouraging investment in the livestock sector, fisheries, seed and fertilizer businesses, and a program of training and certification for agro-business input dealers. Public Private Partnerships are an integral part of the NAIP strategy.
The NAIP notes that Nigeria has had relatively strong agricultural growth (6%) in recent years, and there is an ambitious National Food Security Program targeting 10% growth in the sector. The NAIP is aligned with the national development strategy (Seven Point Agenda). Possible risks mentioned in the NAIP include (i) Tenure issues, which are to be addressed by a large cadastral initiative in the NAIP; (ii) weak extension system; (iii) "absence of policy clarity at all three levels of government"; (iv) potential federal government budgetary instability because of high dependence on petroleum revenue, and (v) possible risks related to presidential elections.
Nigeria does not have a NAPA, nevertheless a national adaptation strategy and plan of action are under preparation. It is not yet possible to assess whether the NAIP will be consistent with recommendations from the adaptation planning process.
8.9.5 Conclusions
The majority of sub-programs in Nigeria’s NAIP have been identified as having potential climate benefits. About 80% of all identified climate benefits could be provided by two programs: the program on agricultural productivity enhancement and the program on land and water management. 70% of sub-programs may have climate change mitigation benefits, mainly through improved productivity with reduced emissions per unit of output. With a strong focus on increasing agricultural productivity, the majority of sub-programs have the potential to increase economic resilience of smallholders. Land tenure insecurity is an issue that will partly be addressed in the NAIP.

81
Climate benefits of agricultural sector interventions could be enhanced if vulnerable areas (e.g. coastal zones and the arid northern areas) are considered for targeting of specific activities. Within the livestock sector plans, there are relatively few activities designed to address the needs of pastoralists in the arid northern areas. Along with land rights issues, vulnerability of pastoralists to climate change has been identified by other studies as contributing to increased conflict with farmers. It would be advisable for key stakeholders in the NAIP to engage in processes that will lead to production of the National Adaptation Strategy and plan of action.
Additional References
Nwajiuba, C , 2008. Climate Change and Adaptation in Nigeria. Magraf Verlag

82
8.10 Rwanda Results from the CSA screening of the Rwanda Agricultural Sector Investment Plan (NAIP, 2009-12)
8.10.1 Brief background
According to the Rwandan Vision 2020, Rwanda’s land resources are used in an inefficient and unsustainable manner, which limits the profitability of land and infrastructure. High density population zones are currently characterized by overexploitation of lands and a vegetal cover severely altered. Erosion and landslides processes are advanced. This situation explains the present migratory dynamic of people from the most densely populated provinces in the North and the South towards the least populated provinces especially in the East and South East in search of a new land for agriculture and livestock. Rwanda faces a situation of land scarcity in which 87% of the population depends on agriculture. As a result, soil fertility has deteriorated dramatically over time, while fertilizer use, both organic and inorganic remains low. Fertility loss is compounded by the fact that 80% of arable land is on slopes between 5 and 55%. The country suffered from longstanding underinvestment in food and nutrition security and agriculture until late 1990s. This has been reversed in recent years and raising agricultural productivity per hectare as well as economic development are absolute priorities. The present strong dependency on natural resources in Rwanda makes economic activities directly dependent on climate conditions. In addition, because of overuse of natural resources, the ecosystems are more and more degraded. These only two factors explain the vulnerability of Rwanda in a context of climate insecurity.
8.10.2 The plan
The purpose of the Rwanda agriculture investment plan (2009-12) is to contribute to sustainable food and nutritional security, to increase the incomes of rural households, and to secure national economic growth. The plan aims to transform agriculture into a modern, professionally-managed and market-oriented economic undertaking. This will be achieved through targeted investments that create an environment conducive to increased production, investing in the infrastructure required for agricultural intensification, professionalism promotion, agricultural technological innovations and public-private sector partnerships. The plan is structured among four strategic programs:
1. Intensification and development of sustainable production systems (to relieve physical and economic constraints to food and nutrition security, erosion control, water management and input use);
2. Support to the professionalization of producers (to make farmers the knowledge-intensive sector it needs to be in order to see the private sector flourish and for farmers’ to begin to see this sector as a business);
3. Promotion of commodity chains and agribusiness development (to create the environment, infrastructure and knowledge necessary for a strong inputs and processing sector); and
4. Institutional development.
Figure 8.10.1: Total investment cost, finance allocated (including 10% commitment) and finance gap in million US$
In this resource constrained scenario, in the plan the following priorities have been identified: achieving food and nutrition security and halving poverty by increasing the productivity per hectare of staple crops (through
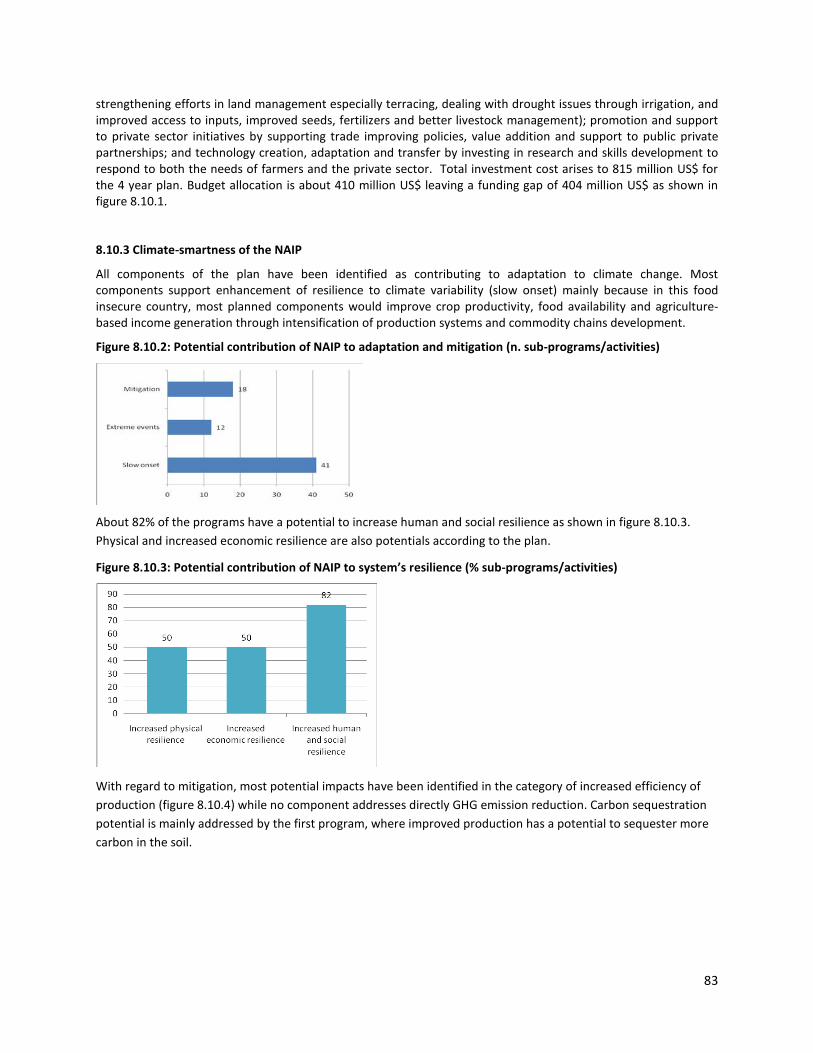
83
strengthening efforts in land management especially terracing, dealing with drought issues through irrigation, and improved access to inputs, improved seeds, fertilizers and better livestock management); promotion and support to private sector initiatives by supporting trade improving policies, value addition and support to public private partnerships; and technology creation, adaptation and transfer by investing in research and skills development to respond to both the needs of farmers and the private sector. Total investment cost arises to 815 million US$ for the 4 year plan. Budget allocation is about 410 million US$ leaving a funding gap of 404 million US$ as shown in figure 8.10.1.
8.10.3 Climate-smartness of the NAIP
All components of the plan have been identified as contributing to adaptation to climate change. Most components support enhancement of resilience to climate variability (slow onset) mainly because in this food insecure country, most planned components would improve crop productivity, food availability and agriculture-based income generation through intensification of production systems and commodity chains development.
Figure 8.10.2: Potential contribution of NAIP to adaptation and mitigation (n. sub-programs/activities)
About 82% of the programs have a potential to increase human and social resilience as shown in figure 8.10.3. Physical and increased economic resilience are also potentials according to the plan.
Figure 8.10.3: Potential contribution of NAIP to system’s resilience (% sub-programs/activities)
With regard to mitigation, most potential impacts have been identified in the category of increased efficiency of production (figure 8.10.4) while no component addresses directly GHG emission reduction. Carbon sequestration potential is mainly addressed by the first program, where improved production has a potential to sequester more carbon in the soil.

84
Figure 8.10.4: Number of sub- programs/ activities with potential contribution to mitigation by category
As shown in figure 8.10.5 program 1 is the program with the highest potential in climate related benefits with around 60% of all climate benefits foreseen in the plan.
Figure 8.10.5: Potential contribution of NAIP to adaptation and mitigation (% of activities by program)
0%
10%
20%
30%
40%
50%
60%
70%
80%
90%
100%
Slow onset Extreme events
Mitigation
1. Intensification sust. prod. systems
2. Support professionalization producers
3. Commodity Chains, Horticulture and Agribusiness Development
4. Institutional Development: public sector andregulatory framework
8.10.4 Investment priority areas and readiness
Most planned investments (40% of total costs) are related to sustainable land and water management and an additional 17% will be devoted to improved fertilization. This is perfectly in line with the average low soil fertility level in the country and the crucial need to increase crop productivity and food security. Most of the planned interventions are also delivering significant co-benefits in terms of climate change adaptation and mitigation, in a climate-smart logic.
Figure 8.10.6: Planned allocation of investment by expenditure type (% of total planned investment cost)
75%
13%
5%5%
0% 2%
production
value chains
research, capacity building
institutional support
infrastructure
other
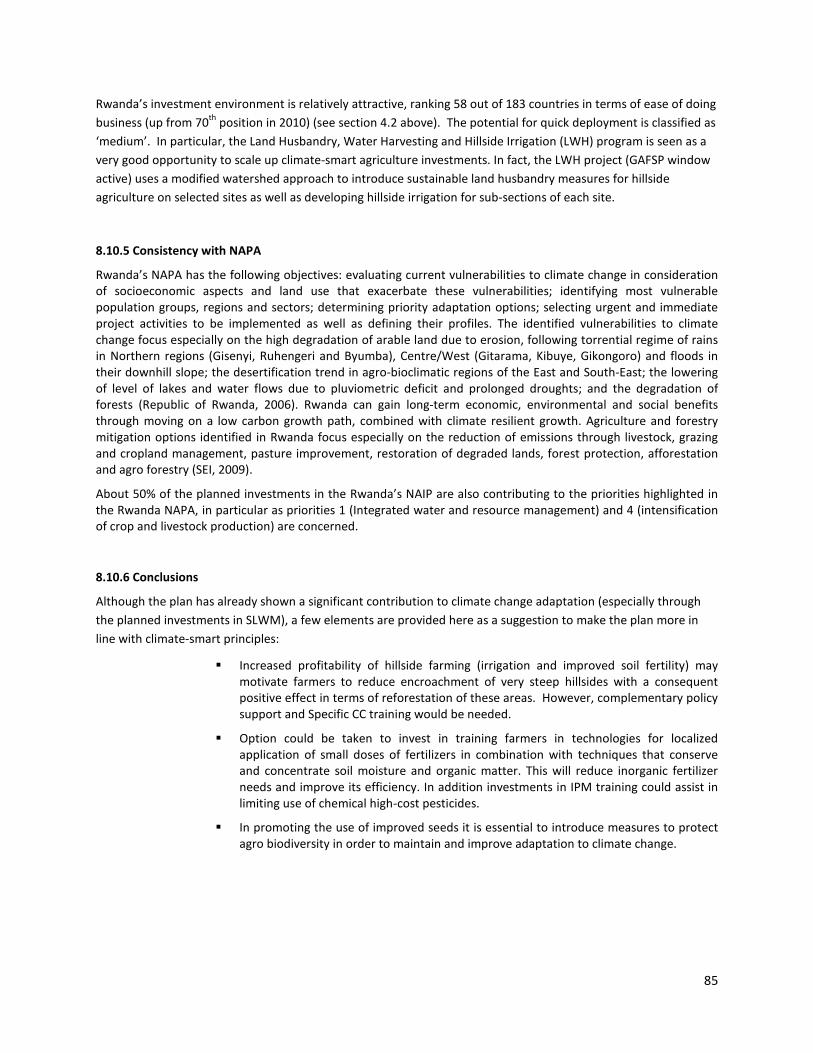
85
Rwanda’s investment environment is relatively attractive, ranking 58 out of 183 countries in terms of ease of doing business (up from 70th position in 2010) (see section 4.2 above). The potential for quick deployment is classified as ‘medium’. In particular, the Land Husbandry, Water Harvesting and Hillside Irrigation (LWH) program is seen as a very good opportunity to scale up climate-smart agriculture investments. In fact, the LWH project (GAFSP window active) uses a modified watershed approach to introduce sustainable land husbandry measures for hillside agriculture on selected sites as well as developing hillside irrigation for sub-sections of each site.
8.10.5 Consistency with NAPA
Rwanda’s NAPA has the following objectives: evaluating current vulnerabilities to climate change in consideration of socioeconomic aspects and land use that exacerbate these vulnerabilities; identifying most vulnerable population groups, regions and sectors; determining priority adaptation options; selecting urgent and immediate project activities to be implemented as well as defining their profiles. The identified vulnerabilities to climate change focus especially on the high degradation of arable land due to erosion, following torrential regime of rains in Northern regions (Gisenyi, Ruhengeri and Byumba), Centre/West (Gitarama, Kibuye, Gikongoro) and floods in their downhill slope; the desertification trend in agro-bioclimatic regions of the East and South-East; the lowering of level of lakes and water flows due to pluviometric deficit and prolonged droughts; and the degradation of forests (Republic of Rwanda, 2006). Rwanda can gain long-term economic, environmental and social benefits through moving on a low carbon growth path, combined with climate resilient growth. Agriculture and forestry mitigation options identified in Rwanda focus especially on the reduction of emissions through livestock, grazing and cropland management, pasture improvement, restoration of degraded lands, forest protection, afforestation and agro forestry (SEI, 2009).
About 50% of the planned investments in the Rwanda’s NAIP are also contributing to the priorities highlighted in the Rwanda NAPA, in particular as priorities 1 (Integrated water and resource management) and 4 (intensification of crop and livestock production) are concerned.
8.10.6 Conclusions
Although the plan has already shown a significant contribution to climate change adaptation (especially through the planned investments in SLWM), a few elements are provided here as a suggestion to make the plan more in line with climate-smart principles:
Increased profitability of hillside farming (irrigation and improved soil fertility) may motivate farmers to reduce encroachment of very steep hillsides with a consequent positive effect in terms of reforestation of these areas. However, complementary policy support and Specific CC training would be needed.
Option could be taken to invest in training farmers in technologies for localized application of small doses of fertilizers in combination with techniques that conserve and concentrate soil moisture and organic matter. This will reduce inorganic fertilizer needs and improve its efficiency. In addition investments in IPM training could assist in limiting use of chemical high-cost pesticides.
In promoting the use of improved seeds it is essential to introduce measures to protect agro biodiversity in order to maintain and improve adaptation to climate change.

86
8.11 Senegal Results from the CSA screening of the Senegal Agriculture Investment Plan (PIA, 2011-15)
8.11.1 Brief background
Approximately 58% of the Senegalese population lives rurally and 70% of this rural population depends on agriculture. Despite rural inhabitants’ high dependence on agriculture, it comprises less than 14% of Senegal’s GDP. The productivity of this sector has been steadily declining over the past 25 years. The Senegalese agricultural sector is comprised primarily of smallholder farmers practicing rain-fed cultivation; currently less than 5% of cropped area is irrigated. As the primary irrigated crop, rice enjoys much more stable production than the other seven main Senegalese crops: millet, groundnut, maize, sorghum, cotton, cassava, and cowpea. These seven crops are highly exposed to drought and/or flooding, and their yearly production varies greatly with the weather.
Although rainfall variability explains a large portion of the weak Senegalese agricultural sector, it is not the sole factor impacting production. A variety of factors interact to decrease production, including price instability of agricultural products, decreasing soil fertility and deterioration of ecosystems, limited interest of the private sector to invest in agriculture, and limited access to agricultural credit for farmers. The combination of these factors and climatic variability has resulted in the Senegalese agricultural sector being left behind. Yields have remained low and variable for the past 50 years (with the exception of rice), with no consistent yield increase trends.
The Government of Senegal selected the agricultural sector as a driver of its economic growth, food security improvement and poverty reduction over the 2011-15 period. Senegal is a country with tremendous transformational development potential that also faces significant threats. More than 3 million people - about 25% of the total population – suffer from seasonal or year-round hunger, compromising Senegal’s ability to achieve sustainable economic growth. This is the combined effect of longstanding underinvestment in the agricultural sector, but also high vulnerability to food shocks and external factors such as the soaring food prices. The country has finalized their NEPAD Country Investment Plan - Plan d’Investissement Agricole (PIA). It is aligned with the Senegalese Government’s Accelerated Growth Strategy (SCA) and the Comprehensive Africa Agricultural Program (CAADP): it promotes a sustainable modern agriculture, productive and competitive within regional and international markets.
8.11.2 The plan
The Agricultural Investment Plan (PIA) for Senegal is based on 8 strategic objectives corresponding to 8 sub-programs: (1) climate risk reduction through water control; (2) sustainable natural resource management; (3) production and productivity; (4) agricultural product processing; (5) market access improvement; (6) agricultural research and extension strengthening; (7) stakeholder’s capacities building; and, (8) effective coordination of PIA implementation. For a more effective screening, the proposed 8 sub-programs have been merged into four strategic programs, mainly along the four CAADP pillars:
a) Natural Resources Management (NRM), which includes sub-program 1and 2 (drip irrigation, borehole drilling, pond management, soil fertility management, reforestation, marine ecosystem preservation and capacity building on NRM);
b) Production and productivity improvement including elements of sub-program 3 such as seed production, equipment, fertilizer availability, sustainable crop management, livestock and aquaculture development;
c) Value chain enhancement, including sub-program 4 and 5 (crop, livestock and fish processing, food safety, building storage and processing facilities); and,
d) Institutional support, including sub-program 6, 7 and 8 (farmer safety nets, research and agricultural education support, service provider development, land reform, early warning system, information system on livestock, coordination).
The total cost of the PIA is estimated at US$ 2,909 million over the 2011-15 period: the funding gap is substantial, since about 50% of the PIA budget (US$ 1462.8 million) is not yet financed (Figure 8.11.1). Over the period of 2000-06, the agricultural sector budget of the Senegalese Government was about 4.6% of the total national budget. The
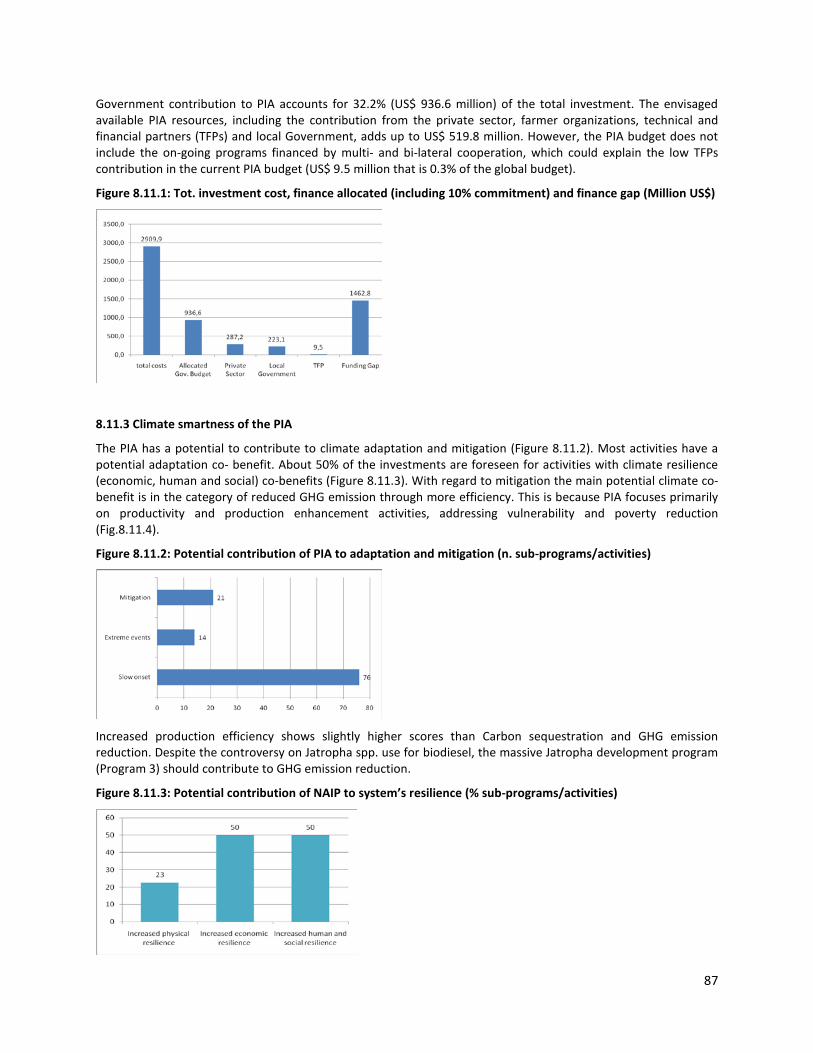
87
Government contribution to PIA accounts for 32.2% (US$ 936.6 million) of the total investment. The envisaged available PIA resources, including the contribution from the private sector, farmer organizations, technical and financial partners (TFPs) and local Government, adds up to US$ 519.8 million. However, the PIA budget does not include the on-going programs financed by multi- and bi-lateral cooperation, which could explain the low TFPs contribution in the current PIA budget (US$ 9.5 million that is 0.3% of the global budget).
Figure 8.11.1: Tot. investment cost, finance allocated (including 10% commitment) and finance gap (Million US$)
8.11.3 Climate smartness of the PIA
The PIA has a potential to contribute to climate adaptation and mitigation (Figure 8.11.2). Most activities have a potential adaptation co- benefit. About 50% of the investments are foreseen for activities with climate resilience (economic, human and social) co-benefits (Figure 8.11.3). With regard to mitigation the main potential climate co- benefit is in the category of reduced GHG emission through more efficiency. This is because PIA focuses primarily on productivity and production enhancement activities, addressing vulnerability and poverty reduction (Fig.8.11.4).
Figure 8.11.2: Potential contribution of PIA to adaptation and mitigation (n. sub-programs/activities)
Increased production efficiency shows slightly higher scores than Carbon sequestration and GHG emission reduction. Despite the controversy on Jatropha spp. use for biodiesel, the massive Jatropha development program (Program 3) should contribute to GHG emission reduction.
Figure 8.11.3: Potential contribution of NAIP to system’s resilience (% sub-programs/activities)
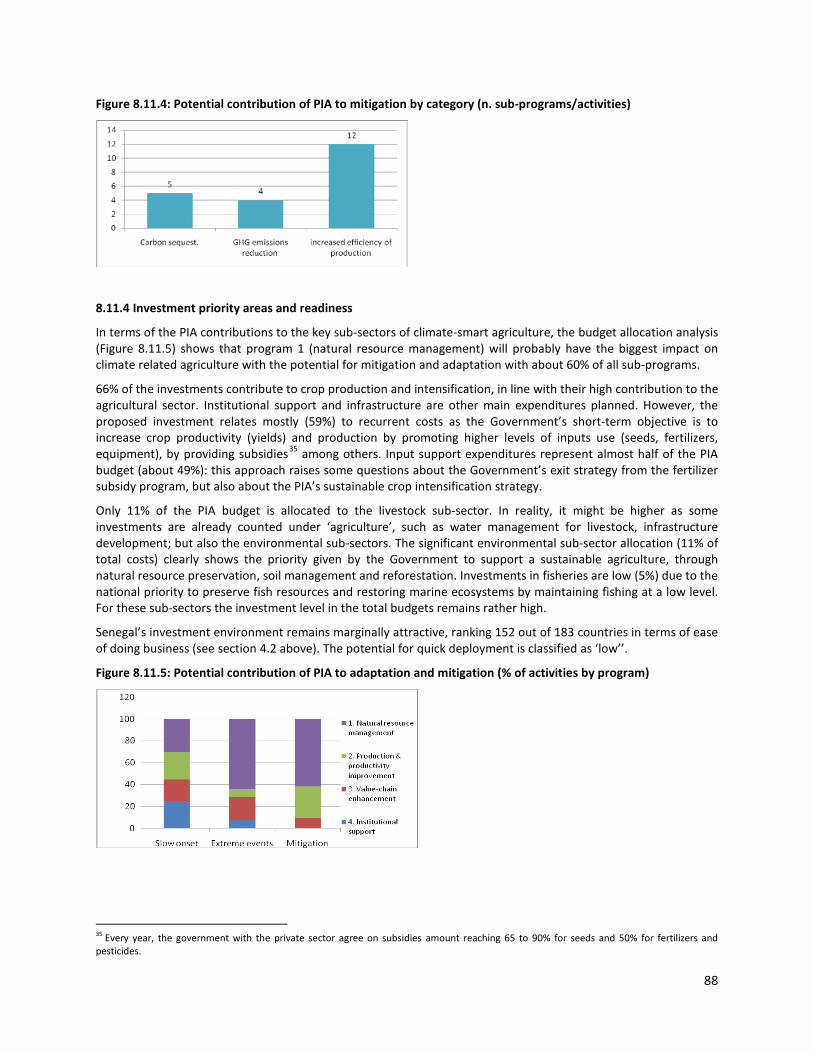
88
Figure 8.11.4: Potential contribution of PIA to mitigation by category (n. sub-programs/activities)
8.11.4 Investment priority areas and readiness
In terms of the PIA contributions to the key sub-sectors of climate-smart agriculture, the budget allocation analysis (Figure 8.11.5) shows that program 1 (natural resource management) will probably have the biggest impact on climate related agriculture with the potential for mitigation and adaptation with about 60% of all sub-programs.
66% of the investments contribute to crop production and intensification, in line with their high contribution to the agricultural sector. Institutional support and infrastructure are other main expenditures planned. However, the proposed investment relates mostly (59%) to recurrent costs as the Government’s short-term objective is to increase crop productivity (yields) and production by promoting higher levels of inputs use (seeds, fertilizers, equipment), by providing subsidies35 among others. Input support expenditures represent almost half of the PIA budget (about 49%): this approach raises some questions about the Government’s exit strategy from the fertilizer subsidy program, but also about the PIA’s sustainable crop intensification strategy.
Only 11% of the PIA budget is allocated to the livestock sub-sector. In reality, it might be higher as some investments are already counted under ‘agriculture’, such as water management for livestock, infrastructure development; but also the environmental sub-sectors. The significant environmental sub-sector allocation (11% of total costs) clearly shows the priority given by the Government to support a sustainable agriculture, through natural resource preservation, soil management and reforestation. Investments in fisheries are low (5%) due to the national priority to preserve fish resources and restoring marine ecosystems by maintaining fishing at a low level. For these sub-sectors the investment level in the total budgets remains rather high.
Senegal’s investment environment remains marginally attractive, ranking 152 out of 183 countries in terms of ease of doing business (see section 4.2 above). The potential for quick deployment is classified as ‘low’’.
Figure 8.11.5: Potential contribution of PIA to adaptation and mitigation (% of activities by program)
35 Every year, the government with the private sector agree on subsidies amount reaching 65 to 90% for seeds and 50% for fertilizers and pesticides.
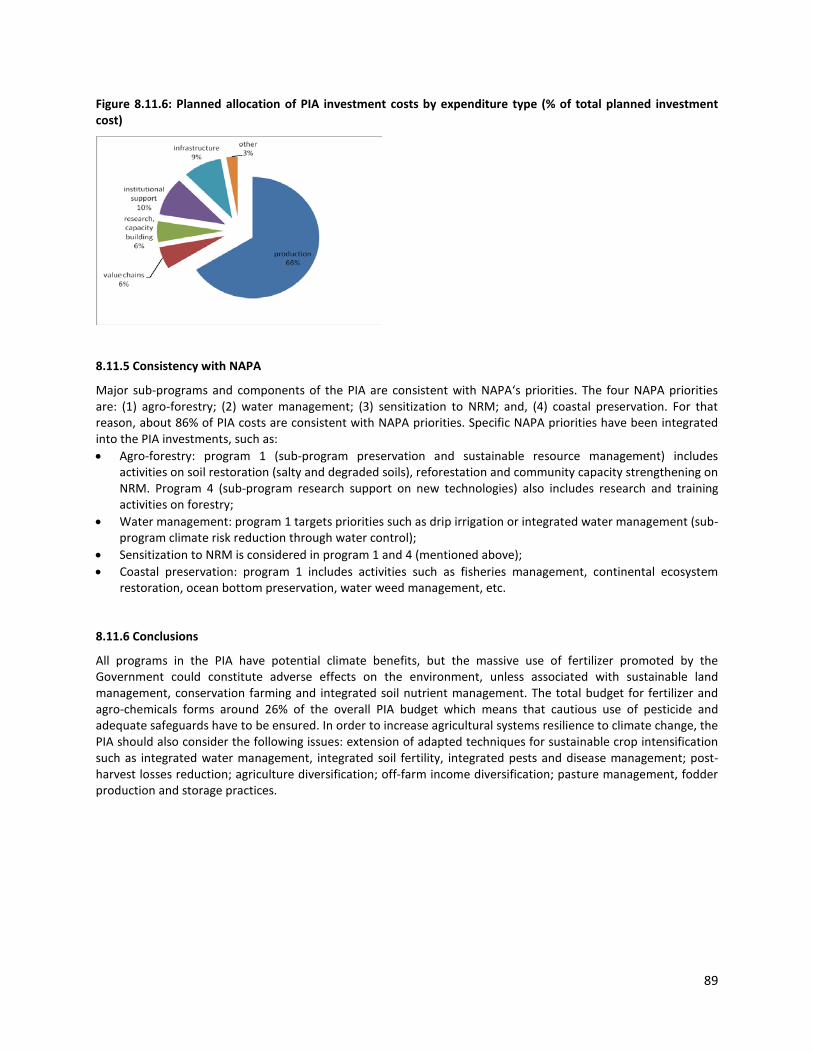
89
Figure 8.11.6: Planned allocation of PIA investment costs by expenditure type (% of total planned investment cost)
8.11.5 Consistency with NAPA
Major sub-programs and components of the PIA are consistent with NAPA‘s priorities. The four NAPA priorities are: (1) agro-forestry; (2) water management; (3) sensitization to NRM; and, (4) coastal preservation. For that reason, about 86% of PIA costs are consistent with NAPA priorities. Specific NAPA priorities have been integrated into the PIA investments, such as: • Agro-forestry: program 1 (sub-program preservation and sustainable resource management) includes
activities on soil restoration (salty and degraded soils), reforestation and community capacity strengthening on NRM. Program 4 (sub-program research support on new technologies) also includes research and training activities on forestry;
• Water management: program 1 targets priorities such as drip irrigation or integrated water management (sub-program climate risk reduction through water control);
• Sensitization to NRM is considered in program 1 and 4 (mentioned above); • Coastal preservation: program 1 includes activities such as fisheries management, continental ecosystem
restoration, ocean bottom preservation, water weed management, etc.
8.11.6 Conclusions
All programs in the PIA have potential climate benefits, but the massive use of fertilizer promoted by the Government could constitute adverse effects on the environment, unless associated with sustainable land management, conservation farming and integrated soil nutrient management. The total budget for fertilizer and agro-chemicals forms around 26% of the overall PIA budget which means that cautious use of pesticide and adequate safeguards have to be ensured. In order to increase agricultural systems resilience to climate change, the PIA should also consider the following issues: extension of adapted techniques for sustainable crop intensification such as integrated water management, integrated soil fertility, integrated pests and disease management; post-harvest losses reduction; agriculture diversification; off-farm income diversification; pasture management, fodder production and storage practices.

90
8.12 Sierra Leone Results from the CSA screening of the Sierra Leone Smallholder Commercialization Program Investment Plan (SCP, 2010-14)
8.12.1 Brief background
Since emerging from a decade-long civil war in 2001, Sierra Leone’s economy has grown rapidly. Agriculture contributes 45% of GDP, and employs around 70% of the population. About 79% of the rural population lives in poverty, and about 26% is food insecure. Agriculture includes traditional crop farming (rice, cassava, vegetables), tree crops plantations (cocoa, coffee, cashew), and the reclamation of swamps for farming. Rice is the main staple crop (the country produces 75% of the internal demand). Only 10% of cultivable land is cropped each year and crop yields are low. Less than 5% of farmers have access to chemical fertilizers, herbicides, insecticides or motorized farm equipment. Smallholder commercialization is hampered by low economic returns, and a lack of processing and marketing facilities (e.g. rice milling, feed mills). Post-harvest losses are estimated at 40%. Pilot interventions around the SCP have begun in 2009. Farmer Field Schools are emerging as a promising extension approach (SCP, 2010-14).
Sierra Leone is experiencing a variety of climatic hazards which include seasonal drought, strong winds, thunderstorms, landslides, heat waves, floods, intense seasonal rain fall, shifting rainfall patterns amongst others. In agriculture, potential impacts could occur on (i) land management, (ii) crops and livestock husbandry and (iii) socio-economic aspects of agricultural production. Specifically, changes in rainfall and temperature patterns have been causing current cropping patterns to become unsuitable to emerging climate conditions; livestock is already experiencing greater stress due to the above climatic variability and pest and disease outbreaks are becoming more pronounced. These changes have adversely affected the ability of the rural poor to maintain their existing livelihoods and have limited the ability of Sierra Leone to maintain export earnings and pay for the importation of food (see Sierra Leone NAPA document).
8.12.2 The plan
In 2009, Sierra Leone launched its National Sustainable Agriculture Development Program – a sector-wide approach – which originally had 4 components. Of these, the Smallholder Commercialization Program (SCP) has been promoted for early implementation. The SCP is based around 6 components:
1. promote commercialization of smallholder agriculture through increasing productivity, intensification, value addition, post-harvest infrastructure, and marketing with emphasis on commodity chain development and institutional strengthening to build self-reliance of farmer-based organizations (FBO).
2. develop appropriate small scale irrigation infrastructure in order to boost rice production, a main staple in the country, leading to increased food security, market surplus particularly for lowland smallholders, and the creation of wealth and employment notably for youth.
3. improve access to markets through the rehabilitation and effective maintenance of priority feeder roads, generating smallholder commercialization.
4. broaden smallholders access to rural financial services tailored to the specific needs of clients expected to be individuals and groups, in particular FBOs/ABCs.
5. promote national growth and development with equity by reducing households vulnerability to shocks and disaster and increasing food security and nutrition of vulnerable households through providing a package of social protection safety nets with focus on children, promoting human capital potential and employment, improving livelihoods and contributing to creation of productive assets.
6. ensure effective strategic and well-coordinated operational planning and implementation of SCP, with efficient coordination of resources and implementing partners, and adequate monitoring and evaluation of progress and impacts.
The budget estimates for the SCP total US$383.6 (with an additional 5% to cover price contingencies, bringing the total to US$402.6 million) over 2010-2014. The SCP document does not provide information enabling an estimate
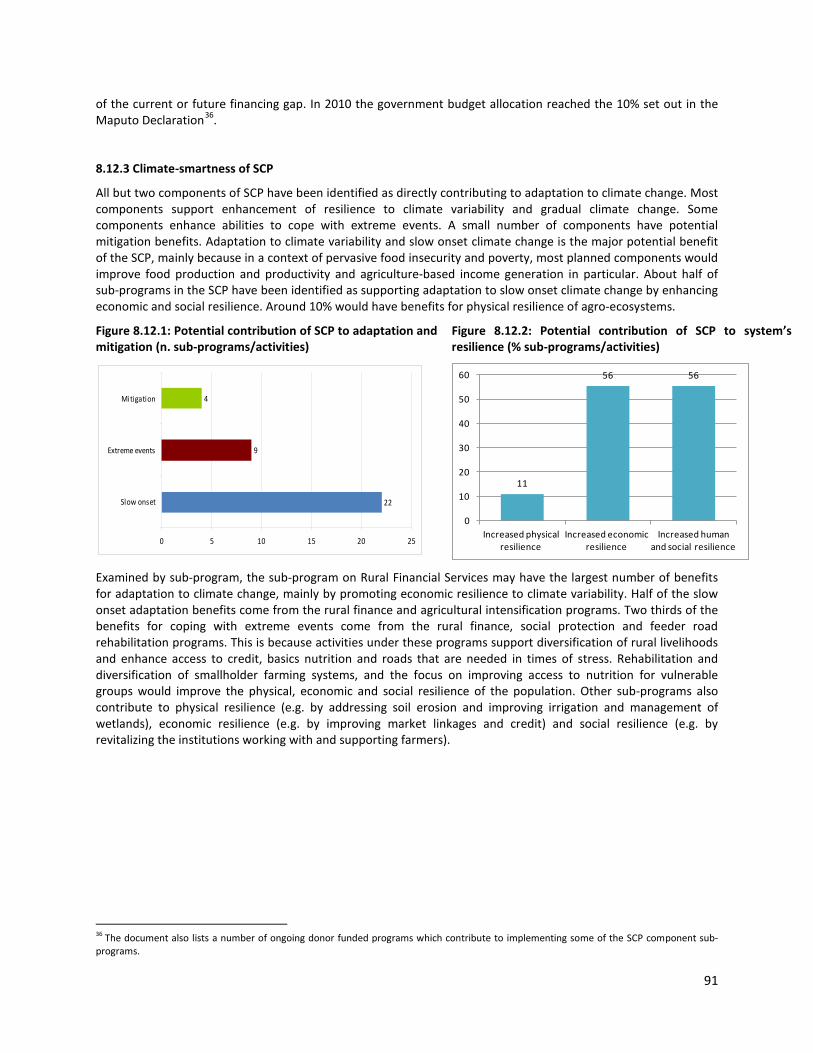
91
of the current or future financing gap. In 2010 the government budget allocation reached the 10% set out in the Maputo Declaration36.
8.12.3 Climate-smartness of SCP
All but two components of SCP have been identified as directly contributing to adaptation to climate change. Most components support enhancement of resilience to climate variability and gradual climate change. Some components enhance abilities to cope with extreme events. A small number of components have potential mitigation benefits. Adaptation to climate variability and slow onset climate change is the major potential benefit of the SCP, mainly because in a context of pervasive food insecurity and poverty, most planned components would improve food production and productivity and agriculture-based income generation in particular. About half of sub-programs in the SCP have been identified as supporting adaptation to slow onset climate change by enhancing economic and social resilience. Around 10% would have benefits for physical resilience of agro-ecosystems.
Figure 8.12.1: Potential contribution of SCP to adaptation and mitigation (n. sub-programs/activities)
22
9
4
0 5 10 15 20 25
Slow onset
Extreme events
Mitigation
Figure 8.12.2: Potential contribution of SCP to system’s resilience (% sub-programs/activities)
11
56 56
0
10
20
30
40
50
60
Increased physical resilience
Increased economic resilience
Increased human and social resilience
Examined by sub-program, the sub-program on Rural Financial Services may have the largest number of benefits for adaptation to climate change, mainly by promoting economic resilience to climate variability. Half of the slow onset adaptation benefits come from the rural finance and agricultural intensification programs. Two thirds of the benefits for coping with extreme events come from the rural finance, social protection and feeder road rehabilitation programs. This is because activities under these programs support diversification of rural livelihoods and enhance access to credit, basics nutrition and roads that are needed in times of stress. Rehabilitation and diversification of smallholder farming systems, and the focus on improving access to nutrition for vulnerable groups would improve the physical, economic and social resilience of the population. Other sub-programs also contribute to physical resilience (e.g. by addressing soil erosion and improving irrigation and management of wetlands), economic resilience (e.g. by improving market linkages and credit) and social resilience (e.g. by revitalizing the institutions working with and supporting farmers).
36 The document also lists a number of ongoing donor funded programs which contribute to implementing some of the SCP component sub-programs.

92
Figure 8.12.3: Potential contribution of SCP to adaptation and mitigation (% of activities by program)
Per cent of climate benefits due to each sub-program
0%
20%
40%
60%
80%
100%
Slow onset Extreme events Mitigation
1. Production intensification
2. Small scale irrigationdevelopment
3. Feeder Road Rehabilitation
4. Rural Financial Services
5.Social Protection
6. Planning/ coordination
Very few SCP activities have been identified as potentially having climate change mitigation benefits. Tree planting as part of a food-for-work program (Sub-program 5) is likely to sequester carbon. Agricultural practices promoted through FFS, farmer based organizations and the agricultural business centers (Sub-program 1), and small-scale irrigation (Sub-program 2) may potentially increase the total amount of GHGs emitted in agricultural production, but they may lead to lower GHG emissions per unit output due to productivity increases.
Figure 8.12.4: Potential contribution of NAIP to mitigation by category (n. sub-programs/activities)
1
0
3
00.5
11.5
22.5
33.5
Carbon sequest. GHG emissions reduction
increased efficiency of production
8.12.4 Investment priority areas and readiness
With major sub-components focused on addressing on-farm intensification and diversification, as well as irrigation, about 24% of the planned investment would contribute directly to improved agricultural production practices. Significant investments are planned targeting the physical infrastructure required for productive commercialized smallholder agriculture, including a large program to rehabilitate and maintain rural roads (ca. 25% of total planned investment). Provision of safety nets accounts for about 35% of the planned investment.
Figure 8.12.5: Planned allocation of NAIP investment costs by expenditure type (% of total planned investment cost)
24%
6%
2%
2%25%
35%
6%production
value chains
research, capacity building
institutional support
infrastructure
welfare / disaster mgt
other
Private sector interest in agriculture in Sierra Leone is beginning to rise, with potential interest in input trade, marketing and large-scale agri-business, especially in bio-fuels. These are is developing interest in establishing out grower schemes and interest has been manifested by private companies such as Gold Tree in oil palm and in sugar
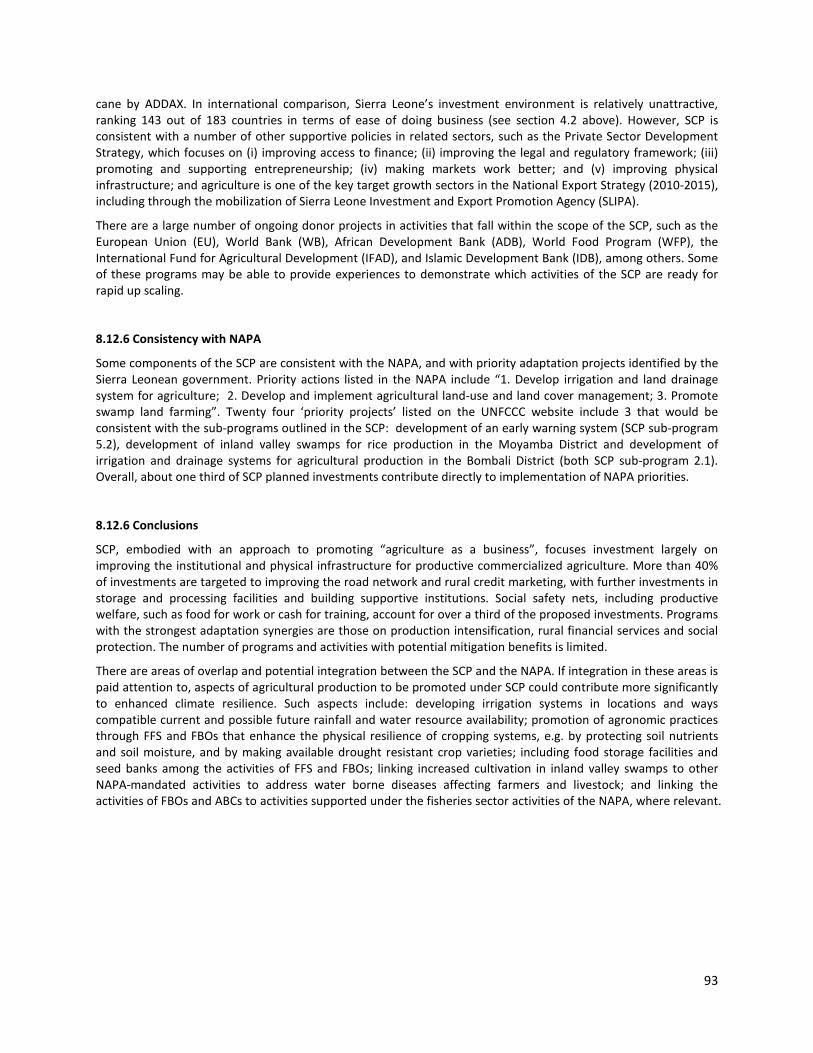
93
cane by ADDAX. In international comparison, Sierra Leone’s investment environment is relatively unattractive, ranking 143 out of 183 countries in terms of ease of doing business (see section 4.2 above). However, SCP is consistent with a number of other supportive policies in related sectors, such as the Private Sector Development Strategy, which focuses on (i) improving access to finance; (ii) improving the legal and regulatory framework; (iii) promoting and supporting entrepreneurship; (iv) making markets work better; and (v) improving physical infrastructure; and agriculture is one of the key target growth sectors in the National Export Strategy (2010-2015), including through the mobilization of Sierra Leone Investment and Export Promotion Agency (SLIPA).
There are a large number of ongoing donor projects in activities that fall within the scope of the SCP, such as the European Union (EU), World Bank (WB), African Development Bank (ADB), World Food Program (WFP), the International Fund for Agricultural Development (IFAD), and Islamic Development Bank (IDB), among others. Some of these programs may be able to provide experiences to demonstrate which activities of the SCP are ready for rapid up scaling.
8.12.6 Consistency with NAPA
Some components of the SCP are consistent with the NAPA, and with priority adaptation projects identified by the Sierra Leonean government. Priority actions listed in the NAPA include “1. Develop irrigation and land drainage system for agriculture; 2. Develop and implement agricultural land-use and land cover management; 3. Promote swamp land farming”. Twenty four ‘priority projects’ listed on the UNFCCC website include 3 that would be consistent with the sub-programs outlined in the SCP: development of an early warning system (SCP sub-program 5.2), development of inland valley swamps for rice production in the Moyamba District and development of irrigation and drainage systems for agricultural production in the Bombali District (both SCP sub-program 2.1). Overall, about one third of SCP planned investments contribute directly to implementation of NAPA priorities.
8.12.6 Conclusions
SCP, embodied with an approach to promoting “agriculture as a business”, focuses investment largely on improving the institutional and physical infrastructure for productive commercialized agriculture. More than 40% of investments are targeted to improving the road network and rural credit marketing, with further investments in storage and processing facilities and building supportive institutions. Social safety nets, including productive welfare, such as food for work or cash for training, account for over a third of the proposed investments. Programs with the strongest adaptation synergies are those on production intensification, rural financial services and social protection. The number of programs and activities with potential mitigation benefits is limited.
There are areas of overlap and potential integration between the SCP and the NAPA. If integration in these areas is paid attention to, aspects of agricultural production to be promoted under SCP could contribute more significantly to enhanced climate resilience. Such aspects include: developing irrigation systems in locations and ways compatible current and possible future rainfall and water resource availability; promotion of agronomic practices through FFS and FBOs that enhance the physical resilience of cropping systems, e.g. by protecting soil nutrients and soil moisture, and by making available drought resistant crop varieties; including food storage facilities and seed banks among the activities of FFS and FBOs; linking increased cultivation in inland valley swamps to other NAPA-mandated activities to address water borne diseases affecting farmers and livestock; and linking the activities of FBOs and ABCs to activities supported under the fisheries sector activities of the NAPA, where relevant.

94
8.13 Togo Results from the CSA Screening of the Togo National Plan for Investment in the Agricultural Sector (PNIASA, 2010-15)
8.13.1 Brief Background
The Togolese agricultural sector comprises mainly staple and cash crops, fisheries and livestock: maize, rice and cassava are the main staple crops and cotton is the dominant export crop. Although maize production exceeds local food demand, food insecurity still prevails in Togo mainly because of low purchasing ability. Togo is a net importer of rice (70% of rice consumed in 2009). Approximately, 50% of the population is either food insecure or highly vulnerable to food insecurity while the incidence of poverty at national level in 2008 was estimated at 61.7%. Overall, 60% of the population relies on agriculture.
Main constraints in agriculture are: (i) deforestation due to high demographic pressure on natural resources causing the reduction of the fallow period of the slash and burn system; (ii) soil fertility depletion due to erosion and reduction in soil organic matter levels; (iii) climate change resulting in one rainy season in the Southern part of the country instead of two (Maritime region and Plateaus region), and changes in the rainfall patterns (shorter rainy season) particularly in the Northern regions; (iv) limited capacity of the research and extension system; (v) no regulation of exports and pricing of staple products except through occasional purchases by a government agency (ANSAT37) in charge of food security stocks and staple product supply when there is a food crisis and (vi) lack of infrastructure hampering food supply in remote areas.
8.13.2 The Plan
The overall objectives of the PNIASA are: (i) to improve food security and, (ii) increase economic growth in Togo. The specific objectives of the PNIASA are (a) to meet the local demand of staple products, livestock and fishery products; (b) to develop and disseminate improved technologies for the intensification of agricultural productions systems, and (c) to ensure a better sector management and service provision to beneficiaries. This will be achieved through targeted investments that create a conducive environment for increased production through agricultural technological innovations, investing in infrastructure required for agriculture intensification and providing support to institutions involved in agricultural development. The PNIASA is structured in five strategic sub-programs:
1. Plant production; 2. Animal production; 3. Fisheries and aquaculture; 4. Research and extension; and 5. Institutional support and sector coordination.
The budget estimate for the PNIASA is about 1,230 Million dollars over the 2010-2015 period. Togo invests currently about 6.5 % of government budget in agriculture and most of it is used to cover recurrent expenditures of the Ministry. The gap between current allocation and the CAADP commitment to allocate 10% of the budget to agriculture would be on average about US$ 14.3 million dollars per year. Figure 8.13.1 shows the actual government and donors financing of the PNIASA as well as the gap (data from PNIASA, 2009).
37 Agence Nationale de Sécurité Alimentaire du Togo

95
Figure 8.13.1: Total investment cost, finance allocated (including 10% commitment) and finance gap in million US$
8.13.3 Climate Smartness of the PNIASA
The PNIASA contributes to climate adaptation and mitigation but mainly in adaptation. This is because of the overall and specific objectives of the PNIASA focusing on productivity and production enhancement activities that intend to address food insecurity issues but also deal with marketing, processing and post-harvest issues. A number of components have potential for mitigation benefits and extreme events such as natural resource management, management of fragile ecosystems and river verges, management of water plants, watershed management, drying areas for paddy and others).
Figure 8.13.2: Potential contribution of PNIASA to adaptation and mitigation (n. sub-programs/activities)
Sub-Program 1 includes a natural resource management and infrastructure development component, as well as the promotion of staple and exports crops: this sub-program contributes the most to climate adaptation, as related specific activities deliver the largest number of climate benefits. Increased economic resilience to climate change exceeds the physical, human and social resilience: this is because a large part of the PNIASA budget is allocated to components, actions and activities aiming at increasing crop production and productivity38 with long term and gradual effects. Nevertheless, activities such as sustainable management of fragile ecosystems, irrigation development and promotion of community forests will contribute to physical resilience. Furthermore, activities such as the improvement of legislation on land management, the development of participatory schemes on land management and facilitation of access to land for vulnerable groups will deliver human and social resilience (see figure 8.13.3).
As concerns mitigation, the main potential impact is found with increased production efficiency. Four components, actions and activities such as development of community forests, restoration of fragile ecosystems, promotion of fruit tree crops, improvement of rangelands have also a substantial potential for carbon sequestration. At the same time, only one activity has the potential to contribute to the reduction of the GHG emission (Measures against land degradation) (see figure 8.13.4).
38 Sub Programme 1: Production des filières végétales.
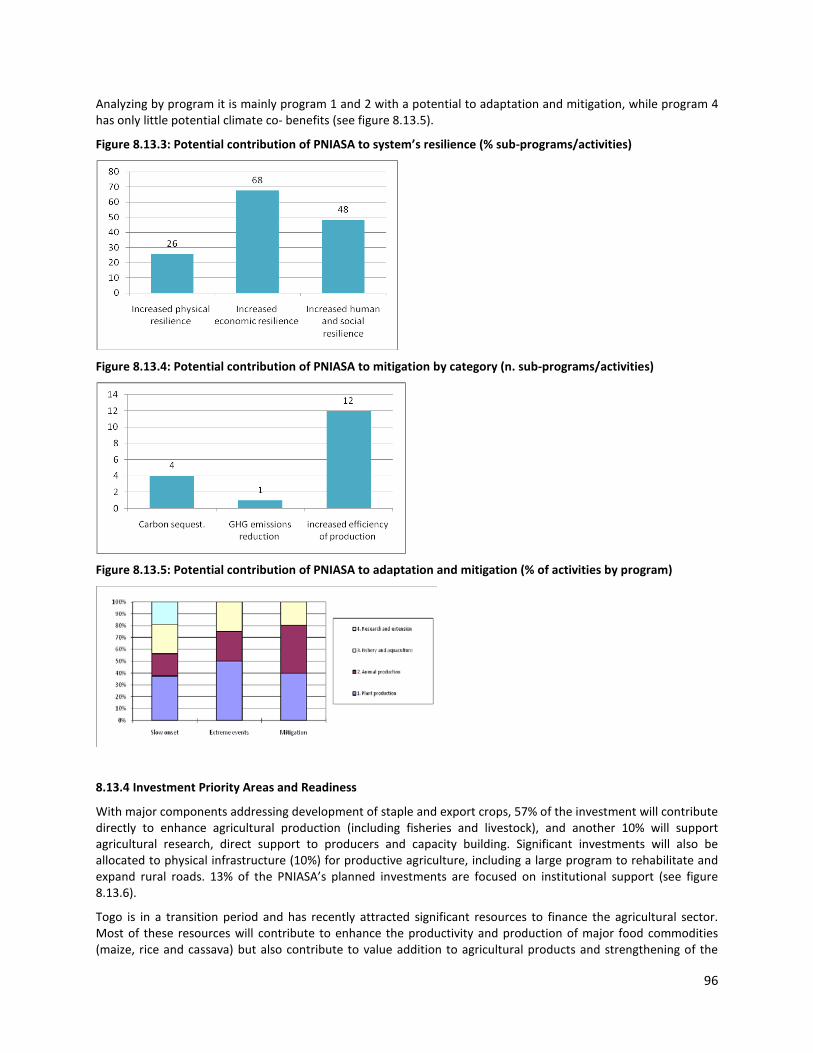
96
Analyzing by program it is mainly program 1 and 2 with a potential to adaptation and mitigation, while program 4 has only little potential climate co- benefits (see figure 8.13.5).
Figure 8.13.3: Potential contribution of PNIASA to system’s resilience (% sub-programs/activities)
Figure 8.13.4: Potential contribution of PNIASA to mitigation by category (n. sub-programs/activities)
Figure 8.13.5: Potential contribution of PNIASA to adaptation and mitigation (% of activities by program)
8.13.4 Investment Priority Areas and Readiness
With major components addressing development of staple and export crops, 57% of the investment will contribute directly to enhance agricultural production (including fisheries and livestock), and another 10% will support agricultural research, direct support to producers and capacity building. Significant investments will also be allocated to physical infrastructure (10%) for productive agriculture, including a large program to rehabilitate and expand rural roads. 13% of the PNIASA’s planned investments are focused on institutional support (see figure 8.13.6).
Togo is in a transition period and has recently attracted significant resources to finance the agricultural sector. Most of these resources will contribute to enhance the productivity and production of major food commodities (maize, rice and cassava) but also contribute to value addition to agricultural products and strengthening of the
97
institutions in the agricultural sector. For Togo, the medium term objective is the adoption and implementation of a sector wide approach in the agricultural sector. Togo’s investment environment, as measured by the doing business indicators remains unattractive ranking 160 out of 183 countries (see section 4.2 above).
However, the PNIASA is consistent with and implements a number of supportive policies in the agriculture sector, such as the existing ‘Agricultural policy note’ and the ‘Poverty Reduction Strategy’, suggesting overall strategic coherence. The PNIASA is also explicit about the major risks: (i) the lack of coordination between technical agencies and donors; (ii) poor governance and corruption; (iii) the lack of structured commodity chains; and (iv) climate uncertainties. The major challenge will be to set up effective institutions able to ensure improved coordination, fiduciary management and monitoring and evaluation. Addressing these issues is expected to lead towards promising results and to create appropriate conditions for a successful sector-wide approach.
Figure 8.13.6: Planned allocation of PNIASA investment costs by expenditure type (% of total planned investment cost)
57%
8%
9%
13%
10%
3%
production
value chains
research, capacity building
institutional support
infrastructure
welfare / disaster mgt
8.13.5 Consistency with NAPA
Major sub programs and components of the PNIASA are consistent with NAPA‘s priorities, particularly agriculture (including livestock and fisheries) and water resource management as shown in table 2. Agriculture, water management, forestry and coastal areas are listed as priority sectors in the NAPA and specific investments for each of these sub-sectors have been integrated into the PNIASA. The top priority projects submitted to UNFCC in relation to the NAPA are: (i) ‘small scale irrigation in lowlands in the Savannah and Kara regions for developing vegetable cropping’ and (ii) ‘support to development of short cycle cereal cultivars resistant to drought. These priority areas are supported by several PNIASA’s components , particularly, infrastructure development in the Sub-Program 1 (activities : promotion of small scale irrigation, water management) and the development of improved technologies in Sub-Program 4 (activities: development of new species and breeding material and capacity building for developing cultivars adapted to climate change).
8.13.6 Conclusions
The PNIASA is consistent with the National Poverty Reduction Strategy: it has a balanced focus of investment in support of improved agricultural production, improving the institutional framework and physical infrastructure for higher productivity in the agricultural sector. One third (30%) of the total investments for rural infrastructure target improved road networks , marketing, storage and processing facilities, while 14% of total investments are directed to building supportive sector institutions. Over 60% of total investments focus on enhancing production, capacity building and other services to producers. While some sub- programs have been identified as generating climate benefits, Sub-Program 1 (which is the largest) has been identified as having the most climate benefits mainly through positive impact on adaptation and mitigation. Sub-Program 1 therefore has potential in terms of up-scaling climate smart activities through this program, especially in relation to sustainable water and soil management.

98
The use of agro-chemicals (fertilizers and pesticides) remains limited in Togo and GHG emissions mostly result from charcoal production for fuel and from the slash and burn farming system. Carbon sequestration in soils and vegetal cover is restricted by erosion and vegetation degradation. GHG emission due to livestock is limited in Togo because of the low carrying capacity in the Northern part of Togo (Savanna region and Kara) and the presence of local breeds of small ruminants in the Maritime, Plateaus and Central region.
Although many components and activities carry climate benefit potentials, others can have adverse effects on the climate such as the increased use of fertilizers. However, even after the implementation of NAIP/PNIASA, the use of fertilizers and pesticides in Togo will remain at modest levels as compared to developed country standards. Livestock gas emission will not increase substantially because of enhanced use of cross-breeds for increased productivity. As suggested in the NAPA, aspects of agricultural production to be promoted under the PNIASA that could contribute to enhanced climate resilience include: diffusion of adapted technical packages for sustainable water and soil management; irrigation, improved soil and water management techniques, improved cropping systems (including intercropping), adoption of integrated soil fertility management (organic matter and chemical fertilizers); integrated weed management; and promotion of agroforestry and community forests.

99
8.14 Uganda Results from the CSA screening of the Ugandan Agricultural Sector Development Strategy (DSIP, 2010–14)
8.14.1 Brief background
After decades of instability Uganda has gained economic and politic stability in the last two decades going hand in hand with an economic growth around 6% in the last ten years despite global and regional downturn. Uganda’s growth over the years has remained well above Sub-Saharan Africa average. However, due to rapid population growth, real GDP growth per capita averaged only 3.4% in the 1990s and around 4% in the 2000s.
The agricultural sector has performed modestly, growing at 2.6% and 1.3% in 2008/09 and 2007/08, respectively. These rates of growth are below the population growth rate of about 3.4% per annum. The government has pursued previous policies and strategies under the Plan for Modernization of Agriculture (PMA) – a multi-sectoral framework aimed at transforming subsistence farming to commercial agriculture.
Agriculture is arguably the most important sector of the Ugandan economy. It contributes up to nearly 20% of GDP, accounts for 48% of exports (UBOS, 2008) and provides a large proportion of the raw materials for industry. Agricultural exports have also increased in scope and scale: e.g. food processing alone accounts for 40% of total manufacturing. With 73% of all households and the majority of the poor in Uganda depending directly on agriculture for their primary livelihood, this is a serious challenge in the drive to eradicate poverty declining, from 38% in 2002 to 31% in 2005. Agriculture will be the key determinant in the country’s efforts to reduce poverty in the immediate years ahead. Real growth in agricultural output has declined steadily, from 7.9% in 2000/01 to 0.7% in 2007/08 (although it did show signs of recovery in 2008/09, with a 2.6% growth rate).
At least 3% of the land area of the country is covered with open water and most of the country receives an average of 1,000 mm of rain annually. Land degradation is most pronounced in the dry lands of the cattle corridor where sustainable land management is threatened by overgrazing by local and mobile pastoralist herds, deforestation by excessive use of fuel wood resources and poor and inappropriate agriculture on marginal land. These threats are further exacerbated by low and unreliable rainfall, frequent drought and precarious water supply, seasonal fires and endemic poverty. Drought is observed with a higher frequency with severe impacts on production. Increasing frequency of drought has been documented from 1900-2000 showing significant drought episodes increasing from every 20 years to 16 years and now to 5 years. The dramatic reduction in the snow cover in the Rwenzori range is another clear indicator of climate change. Uganda does not have preparedness plans for adapting to these climatic changes and therefore remains exposed and vulnerable. MAAIF has begun the process of planning for climate change and is supposed to accelerate under DSIP.
8.14.2 The plan
DSIP has been designed to address these constraints in four investment programs:
1. increasing agricultural production and productivity; 2. increasing access to markets and value addition; 3. creating an enabling environment for the private sector in agriculture; 4. and strengthening agricultural institutions at the centre and in local governments.
The government is committed to increasing funding to agriculture over the next five years, guided by the priorities in the DSIP, and also in line with the CAADP principle of increasing spending to the sector. Uganda has committed to increase the share of the national budget allocated to the agricultural sector to reach an eventual target of 10%. Major donors are mentioned as: World Bank, ADB, EU, DANIDA, JICA, USAID, GTZ, FAO, UNDP, Irish Aid, and China. Donors have indicated a continuing commitment to the agriculture sector, the consensus being that support to DSIP would be the basis of a Sector-Wide Approach (SWAp) and Sector Budget Support (SBS). The main purpose of this SWAp would be to harmonize development assistance to the agriculture sector in Uganda and to cover areas where there might be financing gaps. According to the plan the total investment is 1,051 million US$ for the five
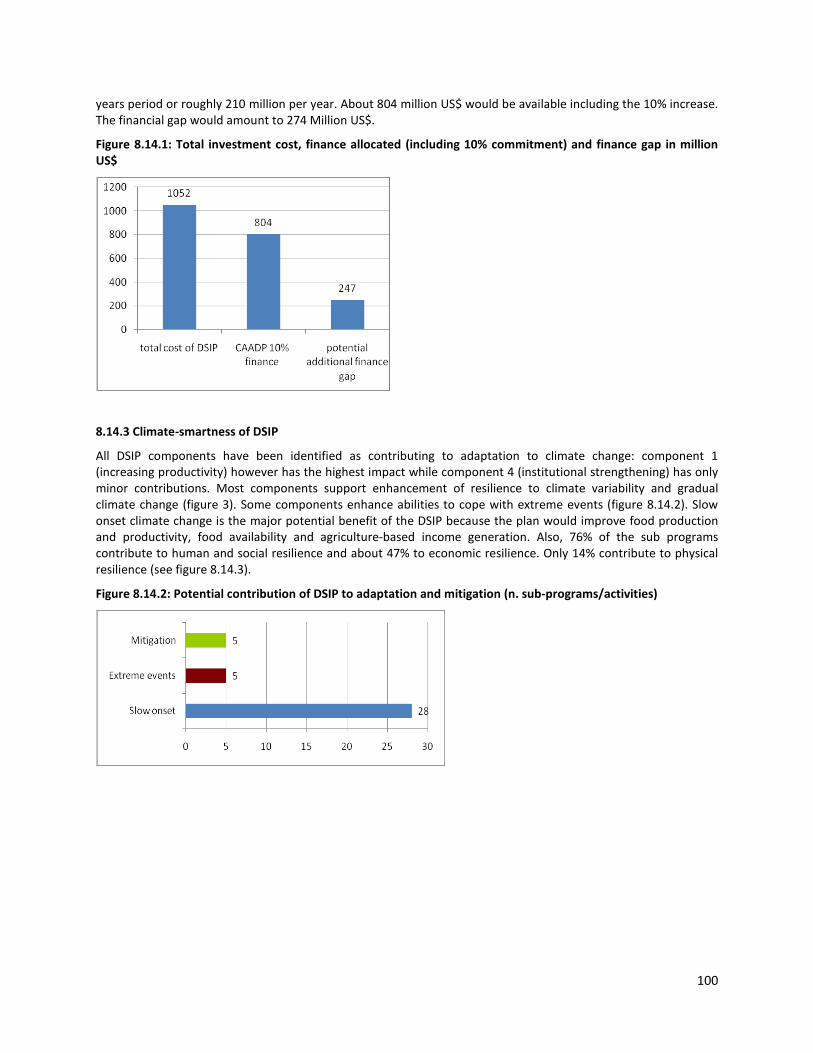
100
years period or roughly 210 million per year. About 804 million US$ would be available including the 10% increase. The financial gap would amount to 274 Million US$.
Figure 8.14.1: Total investment cost, finance allocated (including 10% commitment) and finance gap in million US$
8.14.3 Climate-smartness of DSIP
All DSIP components have been identified as contributing to adaptation to climate change: component 1 (increasing productivity) however has the highest impact while component 4 (institutional strengthening) has only minor contributions. Most components support enhancement of resilience to climate variability and gradual climate change (figure 3). Some components enhance abilities to cope with extreme events (figure 8.14.2). Slow onset climate change is the major potential benefit of the DSIP because the plan would improve food production and productivity, food availability and agriculture-based income generation. Also, 76% of the sub programs contribute to human and social resilience and about 47% to economic resilience. Only 14% contribute to physical resilience (see figure 8.14.3).
Figure 8.14.2: Potential contribution of DSIP to adaptation and mitigation (n. sub-programs/activities)

101
Figure 8.14.3: Potential contribution of DSIP to system’s resilience (% sub-programs/activities)
Examined by sub-program, the sub-program one (food production and productivity) would deliver the largest number of identified climate benefits. This sub program would improve the physical, economic and social resilience of the population by addressing sustainable land management practices, water for agriculture production and irrigation schemes. Other sub-programs have also an adaptation and economic resilience by improving the value chain and institutional set up with its supporting environment (see figure 8.14.4). Only the first component has mitigation potential: this is mainly due to increased productivity and therefore less emission of GHG per unit produced. (increased production efficiency – see figure 8.14.5). Tree planting, as one of potential mitigation actions has not been reflected in the DSIP.
Figure 8.14.4: Potential contribution of DSIP to adaptation and mitigation (% of activities by program)
Figure 8.14.5: Potential contribution of DSIP to mitigation by category (n. sub-programs/activities)
8.14.4 Investment priority areas and readiness
Major sub component in the DSIP is in the area of research and capacity building. In this investment category activities like generation of new technologies, research, improved extension service and information uptake, agro business development, strengthened farmer organizations and training are reflected. Improved production and productivity have a share of about 18% including activities for access to inputs, SLM, soil and water management and irrigation are reflected. Another 12% are planned in the institutional strengthening including quality assurance and regulatory framework, inspection service and enforcement of standards. Around 11% are foreseen for improved value chains and food processing production chain, reduced post harvest losses, capacities for business development services, market information and dissemination (see figure 8.14.6). This sub program has a strong

102
private sector component including PPP activities. In the livestock investment only tsetse control and quarantine regime are mentioned under pest and disease management.
Figure 8.14.6: Planned allocation of DSIP investment costs by expenditure type (% of total investment costs)
18%
11%
43%
13%
1%1%
13%
production
value chains
research, capacity buildinginstitutional supportinfrastructure
welfare / disaster mgtother
Private sector investment is encouraged In the DSIP and reflected mainly in the mechanization and value chain component. The Agriculture Sector Program Support (ASPS) was in place for ten years until June 2009 and government has pursued previous policies and strategies under the Plan for Modernization of Agriculture (PMA) – a multi-sectoral framework aimed at transforming subsistence farming to commercial agriculture. In international comparison, Uganda’s investment environment is fairly well, ranking 61 out of 183 countries in terms of ease of doing business (see section 4.2 above). Strengthening the MAAIF headquarter, infrastructure, staff and district structure has been addressed in the plan. Constraints in the enabling environment (policies, education, coordination, statistics, regulatory services and others) have been acknowledged and form part of the overall strategy to improve the sector.
8.14.5 Consistency with NAPA
In the DSIP there is little consistency with the NAPA. While in the NAPA priorities are given to: 1) tree planting, 2) land degradation management and 3) meteorological services, in the DSIP the first aspect has not been mentioned. Land degradation management has only been reflected in some SLM practices (3.8%) and water and irrigation schemes (8.4%). Climate change capacity is one component in the DSIP, but with little priority in terms of budget (0.8%).
8.14.6 Conclusions
The DSIP is addressing major concerns and constraints in the agriculture sector which are relevant under climate smart agriculture point of view. Investments in the sustainable land management, soil and water conservation, irrigation and institutional aspects show the potential for a climate readiness of the overall plan. Other issues are mentioned in the document, but not reflected in the investment part. One of them is related to improved livestock and range management. According to the plan the cattle corridor suffers from droughts and insufficient water for livestock which causes major problems for the pastoralists. This aspect however is hardly reflected in the DSIP. Under the fishery chapter aspects of over-fishing and declining catches are expressed as concerns in the document. In terms of funding few activities are planned to face the challenges.
As suggested in the NAPA and in the DSIP document aspects of agricultural production to be promoted under DSIP that could contribute to enhanced climate resilience include: tree planting and promotion of agro forestry activities; improved rangeland and livestock management; on farm fish breeding and production with fish ponds and fingerlings; zero tillage and green manure practices; crop and production Insurance schemes; micro credit facilities for investments; REDD+ strategy linked to the agriculture policy. Forestation and reforestation aspects could form part of activities related to mitigation, which at the same time could contribute to help diversify and improve farmer’s income in the long run.

![[PPT]HACCP presentation - Alberta Agriculture and ForestryFILE/haccp_presentation_pp.ppt · Web viewDeveloped by Introduction to HACCP * A recall is the process of identifying, locating](https://static.fdocuments.us/doc/165x107/5ad2eaf57f8b9a0f198cf482/ppthaccp-presentation-alberta-agriculture-and-filehaccppresentationpppptweb.jpg)