Identifying National Level Education Reforms in Developing ...ftp.iza.org/dp9916.pdfIdentifying...
37
Forschungsinstitut zur Zukunft der Arbeit Institute for the Study of Labor DISCUSSION PAPER SERIES Identifying National Level Education Reforms in Developing Settings: An Application to Ethiopia IZA DP No. 9916 April 2016 Luke E. Chicoine
Transcript of Identifying National Level Education Reforms in Developing ...ftp.iza.org/dp9916.pdfIdentifying...
Forschungsinstitut zur Zukunft der ArbeitInstitute for the Study of Labor
DI
SC
US
SI
ON
P
AP
ER
S
ER
IE
S
Identifying National Level Education Reforms inDeveloping Settings: An Application to Ethiopia
IZA DP No. 9916
April 2016
Luke E. Chicoine

Identifying National Level Education
Reforms in Developing Settings: An Application to Ethiopia
Luke E. Chicoine DePaul University
and IZA
Discussion Paper No. 9916 April 2016
IZA
P.O. Box 7240 53072 Bonn
Germany
Phone: +49-228-3894-0 Fax: +49-228-3894-180
E-mail: [email protected]
Any opinions expressed here are those of the author(s) and not those of IZA. Research published in this series may include views on policy, but the institute itself takes no institutional policy positions. The IZA research network is committed to the IZA Guiding Principles of Research Integrity. The Institute for the Study of Labor (IZA) in Bonn is a local and virtual international research center and a place of communication between science, politics and business. IZA is an independent nonprofit organization supported by Deutsche Post Foundation. The center is associated with the University of Bonn and offers a stimulating research environment through its international network, workshops and conferences, data service, project support, research visits and doctoral program. IZA engages in (i) original and internationally competitive research in all fields of labor economics, (ii) development of policy concepts, and (iii) dissemination of research results and concepts to the interested public. IZA Discussion Papers often represent preliminary work and are circulated to encourage discussion. Citation of such a paper should account for its provisional character. A revised version may be available directly from the author.

IZA Discussion Paper No. 9916 April 2016
ABSTRACT
Identifying National Level Education Reforms in Developing Settings: An Application to Ethiopia
Increasing enrollment in primary education has been at the center of international education policy for well over a decade. In developing parts of the world, significant increases in primary enrollment are often generated by large national level programs, which can simultaneously promote overcrowding and reductions in education quality. However, to analyze the trade-off between increased enrollment and potential reductions in quality one must first identify and evaluate the impact of the national reform on schooling. This paper provides a method with which these types of reforms can be identified in developing settings using both temporal and geographic variation, and readily available data. The method is applied to an early 1990s reform in Ethiopia based around the release of the Education and Training Policy, which removed schooling fees from grades one to ten. The model estimates that the reform led to an increase in schooling of at least 1.2 years, and provides initial evidence that the increased enrollment in Ethiopia outweighed any cost due to reductions in quality. JEL Classification: I25, I28, O55 Keywords: free primary education, Ethiopia, schooling Corresponding author: Luke Chicoine Department of Economics DePaul University 1 East Jackson Blvd, Suite 6200 Chicago, IL 60604 USA E-mail: [email protected]

1 Introduction
According to the World Bank’s World Development Indicators, 40 percent of primary age children in Sub-
Saharan Africa were out of school in the year 2000; a ten percentage point improvement relative to 1990. This
was not a problem that went unnoticed. In the 1990’s there were three major national initiatives to provide
free primary education (FPE) in Ethiopia, Malawi, and Uganda (Deininger, 2003). The second Millennium
Development Goal of universal primary education reinforced these efforts, and at least 15 countries additional
implemented their own FPE reforms since the turn of the millennium. Data from the OECD’s International
Development Statistics database show that donor countries and organizations joined the effort and official
development assistance for basic education doubled in the decade leading up to 2010. The goal of these
efforts was to get students into the classroom, and in the year following the reforms, grade one enrollment
increased an average of 25 percent over the previous year (UNESCO Institute for Statistics). Continuous
effort and focus is required to maintain a consistent quality of education in the face of such large increases
in enrollment. On average, the year after the reform came into effect, pupil-teacher ratios increased 10
percent, and possibly more troublesome, by 2014 the initial surge in donor support had already declined
30 percent from peak levels. It is possible that any benefit of these programs generated by the increases in
enrollment could be entirely overwhelmed by the potential decline in quality generated by overcrowding and
under investment. However, before this question can be answered, it is necessary to be able to identify the
effect of a national level reform in a developing setting. This paper develops a technique to identify the effect
of a national education reform on schooling attainment using data that are contained in most household
datasets. This technique is then demonstrated using an education reform in Ethiopia from the early 1990s,
and applied to three separate sources of data.
Building on the framework of Lucas and Mbiti (2012a,b), this paper focuses on the construction of a
method that can quantify the potential magnitude of national level reforms at any level of education using
both the geographic and temporal variation. This method is then applied to the removal of school fees
in Ethiopia. The effect of the reform on years of schooling is estimated using three different post-reform
data sources: the 2007 round of the census, 2005 and 2011 rounds of the Demographic and Health Survey
(DHS), and the 2014 Living Standards and Measurement Study (LSMS). It is shown that the reform led
to an increase of between 1.2 and 1.7 years of schooling, and that the effect was about three-tenths of a
year larger for women. The reform also led to an increase in literacy of over ten percentage points, a 30
percent increase relative to baseline levels, and a higher rate of completion of the post-eighth grade exam.
This is suggestive evidence that the increased level of schooling did lead to increased learning, outweighing
any potential quality declines. Placebo reform measures are also constructed using data from four countries
2

(Kenya, Tanzania, Zambia, and Mali) that did not have an education reform in the 1990s. Placebo estimates
for all four countries yield no evidence of large increases in schooling during the same time period; these
results help to rule out that the estimates from Ethiopia are capturing any type of secular trend in education.
In developed settings, identification strategies are generally more straightforward, and can exploit the
exact letter of the law to identify the effect of education, such as cutoffs in age-at-school-entry dates (McCrary
and Royer, 2011), or internal variation in such policies (Elder and Lubotsky, 2009). However, due to issues
such as late school entry and high repetition rates, it is more difficult to find and exploit such explicit variation
in developing settings, although Agüero and Bharadwaj (2014) and Grépin and Bharadwaj (2015) showed
that it is possible. The more common approach has been to exploit two separate dimensions of variation, the
timing of the reform and geographic variation in the implementation. For example, Duflo (2001; 2004) used
variation in the construction of primary schools to examine the relationship between education and wages
in Indonesia, and Osili and Long (2008) exploited similar variation in Nigeria to examine how education
impacts fertility. The general policy change in an FPE reform is to remove compulsory school fees in all
primary schools across the country (the extent of fee removal varies reform to reform); therefore, there is
no geographic variation in the implementation of the reform itself. Previous work examining the impact
of malaria eradication exploited pre-intervention levels of the disease to generate variation in the expected
impact of the anti-malaria programs (Bleakley, 2010; Lucas, 2010, 2013). The benefit to this type of strategy
is that it does not depend on variation in the implementation, but the geographic component of the variation
is determined solely on the pre-intervention characteristics of each geographic district. Lucas and Mbiti
(2012a,b) applied a similar strategy using variations in pre-reform primary completion rates to generate
geographic variation. They examined the effect of the 2003 FPE reform in Kenya on gender differences in
schooling and sorting into private schools.
This paper evaluates a central component to education reform in Ethiopia, the removal of school fees in
grades one through ten. Data from the 1994 Ethiopian census are used to estimate the level of expected
impact of the reform separately for each of the 60 zones (i.e. counties) across Ethiopia. The estimated effect
of the reform in each specific zone is assumed to be inversely related to the education level of pre-reform birth
cohorts. The removal of school fees is expected to have a greater impact on areas that have relatively lower
initial levels of education. These zone-specific measures are then interacted with the timing of the reform
and zone-specific data on school starting age to calculate the maximum intensity with which the reform
could have affected an individual born in a specific year in a specific zone. This provides both geographic
and temporal variation that is used to identify the effect of the reform. It is important to note that the
method that is described in this paper requires only pre-reform information regarding the fraction of the
population completing each year of schooling and starting at each age at some subnational level. This can
3

then be matched with the birth year (or age) and the location of respondents from a post-reform survey, and
the full effect of the national education reform estimated. In Ethiopia, the reform is found to have led to
a significant increase in schooling. The estimates are not sensitive to changes in the sample, or alternative
assumptions in the calculation of the intensity measure. Although precise zone of birth is not available,
three alternative strategies using region (i.e. state or province) of birth information in the LSMS find similar
estimates to the baseline model. Furthermore, 86 percent of respondents in the LSMS sample live in their
region of birth. Importantly, this method only finds an increase in schooling in Ethiopia, and does not
capture secular increases in education in four alternative countries from Sub-Saharan Africa.
The relevant history of Ethiopia and the education reform is outlined in Section 2. The estimation of
the potential magnitude of the reform’s impact, and the combination of this measure with the timing of
the reform’s implementation is described in Section 3. The data is summarized in Section 4, along with the
paper’s estimating model. The estimated effect of the reform on years of schooling in Ethiopia is explored
in Section 5. The paper is concluded in Section 6.
2 Background and Education Reform
Beginning in 1974 Ethiopia was governed by a military council, a period that was briefly followed by four
years of a single party communist rule, which ended in 1991 (Ofcansky and Berry, 1993). Under these
governments, students entered school at age seven, a starting age that remains unchanged today, primary
school lasted six years, junior secondary school two years, and senior secondary four years (World Bank,
2009). Grade 1 enrollment declined roughly 25 percent between 1979 (first year of available data) and the
fall of the communist government, and the fraction of the national budget spent on education fell nearly 50
percent (Oumer, 2009). During this time period, there was no set tuition fee charged for school attendance;
however, public primary and secondary schools often imposed per-student fees to cover the cost of attendance.
Fees were significantly lower in government run schools, and these schools educated more than 90 percent of
primary school students (World Bank, 2009).1
In 1991, the Ethiopian Peoples Revolutionary Democratic Front took power and moved quickly to es-
tablish a transitional government and decentralize authority. The transitional government established nine
regional governments and two independent administrative councils in the country’s two largest cities. These
11 regions were largely set up along historical ethnic lines, elected their administrations in the summer of
1992, and each have their own independent Education Bureau. The decentralization of education policy
in Ethiopia occurred through two main declarations. The first was Proclamation No. 41 of 1993. This1All statistics are from the World Bank’s World Development Indicators, and the UNESCO Institute for Statistics.
4

proclamation clarified the division of power between central and regional authorities. Following this procla-
mation, the regional authorities became responsible for the administration and provision of primary and
secondary education. This proclamation functioned as the “cornerstone” for the education policy that was
being drafted, and acted as the de facto initial implementation of the forthcoming policy. The official Edu-
cation and Training Policy, the second major education declaration, was eventually published in 1994, and
was officially forwarded to the regional governments prior to the 1995 school year. The key aspect of this
proposal was that it required that education be fee-free for grades one through ten. The decentralization of
power and lack of official fees in place slowed the implementation of this policy in some areas, but by 1996 a
majority of the country had complied with the decree (Negash, 1996; UNESCO, 2007; Oumer, 2009; World
Bank, 2009).2 This reform is unlikely to have made school “free” for all students, in fact, the government
acknowledged that community support remained an important part of financing education, but schools were
no longer allowed to request a per-student fee (Oumer, 2009; World Bank, 2009). Falling short of fully
removing the cost of attending school only makes finding an impact of the policies more difficult to identify;
therefore, what is directly being measured is the effect of the intention of the government to remove school
fees. Additionally, the Education and Training Policy extended the length of primary school to eight years,
with an additional two years in both junior and senior secondary school. Importantly, there is a cutoff after
eight years of schooling in both the pre and post reform periods, this will be exploited later in the paper.
Enrollment data from the UNESCO Institute for Statistics can be used to determine whether there is
initial evidence that the two reforms issued by Ethiopia’s central government impacted school attendance.
Grade one enrollments are likely to be the most responsive to the fee reductions; it is at this margin there
are the largest number of students who could potentially be affected by the reform. The initial impact of
Proclamation No. 41 should first be seen in the 1993 school year, and the impact of the Education and
Training Policy in the 1995 academic year. Grade one enrollments are shown in Figure 1 from 1979, the
first year data are available, to 1999.3 In the 14 years leading up to 1993, and Proclamation No. 41, grade
one enrollment was relatively flat. The number of primary school entrants had actually declined by nearly
20 percent from 1979 levels, and roughly 40 percent from peak levels. The fall in the late 1980s coincides
with the conflict that eventually led to the overthrow of the military government.4 The 1993 and 19952Proclamation No. 41 also enabled regions to teach in local languages. Zenebe Gebre (2014) finds that the introduction of
mother tongue education actually had a significant negative impact on enrollment, negative 6 percentage points, and schooling,a reduction of 0.4 years of school. This downward pressure on schooling should only make it more difficult to find a positiveimpact of fee-free schooling.
3Ethiopia uses their own calendar that begins its new year, and new academic year, around the second week of the Gregorian(Western) September. The numerical Ethiopian year is either seven or eight months behind the Gregorian year, dependingon the month. The year referenced in the text is the Gregorian year in which the academic year began. For example, 1993references the 1993 to 1994 academic year that began in September of 1993.
4Note that the timing of reform implementation that will be identified in this paper occurs differentially across the countrybetween two and five years following the end of the armed conflict, suggesting that the peace that saw the Ethiopian PeoplesRevolutionary Democratic Front take power is an unlikely explanation for the papers findings.
5

school years represent the two largest increases in grade one enrollment both in terms of the number of
additional students entering school and in percentage growth. The publication of Proclamation No. 41
is associated with more than 280,000 additional students entering grade one relative to the previous year,
a 45 percent increase. Then in 1995, grade one enrollment grew another 317,000 students following the
dissemination of the Education and Training Policy, a year-to-year growth of 28 percent. These are the
largest two increases in annual enrollment. Between 1992 and 1995 pupil-teacher ratios in primary school
increased 40 percent, the increase was more than 60 percent from 1992 to 1996, the year when most of
the country had fully implemented fee-free education. The growth in the number of students per school
is even greater, growing over 75 percent between 1992 and 1995, and 90 percent through 1996 (Ministry
of Education, 1995, 1996, 2000). This is evidence that the increase in enrollment is not being generated
by an increase in the supply of education, but an increase in demand driven by the reduced out-of-pocket
cost of school. These trends are common following this type of national reform, and often pointed out by
critics of these large-scale education reforms. This suggests that Ethiopia conforms to the pattern that is
often observed after a country implements a “big-bang” education expansion; large-scale growth in access
to education, and an expansion of enrollment that typically outpaces the supply of teachers and classrooms.
This is evidence of both the potential effectiveness of these policies, and that Ethiopia is an appropriate
context in which to demonstrate a technique to identify and measure the impact of the reform on schooling.
3 Methodology
3.1 Zone Specific Magnitude and Timing
Quantifying the potential magnitude of the reform is essential to estimating the predicted impact, and doing
this separately for each zone in Ethiopia generates the necessary geographic variation. To allow for future
cross-country comparisons, the potential magnitude of the reform is calculated in reference to the pre-reform
duration of primary school, six years. Motivated by work from Lucas and Mbiti (2012a,b), the underlying
concept is that the magnitude of the reform’s impact is inversely related to the pre-reform level of schooling.
In each zone, z, some fraction of students never enter school (Fz,0), and removing school fees for grades one
through ten has a maximum potential impact of ten years of additional schooling for these students. The
maximum effect in zone z, for this group of students, is then equal to the product of the fraction of students
in the zone who never attended school and the maximum potential impact of the reform (10 · Fz,0). In this
district there also exists some fraction of the population that would have dropped out after completing the
first grade (Fz,1), these students received a maximum nine years of additional schooling following the removal
6

of school fees (9 · Fz,1). The same is true for students who would have dropped out after each successive
year, following grades two through nine. Students completing at least ten years of school are assumed to
be unaffected by the removal of school fees in grades one through ten. Therefore, to capture the magnitude
of the maximum potential effect of the reform in zone z, Mz(G), the impact must be summed across grade
levels zero through nine,
Mz(G) = 16
9∑g=G
(10− g) · Fz,g. (1)
The equation is divided by six to scale the maximum impact of the reform in reference to the original length
of primary school, and set G = 0 to capture the impact of the reform across all grades. As previously stated
Fz,g is the fraction of the population in zone z that left school following grade g, and (10− g) is equal
to the number of additional years of schooling they could complete after the removal of school fees. The
maximum value of the potential magnitude would occur in a zone where no student attended school prior
to the reform (Fz,0 = 1; Fz,g = 0 ∀ g ∈ [1, 9]); every student would receive ten additional years of schooling.
The maximum potential magnitude of the reform is then 10/6. If every student completed at least ten years
(Fz,g = 0 ∀ g ∈ [0, 9]), then the predicted impact of the reform would be zero.
For individuals entering school following the reform’s implementation, the reform impacts their schooling
decision beginning with whether or not they should enter school at all. They are affected by the full
magnitude of the reform, and the G parameter from equation (1) is equal to zero (G = 0). However, for
students who had completed four years of school when the reform was put into place the removal of school
fees would not affect their decision to attended grades one through four, but will impact their decision to
drop out after grade four and each subsequent level. For these students, the impact of the reform begins
following the fourth grade, and equation (1) is calculated with G = 4.5 How the predicted magnitude is
assigned to observations from the data is determined by the timing of the reform, and by the respondent’s
birth year. If every student started on time, at age 7, it would be straightforward to assign each observation
the appropriate magnitude equation. However, the data from Ethiopia, like much of the developing world,
show that this is not the case; delayed entry is common.
Zone specific starting age probabilities are calculated for ages 6 to 12. This takes into account the
possibility that students enters grade one anytime from one year early, at age six, to five years late, at age
12.6 An intensity measure, Izy, is used to appropriately assign the magnitude across birth cohorts. An
individual born in 1972 or later, even starting school at age 12, will progress through the tenth grade prior
5The magnitude equation with G = 4: Mz(4) = 16
9∑g=4
(10 − g) · Fz,g
6Due to high rates of students never entering school in the pre-reform period, the largest margin along which the reformaffects schooling is entry into grade one. Although grade repetition occurs, data are not available at the zone level, and themagnitude of its impact on the distribution of the reform’s timing is likely to be modest relative to school entry.
7

to the reform being put into place. Therefore, individuals born in 1972 or earlier will not be affected by the
removal of school fees. On the other extreme, the reform will be implemented prior to individuals born in
1989 entering school, even if they enter a year early. All individuals born in 1989 or later are fully impacted
by the reform, corresponding to anMz(0) magnitude. This distribution can be seen in the following equation,
Izy =
0 if y ≤ 197212∑
a=6Szya ·Mz (Gy+a−7) if 1973 ≤ y ≤ 1988
Mz (0) if y ≥ 1989
. (2)
The intensity of the reform for individuals from zone z, born in year y, is denoted Izy. As noted above, this
is zero for all individuals born in 1972 and before, and the maximum zone specific magnitude, Mz(0), for
individuals born in 1989 and later. Szya is the probability of starting school at age a, for individuals from
zone z, and born in year y. The intensity of the reform’s impact for individuals born between 1973 and 1988
is the sum of a set of seven zone-specific magnitudes weighted by starting age probabilities. To calculate
starting age probabilities, data are used to estimate the fraction of grade one entrants at each age, 6 to 12.
Assuming a constant relative relationship across ages, two starting probabilities are calculated. Pre-reform
starting probabilities are calibrated to sum to one minus the fraction of students never entering school in
each zone, these are assigned to birth year and starting age combinations that would have had to make the
decision to enter school prior to the removal of fees. Post-reform starting probabilities are calibrated to sum
to one, the maximum impact of every student entering school. The combination of starting age and birth
year determines the magnitude equation with which the starting age probability is paired. The starting age
probability at age seven for any given birth year y is always paired with the magnitude equation for the same
birth year, Szy,7 ·Mz(Gy). However, the starting age nine probability is then paired with the magnitude
equation for the birth cohort born two years later, Szy,9 ·Mz(Gy+2). These products are calculated for each
age, 6 to 12, and then summed together to construct the intensity measure for each birth year from 1973
to 1988.7 Finally, the intensity measure is also calculated separately for men and women to allow for sex
specific estimates of the reform’s impact on schooling.
3.2 Regional Timing
As discussed in Section 2, the implementation of the reform is staggered across Proclamation No. 41
(1993), the Education and Training Policy (1995), and possible delayed implementation (1996) due to the7For further detail, a table listing the affected grade levels by birth year, additional details regarding starting age calculations,
and the explicit equation used to calculate the intensity measure for each birth year are included in the appendix.
8

decentralized government structure put into place by the transitional government (World Bank, 2009). An
objective method is constructed to identify the timing of the reform’s implementation in each of the country’s
11 regions. Pre-reform (1989 to 1992) regional level enrollment data are used to construct predicted levels
of grade one enrollment for the next four years (Ministry of Education, 1995, 1996, 2000). For each region,
the annual grade one enrollment level is then compared to the predicted level of enrollment; the post-reform
period is set to begin in the year with the largest increase of this relative measure.8 To ensure that the
estimates seen in the following section are not dependent on this definition of implementation, additional
estimates are shown using a staggered implementation of the reform. The estimates that allow for gradual
implementation use the same distance above the predicted enrollment level for the years 1993 to 1996, and
assume no implementation prior to 1993 and full implementation no later than 1996.
The national capital of Ethiopia, Addis Ababa, does not follow the same pattern of increase as the other
regions throughout the country. As seen in Figure 2, the increases in enrollment in 1993 and 1995 are
prevalent in the non-Addis Ababa regions of the country, but the same spikes in enrollment do not occur in
the capital. In fact, enrollment levels remain relatively consistent throughout this time period. Furthermore,
this consistency in enrollment in Addis Ababa holds true for grades one through eight (Ministry of Education,
1995, 1996, 2000). This suggests the possibility that the reform was either not needed, or may not have
occurred, in the capital. This is taken into account by setting the intensity measure for Addis Ababa equal
to zero; alternative estimates are also shown calculating the normal intensity measure described by equation
(2) for the Addis Ababa region.
4 Data and Estimation
4.1 Data
This study uses individual-level data from three main sources. Ethiopian census data for the years 1994 and
2007 include information on 5 million and 7.4 million Ethiopians, respectively. These data were collected by
the Ethiopian Central Statistical Agency, and made available as part of the Integrated Public Use Microdata
Series (IPUMS) International by the Minnesota Population Center. Data from the 1994 census are used to
construct baseline education levels and starting age probabilities in each zone. Data from the 2007 census
are used to estimate the paper’s main education results, and are supplemented with data from the 2005 and
2011 rounds of the Demographic and Health Survey (DHS), and the 2014 Living Standards and Measurement
Study (LSMS). Each of these datasets includes information that enables household location to be determined8For the eleven regions the reforms are set as follows: Tigray 1993, Afar 1993, Amhara 1995, Oromiya 1995, Somalia 1993,
Benishangul Gumuz 1993, Southern Nations, Nationalities, and Peoples’ Region 1995, Gambella 1993, Harari 1995, AddisAbaba 1995, and Dire Dawa 1996.
9

at the second administrative level of Ethiopia, the zone. Census data include time consistent definitions of
household location within each zone; household zones using the DHS and LSMS surveys are determined by
mapping survey cluster GPS location onto maps of zone-level boundaries.9 This information is further cross-
referenced with recorded cluster location in the LSMS; zones are not explicitly recorded in the Ethiopian
DHS. Each dataset also includes information on individual’s years of schooling, sex, and age; this is the only
information needed to identify and estimate the impact of the reform.
Each of the datasets has a unique set of strengths, and testing that the effect of the education reform
can be identified across all of the surveys provides important evidence that the model is capturing a change
that occurred in Ethiopia. Although the 2007 census only collects a small amount of information on each
individual, it collects the information necessary to measure the impact of the reform on schooling, and
includes thousands of observations in every zone. The census and LSMS do not explicitly ask for birth year,
it is inferred using the respondent’s age and the year of the survey. The DHS explicitly records birth year,
cross checks this information with other dates and ages in the survey to correct for errors, and records the
depth of the respondent’s knowledge of their birth year. Only 73 percent of respondents are able to report
their birth year; it is imputed using age information for the remaining respondents. Due to the importance
of the timing of when an individual was born to this study, it is extremely beneficial to have a subsample
of respondents with information that has a higher likelihood of being accurate. In the census and DHS, the
place of one’s childhood education is not explicitly known, but region of birth data in the LSMS suggests
that today’s location is likely a good approximation. Data from the LSMS demonstrates that 86 percent of
respondents born between 1972 and 1989 still live in their region of birth. This information is used to show
that estimates for the full sample are similar to those for respondents who remain in the region in which
they were born. Furthermore, this information is used to adjust for migration in an alternative construction
of the identification variable, again yielding similar estimates.
4.2 Summary Statistics
Relevant summary statistics, using data from the 2007 census, are shown in Table 1. Data are shown for the
1972 birth cohort, the first entirely pre-reform cohort, and the 1989 birth cohort, the first fully post-reform
cohort. These cohorts bookend the range included in the baseline set of estimates in the following sections.
The average intensity measure is shown in the first row, for the full sample on the left-hand side of the
table, and then separately for men and women. The intensity measure is always zero for the pre-reform 1972
cohort, and larger for women in the 1989 cohort. As can be seen in the second row, education levels in the9Matching to map boundaries is done with two sources. Zone level boundaries are obtained from IPUMS International
(2015) and the Food and Agriculture Organization GeoNetwork’s Global Administrative Unit Layers (GAUL) maps (2016).
10

pre-reform period are exceedingly low. From an average of about one year of schooling for women born in
1972, to just under three years of schooling for men born in the same year. These low levels of schooling lead
to a large potential impact of the reform, and average full intensity estimates of 1.41 and 1.22 for women
and men, respectively. Over this time period, education increased for women and men both, an increase of
1.78 years for women, and 0.91 years for men. Because average education rates are so low in the pre-reform
period, increasing average years of schooling in this range could have a significant effect on literacy rates.
An initial look at the data reinforces this understanding. Early literacy rates were much lower for women
in the earlier cohorts (0.21 vs. 0.50), but increased nearly twice as much as the male literacy rate over this
time period. In addition to a basic measure of learning, such as the literacy rate, there is consistent growth
across the entire sample for the fraction of individuals completing eighth grade (9 percentage points), and a
reduced increase in the completion of ninth grade (5 percentage points).
The evolution of the two key variables, years of schooling and Izy, are shown in Figure 3. Years of
schooling data are plotted using three-year averages taken from the 2007 census. The initial changes in the
instrument occur slowly for birth cohorts from 1972 to the early 1980s. In the construction of the intensity
measure, all school entrants for these birth cohorts are assumed to be making their school entry decision
prior to the reform; therefore, the impact of the reform is entirely dependent on keeping would-be-dropouts
in school longer. There is little growth in years of schooling for cohorts through 1980, but the 1981 and 1982
cohorts outpace the predicted change. In the Izy model, the first cohort possibly making their entry decision
after the implementation of the reform is the 1982 cohort, entering at age 12. This suggests that expanding
the model to consider entrants at older ages would likely not account for the divergence for these birth
cohorts. The performance of the model matches key points in the data for the birth cohorts between 1983
and 1989. For example, the large jump priors to the 1983, 1985 and 1987 cohorts. Overall the comparison in
Figure 3 demonstrates that the estimated implementation of the reform, as shown by Izy, reasonably tracks
the observed evolution of schooling in Ethiopia.
4.3 Estimating Equation
The central model of this paper examines the relationship between the estimated intensity measure from
equation (2), and years of schooling. The model exploits both the geographic and temporal variation built
into the construction of the intensity measure to identify gains in schooling from a national level reform in a
developing setting. The estimates used in this paper are from an ordinary least squares model that is defined
by the equation
Yizy = α+ Izyβ + τy + δz +Xizyθ + εizy. (3)
11

The dependent variable is Y , generally years of schooling, for individual i, born in year y, from zone z. β is
the coefficient of interest, and Izy is the zone and birth year specific estimated intensity of the reform which is
calculated by exploiting geographic variation in the zone-specific pre-reform education levels, and the timing
of the reform. Izy is scaled to equal one when six years of school, the length of pre-reform primary school,
are provided free of fees; therefore, β can be interpreted as the increase in years of schooling generated by
providing free primary education. τy is a set of birth year fixed effects that capture any secular changes
occurring across Ethiopia in any given year, and δz is a set of zone-specific fixed effects capturing any time
invariant characteristics that impact schooling. Xizy is a vector of individual level covariates that could
include a cubic for age when multiple survey rounds are part of the sample, a dummy for sex when both men
and women are included in the sample, or region of birth. It is important that these covariates are either
constant over an individual’s lifetime or are determined prior to schooling decisions being made. Estimates
are weighted using sampling weights provided by the surveys, and standard errors are clustered by zone to
allow for within zone correlation (Bertrand et al., 2004).
5 Results
5.1 Baseline Estimates
Baseline estimates of the effect of the education reform on years of schooling in Ethiopia are shown in
Table 2. All nine samples include birth cohorts from 1972 to 1989, the narrowest band of birth cohorts
possible that fully captures the reform. The intensity measure (Izy) is constructed using both male and
female observations to estimate the results in Panel A, and using only the respective sex specific data for
the estimates in Panel B and Panel C. All nine estimates, using three separate sources of data, find that
the reform led to a statistically significant increase in years of schooling. Estimates for the full sample are
shown in Panel A; the model estimates that fee-free primary school led to an increase of between 1.121 and
1.767 years of school. Estimating the model separately for both women (Panel B) and men (Panel C) again
yields strong evidence of an increase in schooling generated by the reform in Ethiopia.
Three additional observations come from the results seen in Table 2. First, precision of birth year matters.
The intensity measure assigned to an observation is partially dependent on the timing of their birth. The
DHS survey specifically attempts to accurately measure year of birth information, and flags imputed results.
Additionally, the estimates in column (2) include only individuals that were able to identify their year of
birth.10 Estimates for the DHS sample are generally larger, suggesting that measurement error in the year of10Of the DHS sample, 73 percent are able to report their year of birth information. Estimates using the full DHS sample are
included in Appendix Table A2.
12

birth may be biasing results towards zero. Although larger, this is a reason to think that the DHS estimates
may be more accurate. The second observation is that the gender patterns observed in the first two columns,
for the census and DHS, are very similar, and match the ex-ante expectation based on the growth in means of
years in schooling seen in Table 1. The estimate for the overall sample from the LSMS is similar to the other
two sources; however, caution is warranted when interpreting the breakout by gender. Finally, F-statistics
are shown for all nine estimates in the table. Although developing this straightforward identification is an
important addition to the literature, this method can be useful beyond its applications to measuring the
impact of education reforms if the identification is strong enough to be used as an instrument in a two-stage
least squares model. The F-statistics shown in Table 2 demonstrate that the intensity measure would be a
strong instrument when using the full sample from any of the three datasets, and for any of the three gender
breakouts when using the DHS. This suggests that this method, when studying Ethiopia, can be used to
examine how education affects any number of important outcomes.
Using the full sample, estimates in Table 3 demonstrate that the results are not dependent on sample
selection or key assumptions made in the construction of the intensity measure. Estimates in Panel A expand
the birth cohorts included in the sample by an additional three years in either direction. Estimates in Panel B
include a fully calculated intensity measure for Addis Ababa. The estimates in Panel C utilize a reconstructed
intensity measure that allows for the possibility that the policy was implemented over time, between 1993
and 1996. The pace of implementation is calculated relative to the predicted enrollments levels from section
3.2, and calculated separately for each region. Across all three panels and datasets, the estimates remain
statistically significant at the 99 percent level for eight of the nine estimates. This demonstrates that the
estimates from Table 2 are not reliant on the specific assumptions used to construct the intensity measure,
or the sample range employed.
5.2 Migration Adjustments
Of the three data sources used to test the robustness of the intensity measure, the LSMS adds significant
value due to its inclusion of birth region information. An intensity measure constructed using zone of birth
data would be ideal. However, LSMS data provide evidence that internal migration is not overly prevalent
during this time period; more than four-fifths of the sample lives in their region of birth. In addition to
this, Ethiopia is divided across strong ethnic and linguistic divides that provide an additional barrier to
movement. Important information available from the LSMS can still be used to examine whether internal
migration may be biasing the previous estimates. Estimates shown in Table 4 are all generated using the
full sample of LSMS data. Estimates in column (1) simply add a set of region of birth fixed effects to the
13

original model. The estimates in column (2) include only individuals who remain in their region of birth,
86 percent of the sample. The estimates in the third column utilize a migration adjusted intensity measure.
To construct this new measure, province level intensity calculations were made following the same process
described in section 2, and allocated using the following three rules: (1) the intensity value is birth zone if
zone of birth is a major urban zone (Addis Ababa, Harari, or Dire Dawa), (2) value is region of birth average
if currently living in a major urban zone that is not zone of birth, or if living in zone that does not border
region of birth, (3) value is original Izy if living in region of birth or zone bordering region of birth.11 All
three estimates remain statistically significant, and very similar to the baseline estimate from column (3) of
Panel A in Table 2. The largest difference is a reduction of one-tenth of one year of schooling, in column (2)
of Table 4. The F-statistics also remain above ten for the two estimates that include the full sample. This
is evidence that it is unlikely that the estimates from the previous tables are being biased by misallocation
of the intensity measure due to migration within Ethiopia.
5.3 Literacy and Advancing to Grade 8 and Grade 9
A consistent point of contention regarding this type of “big-bang” reform is that while it may improve the
quantity of education provided, it has a detrimental impact on the quality. This sentiment is likely true, but
positive changes generated by bringing new students to the classroom may outweigh reductions in quality to
the existing education. Literacy can be used to test whether the increase in years of schooling found in the
previous results led to increased levels of education. Especially at the lower levels of education seen in the
pre-reform period, it seems that increasing schooling off a pre-reform base of two years could potentially lead
to large increases in literacy. Estimates using literacy as the dependent variable in equation (3) are shown
in Panel A of Table 5. They estimate that the reform led to an increase in the literacy rate of between 8.6
and 12.6 percentage points, and all three estimates are statistically significant.12 These results are roughly
a 30 percent increase in the literacy rate compared to the baseline level of the 1972 cohort.13 This is initial
suggestive evidence that the post-reform quality of education remained high enough to lead to a significant
increase in learning that would have not otherwise occurred.
An additional way to examine this question of education quality is to exploit a characteristic of the
reform in Ethiopia. Progression past grade eight required completion of an exam both before and after the
reform. This provides a second setting in which the quantity-quality balance can be seen and evaluated. The11Rule 1 is prioritized, and Rule 2 is prioritized over Rule 3. Note that Addis Ababa, Harari, and Dire Dawa function as both
zones and regions. If born in these regions, then zone-specific intensity measure is known for zone of birth.12Marginal probit estimates are larger for all three datasets ranging from 0.117 to 0.15, and remain statistically significant
at the 99 percent level for the census and DHS, and at the 90 percent level for the LSMS.13Literacy rate estimates for the female sample are above 0.1 for all three samples, and statistically significant at the 99
percent level. This magnitude of increase suggests the reform led to at least a 50 percent increase in the national literacy ratefor women. Estimates for men range from 0.055 to 0.083, and remain statistically significant for the census and DHS samples.
14

dependent variable in Panel B of Table 5 is an indicator equal to one if the respondent completed at least
eight years of school, and in Panel C the dependent variable is equal to one if the respondent completed
at least nine years of schooling. Estimates are again calculated using the model described in equation (3).
Estimates in Panel B demonstrate that the reform increased the likelihood of completing at least eight years
of school by between 5.8 and 10.5 percentage points.
The increase in grade eight completion can be thought of as the expected “quantity effect” that has been
evident throughout the paper. In both states of the reform, these students then had to pass an exam to be
eligible to continue to, and potentially complete, grade nine. If post-reform students perform better on the
exam (increased quality), any increase in grade nine completion should be larger than the increase in the
grade eight completion rate. If the opposite is true, and the increase is smaller for grade nine, this would
be evidence that the quality of the education may be declining. However, this then raises an important
secondary question, has completion of grade nine increased due to the reform (“quantity effect” > “quality
effect”), or declined (“quantity effect” < “quality effect”)? Even in the presence of a decline in quality (a
smaller effect on grade nine relative to grade eight), it remains possible that the overall effect of the reform
is positive and the increased enrollment outweighs a decline in quality. The estimates in Panel C of Table 5
help provide insight to the answer for these questions. For both the census and DHS estimates, the increase
in grade nine completion is less than the increase in grade eight completion. This suggests a higher failure
rate on the post-grade eight exam, a lower quality. The LSMS again diverges, but actually shows a larger
increase in grade nine completion.14 At the very least, there is no evidence of a decline in quality that is so
extreme that it outweighs the increase in the number of students entering and progressing through school.
Both the literacy and grade completion estimates provide important suggestive evidence that a sufficient
level of quality persists in the post-reform period.
5.4 Placebo Estimates
As a general trend, education levels throughout Africa have been increasing in recent years. Although
the inclusion of two dimensions of variation helps to alleviate concerns that the estimates for Ethiopia are
only capturing this secular increase in education, some level of concern could remain. To address this,
an intensity measure is calculated for four additional countries for whom recent data are available, where
no reform occurred during the 1990s, but following the equations that define the timing of the Ethiopian
reform’s implementation. This simulates the same reform measured in Ethiopia being implemented in four
alternative settings. Finding similar estimates would suggest that the results shown in this paper are driven14Probit estimates across all six grade eight and grade nine estimates are statistically significant at the 99 percent level.
Marginal probit point estimates suggest grade eight results between 0.086 and 0.103, and grade nine estimates ranging between0.056 and 0.082. All three grade eight estimates are larger, with differences ranging from 0.004 to 0.03.
15

by general increases in education that are not specific to Ethiopia. Intensity measures from Kenya (which
borders Ethiopia to the southwest), Tanzania, Zambia, and Mali are calculated using census data from each
country.15 Kenya was chosen due to its proximity to Ethiopia, Mali for its similar pre-1990s education
level, and Tanzania and Zambia were added as additional checks that fit the necessary conditions mentioned
above. These intensity measures are then paired with the most up to date datasets available, the 2008/9 and
2014 DHS from Kenya, the 2007/8 (AIDS Indicators Survey) and 2010 DHS from Tanzania, the 2010 census
from Zambia, and the 2009 census from Mali; equation (3) is used to estimate whether the placebo intensity
measures predict increases in schooling similar to those found in Ethiopia. The estimates are shown in
Table 6; Panel A includes estimates for a simulated 1993 implementation, and Panel B for a simulated 1995
implementation. Additionally, to mimic the zero intensity measure in Addis Ababa, the intensity measure
in each country’s urban center is also set equal to zero.16 There is no evidence of a large increase in years of
schooling linked to the misplaced intensity measures in any of the countries, for either timing of the reform.
The largest positive estimate is 0.237, from the Kenyan DHS; it is about one-fifth of the smallest estimate
from Ethiopia, and only 13 percent as large as the corresponding increase using the Ethiopian DHS. For Mali,
where an individual born in 1972 averaged only 1.58 years of schooling, the coefficient estimates are large,
statistically significant, and negative. This could signify an increased unlikelihood for areas that are in the
extremes in regard to education, as Ethiopia was in the early 1990s, to have convergence in education levels
without such a significant effort to improve the system. Most importantly, there is no evidence from these
regressions that the model is capturing general trends in schooling improvements; large positive estimates
were only found in Ethiopia, in the presence of an education reform.
6 Conclusion
Using both temporal and geographic variation to identify the effect of the education reform in Ethiopia, the
model shows that the removal of school fees led to large increases in schooling. The reform is found to have
increased the average Ethiopian’s schooling by more than one additional year. The estimates are shown to
be robust across a number of specifications and migration adjustments. The reform is also found to have
increased literacy rates by nearly 30 percent. The method of identification is replicated in four alternative
African countries, countries in which no contemporaneous education reform took place. In none of these
countries is there evidence of a similar increase in education, further isolating the Ethiopian reform as the
cause of the increase in years of schooling.
The magnitude of the increase in schooling that occurred in Ethiopia due to the reform is difficult to15Census data are from Minnesota Population Center’s IPUMS (2015).16Estimates allowing variation in the urban centers are shown in Appendix Table A5.
16

overstate. The reform increased schooling by 50 percent over the baseline level of the 1972 cohort. To put
this into perspective, the size of external intervention necessary to cause this kind of national change is
unimaginable. In 1995, there were 26 million Ethiopian children under the age of 14. Consider a scenario in
which it were possible to construct an education program that would guarantee every student who entered
would complete eight years of primary school, and assume that the pre-reform level of schooling was two
years, on average. Although the itself program is unrealistic, no program can promise completion, the scale
of this type of program would need to be impossibly large. If this program were to be implemented in
Ethiopia, and it had a target of increasing schooling by 1.2 years (the median estimate from Table 2), on
average, for all 26 million children, the program would have to enroll 5.2 million children.17 In other words,
the magnitude of the reform that occurred in Ethiopia is equivalent to a program that brings one out of
every five children in Ethiopia all the way through eight years of primary school.
This paper presents a strategy, using regularly available data, to identify national level schooling reforms
in developing settings. This strategy is applied to Ethiopia, and the estimates indicate that the reform led to
significantly more schooling. Initial results also show that the increased quantity of schooling led to higher
levels of literacy and ninth grade completion. This is suggestive evidence that the increased enrollments
outweighed any potential quality loss in education. Future work can expand on this conclusion by utilizing
this method of identification to examine whether the fee removal of the early 1990s, and the increased
schooling it generated, led to welfare gains for the people of Ethiopia.
17This calculation comes from solving for x in the following equation. 3.2 = 26−x26 · 2 + x
26 · 8. The 26 − x million students notinvolved in the program remain at two years of school, and x students enter the program and receive eight years of schooling.The goal is to increase the average years of schooling by 1.2 years, from the baseline level of two years, to 3.2 years of school.
17

References
Agüero, J. M. and Bharadwaj, P. (2014). Do the More Educated Know More About Health? Evidence from
Schooling and HIV Knowledge in Zimbabwe. Economic Development and Cultural Change, 62(3):489–517.
Bertrand, M., Duflo, E., and Mullainathan, S. (2004). How Much Should We Trust Differences-In-Differences
Estimates? Quarterly Journal of Economics, 119(1):249–275.
Bleakley, H. (2010). Malaria Eradication in the Americas: A Retrospective Analysis of Childhood Exposure.
American Economic Journal: Applied Economics, 2(2):1–45.
Cameron, A. C., Gelbach, J. B., and Miller, D. L. (2008). Bootstrap-Based Improvements for Inference with
Clustered Errors. Review of Economics and Statistics, 90(3):414–427.
Deininger, K. (2003). Does Cost of Schooling Affect Enrollment by the Poor? Universal Primary Education
in Uganda. Economics of Education Review, 22(3):291–305.
Duflo, E. (2001). Schooling and Labor Market Consequences of School Construction in Indonesia: Evidence
from an Unusual Policy Experiment. American Economic Review, 91(4):795–813.
Duflo, E. (2004). The Medium Run Effects of Educational Expansion: Evidence from a Large School
Construction Program in Indonesia. Journal of Development Economics, 74(1):163–197.
Elder, T. E. and Lubotsky, D. H. (2009). Kindergarten Entrance Age and Children’s Achievement Impacts
of State Policies, Family Background, and Peers. Journal of Human Resources, 44(3):641–683.
Food and Agriculture Organization: GeoNetwork (2016). Global Administrative Unit Layers (GAUL).
Grépin, K. A. and Bharadwaj, P. (2015). Maternal Education and Child Mortality in Zimbabwe. Journal
of Health Economics, 44:97–117.
Lucas, A. M. (2010). Malaria Eradication and Educational Attainment: Evidence from Paraguay and Sri
Lanka. American Economic Journal: Applied Economics, 2(2):46.
Lucas, A. M. (2013). The Impact of Malaria Eradication on Fertility. Economic Development and Cultural
Change, 61(3):607–631.
Lucas, A. M. and Mbiti, I. M. (2012a). Access, Sorting, and Achievement: the Short-Run Effects of Free
Primary Education in Kenya. American Economic Journal: Applied Economics, 4(4):226–253.
Lucas, A. M. and Mbiti, I. M. (2012b). Does Free Primary Education Narrow Gender Differences in School-
ing? Evidence from Kenya. Journal of African Economies, 21(5):691–722.
18

McCrary, J. and Royer, H. (2011). The Effect of Female Education on Fertility and Infant Health: Evidence
from School Entry Policies Using Exact Date of Birth. American Economic Review, 101(1):158–195.
Ministry of Education (1995). Education Statistics Annual Abstract 1986 EC (1993-94). Technical report,
Ministry of Education (Ethiopia), Addis Ababa.
Ministry of Education (1996). Education Statistics Annual Abstract 1987 EC (1994-95). Technical report,
Ministry of Education (Ethiopia), Addis Ababa.
Ministry of Education (2000). Education Statistics Annual Abstract 1992 EC (1999-00). Technical report,
Ministry of Education (Ethiopia), Addis Ababa.
Minnesota Population Center (2015). International Public Use Microdata Series, International: Version 6.4.
[Machine-readable database].
Negash, T. (1996). Rethinking Education in Ethiopia. Uppsala. Nordiska Afrikainstituet.
Ofcansky, T. P. and Berry, L. B. (1993). Ethiopia, A Country Study. Washington DC. Federal Research
Division, Library of Congress.
Osili, U. O. and Long, B. T. (2008). Does Female Schooling Reduce Fertility? Evidence from Nigeria.
Journal of Development Economics, 87(1):57–75.
Oumer, J. (2009). The challenges of free primary education in Ethiopia. UNESCO: International Institute
for Educational Planning.
UNESCO (2007). World Data on Education. Geneva. UNESCO: International Bureau of Education.
World Bank (2009). Abolishing School Fees in Africa: Lessons from Ethiopia, Ghana, Kenya, Malawi, and
Mozambique. Washington DC. World Bank.
Zenebe Gebre, T. (2014). Effects of Mother Tongue Education on Schooling and Child Labor Outcomes.
Working Paper.
19

Figures
Figure 1: Grade One Enrollment, By Academic Year
Note: P41 refers to Proclamation No. 41, and ETP to the education and Training Policy.Source: UNESCO Institute for Statistics.
Figure 2: Percentage Change in Grade 1 Enrollment: Addis Ababa vs Rest of CountrySource: Ethiopian Ministry of Education (1995; 1996; 2000)
20
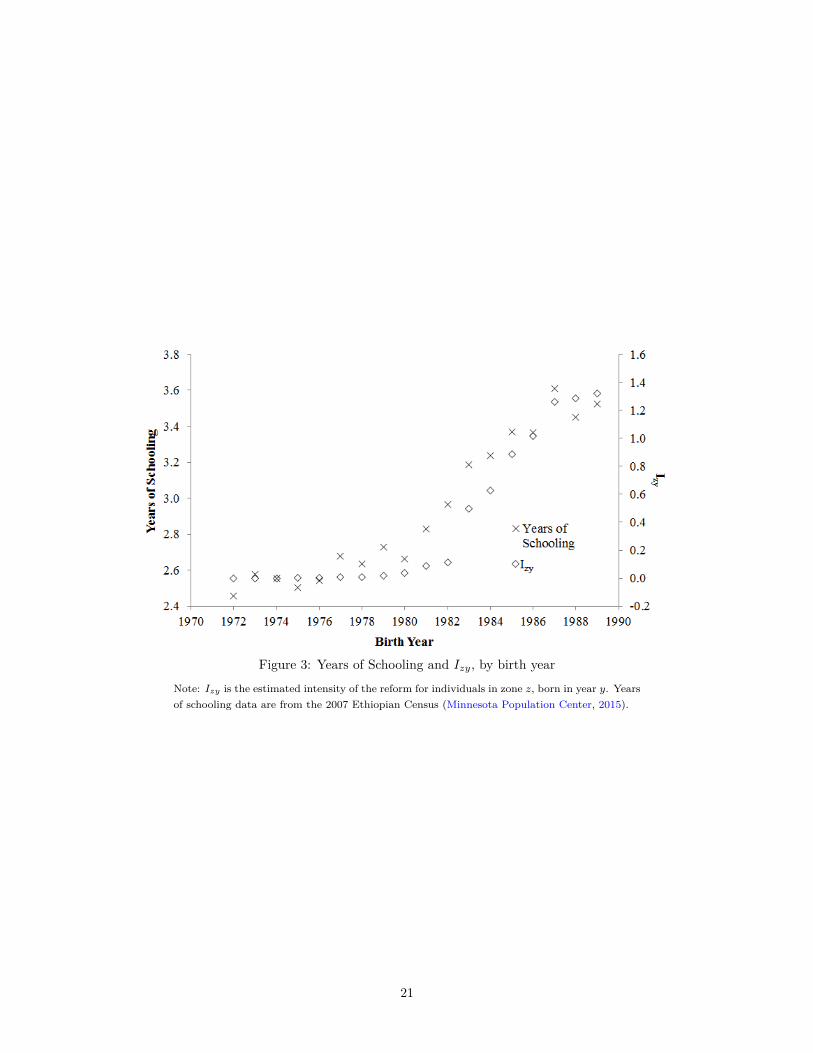
Figure 3: Years of Schooling and Izy, by birth year
Note: Izy is the estimated intensity of the reform for individuals in zone z, born in year y. Yearsof schooling data are from the 2007 Ethiopian Census (Minnesota Population Center, 2015).
21

Tables
Table 1: Summary StatisticsFull Sample Female Male
Birth Year 1972 1989 1972 1989 1972 1989Izy 0.00 1.32 0.00 1.41 0.00 1.22
Years of Schooling 2.03 3.41 1.16 2.94 2.98 3.89
Literate 0.35 0.59 0.21 0.51 0.50 0.66Completed at Least 8 Years 0.11 0.20 0.06 0.17 0.16 0.23Completed at Least 9 Years 0.08 0.13 0.05 0.11 0.12 0.14
Note: Izy is the estimated intensity of the reform for individuals in zone z, born in year y. All data forschooling variables are from the 2007 Ethiopian Census (Minnesota Population Center, 2015). Literacy,completed at least 8 years, and completed at least 9 years are expressed as fractions of the relevantpopulation group.
22

Table 2: Effect of Education Reform on Years of SchoolingYears of Schooling
Census DHS LSMS(1) (2) (3)
A. Full SampleIzy 1.121*** 1.767*** 1.251***
(0.327) 0.233 (0.290)
F-Stat 11.77 57.55 18.57N 376,987 20,705 4,571
B. FemaleIzy 1.240*** 1.822*** 0.895*
(0.303) 0.246 (0.516)
F-Stat 16.70 54.68 3.01N 199,179 12,598 2,551
C. MaleIzy 0.948** 1.547*** 1.767***
(0.362) 0.257 (0.308)
F-Stat 6.87 36.29 32.91N 177,808 8,107 2,020
Note: *** p<0.01, ** p<0.05, * p<0.1. The dependentvariable is years of schooling. All samples include birthcohorts from 1972 to 1989; in Panel B and Panel C sexspecific data are used to calculate the intensity estimatedintensity of the reform, Izy . All regressions include birthyear and zone fixed effects. An indicator equal to one forall male observations is included in Panel A regressions,and DHS estimates, which use data from the 2005 and2011 surveys, also include a cubic control for age. Census(2007) and LSMS (2014) estimates include only a singlesurvey round, age is therefore jointly determined by birthyear and survey year. Izy is set to zero for Addis Ababa,as explained in section 3.2. Each estimate is from a uniqueregression, weighted using weights provided by the survey,and standard errors are clustered at the zone level.
23

Table 3: Effect of Education Reform on Years of Schooling:Alternative Specifications
Years of SchoolingCensus DHS LSMS(1) (2) (3)
A. Birth Years: 1969 to 1992Izy 1.456*** 2.014*** 1.458***
(0.353) 0.219 (0.309)
F-Stat 16.99 84.38 22.30N 492,234 25,970 5,991
B. Addis Ababa: 1995 ImplementationIzy 1.157** 2.021*** 1.378***
(0.451) (0.364) (0.444)
F-Stat 6.59 30.75 9.64N 376,987 20,705 4,571
C. Staggered ImplementationIzy 1.189*** 1.867*** 1.233***
(0.345) 0.216 (0.305)
F-Stat 11.88 74.68 16.32N 376,987 20,705 4,571
Note: *** p<0.01, ** p<0.05, * p<0.1. The dependent vari-able is years of schooling. All samples include both male andfemale observations. All regressions include birth year andzone fixed effects, and an indicator equal to one for obser-vations that are male. DHS estimates, which use data fromthe 2005 and 2011 surveys, also include a cubic control forage. Census (2007) and LSMS (2014) estimates include onlya single survey round, age is therefore jointly determined bybirth year and survey year. The sample for Panel A includescohorts from 1969 to 1972; Panel B and Panel C samples in-clude the 1972 to 1989 cohorts. The estimated intensityof the reform, Izy , is fully calculated for the Addis Ababaregion in Panel B, and Panel C calculates Izy assuming agradual implementation as explained in section 3.2. Eachestimate is from a unique regression, weighted using weightsprovided by the survey, and standard errors are clustered atthe zone level.
24
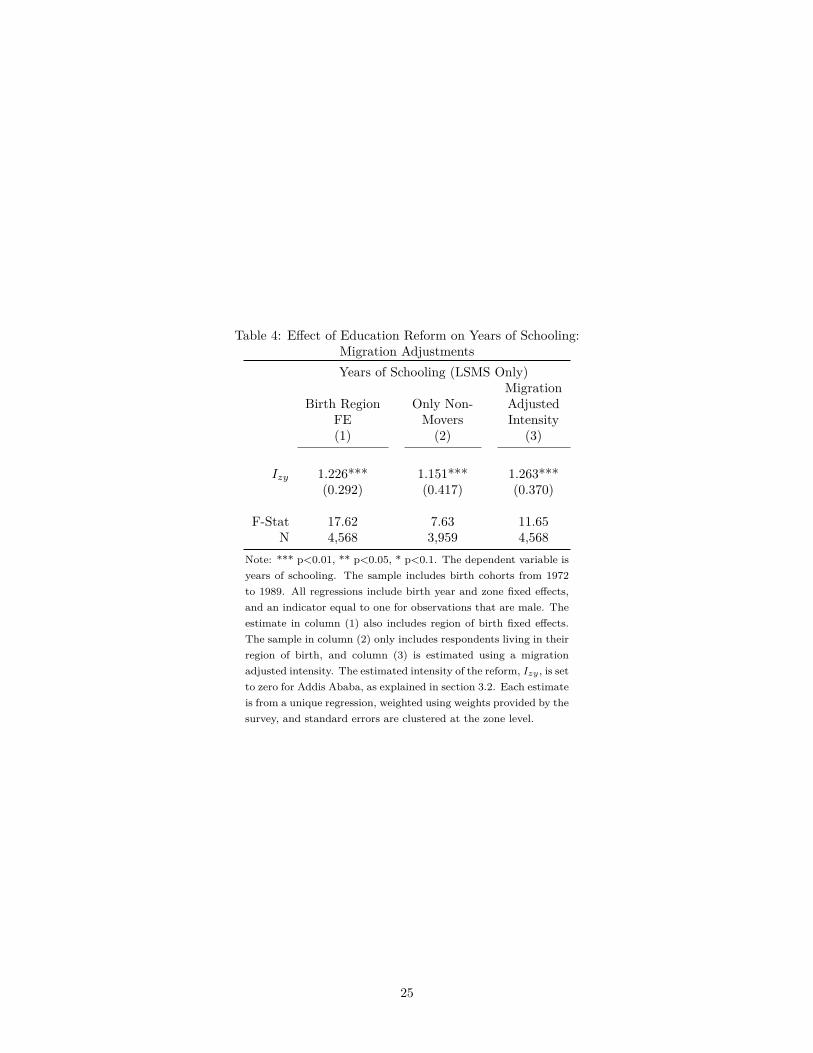
Table 4: Effect of Education Reform on Years of Schooling:Migration AdjustmentsYears of Schooling (LSMS Only)
MigrationBirth Region Only Non- Adjusted
FE Movers Intensity(1) (2) (3)
Izy 1.226*** 1.151*** 1.263***(0.292) (0.417) (0.370)
F-Stat 17.62 7.63 11.65N 4,568 3,959 4,568
Note: *** p<0.01, ** p<0.05, * p<0.1. The dependent variable isyears of schooling. The sample includes birth cohorts from 1972to 1989. All regressions include birth year and zone fixed effects,and an indicator equal to one for observations that are male. Theestimate in column (1) also includes region of birth fixed effects.The sample in column (2) only includes respondents living in theirregion of birth, and column (3) is estimated using a migrationadjusted intensity. The estimated intensity of the reform, Izy , is setto zero for Addis Ababa, as explained in section 3.2. Each estimateis from a unique regression, weighted using weights provided by thesurvey, and standard errors are clustered at the zone level.
25

Table 5: Effect of Education Reform on Literacy and Completing At Least Eight or Nine Years
Census DHS LSMS(1) (2) (3)
A. LiteracyIzy 0.086*** 0.126*** 0.091**
(0.023) (0.027) (0.038)
N 376,987 20,312 4,571
B. Complete At Least Eight Years of SchoolIzy 0.079*** 0.105*** 0.058**
(0.025) (0.018) (0.022 )
N 376,987 20,705 4,571
C. Complete At Least Nine Years of SchoolIzy 0.061** 0.080*** 0.068**
(0.023) (0.020) (0.029)
N 376,987 20,705 4,571Note: *** p<0.01, ** p<0.05, * p<0.1. The dependent variableis an indicator equal to one if the respondent is literate inPanel A, if years of schooling is greater than or equal to eight(Panel B), or nine (Panel C). The sample includes birth cohortsfrom 1972 to 1989. All regressions include birth year and zonefixed effects, and an indicator equal to one for individuals thatare male. DHS estimates, using data from the 2005 and 2011surveys, also include a cubic control for age. Census (2007) andLSMS (2014) estimates include only a single survey round, ageis therefore jointly determined by birth year and survey year.The estimated intensity of the reform, Izy , is set to zero forAddis Ababa, as explained in section 3.2. Each estimate isfrom a unique regression, weighted using weights provided bythe survey, and standard errors are clustered at the zone level.
26

Table 6: Effect of Education Reform on Years of Schooling:Placebo Estimates
Years of SchoolingKenya Tanzania Zambia Mali(1) (2) (3) (4)
A. 1993 ImplementationIzy 0.237** -0.024 -0.188 -0.777***
p=0.048 (0.357) (0.137) (0.104)
N 29,410 12,803 315,846 250,506
B. 1995 ImplementationIzy 0.206 -0.091 -0.015 -0.812***
p=0.202 (0.413) (0.184) (0.118)
N 29,410 12,803 315,846 250,506Note: *** p<0.01, ** p<0.05, * p<0.1. The dependent variable isyears of schooling. The sample includes birth cohorts from 1972 to1989. All regressions include birth year and zone fixed effects, andan indicator equal to one for observations that are male. Kenya dataare from 2008/9 and 2014 rounds and Tanzania data are from 2007,2008, and 2010 rounds of the DHS; estimates also include a cubiccontrol for age. Zambia and Mali data are from 2010 and 2009 censusrounds, respectively. The estimated intensity of the reform, Izy , isset to zero for major urban center in each country (Nairobi, Dar esSalaam, Lusaka, Bamako). Each estimate is from a unique regression,weighted using weights provided by the survey, and standard errors areclustered at the zone level. Kenya includes fewer than 50 zones, wild-bootstrap p-value is substituted for standard error (Cameron et al.,2008).
27

A Appendix
A.1 Timing and Intensity Calculation: Example of 1995 Implementation
The following uses a 1995 implementation of the Ethiopian education reform as an example. Appendix Table
A6 outlines the year-grade level combinations that are considered to be affected by the reform. The table
is organized by birth year, age at the beginning of the calendar year, and grade of attendance if starting
and matriculating on time.18 Students born in 1987 or later, and starting on time, enter school in the post-
reform, fee-free, period. However, students entering school before this time must pay the prevailing school
fees to enter grade one. These divergent decisions yield two separate probabilities of entering school at a
given age, one pre-reform, and one post-reform. School starting age probabilities are calculated using census
data for ages 6 to 12 for each zone in Ethiopia; it is assumed that the relative start probabilities across the
different ages remain constant. For example, if a student is twice as likely to enter at age seven relative
to age six, this ratio is consistent across both states of the reform. For each zone, pre-reform period start
probabilities (Sz,pre) are rescaled to ensure that the sum of the start probabilities for ages 6 to 12 is equal
to one minus the fraction of students who never enter school. Post-reform start probabilities (Sz,post) are
scaled by setting the sum of the age 6 to 12 start probabilities equal to one, the maximum potential impact
of the reform leading full attendance. The above assumption regarding the relative start age probabilities
and these two definitions ensure that the post-reform start probability at any given age, a, is larger than the
pre-reform start probability (Sz,post,a − Sz,pre,a > 0). Note that this leaves a number of students who would
enter by age 12 in the post-reform state, but not in the pre-reform state. This will be taken into account in
the following equations.
The equations for the calculation of each birth year are listed below. These equations take into account
the pre and post start probabilities explained above, and magnitude calculation from equation (1). Any birth
year and age combination that would have an individual graduating grade 10 prior to the implementation of
the reform, would yield zero benefit from the reform, and is not included in the following equations. From
Appendix Table A6, this is analogous to a student being born in 1977 or earlier, and entering grade one no
later than 1985. Furthermore, a student born in 1972, that enters school as late as allowed by this model,
at age 12, would start grade one in 1985, and therefore not be impacted by the reform,
Iz,1972 = 0.
Then a student born the next year, in 1973, and entering school at age 12 would receive a single year of18Ethiopian school begins at the beginning of the Ethiopian year (in September of the Gregorian calendar).
28

additional schooling from the reform,
Iz,1973 = Sz,pre,12 ·Mz (9) .
Those born in 1974 and starting at age 12 would receive two additional years, and starting at 11 would
receive one additional year, and this iteration continues in a similar fashion through the 1981 birth year:
Iz,1974 = Sz,pre,12 ·Mz (8) + Sz,pre,11 ·Mz (9) ,
Iz,1975 = Sz,pre,12 ·Mz (7) + Sz,pre,11 ·Mz (8) + Sz,pre,10 ·Mz (9) ,
Iz,1976 = Sz,pre,12 ·Mz (6) + Sz,pre,11 ·Mz (7) + Sz,pre,10 ·Mz (8) + Sz,pre,9 ·Mz (9) ,
Iz,1977 = Sz,pre,12 ·Mz (5) + Sz,pre,11 ·Mz (6) + Sz,pre,10 ·Mz (7) + Sz,pre,9 ·Mz (8) + Sz,pre,8 ·Mz (9) ,
Iz,1978 = Sz,pre,12·Mz (4)+Sz,pre,11·Mz (5)+Sz,pre,10·Mz (6)+Sz,pre,9·Mz (7)+Sz,pre,8·Mz (8)+Sz,pre,7·Mz (9) ,
Iz,1979 = Sz,pre,12 ·Mz (3) + Sz,pre,11 ·Mz (4) + Sz,pre,10 ·Mz (5) + Sz,pre,9 ·Mz (6)
+ Sz,pre,8 ·Mz (7) + Sz,pre,7 ·Mz (8) + Sz,pre,6 ·Mz (9) ,
Iz,1980 = Sz,pre,12 ·Mz (2) + Sz,pre,11 ·Mz (3) + Sz,pre,10 ·Mz (4) + Sz,pre,9 ·Mz (5)
+ Sz,pre,8 ·Mz (6) + Sz,pre,7 ·Mz (7) + Sz,pre,6 ·Mz (8) ,
Iz,1981 = Sz,pre,12 ·Mz (1) + Sz,pre,11 ·Mz (2) + Sz,pre,10 ·Mz (3) + Sz,pre,9 ·Mz (4)
+ Sz,pre,8 ·Mz (5) + Sz,pre,7 ·Mz (6) + Sz,pre,6 ·Mz (7) .
For the 1981 birth cohort, the latest starters, age 12, begin school in 1986, and still have to make the decision
to enter school during the pre-reform period. This changes beginning with the 1982 birth cohort; students
who are born in 1982 and enter grade one at age 12 are entering during the post-reform period. Furthermore,
there are a set of students who would have entered at earlier ages, 6 to 11, only if fees were removed, but now
have the opportunity to enter at age 12 in a fee-free environment. However, many of these students in the
delayed entry group may be taking part in other activities that makes school entry infeasible. To take this
into account delayed entrants are discounted by the following equation: 1e(a−7) . This assumes that entrance
for this set of students who would have entered at younger ages in a post-reform state becomes increasingly
29

less likely the longer the delay:
Iz,1982 =[Sz,post,12 + 1
e12−7
11∑a=6
(Spost,a − Spre,a)]Mz (0) + Sz,pre,11 ·Mz (1)
+ Sz,pre,10 ·Mz (2) + Sz,pre,9 ·Mz (3) + Sz,pre,8 ·Mz (4) + Sz,pre,7 ·Mz (5) + Sz,pre,6 ·Mz (6) .
In the 1983 cohort, similar to the 1982 cohort, 11 and 12 year old grade one entrants enter school in the post-
reform period. Ages 6 through 10 still must make the decision in the pre-reform period, leaving a large stock
of potential future entrants. The fraction of remaining entrants is again defined by the (Sz,post,a − Sz,pre,a)
difference; the students who would have entered at each age had they been entering in the post-reform
period, but had to make the decision pre-reform. However, again the size of this group is discounted to take
into account potential productive activity that precludes their ability to enter school at a later time. This
pattern is continued through the later cohorts, as well;
Iz,1983 =[ 12∑
a=11Sz,post,a + 1
e11−7
10∑a=6
(Sz,post,a − Sz,pre,a)]Mz (0)
+ Sz,pre,10 ·Mz (1) + Sz,pre,9 ·Mz (2) + Sz,pre,8 ·Mz (3) + Sz,pre,7 ·Mz (4) + Sz,pre,6 ·Mz (5) ,
Iz,1984 =[ 12∑
a=10Sz,post,a + 1
e10−7
9∑a=6
(Sz,post,a − Sz,pre,a)]Mz (0)
+ Sz,pre,9 ·Mz (1) + Sz,pre,8 ·Mz (2) + Sz,pre,7 ·Mz (3) + Sz,pre,6 ·Mz (4) ,
Iz,1985 =[ 12∑
a=9Sz,post,a + 1
e9−7
8∑a=6
(Sz,post,a − Sz,pre,a)]Mz (0)
+ Sz,pre,8 ·Mz (1) + Sz,pre,7 ·Mz (2) + Sz,pre,6 ·Mz (3) ,
Iz,1986 =[ 12∑
a=8Sz,post,a + 1
e8−7
7∑a=6
(Sz,post,a − Sz,pre,a)]Mz (0) + Sz,pre,7 ·Mz (1) + Sz,pre,6 ·Mz (2) ,
Iz,1987 =[ 12∑
a=7Sz,post,a + 1
e7−7 (Sz,post,6 − Sz,pre,6)]Mz (0) + Sz,pre,6 ·Mz (1) ,
Iz,1988 =[ 12∑
a=6Sz,post,a
]Mz (0) = Mz (0) .
For the 1989 birth cohort, all individuals, even the early starters, enter school completely in the post-reform
period.
30

A.2 Appendix - Tables
Table A1: Effect of Education Reform on Years of Schooling:Sex Specific Alternative Specifications
Years of Schooling
A. Women B. MenCensus DHS LSMS Census DHS LSMS(1) (2) (3) (4) (5) (6)
i. Birth Years: 1969 to 1992 i. Birth Years: 1969 to 1992Izy 1.610*** 2.177*** 1.004* 1.247*** 1.630*** 2.057***
(0.343) (0.263) (0.507) (0.371) (0.222) (0.274)
F-Stat 22.09 68.76 3.93 11.30 53.92 56.35N 255,697 15,569 3,326 236,537 10,401 2,665
ii. Addis Ababa: 1995 Implementation ii. Addis Ababa: 1995 ImplementationIzy 1.300*** 2.075*** 0.857 0.942** 1.731*** 2.033***
(0.452) (0.408) (0.730) (0.535) (0.369) (0.413)
F-Stat 8.29 25.84 1.38 4.59 21.99 24.22N 199,179 12,598 2,551 177,808 8,107 2,020
iii. Staggered Implementation iii. Staggered ImplementationIzy 1.389*** 2.026*** 0.982* 0.975** 1.578*** 1.696***
(0.279) (0.212) (0.497) (0.397) (0.255) (0.338)
F-Stat 24.86 91.28 3.91 6.03 38.15 25.17N 199,179 12,598 2,551 177,808 8,107 2,020
Note: *** p<0.01, ** p<0.05, * p<0.1. The dependent variable is years of schooling. The estimated intensitymeasure, Izy , is calculated with the relevant sex specific data for Panel A (female) and Panel B (male). Allregressions include birth year and zone fixed effects. DHS estimates, which use data from the 2005 and 2011surveys, also include a cubic control for age. Census (2007) and LSMS (2014) estimates include only a singlesurvey round; age is therefore jointly determined by birth year and survey year. Samples in Panel ii and Paneliii include birth cohorts from 1972 to 1989; the sample in Panel i expands the sample to cohorts from 1969 to1972. Panel ii fully calculates Izy for the Addis Ababa region, and Panel iii calculates Izy assuming a gradualimplementation as explained in section 3.2. Each estimate is from a unique regression, weighted using weightsprovided by the survey, and standard errors are clustered at the zone level.
31

Table A2: Effect of Education Reform on Years of Schooling:All DHS Observations
Years of Schooling (DHS)Full Women Men(1) (2) (3)
Izy 1.500*** 1.602*** 1.228***(0.276) (0.262) (0.316)
F-Stat 29.43 37.36 15.14N 27,425 17,588 9,837
Note: *** p<0.01, ** p<0.05, * p<0.1. The dependentvariable is years of schooling. The sample includes birthcohorts from 1972 to 1989; in column (2) and column (3)the estimated intensity measure, Izy , is calculated usingthe relevant sex specific data. All regressions include birthyear and zone fixed effects, and a cubic control for age. Anindicator equal to one for all male observations is includedin the column (1) regression. All DHS observations thatreport not knowing their exact year of birth are added tothe original sample. Izy is set to zero for Addis Ababa, asexplained in section 3.2. Each estimate is from a uniqueregression, weighted using weights provided by the survey,and standard errors are clustered at the zone level.
Table A3: Effect of Education Reform on Years of Schooling:Migration Adjustments with 1995 Implementation in Addis Ababa
Years of Schooling (LSMS Only)Migration
Birth Region Only Non- AdjustedFE Movers Intensity(1) (2) (3)
Izy 1.358*** 1.203** 1.348**(0.446) (0.573) (0.514)
F-Stat 9.26 4.41 6.87N 4,568 3,959 4,568
Note: *** p<0.01, ** p<0.05, * p<0.1. The dependent variable isyears of schooling. The sample includes birth cohorts from 1972 to1989. All regressions include birth year and zone fixed effects, anindicator equal to one for observations that are male; column (1)also includes region of birth fixed effects. Column (2) only includesrespondents living in their region of birth, and column (3) usinga migration adjusted intensity. The estimated intensity measure,Izy , is fully calculated for Addis Ababa using a 1995 implemen-tation. Each estimate is from a unique regression, weighted usingweights provided by the survey, and standard errors are clusteredat the zone level.
32

TableA4:
Effectof
Educ
ationReform
onYe
arsof
Scho
oling:
SexSp
ecificPlaceb
oEs
timates
Yearsof
Scho
oling
A.F
emale
B.M
ale
Kenya
Tanzan
iaZa
mbia
Mali
Kenya
Tanz
ania
Zambia
Mali
(1)
(2)
(3)
(4)
(1)
(2)
(3)
(4)
i.1993
Implem
entatio
ni.
1993
Implem
entatio
nI z
y0.198
-0.031
-0.271**
-0.885***
0.195
0.394
0.103
-0.662***
p=0.310
(0.273)
(0.121)
(0.062)
p=0.779
(1.355)
(0.230)
(0.202)
N21,513
11,757
165,567
135,896
7,897
1,046
150,279
114,610
ii.1995
Implem
entatio
nii.
1995
Implem
entatio
nI z
y0.153
-0.096
-0.084
-0.917***
0.158
0.681
0.288
-0.687***
p=0.517
(0.319)
(0.170)
(0.065)
p=0.785
(1.460)
(0.280)
(0.216)
N21,513
11,757
165,567
135,896
7,897
1,046
150,279
114,610
Note:
***p<
0.01
,**
p<0.05
,*p<
0.1.
The
depe
ndentvariab
leis
yearsof
scho
oling.
The
sampleinclud
esbirthcoho
rtsfrom
1972
to19
89;the
estimated
intensity
measure,I
zy,iscalculated
withtherelevant
sexspecificda
taforPan
elA
(fem
ale)
andPan
elB
(male).All
regression
sinclud
ebirthyear
andzone
fixed
effects.Kenya
data
arefrom
2008/9
and2014
roun
dsan
dTa
nzan
iada
taarefrom
2007,
2008
,an
d20
10roun
dsof
DHS;
estimates
also
includ
eacubiccontrolforage.
Zambiaan
dMalida
taarefrom
2010
and2009
census
roun
ds,respe
ctively.
I zyissetto
zero
formajor
urba
ncentersin
each
coun
try(N
airobi,D
ares
Salaam
,Lusak
a,Bam
ako).Eachestimate
isfrom
aun
ique
regression
,weigh
tedusingweigh
tsprov
ided
bythesurvey,an
dstan
dard
errors
areclusteredat
thezone
level.
Kenya
includ
esfewer
than
50zones,
wild
-boo
tstrap
p-valueis
substitutedforstan
dard
error(C
ameron
etal.,2008).
33

Table A5: Effect of Education Reform on Years of Schooling:Placebo Estimates with Population Center Variation
Years of SchoolingKenya Tanzania Zambia Mali(1) (2) (3) (4)
A. 1993 ImplementationIzy 0.314* -1.117*** -0.026 -1.371***
p=0.070 (0.391) (0.211) (0.264)
N 29,410 12,803 315,846 250,506
B. 1995 ImplementationIzy 0.264 -1.334*** 0.292 -1.423***
p=0.228 (0.411) (0.188) (0.315)
N 29,410 12,803 315,846 250,506Note: *** p<0.01, ** p<0.05, * p<0.1. The dependent variable isyears of schooling. The sample includes birth cohorts from 1972 to1989. All regressions include birth year and zone fixed effects. Kenyadata are from 2008/9 and 2014 rounds and Tanzania data are from2007, 2008, and 2010 rounds of DHS; estimates also include a cubiccontrol for age. Zambia and Mali data are from 2010 and 2009 censusrounds, respectively. The estimated intensity of the reform, Izy , is fullycalculated for all districts. Each estimate is from a unique regression,weighted using weights provided by the survey, and standard errors areclustered at the zone level. Kenya includes fewer than 50 zones, wild-bootstrap p-value is substituted for standard error (Cameron et al.,2008).
34

TableA6:
Tim
ingof
Post-R
eform
Year
andGrade
Level:1995
Implem
entatio
nB
irth
Ref
orm
Bir
thR
efor
mB
irth
Ref
orm
Bir
thR
efor
mB
irth
Ref
orm
Bir
thR
efor
mY
ear
Gra
deA
geSt
atus
Yea
rG
rade
Age
Stat
usY
ear
Gra
deA
geSt
atus
Yea
rG
rade
Age
Stat
usY
ear
Gra
deA
geSt
atus
Yea
rG
rade
Age
Stat
us1977
Born
1978
Born
1979
Born
1980
Born
1981
Born
1982
Born
1978
01979
01980
01981
01982
01983
01979
11980
11981
11982
11983
11984
11980
21981
21982
21983
21984
21985
21981
31982
31983
31984
31985
31986
31982
41983
41984
41985
41986
41987
41983
51984
51985
51986
51987
51988
51984
61985
61986
61987
61988
61989
61985
G1
71986
G1
71987
G1
71988
G1
71989
G1
71990
G1
71986
G2
81987
G2
81988
G2
81989
G2
81990
G2
81991
G2
81987
G3
91988
G3
91989
G3
91990
G3
91991
G3
91992
G3
91988
G4
101989
G4
101990
G4
101991
G4
101992
G4
101993
G4
101989
G5
111990
G5
111991
G5
111992
G5
111993
G5
111994
G5
111990
G6
121991
G6
121992
G6
121993
G6
121994
G6
121995
G6
12Po
st1991
G7
131992
G7
131993
G7
131994
G7
131995
G7
13Po
st1996
G7
13Po
st1992
G8
141993
G8
141994
G8
141995
G8
14Po
st1996
G8
14Po
st1997
G8
14Po
st1993
G9
151994
G9
151995
G9
15Po
st1996
G9
15Po
st1997
G9
15Po
st1998
G9
15Po
st1994
G10
161995
G10
16Po
st1996
G10
16Po
st1997
G10
16Po
st1998
G10
16Po
st1999
G10
16Po
st
Bir
thR
efor
mB
irth
Ref
orm
Bir
thR
efor
mB
irth
Ref
orm
Bir
thR
efor
mB
irth
Ref
orm
Yea
rG
rade
Age
Stat
usY
ear
Gra
deA
geSt
atus
Yea
rG
rade
Age
Stat
usY
ear
Gra
deA
geSt
atus
Yea
rG
rade
Age
Stat
usY
ear
Gra
deA
geSt
atus
1983
Born
1984
Born
1985
Born
1986
Born
1987
Born
1988
Born
1984
01985
01986
01987
01988
01989
01985
11986
11987
11988
11989
11990
11986
21987
21988
21989
21990
21991
21987
31988
31989
31990
31991
31992
31988
41989
41990
41991
41992
41993
41989
51990
51991
51992
51993
51994
51990
61991
61992
61993
61994
61995
61991
G1
71992
G1
71993
G1
71994
G1
71995
G1
7Po
st1996
G1
7Po
st1992
G2
81993
G2
81994
G2
81995
G2
8Po
st1996
G2
8Po
st1997
G2
8Po
st1993
G3
91994
G3
91995
G3
9Po
st1996
G3
9Po
st1997
G3
9Po
st1998
G3
9Po
st1994
G4
101995
G4
10Po
st1996
G4
10Po
st1997
G4
10Po
st1998
G4
10Po
st1999
G4
10Po
st1995
G5
11Po
st1996
G5
11Po
st1997
G5
11Po
st1998
G5
11Po
st1999
G5
11Po
st2000
G5
11Po
st1996
G6
12Po
st1997
G6
12Po
st1998
G6
12Po
st1999
G6
12Po
st2000
G6
12Po
st2001
G6
12Po
st1997
G7
13Po
st1998
G7
13Po
st1999
G7
13Po
st2000
G7
13Po
st2001
G7
13Po
st2002
G7
13Po
st1998
G8
14Po
st1999
G8
14Po
st2000
G8
14Po
st2001
G8
14Po
st2002
G8
14Po
st2003
G8
14Po
st1999
G9
15Po
st2000
G9
15Po
st2001
G9
15Po
st2002
G9
15Po
st2003
G9
15Po
st2004
G9
15Po
st2000
G10
16Po
st2001
G10
16Po
st2002
G10
16Po
st2003
G10
16Po
st2004
G10
16Po
st2005
G10
16Po
st
35