Identifying Indicators of Sustainable AND Livable …conference.ifas.ufl.edu/aces12/presentations/2...
34
Identifying Indicators of Sustainable AND Livable Communities Indicators Research Team Amy Lynch Stuart Andreason Eugenie Birch ACES Conference December 10 – 14, 2012 Ft. Lauderdale, FL
Transcript of Identifying Indicators of Sustainable AND Livable …conference.ifas.ufl.edu/aces12/presentations/2...
Identifying Indicators of Sustainable AND
Livable Communities
Indicators Research Team
Amy Lynch
Stuart Andreason
Eugenie Birch
ACES Conference
December 10 – 14, 2012
Ft. Lauderdale, FL
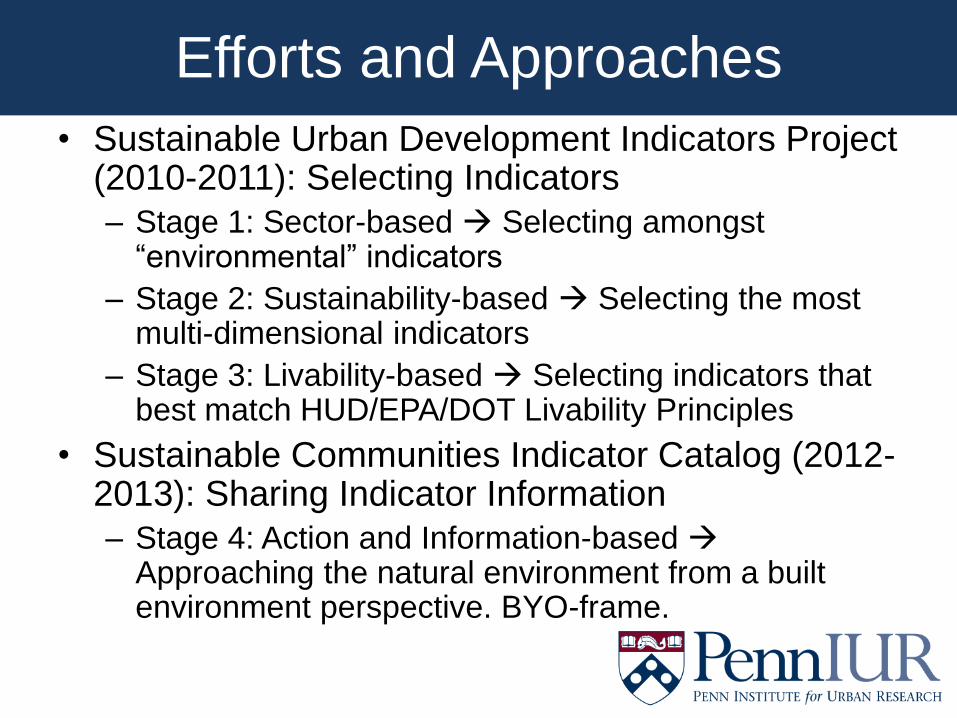
Efforts and Approaches
• Sustainable Urban Development Indicators Project (2010-2011): Selecting Indicators
– Stage 1: Sector-based Selecting amongst “environmental” indicators
– Stage 2: Sustainability-based Selecting the most multi-dimensional indicators
– Stage 3: Livability-based Selecting indicators that best match HUD/EPA/DOT Livability Principles
• Sustainable Communities Indicator Catalog (2012-2013): Sharing Indicator Information
– Stage 4: Action and Information-based Approaching the natural environment from a built environment perspective. BYO-frame.
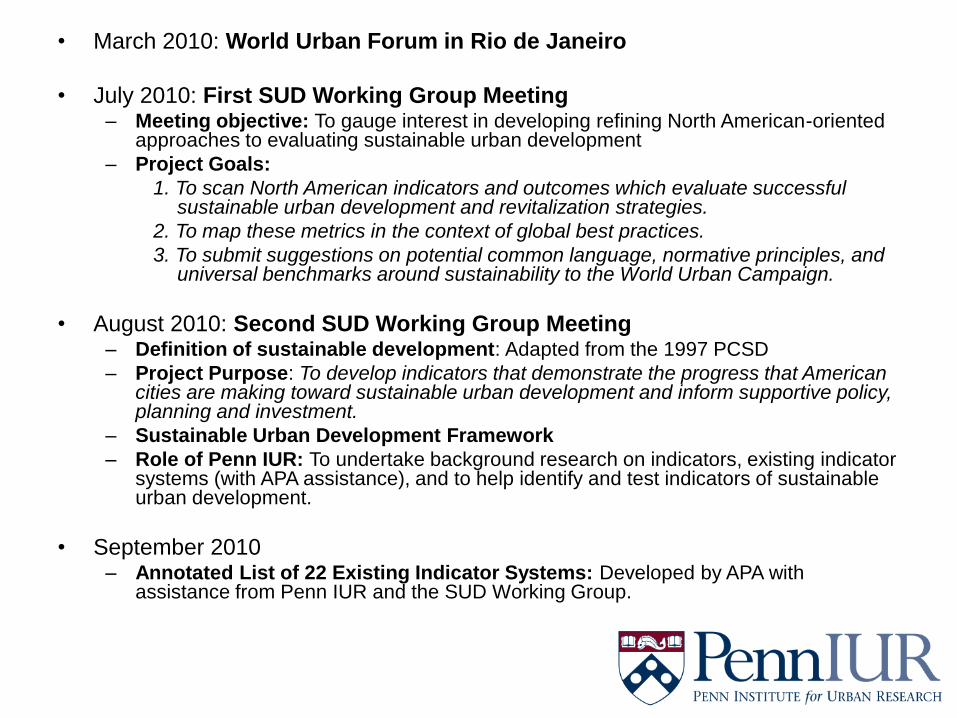
• March 2010: World Urban Forum in Rio de Janeiro
• July 2010: First SUD Working Group Meeting – Meeting objective: To gauge interest in developing refining North American-oriented
approaches to evaluating sustainable urban development
– Project Goals:
1. To scan North American indicators and outcomes which evaluate successful sustainable urban development and revitalization strategies.
2. To map these metrics in the context of global best practices.
3. To submit suggestions on potential common language, normative principles, and universal benchmarks around sustainability to the World Urban Campaign.
• August 2010: Second SUD Working Group Meeting – Definition of sustainable development: Adapted from the 1997 PCSD
– Project Purpose: To develop indicators that demonstrate the progress that American cities are making toward sustainable urban development and inform supportive policy, planning and investment.
– Sustainable Urban Development Framework
– Role of Penn IUR: To undertake background research on indicators, existing indicator systems (with APA assistance), and to help identify and test indicators of sustainable urban development.
• September 2010 – Annotated List of 22 Existing Indicator Systems: Developed by APA with
assistance from Penn IUR and the SUD Working Group.
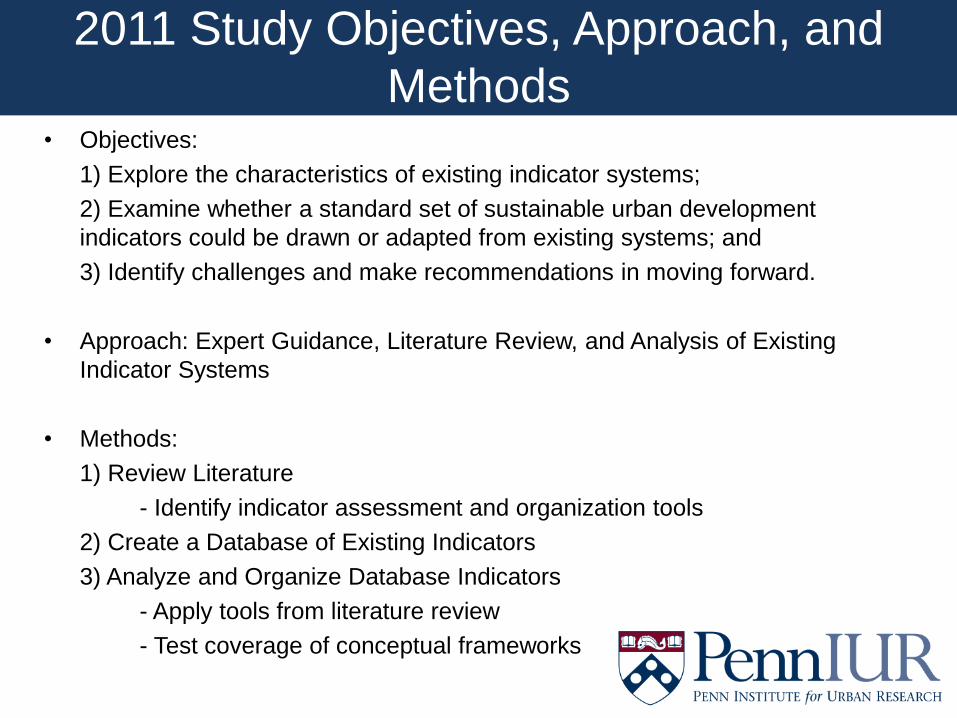
2011 Study Objectives, Approach, and
Methods • Objectives:
1) Explore the characteristics of existing indicator systems;
2) Examine whether a standard set of sustainable urban development
indicators could be drawn or adapted from existing systems; and
3) Identify challenges and make recommendations in moving forward.
• Approach: Expert Guidance, Literature Review, and Analysis of Existing
Indicator Systems
• Methods:
1) Review Literature
- Identify indicator assessment and organization tools
2) Create a Database of Existing Indicators
3) Analyze and Organize Database Indicators
- Apply tools from literature review
- Test coverage of conceptual frameworks
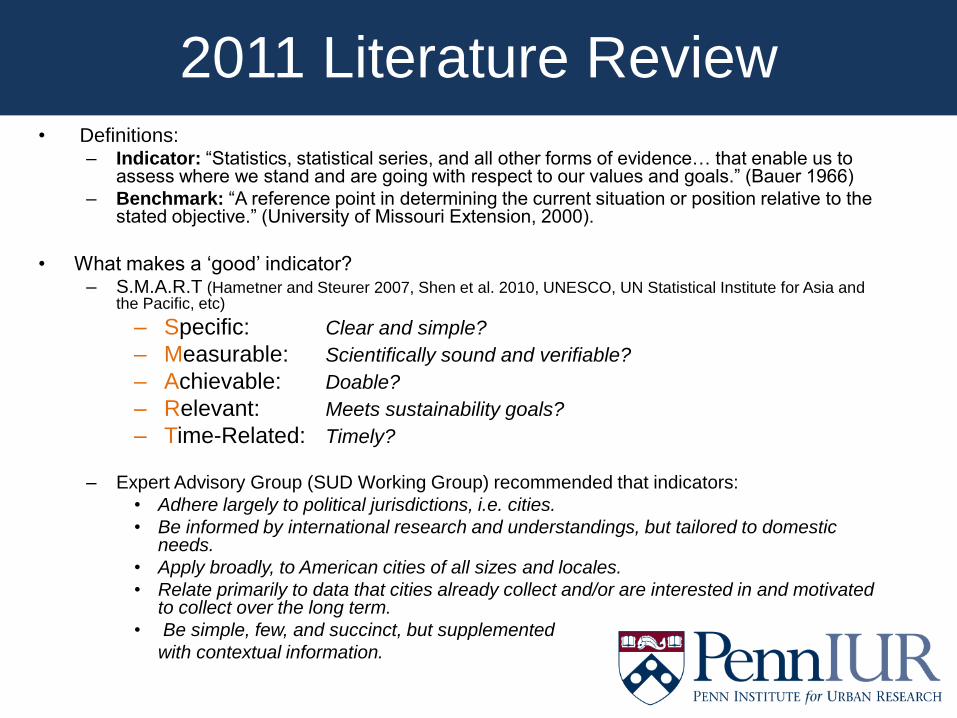
2011 Literature Review • Definitions:
– Indicator: “Statistics, statistical series, and all other forms of evidence… that enable us to assess where we stand and are going with respect to our values and goals.” (Bauer 1966)
– Benchmark: “A reference point in determining the current situation or position relative to the stated objective.” (University of Missouri Extension, 2000).
• What makes a ‘good’ indicator? – S.M.A.R.T (Hametner and Steurer 2007, Shen et al. 2010, UNESCO, UN Statistical Institute for Asia and
the Pacific, etc)
– Specific: Clear and simple?
– Measurable: Scientifically sound and verifiable?
– Achievable: Doable?
– Relevant: Meets sustainability goals?
– Time-Related: Timely?
– Expert Advisory Group (SUD Working Group) recommended that indicators:
• Adhere largely to political jurisdictions, i.e. cities.
• Be informed by international research and understandings, but tailored to domestic needs.
• Apply broadly, to American cities of all sizes and locales.
• Relate primarily to data that cities already collect and/or are interested in and motivated to collect over the long term.
• Be simple, few, and succinct, but supplemented
with contextual information.
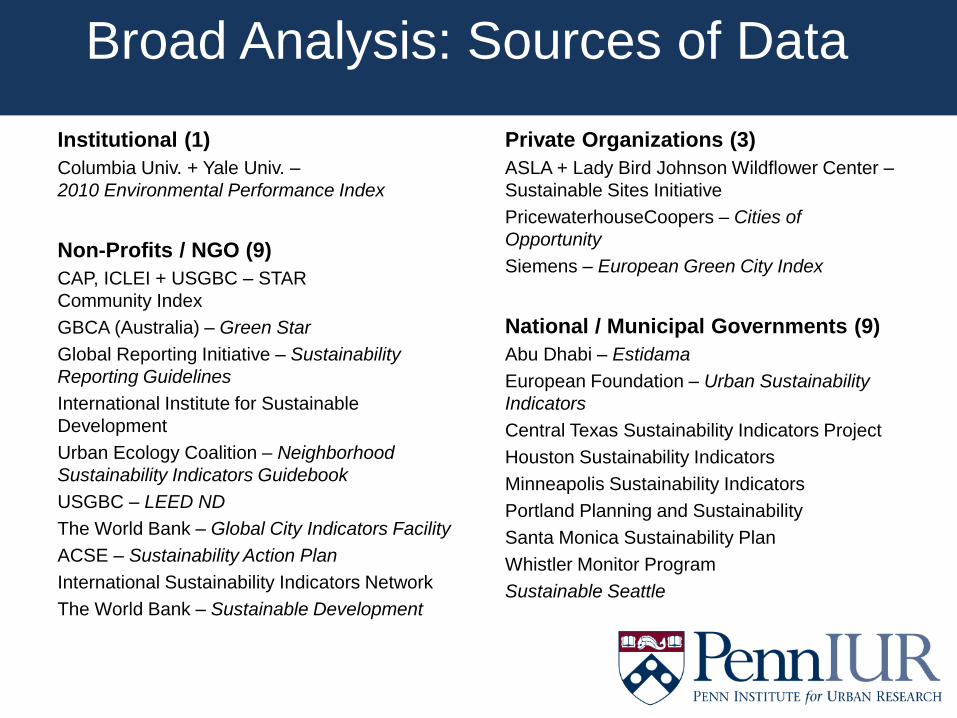
Broad Analysis: Sources of Data
Institutional (1)
Columbia Univ. + Yale Univ. –
2010 Environmental Performance Index
Non-Profits / NGO (9)
CAP, ICLEI + USGBC – STAR
Community Index
GBCA (Australia) – Green Star
Global Reporting Initiative – Sustainability
Reporting Guidelines
International Institute for Sustainable
Development
Urban Ecology Coalition – Neighborhood
Sustainability Indicators Guidebook
USGBC – LEED ND
The World Bank – Global City Indicators Facility
ACSE – Sustainability Action Plan
International Sustainability Indicators Network
The World Bank – Sustainable Development
Private Organizations (3)
ASLA + Lady Bird Johnson Wildflower Center –
Sustainable Sites Initiative
PricewaterhouseCoopers – Cities of
Opportunity
Siemens – European Green City Index
National / Municipal Governments (9)
Abu Dhabi – Estidama
European Foundation – Urban Sustainability
Indicators
Central Texas Sustainability Indicators Project
Houston Sustainability Indicators
Minneapolis Sustainability Indicators
Portland Planning and Sustainability
Santa Monica Sustainability Plan
Whistler Monitor Program
Sustainable Seattle
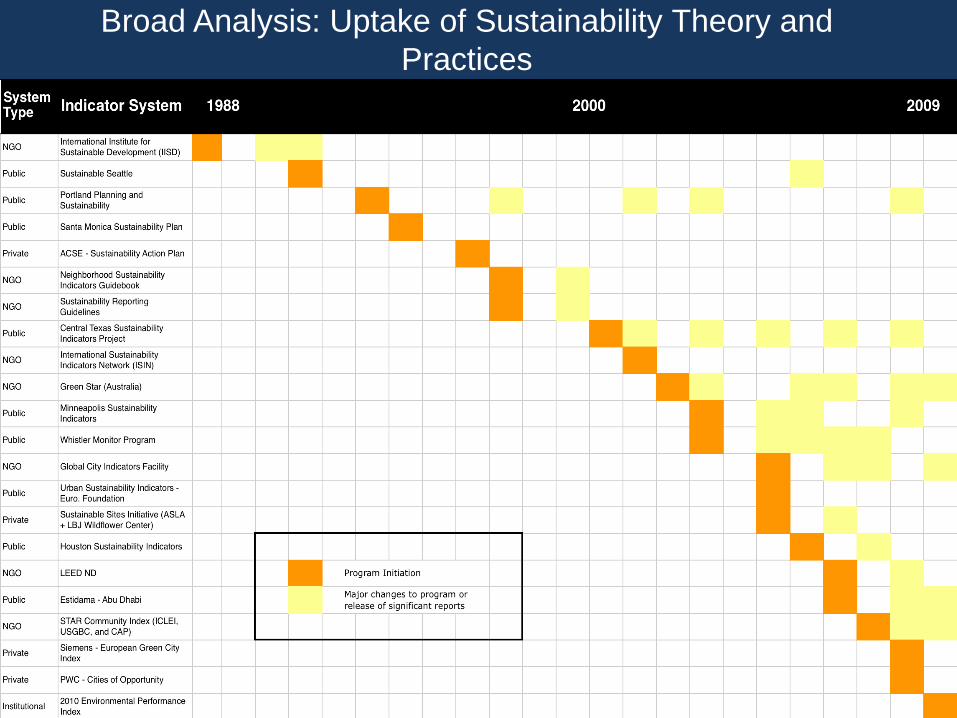
Broad Analysis: Uptake of Sustainability Theory and
Practices
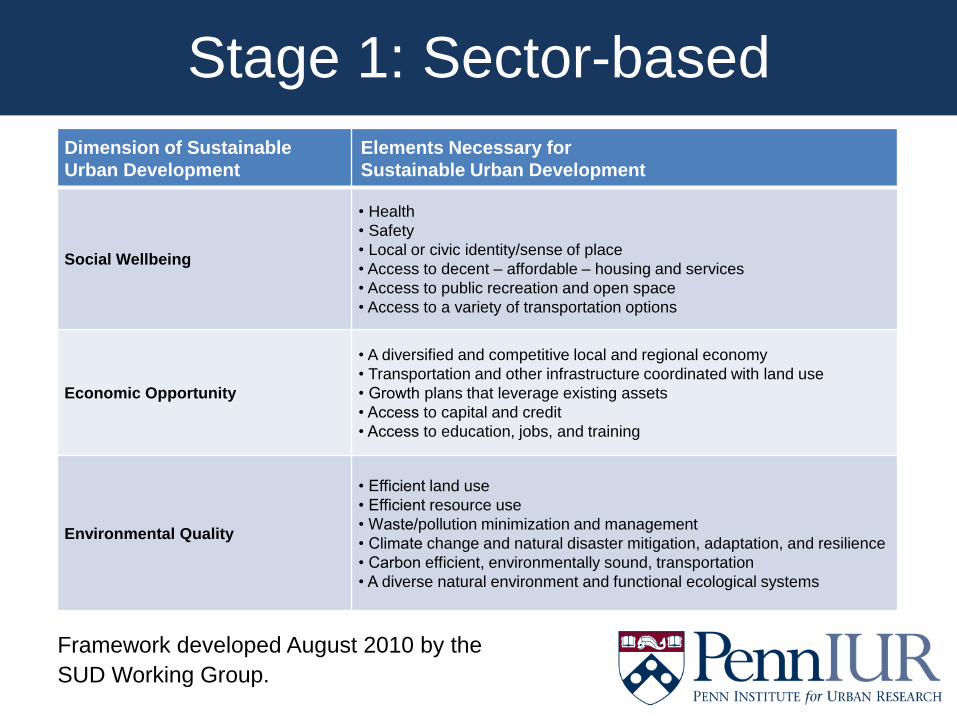
Stage 1: Sector-based
Dimension of Sustainable
Urban Development
Elements Necessary for
Sustainable Urban Development
Social Wellbeing
• Health
• Safety
• Local or civic identity/sense of place
• Access to decent – affordable – housing and services
• Access to public recreation and open space
• Access to a variety of transportation options
Economic Opportunity
• A diversified and competitive local and regional economy
• Transportation and other infrastructure coordinated with land use
• Growth plans that leverage existing assets
• Access to capital and credit
• Access to education, jobs, and training
Environmental Quality
• Efficient land use
• Efficient resource use
• Waste/pollution minimization and management
• Climate change and natural disaster mitigation, adaptation, and resilience
• Carbon efficient, environmentally sound, transportation
• A diverse natural environment and functional ecological systems
Framework developed August 2010 by the
SUD Working Group.
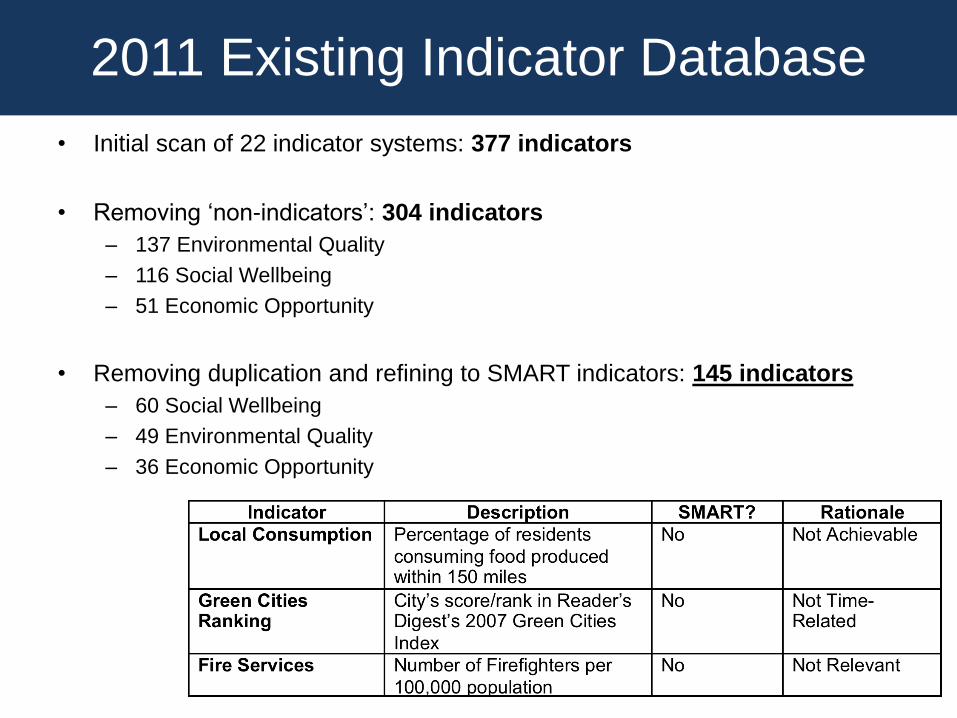
2011 Existing Indicator Database
• Initial scan of 22 indicator systems: 377 indicators
• Removing ‘non-indicators’: 304 indicators
– 137 Environmental Quality
– 116 Social Wellbeing
– 51 Economic Opportunity
• Removing duplication and refining to SMART indicators: 145 indicators
– 60 Social Wellbeing
– 49 Environmental Quality
– 36 Economic Opportunity
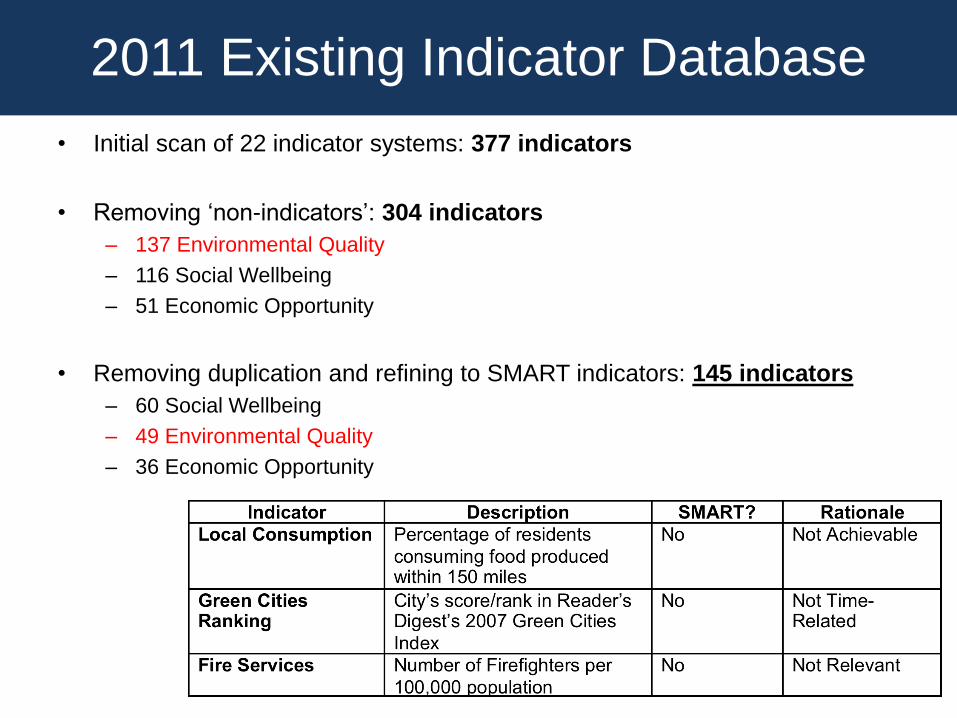
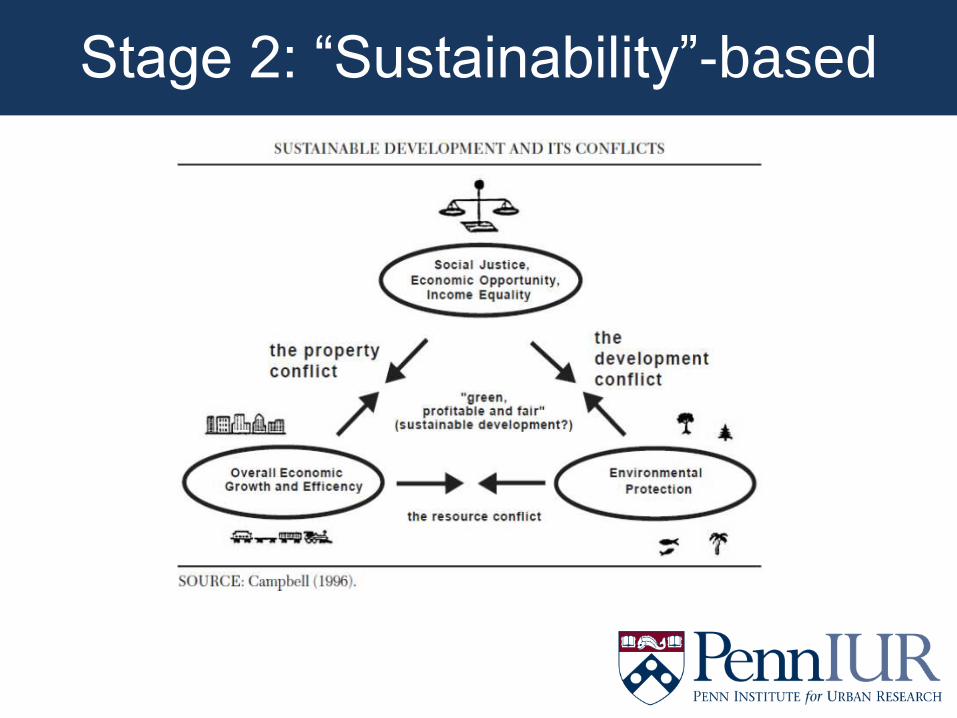
Stage 2: “Sustainability”-based
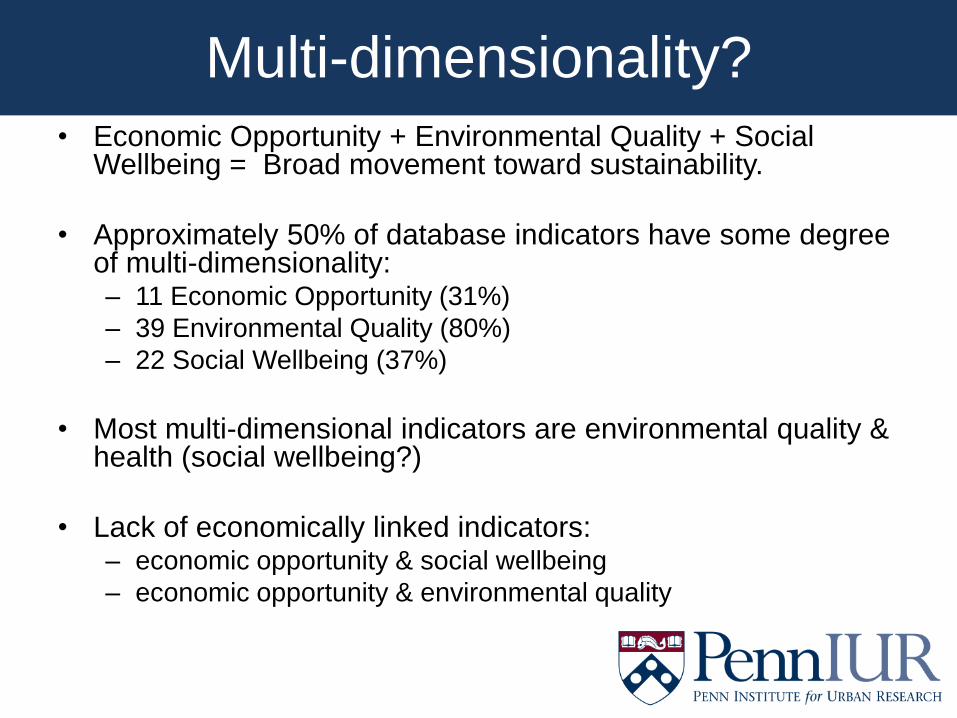
Multi-dimensionality? • Economic Opportunity + Environmental Quality + Social
Wellbeing = Broad movement toward sustainability.
• Approximately 50% of database indicators have some degree of multi-dimensionality: – 11 Economic Opportunity (31%)
– 39 Environmental Quality (80%)
– 22 Social Wellbeing (37%)
• Most multi-dimensional indicators are environmental quality & health (social wellbeing?)
• Lack of economically linked indicators: – economic opportunity & social wellbeing
– economic opportunity & environmental quality
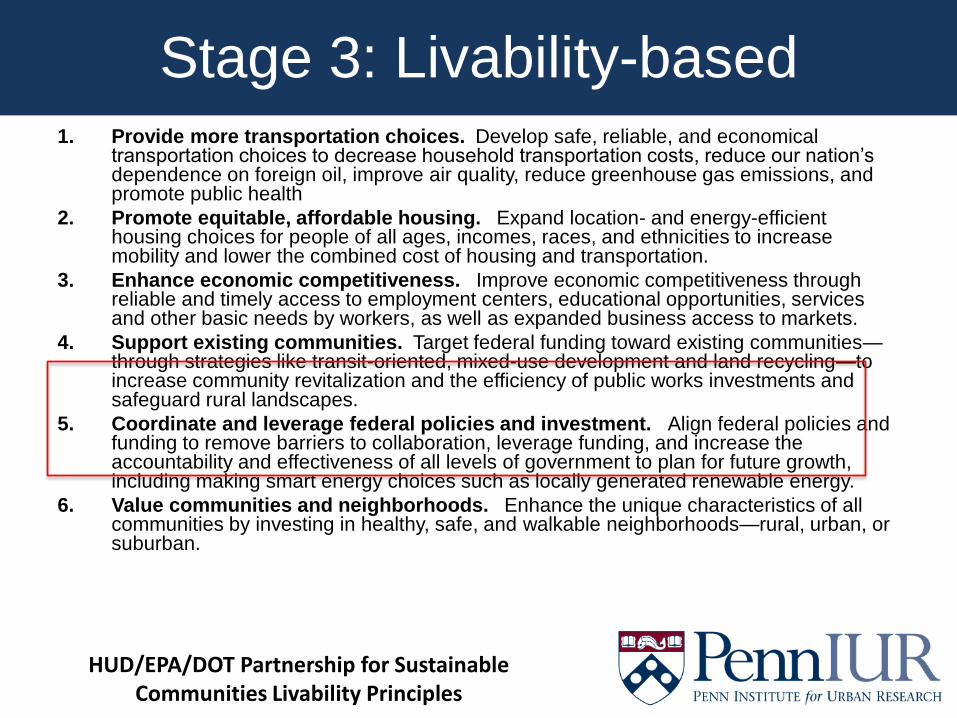
Stage 3: Livability-based 1. Provide more transportation choices.Develop safe, reliable, and economical
transportation choices to decrease household transportation costs, reduce our nation’s dependence on foreign oil, improve air quality, reduce greenhouse gas emissions, and promote public health
2. Promote equitable, affordable housing. Expand location- and energy-efficient housing choices for people of all ages, incomes, races, and ethnicities to increase mobility and lower the combined cost of housing and transportation.
3. Enhance economic competitiveness. Improve economic competitiveness through reliable and timely access to employment centers, educational opportunities, services and other basic needs by workers, as well as expanded business access to markets.
4. Support existing communities.Target federal funding toward existing communities—through strategies like transit-oriented, mixed-use development and land recycling—to increase community revitalization and the efficiency of public works investments and safeguard rural landscapes.
5. Coordinate and leverage federal policies and investment. Align federal policies and funding to remove barriers to collaboration, leverage funding, and increase the accountability and effectiveness of all levels of government to plan for future growth, including making smart energy choices such as locally generated renewable energy.
6. Value communities and neighborhoods. Enhance the unique characteristics of all communities by investing in healthy, safe, and walkable neighborhoods—rural, urban, or suburban.
HUD/EPA/DOT Partnership for Sustainable Communities Livability Principles
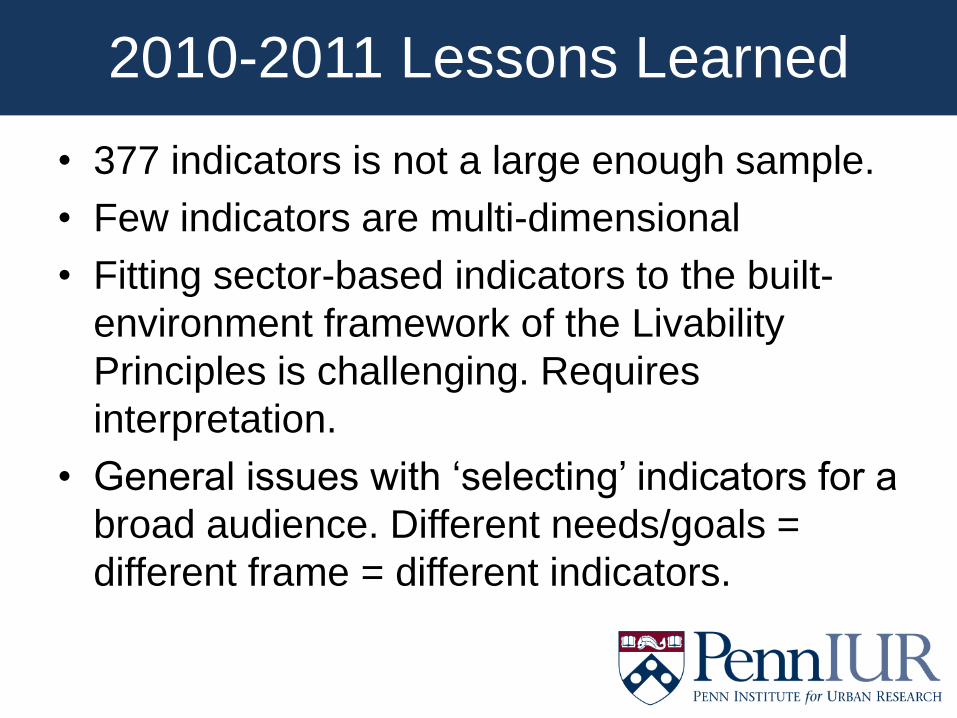
2010-2011 Lessons Learned
• 377 indicators is not a large enough sample.
• Few indicators are multi-dimensional
• Fitting sector-based indicators to the built-
environment framework of the Livability
Principles is challenging. Requires
interpretation.
• General issues with ‘selecting’ indicators for a
broad audience. Different needs/goals =
different frame = different indicators.
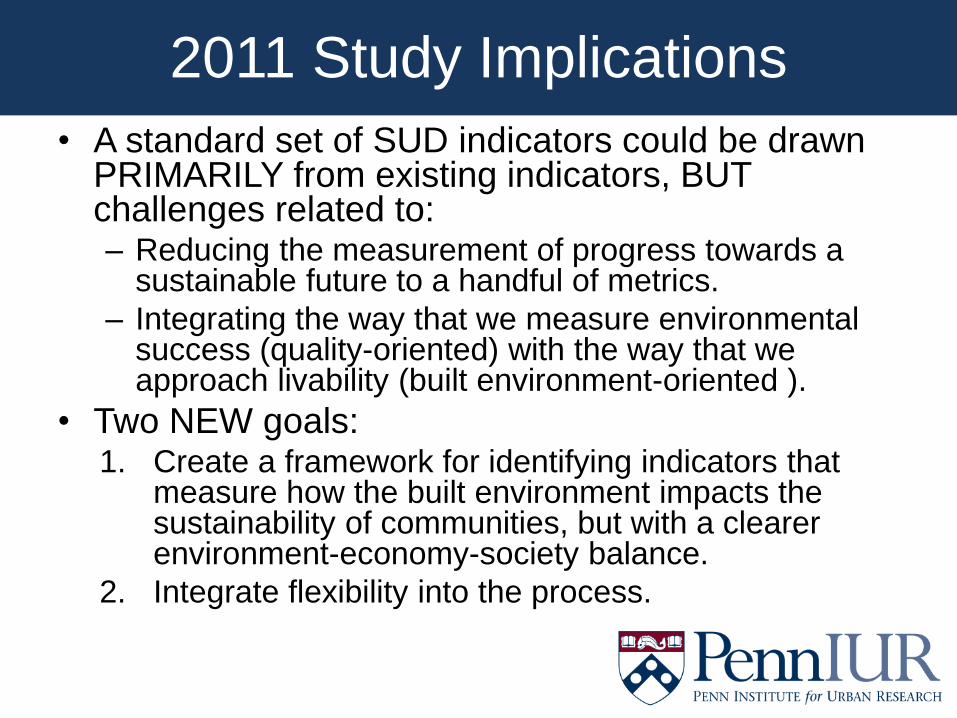
2011 Study Implications
• A standard set of SUD indicators could be drawn PRIMARILY from existing indicators, BUT challenges related to: – Reducing the measurement of progress towards a
sustainable future to a handful of metrics.
– Integrating the way that we measure environmental success (quality-oriented) with the way that we approach livability (built environment-oriented ).
• Two NEW goals: 1. Create a framework for identifying indicators that
measure how the built environment impacts the sustainability of communities, but with a clearer environment-economy-society balance.
2. Integrate flexibility into the process.
Enter the Sustainable Communities
Indicator Catalog (SCIC)
PennIUR, in partnership with the Ford Foundation
and the Partnership for Sustainable
Communities, is developing a web-based
knowledge-sharing platform where users will
be able to learn how to use indicators to
measure progress towards a sustainable urban
future.
Relationships to Other Indicator
Efforts • Communities, governments, and other
organizations across the country have developed methods and metrics to evaluate progress.
• The SCIC addresses performance measurement, with information on a variety of sustainable community indicators that are currently in-use and links to their users.
Goals of the Project
• Compile a searchable catalog of indicators that provide information on sustainable communities.
• Connect disparate efforts on indicators and performance measurement.
• Assist communities and the PSC in evaluating the value of their investments and prioritizing future investment.
• Provide a platform to introduce performance measurement and indicators to new users.
• Share information on how to implement indicators.
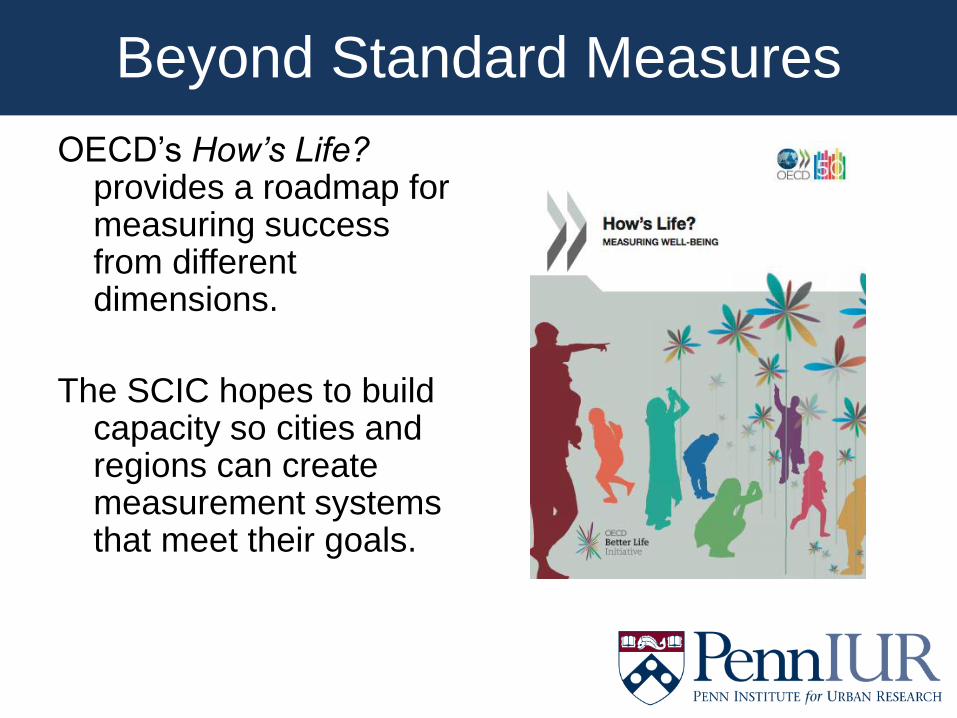
Beyond Standard Measures
OECD’s How’s Life? provides a roadmap for measuring success from different dimensions.
The SCIC hopes to build capacity so cities and regions can create measurement systems that meet their goals.
Framework
• This project approaches sustainability from a built environment perspective (housing, land use, and transportation) and emphasizes the PSC’s Livability Principles:
1. Provide more transportation choices
2. Promote equitable, affordable housing
3. Enhance economic competitiveness
4. Support existing communities
5. Coordinate and leverage federal policies and investment
6. Value communities and neighborhoods
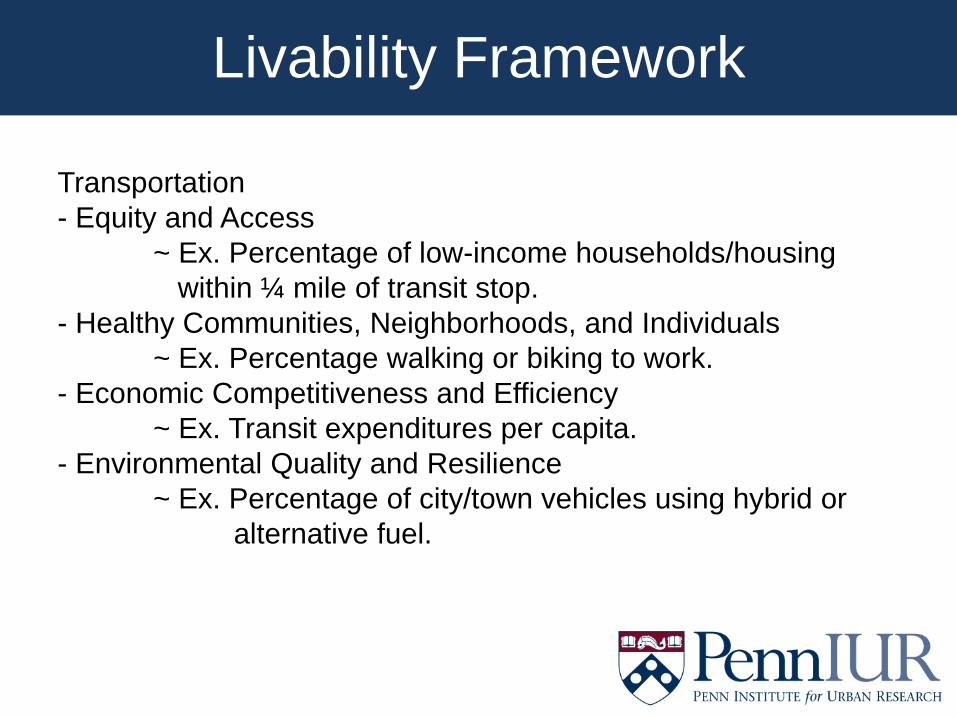
Livability Framework
Transportation
- Equity and Access
~ Ex. Percentage of low-income households/housing
within ¼ mile of transit stop.
- Healthy Communities, Neighborhoods, and Individuals
~ Ex. Percentage walking or biking to work.
- Economic Competitiveness and Efficiency
~ Ex. Transit expenditures per capita.
- Environmental Quality and Resilience
~ Ex. Percentage of city/town vehicles using hybrid or
alternative fuel.
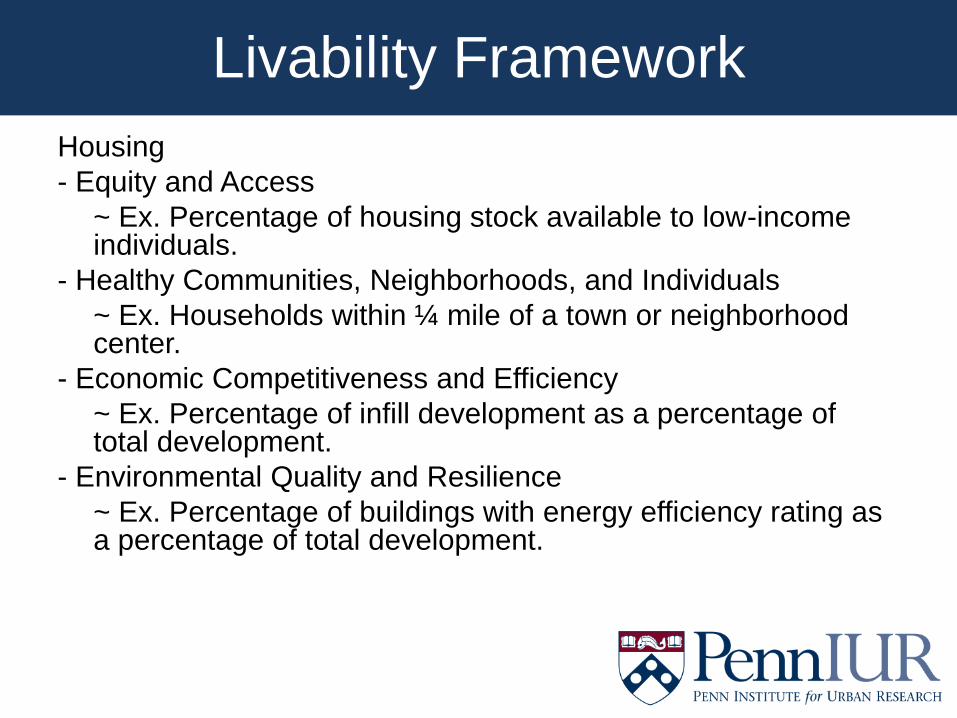
Livability Framework
Housing
- Equity and Access
~ Ex. Percentage of housing stock available to low-income individuals.
- Healthy Communities, Neighborhoods, and Individuals
~ Ex. Households within ¼ mile of a town or neighborhood center.
- Economic Competitiveness and Efficiency
~ Ex. Percentage of infill development as a percentage of total development.
- Environmental Quality and Resilience
~ Ex. Percentage of buildings with energy efficiency rating as a percentage of total development.
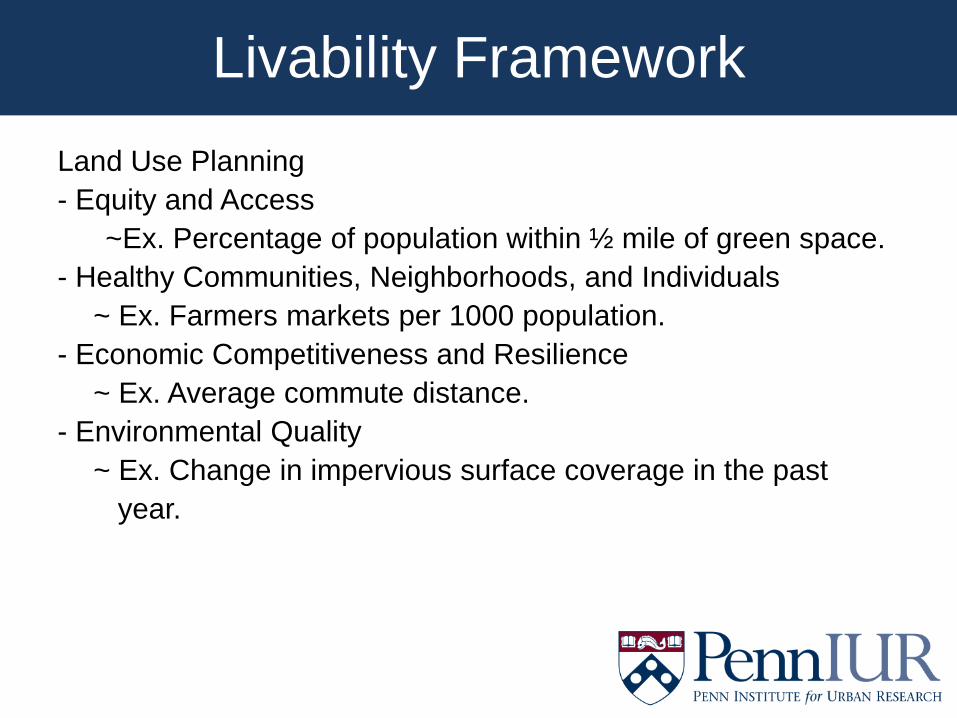
Livability Framework
Land Use Planning
- Equity and Access
~Ex. Percentage of population within ½ mile of green space.
- Healthy Communities, Neighborhoods, and Individuals
~ Ex. Farmers markets per 1000 population.
- Economic Competitiveness and Resilience
~ Ex. Average commute distance.
- Environmental Quality
~ Ex. Change in impervious surface coverage in the past
year.
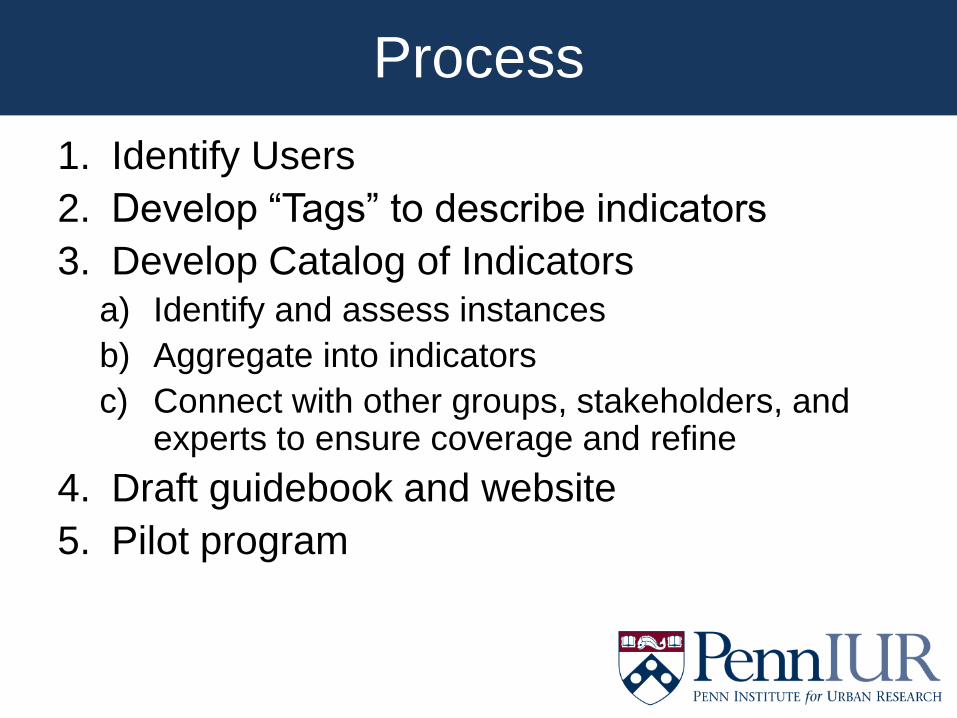
Process
1. Identify Users
2. Develop “Tags” to describe indicators
3. Develop Catalog of Indicators
a) Identify and assess instances
b) Aggregate into indicators
c) Connect with other groups, stakeholders, and experts to ensure coverage and refine
4. Draft guidebook and website
5. Pilot program
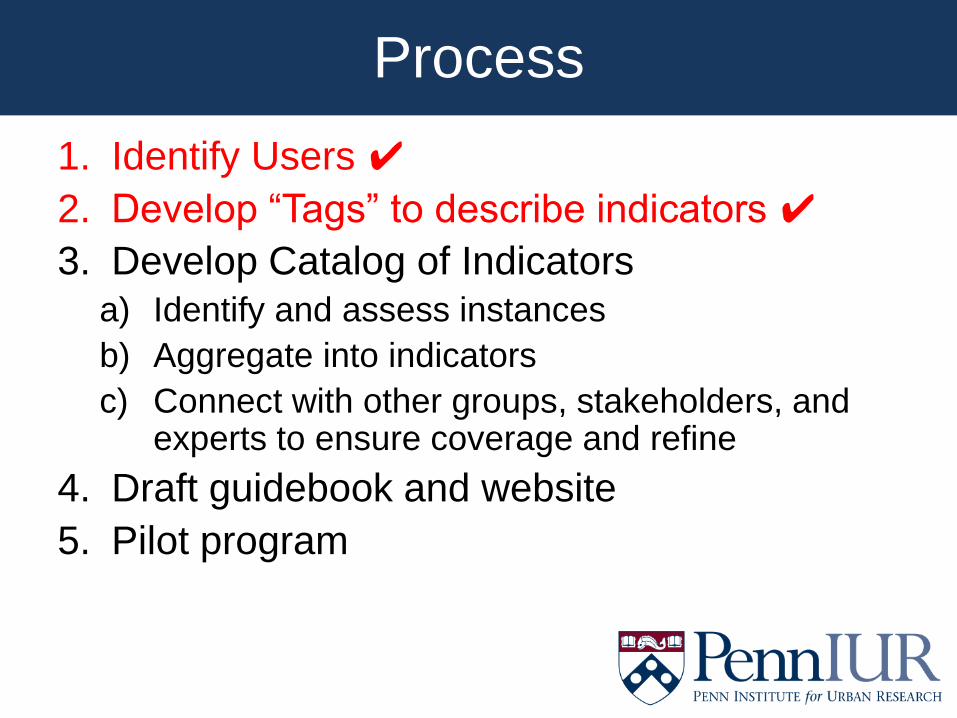
Process
1. Identify Users ✔
2. Develop “Tags” to describe indicators ✔
3. Develop Catalog of Indicators
a) Identify and assess instances
b) Aggregate into indicators
c) Connect with other groups, stakeholders, and experts to ensure coverage and refine
4. Draft guidebook and website
5. Pilot program
Identify Users
Method: Analysis of all PSC grants (2009
through 2012).
Results:
– A preponderance of grants funded land use
planning and interventions.
– Many of the potential users of the knowledge-
sharing platform are small or resource-limited
communities.
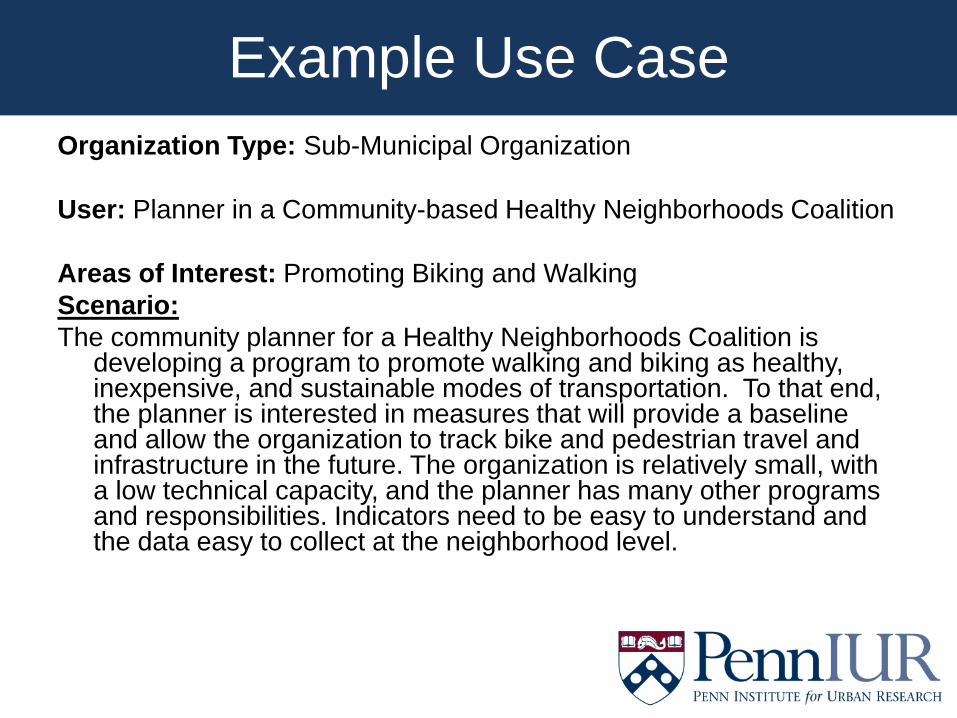
Example Use Case
Organization Type: Sub-Municipal Organization
User: Planner in a Community-based Healthy Neighborhoods Coalition
Areas of Interest: Promoting Biking and Walking
Scenario:
The community planner for a Healthy Neighborhoods Coalition is developing a program to promote walking and biking as healthy, inexpensive, and sustainable modes of transportation. To that end, the planner is interested in measures that will provide a baseline and allow the organization to track bike and pedestrian travel and infrastructure in the future. The organization is relatively small, with a low technical capacity, and the planner has many other programs and responsibilities. Indicators need to be easy to understand and the data easy to collect at the neighborhood level.
Developing “Tags”
Tags are key words/phrases that link indicators to the interests of users. They are a key part of database architecture and organization.
Method: Further analysis of the users/grantees to identify the most important characteristics and aspects of projects, followed by testing from the perspective of different types of users.
Results: Area of interest, type of project, geographic scale, and level of development are the tags that best match users and indicators
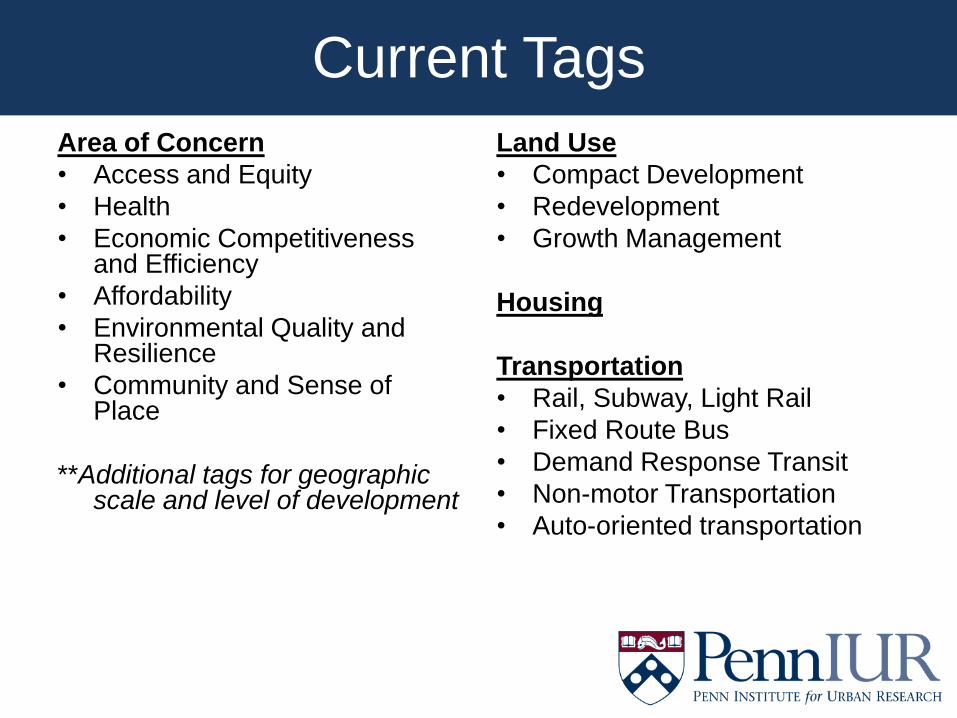
Current Tags
Area of Concern
• Access and Equity
• Health
• Economic Competitiveness and Efficiency
• Affordability
• Environmental Quality and Resilience
• Community and Sense of Place
**Additional tags for geographic scale and level of development
Land Use
• Compact Development
• Redevelopment
• Growth Management
Housing
Transportation
• Rail, Subway, Light Rail
• Fixed Route Bus
• Demand Response Transit
• Non-motor Transportation
• Auto-oriented transportation
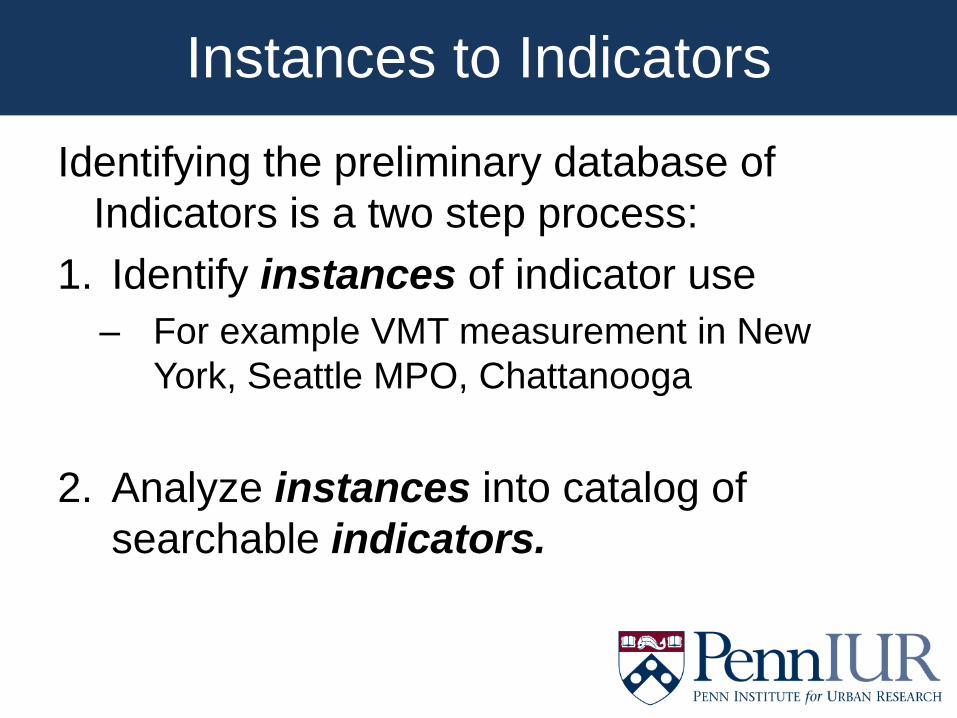
Instances to Indicators
Identifying the preliminary database of
Indicators is a two step process:
1. Identify instances of indicator use
– For example VMT measurement in New
York, Seattle MPO, Chattanooga
2. Analyze instances into catalog of
searchable indicators.
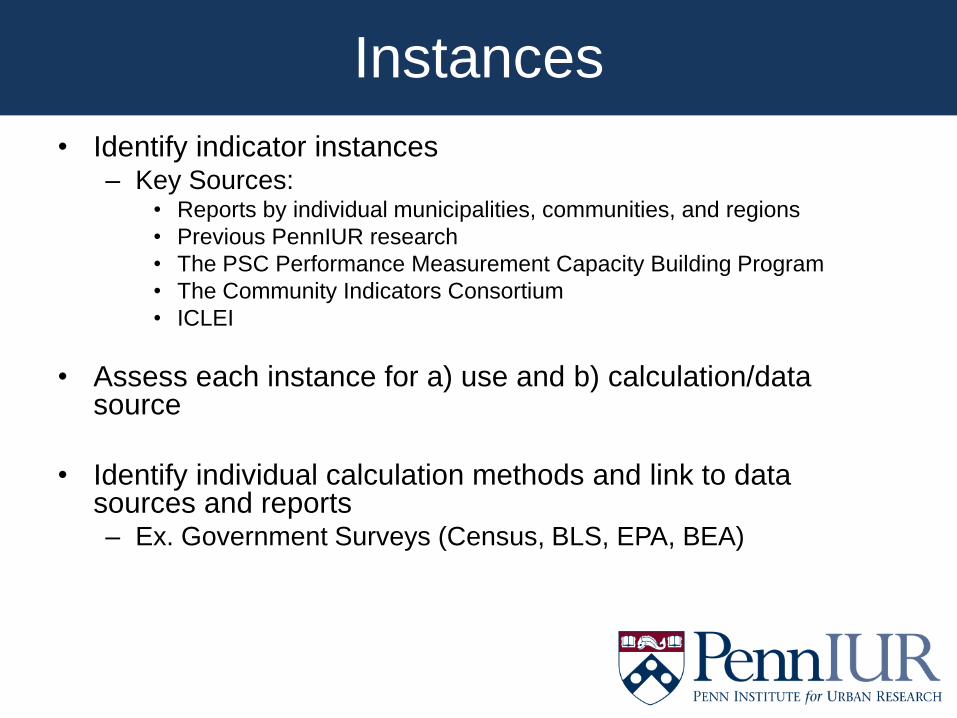
Instances
• Identify indicator instances – Key Sources:
• Reports by individual municipalities, communities, and regions
• Previous PennIUR research
• The PSC Performance Measurement Capacity Building Program
• The Community Indicators Consortium
• ICLEI
• Assess each instance for a) use and b) calculation/data source
• Identify individual calculation methods and link to data sources and reports – Ex. Government Surveys (Census, BLS, EPA, BEA)
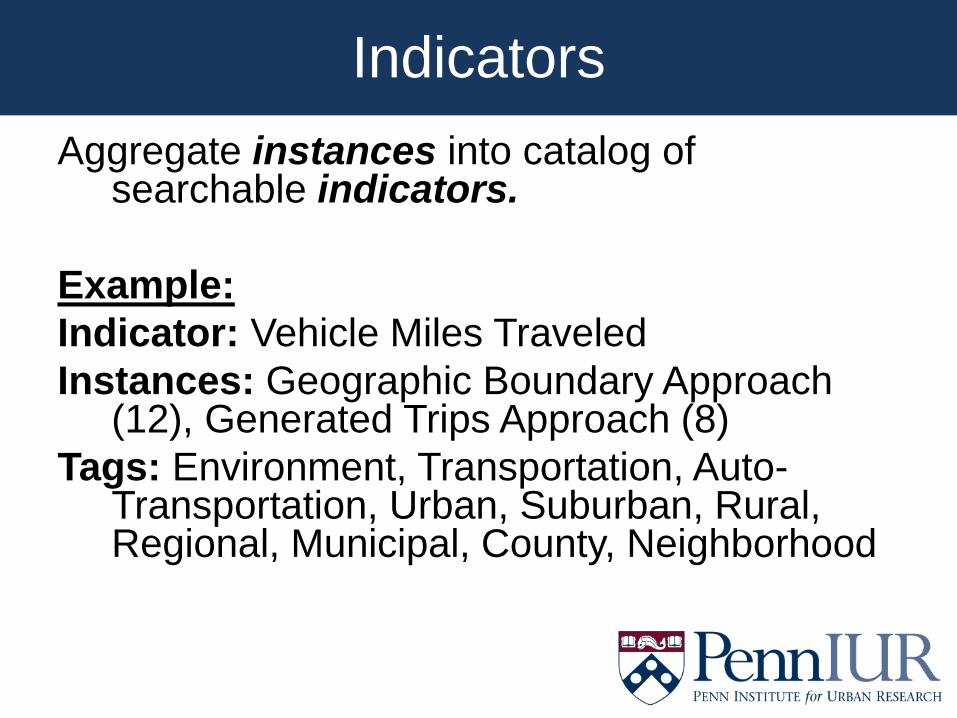
Indicators
Aggregate instances into catalog of searchable indicators.
Example:
Indicator: Vehicle Miles Traveled
Instances: Geographic Boundary Approach (12), Generated Trips Approach (8)
Tags: Environment, Transportation, Auto-Transportation, Urban, Suburban, Rural, Regional, Municipal, County, Neighborhood
Next Steps
• Stakeholder and expert meetings in early 2013.
• Draft guidebook to sustainable community indicators and performance available for review early 2013
• Piloting the SCIC begins in 2013
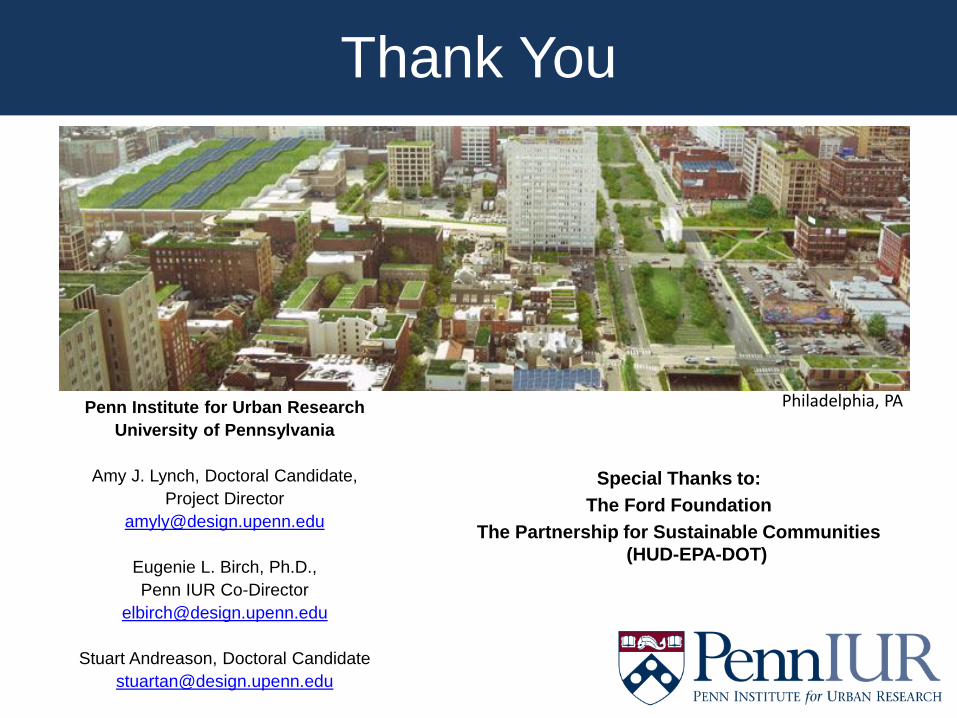
Thank You
Special Thanks to:
The Ford Foundation
The Partnership for Sustainable Communities
(HUD-EPA-DOT)
Philadelphia, PA Penn Institute for Urban Research
University of Pennsylvania
Amy J. Lynch, Doctoral Candidate,
Project Director
Eugenie L. Birch, Ph.D.,
Penn IUR Co-Director
Stuart Andreason, Doctoral Candidate