WebConnect 2 - QCNet - A Bio-Rad Laboratories Quality Control Web
Bulletin 7055 Ver A US/EG 18-0519 0718 Sig 0118
Web site bio-rad.com USA 1 800 424 6723 Australia 61 2 9914 2800 Austria 43 01 877 89019 Belgium 32 03 710 53 00 Brazil 55 11 3065 7550 Canada 1 905 364 3435 China 86 21 6169 8500 Czech Republic 36 01 459 6192 Denmark 45 04 452 10 00 Finland 35 08 980 422 00 France 33 01 479 593 00 Germany 49 089 3188 4393 Hong Kong 852 2789 3300 Hungary 36 01 459 6190 India 91 124 4029300 Israel 972 03 963 6050 Italy 39 02 49486600 Japan 81 3 6361 7000 Korea 82 2 3473 4460 Mexico 52 555 488 7670 The Netherlands 31 0 318 540 666 New Zealand 64 9 415 2280 Norway 47 0 233 841 30 Poland 36 01 459 6191 Portugal 351 21 4727717 Russia 7 495 721 14 04 Singapore 65 6415 3188 South Africa 36 01 459 6193 Spain 34 091 49 06 580 Sweden 46 08 555 127 00 Switzerland 41 0617 17 9555 Taiwan 886 2 2578 7189 Thailand 66 2 651 8311 United Arab Emirates 971 4 8187300 United Kingdom 44 01923 47 1301
Bio-Rad Laboratories, Inc.
Life ScienceGroup
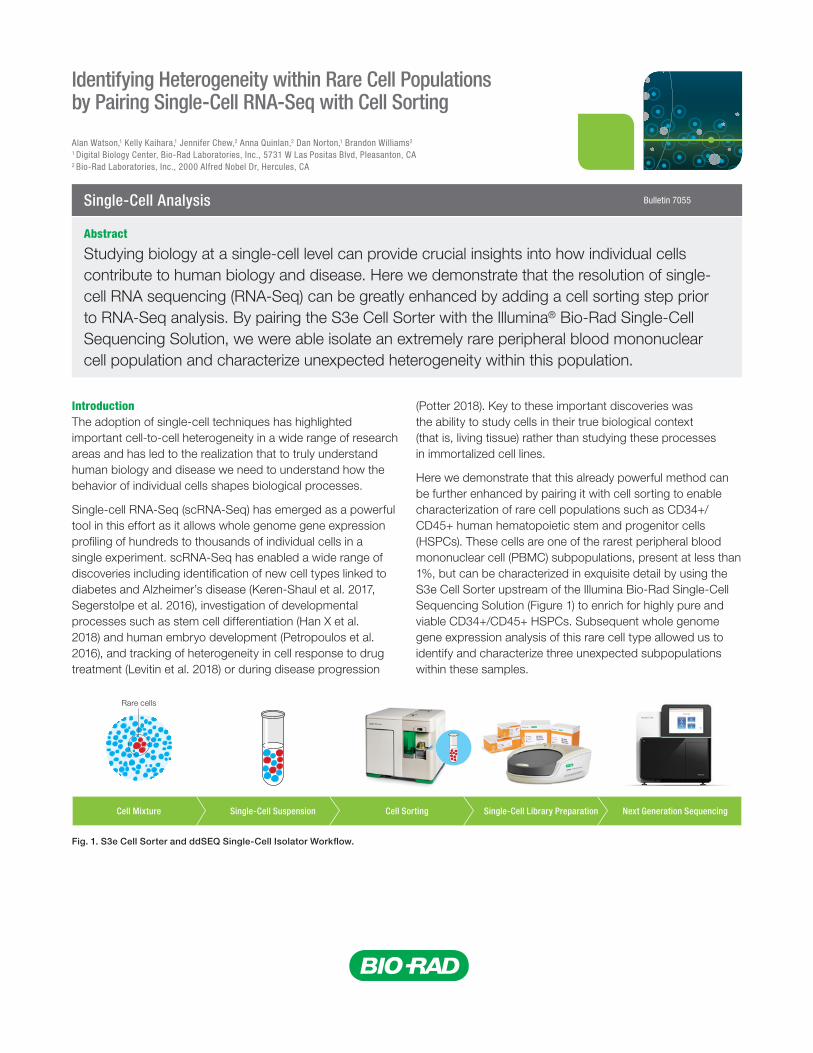
Rare cells
Cell Sorting Single-Cell Library PreparationCell Mixture Next Generation SequencingSingle-Cell Suspension
Introduction The adoption of single-cell techniques has highlighted important cell-to-cell heterogeneity in a wide range of research areas and has led to the realization that to truly understand human biology and disease we need to understand how the behavior of individual cells shapes biological processes.
Single-cell RNA-Seq (scRNA-Seq) has emerged as a powerful tool in this effort as it allows whole genome gene expression profiling of hundreds to thousands of individual cells in a single experiment. scRNA-Seq has enabled a wide range of discoveries including identification of new cell types linked to diabetes and Alzheimer’s disease (Keren-Shaul et al. 2017, Segerstolpe et al. 2016), investigation of developmental processes such as stem cell differentiation (Han X et al. 2018) and human embryo development (Petropoulos et al. 2016), and tracking of heterogeneity in cell response to drug treatment (Levitin et al. 2018) or during disease progression
(Potter 2018). Key to these important discoveries was the ability to study cells in their true biological context (that is, living tissue) rather than studying these processes in immortalized cell lines.
Here we demonstrate that this already powerful method can be further enhanced by pairing it with cell sorting to enable characterization of rare cell populations such as CD34+/CD45+ human hematopoietic stem and progenitor cells (HSPCs). These cells are one of the rarest peripheral blood mononuclear cell (PBMC) subpopulations, present at less than 1%, but can be characterized in exquisite detail by using the S3e Cell Sorter upstream of the Illumina Bio-Rad Single-Cell Sequencing Solution (Figure 1) to enrich for highly pure and viable CD34+/CD45+ HSPCs. Subsequent whole genome gene expression analysis of this rare cell type allowed us to identify and characterize three unexpected subpopulations within these samples.
Abstract
Studying biology at a single-cell level can provide crucial insights into how individual cells contribute to human biology and disease. Here we demonstrate that the resolution of single-cell RNA sequencing (RNA-Seq) can be greatly enhanced by adding a cell sorting step prior to RNA-Seq analysis. By pairing the S3e Cell Sorter with the Illumina® Bio-Rad Single-Cell Sequencing Solution, we were able isolate an extremely rare peripheral blood mononuclear cell population and characterize unexpected heterogeneity within this population.
Fig. 1. S3e Cell Sorter and ddSEQ Single-Cell Isolator Workflow.
Single-Cell Analysis Bulletin 7055
Alan Watson,1 Kelly Kaihara,1 Jennifer Chew,2 Anna Quinlan,2 Dan Norton,1 Brandon Williams2
1 Digital Biology Center, Bio-Rad Laboratories, Inc., 5731 W Las Positas Blvd, Pleasanton, CA 2 Bio-Rad Laboratories, Inc., 2000 Alfred Nobel Dr, Hercules, CA
Identifying Heterogeneity within Rare Cell Populations by Pairing Single-Cell RNA-Seq with Cell Sorting

Identifying Heterogeneity within Rare Cell Populations by Pairing Single-Cell RNA-Seq with Cell Sorting
© 2018 Bio-Rad Laboratories, Inc. 2 Bulletin 7055
Materials And MethodsCell Sorting
Fresh purified PBMCs (AllCells, catalog #PB002, 3.5 x 10⁸ cells) were stained with the following monoclonal antibody panel: FITC anti-human CD45 (BioLegend, #304006) and PE anti-human CD34 (BioLegend, #343606). Approximately 350 million cells were separated into ten samples, which were prepared to run on the S3e Cell Sorter. Cells were stored in Dulbecco’s Modified Eagles Medium (DMEM), with 30% FBS until acquired by flow cytometry. Just prior to analysis, the cells were washed in phosphate buffered saline (PBS) supplemented with 2% FBS (sort buffer). The cells were resuspended in sort buffer and passed through a 70 micron filter to remove clumps. 7-AAD (Bio-Rad Laboratories, #1351102) was used for live/dead post-sort analysis.
Flow cytometry analysis and cell sorting were performed on the S3e Cell Sorter using ProSort Software (Bio-Rad Laboratories, #1451008) for acquisition and sorting. Four plots were used to generate the specific gate for the sorted population: FSC area vs. SSC area (all cell population), FSC height vs. FSC area (doublet discrimination), CD45 FITC area vs. SSC area (PBMCs), and CD45 FITC area vs. CD34 PE area (stem cell population). FSC and SSC were collected on a linear scale, while all fluorescent channels were collected on a log scale. Using Purity Mode, the CD34+/CD45+ population of cells were targeted for the sort population. Viable cells were then sorted into DMEM with 30% FBS on the S3e Cell Sorter. The cells were sorted and kept at 4°C until required for scRNA-Seq. Each of the ten samples had a final volume of 4.5 ml at approximately 8 million cells/ml and took a total of 1 hour to sort. Post-sort analysis of the sorted cells used the same gating strategy.
Single-Cell RNA-Seq
Cell concentration of sorted CD34+/CD45+ cells was determined using the TC20 Automated Cell Counter (Bio-Rad Laboratories, #1450102) and adjusted to a final concentration of 2,500 cells/µl. Cells were then prepared for single-cell sequencing using the Illumina Bio-Rad SureCell™ WTA 3' Library Prep Kit for the ddSEQ System (Illumina, #20014280). Cells were loaded onto two ddSEQ Cartridges in eight technical replicates and processed in the ddSEQ Single-Cell Isolator (Bio-Rad Laboratories, #12004336) to isolate and barcode single cells in droplets. First-strand cDNA synthesis occurred in droplets, which were then disrupted for second-strand cDNA synthesis in bulk. Libraries were prepared according to manufacturer’s instructions and then sequenced on the NextSeq™ 500 System. Sequencing data were analyzed using the SureCell RNA Single-Cell App in the BaseSpace™ Sequence Hub. Tertiary analysis was performed using the Seurat R toolkit for single-cell genomics (satijalab.org/seurat/) developed by the Satija Lab at New York Genome Center (Butler et al. 2018).
Results and DiscussionIsolation of an Extremely Rare Cell Population
CD34+/CD45+ cells are one of the rarest PBMC subpopulations (<1% of PBMCs). These blood cell progenitors were sorted to high purity and viability from PBMCs based on cell surface expression of CD34 and CD45 by using the S3e Cell Sorter. This step allowed us to enrich for a rare cell population of interest, ensure its purity, and eliminate dead cells and debris from our downstream analysis.
Figure 2 shows representative plots that illustrate the gating strategy for isolation of CD34+/CD45+ cell populations. Briefly, we examined the entire cell population excluding debris (Figure 2A), followed by doublet exclusion (Figure 2B). Red blood cells were excluded by selecting for CD45+ cells (Figure 2C) and finally the CD34+/CD45+ population was selected (Figure 2D).Only cells that fell into this final region were selected for sorting. 7-AAD was used to verify the viability of the cells post sort. The resulting sorted cells revealed 97.8% purity (Figure 2E) and greater than 98% viability (Figure 2F).
A256
192
128
64
0
R1
0 64 128 192 256
SS
C a
rea
FSC area
B256
192
128
64
0
R2
0 64 128 192 256FS
C h
eigh
tFSC area
C256
192
128
64
0
100 101 102 103 104
R3
SS
C a
rea
CD45 FITC
D104
103
102
101
100
100 101 102 103 104
R4
CD
34 P
E
CD45 FITC
F
2,494
1,871
1,247
624
0
100 101 102 103 104
R5
Live Dead
Cou
nt7-AAD
E104
103
102
101
100
100 101 102 103 104
R4
CD
34 P
E
CD45 FITC
Fig. 2. CD34+/CD45+ human HSPCs gating strategy. Purified fresh PBMCs were stained with CD34 PE, CD45 FITC, and 7-AAD, and then acquired on the S3e Cell Sorter. After excluding debris and doublets (A-B), the fluorescence channel 1 (FL1) bright population (R3) was selected to exclude CD45 negative cells (C). Fluorescence channel 2 (FL2) bright populations (CD34+) (R4) were then selected for further analysis (D). Post-sort purity and viability analysis of CD34+/CD45+ sorted cells revealed a 97.8% purity (E) and 98.4% viability (F). 7-AAD, 7-aminoactinomycin D; FITC, fluorescein isothicynate; FSC, forward scatter; HSPC, hematopoietic stem and progenitor cell; PE, phycoerythrin; SSC, side scatter.
© 2018 Bio-Rad Laboratories, Inc. 3 Bulletin 7055
Identifying Heterogeneity within Rare Cell Populations by Pairing Single-Cell RNA-Seq with Cell Sorting
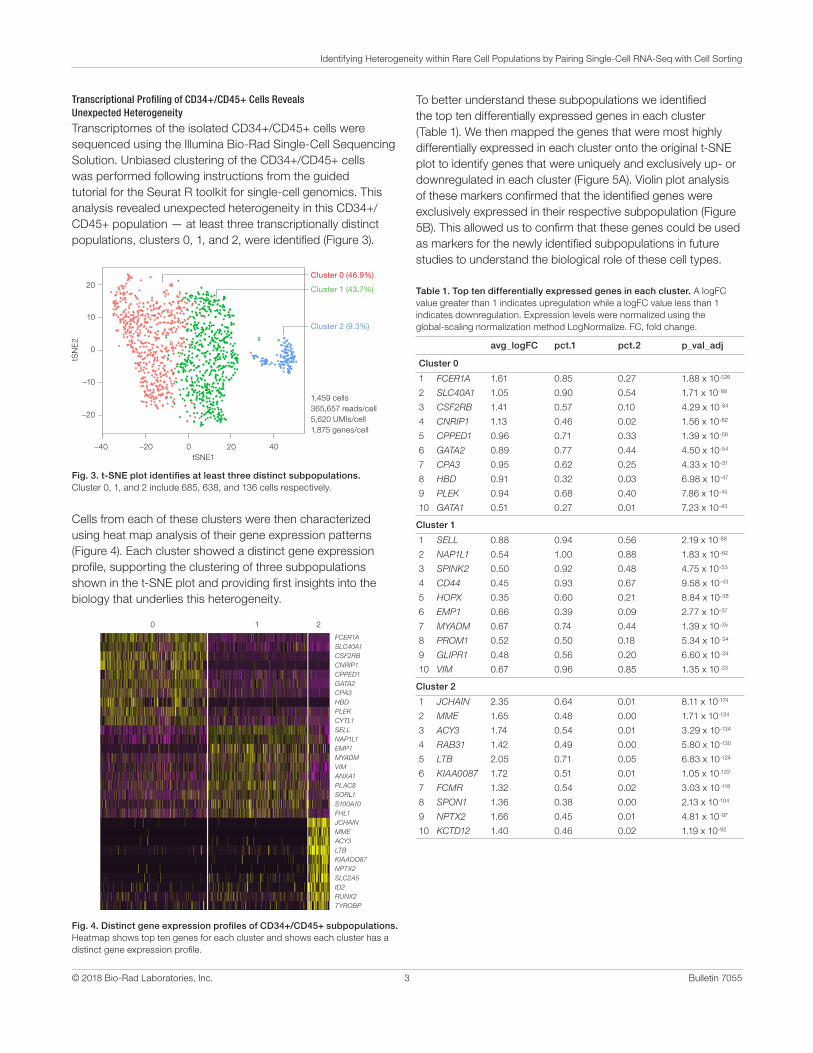
Fig. 3. t-SNE plot identifies at least three distinct subpopulations. Cluster 0, 1, and 2 include 685, 638, and 136 cells respectively.
tSN
E2
20
10
0
–10
–20
–40 –20 0 20 40tSNE1
1,459 cells 365,657 reads/cell5,620 UMIs/cell1,875 genes/cell
Cluster 1 (43.7%)
Cluster 0 (46.9%)
Cluster 2 (9.3%)
Table 1. Top ten differentially expressed genes in each cluster. A logFC value greater than 1 indicates upregulation while a logFC value less than 1 indicates downregulation. Expression levels were normalized using the global-scaling normalization method LogNormalize. FC, fold change.
0 1 2
FCER1A SLC40A1CSF2RBCNRIP1CPPED1GATA2CPA3HBDPLEKCYTL1SELLNAP1L1EMP1MYADMVIMANXA1PLAC8SORL1S100A10FHL1JCHAINMMEACY3LTBKIAAOO87NPTX2SLC2A5ID2RUNX2TYROBP
Transcriptional Profiling of CD34+/CD45+ Cells Reveals Unexpected Heterogeneity
Transcriptomes of the isolated CD34+/CD45+ cells were sequenced using the Illumina Bio-Rad Single-Cell Sequencing Solution. Unbiased clustering of the CD34+/CD45+ cells was performed following instructions from the guided tutorial for the Seurat R toolkit for single-cell genomics. This analysis revealed unexpected heterogeneity in this CD34+/CD45+ population — at least three transcriptionally distinct populations, clusters 0, 1, and 2, were identified (Figure 3).
Cells from each of these clusters were then characterized using heat map analysis of their gene expression patterns (Figure 4). Each cluster showed a distinct gene expression profile, supporting the clustering of three subpopulations shown in the t-SNE plot and providing first insights into the biology that underlies this heterogeneity.
Fig. 4. Distinct gene expression profiles of CD34+/CD45+ subpopulations. Heatmap shows top ten genes for each cluster and shows each cluster has a distinct gene expression profile.
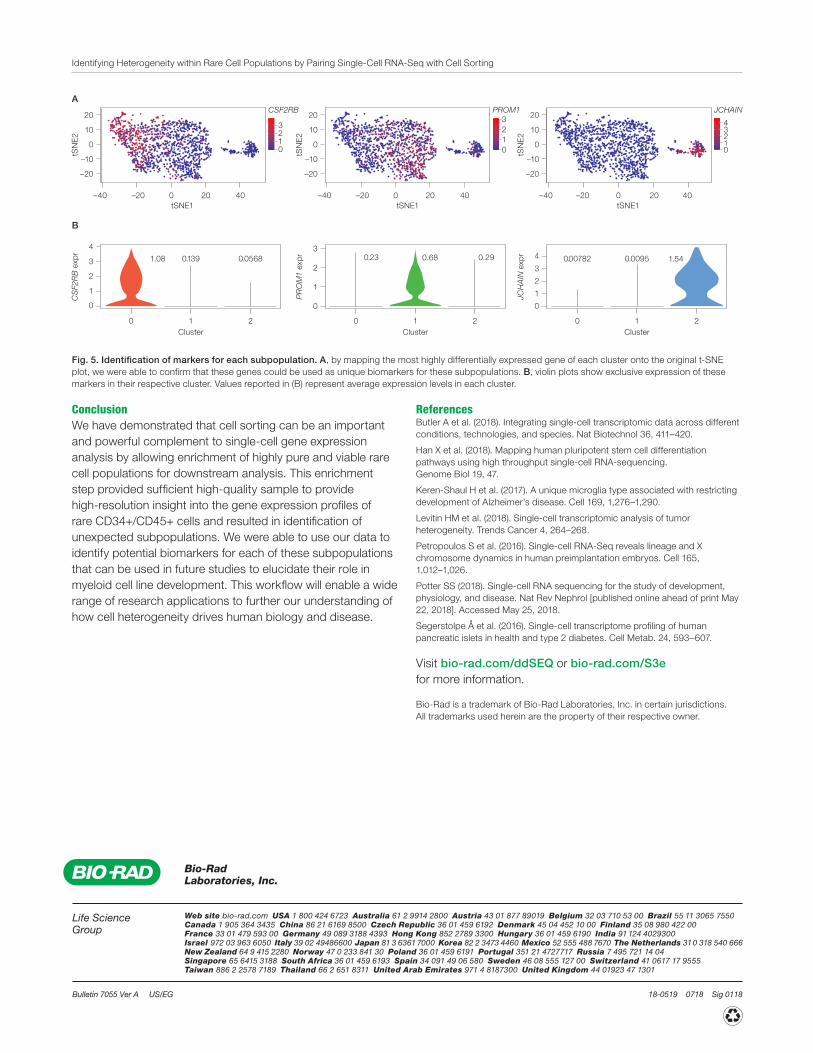
To better understand these subpopulations we identified the top ten differentially expressed genes in each cluster (Table 1). We then mapped the genes that were most highly differentially expressed in each cluster onto the original t-SNE plot to identify genes that were uniquely and exclusively up- or downregulated in each cluster (Figure 5A). Violin plot analysis of these markers confirmed that the identified genes were exclusively expressed in their respective subpopulation (Figure 5B). This allowed us to confirm that these genes could be used as markers for the newly identified subpopulations in future studies to understand the biological role of these cell types.
avg_logFC pct.1 pct.2 p_val_adj
Cluster 0
1 FCER1A 1.61 0.85 0.27 1.88 x 10-126
2 SLC40A1 1.05 0.90 0.54 1.71 x 10-88
3 CSF2RB 1.41 0.57 0.10 4.29 x 10-84
4 CNRIP1 1.13 0.46 0.02 1.56 x 10-82
5 CPPED1 0.96 0.71 0.33 1.39 x 10-56
6 GATA2 0.89 0.77 0.44 4.50 x 10-54
7 CPA3 0.95 0.62 0.25 4.33 x 10-51
8 HBD 0.91 0.32 0.03 6.98 x 10-47
9 PLEK 0.94 0.68 0.40 7.86 x 10-45
10 GATA1 0.51 0.27 0.01 7.23 x 10-43
Cluster 1
1 SELL 0.88 0.94 0.56 2.19 x 10-88
2 NAP1L1 0.54 1.00 0.88 1.83 x 10-62
3 SPINK2 0.50 0.92 0.48 4.75 x 10-53
4 CD44 0.45 0.93 0.67 9.58 x 10-43
5 HOPX 0.35 0.60 0.21 8.84 x 10-38
6 EMP1 0.66 0.39 0.09 2.77 x 10-37
7 MYADM 0.67 0.74 0.44 1.39 x 10⁻³⁵
8 PROM1 0.52 0.50 0.18 5.34 x 10⁻³⁴
9 GLIPR1 0.48 0.56 0.20 6.60 x 10⁻³⁴
10 VIM 0.67 0.96 0.85 1.35 x 10⁻³³
Cluster 2
1 JCHAIN 2.35 0.64 0.01 8.11 x 10-174
2 MME 1.65 0.48 0.00 1.71 x 10-134
3 ACY3 1.74 0.54 0.01 3.29 x 10-134
4 RAB31 1.42 0.49 0.00 5.80 x 10-130
5 LTB 2.05 0.71 0.05 6.83 x 10-124
6 KIAA0087 1.72 0.51 0.01 1.05 x 10-122
7 FCMR 1.32 0.54 0.02 3.03 x 10-118
8 SPON1 1.36 0.38 0.00 2.13 x 10-104
9 NPTX2 1.66 0.45 0.01 4.81 x 10-97
10 KCTD12 1.40 0.46 0.02 1.19 x 10-92
Bulletin 7055 Ver A US/EG 18-0519 0718 Sig 0118
Web site bio-rad.com USA 1 800 424 6723 Australia 61 2 9914 2800 Austria 43 01 877 89019 Belgium 32 03 710 53 00 Brazil 55 11 3065 7550 Canada 1 905 364 3435 China 86 21 6169 8500 Czech Republic 36 01 459 6192 Denmark 45 04 452 10 00 Finland 35 08 980 422 00 France 33 01 479 593 00 Germany 49 089 3188 4393 Hong Kong 852 2789 3300 Hungary 36 01 459 6190 India 91 124 4029300 Israel 972 03 963 6050 Italy 39 02 49486600 Japan 81 3 6361 7000 Korea 82 2 3473 4460 Mexico 52 555 488 7670 The Netherlands 31 0 318 540 666 New Zealand 64 9 415 2280 Norway 47 0 233 841 30 Poland 36 01 459 6191 Portugal 351 21 4727717 Russia 7 495 721 14 04 Singapore 65 6415 3188 South Africa 36 01 459 6193 Spain 34 091 49 06 580 Sweden 46 08 555 127 00 Switzerland 41 0617 17 9555 Taiwan 886 2 2578 7189 Thailand 66 2 651 8311 United Arab Emirates 971 4 8187300 United Kingdom 44 01923 47 1301
Bio-Rad Laboratories, Inc.
Life ScienceGroup
Identifying Heterogeneity within Rare Cell Populations by Pairing Single-Cell RNA-Seq with Cell SortingtS
NE
2
20
10
0
–10
–20
–40 –20 0 20 40tSNE1
3210
CSF2RB
tSN
E2
20
10
0
–10
–20
–40 –20 0 20 40tSNE1
3210
PROM1
tSN
E2
20
10
0
–10
–20
–40 –20 0 20 40tSNE1
43210
JCHAINA
B
JCH
AIN
exp
r 4
3
2
1
0
1.54
0
0.00782
Cluster1
0.0095
2
CS
F2R
B e
xpr
4
3
2
1
0
Cluster
1.08
1
0.139
2
0.0568
0
PR
OM
1 ex
pr
3
2
1
0
0.680.23
0
0.29
2Cluster
1
Bio-Rad is a trademark of Bio-Rad Laboratories, Inc. in certain jurisdictions. All trademarks used herein are the property of their respective owner.
ReferencesButler A et al. (2018). Integrating single-cell transcriptomic data across different conditions, technologies, and species. Nat Biotechnol 36, 411–420.
Han X et al. (2018). Mapping human pluripotent stem cell differentiation pathways using high throughput single-cell RNA-sequencing. Genome Biol 19, 47.
Keren-Shaul H et al. (2017). A unique microglia type associated with restricting development of Alzheimer’s disease. Cell 169, 1,276–1,290.
Levitin HM et al. (2018). Single-cell transcriptomic analysis of tumor heterogeneity. Trends Cancer 4, 264–268.
Petropoulos S et al. (2016). Single-cell RNA-Seq reveals lineage and X chromosome dynamics in human preimplantation embryos. Cell 165, 1,012–1,026.
Potter SS (2018). Single-cell RNA sequencing for the study of development, physiology, and disease. Nat Rev Nephrol [published online ahead of print May 22, 2018]. Accessed May 25, 2018.
Segerstolpe Å et al. (2016). Single-cell transcriptome profiling of human pancreatic islets in health and type 2 diabetes. Cell Metab. 24, 593–607.
ConclusionWe have demonstrated that cell sorting can be an important and powerful complement to single-cell gene expression analysis by allowing enrichment of highly pure and viable rare cell populations for downstream analysis. This enrichment step provided sufficient high-quality sample to provide high-resolution insight into the gene expression profiles of rare CD34+/CD45+ cells and resulted in identification of unexpected subpopulations. We were able to use our data to identify potential biomarkers for each of these subpopulations that can be used in future studies to elucidate their role in myeloid cell line development. This workflow will enable a wide range of research applications to further our understanding of how cell heterogeneity drives human biology and disease.
Fig. 5. Identification of markers for each subpopulation. A, by mapping the most highly differentially expressed gene of each cluster onto the original t-SNE plot, we were able to confirm that these genes could be used as unique biomarkers for these subpopulations. B, violin plots show exclusive expression of these markers in their respective cluster. Values reported in (B) represent average expression levels in each cluster.
Visit bio-rad.com/ddSEQ or bio-rad.com/S3e for more information.