Identifying Gas Ultrasonic Meter Problems Using Advanced ... · Identifying Gas Ultrasonic Meter...
13
Identifying Gas Ultrasonic Meter Problems Using Advanced Techniques Randy McDaniel, Sr. Project Specialist, Atmos Energy John Lansing, VP Global Operations, CEESI Abstract During the past several years the use of ultrasonic meters (USMs) has gained worldwide acceptance for fiscal applications. The many benefits of USMs have been documented in papers at virtually every major conference. The significance of knowing the ultrasonic meter is operating accurately has never been more important. The use of diagnostics to help identify metering issues has been discussed in several papers at many conferences [Ref 1, 2 & 3]. USM technology has played a key role in reducing Lost And Un-accounted For (LAUF) numbers. However, like any technology, the client must understand the meters’ diagnostics in order to validate it is working correctly. Due to mergers, acquisitions, changes in technology, and purchasing preferences within an organization, it can be difficult for technicians to be skilled on all products. Also, changing technology adds to the difficulty as they often encounter multiple manufacturers’ equipment. Most clients obtain diagnostic data (maintenance reports) by visiting the site monthly. This provides access to this data and a record of how the meter is performing at that time. However, this isn’t an ideal situation, as the meter may not be flowing gas while the technician is on site. Additionally, a problem may occur in between inspections (usually monthly or quarterly), so the technician may never be aware of the issue. Thus, what is needed is a system that can monitor the USMs’ health, regardless of manufacturer, and periodically, and automatically provide a single report to the client when problems occur. One method to resolve this issue is to have a real-time monitoring system that can provide monthly performance summaries (maintenance reports) and sends out text or email messages when any diagnostic parameter is out of range. This is generally difficult for most clients to do as measurement sites often have limited data bandwidth since the original purpose was to only collect flow rate data. This makes sending additional “diagnostic data” through the SCADA system much more challenging. A second issue is that the typical field flow computer, or RTU, may not have enough processing power to collect and analyze all of the USM data. A third problem is the variety of gas USMs on the market. Each one works on the same basic principle, but the diagnostics, and subsequent analysis techniques, vary from one brand to another. This makes it more difficult for the fiscal flow computer to be tasked with all this additional activity. A solution to this issue would be to have a separate system monitoring the facilities’ diagnostics and reporting information using a separate data path independent of the clients’ fiscal data. This paper discusses such a system. Typical USM Test or Verification Process For years the industry’s paradigm for managing measurement risk has been to send technicians to the location to test and inspect the equipment. As measurement equipment has been modernized this task has become increasingly difficult. To test a modern measurement station a technician must not only be capable of operating the physical equipment at the station, he or she must also be proficient at connecting his or her laptop to the flow computer, USM, chromatograph, and transmitters. Of course they must be proficient in operating the vendor specific software programs, and in many cases, utilize them simultaneously.
Transcript of Identifying Gas Ultrasonic Meter Problems Using Advanced ... · Identifying Gas Ultrasonic Meter...
!
Identifying Gas Ultrasonic Meter Problems Using Advanced Techniques Randy McDaniel, Sr. Project Specialist, Atmos Energy John Lansing, VP Global Operations, CEESI Abstract
During the past several years the use of ultrasonic meters (USMs) has gained worldwide acceptance for fiscal applications. The many benefits of USMs have been documented in papers at virtually every major conference. The significance of knowing the ultrasonic meter is operating accurately has never been more important. The use of diagnostics to help identify metering issues has been discussed in several papers at many conferences [Ref 1, 2 & 3].
USM technology has played a key role in reducing Lost And Un-accounted For (LAUF) numbers. However, like any technology, the client must understand the meters’ diagnostics in order to validate it is working correctly. Due to mergers, acquisitions, changes in technology, and purchasing preferences within an organization, it can be difficult for technicians to be skilled on all products. Also, changing technology adds to the difficulty as they often encounter multiple manufacturers’ equipment.
Most clients obtain diagnostic data (maintenance reports) by visiting the site monthly. This provides access to this data and a record of how the meter is performing at that time. However, this isn’t an ideal situation, as the meter may not be flowing gas while the technician is on site. Additionally, a problem may occur in between inspections (usually monthly or quarterly), so the technician may never be aware of the issue. Thus, what is needed is a system that can monitor the USMs’ health, regardless of manufacturer, and periodically, and automatically provide a single report to the client when problems occur.
One method to resolve this issue is to have a real-time monitoring system that can provide monthly performance summaries (maintenance reports) and sends out text or email messages when any diagnostic parameter is out of range. This is generally difficult for most clients to do as measurement sites often have limited data bandwidth since the original purpose was to only collect flow rate data. This makes sending additional “diagnostic data” through the SCADA system much more challenging. A second issue is that the typical field flow computer, or RTU, may not have enough processing power to collect and analyze all of the USM data. A third problem is the variety of gas USMs on the market. Each one works on the same basic principle, but the diagnostics, and subsequent analysis techniques, vary from one brand to another. This makes it more difficult for the fiscal flow computer to be tasked with all this additional activity.
A solution to this issue would be to have a separate system monitoring the facilities’ diagnostics and reporting information using a separate data path independent of the clients’ fiscal data. This paper discusses such a system.
Typical USM Test or Verification Process
For years the industry’s paradigm for managing measurement risk has been to send technicians to the location to test and inspect the equipment. As measurement equipment has been modernized this task has become increasingly difficult. To test a modern measurement station a technician must not only be capable of operating the physical equipment at the station, he or she must also be proficient at connecting his or her laptop to the flow computer, USM, chromatograph, and transmitters. Of course they must be proficient in operating the vendor specific software programs, and in many cases, utilize them simultaneously.
!
The technician typically tests equipment on-site such as the pressure and temperature transmitters. Highly trained technicians may recalculate volumes, briefly review USM Maintenance Reports and Chromatograph calibration records, and/or perform other tests such as running the calibration standard as an unknown. However, in most cases the technician collects data and then emails the data to Measurement Engineers and Analysts for further review.
The risk of emailing the data to engineers and analysts is that the data may never get looked at. And when it is looked at, often the flow computer, chromatograph, and USM diagnostics information is not treated reviewed together. Multiple groups look at only pieces of the data, and often at different times. At the end of this process, if it is done successfully, management really only knows the performance of the metering station at the time the technician was on-site collecting the information.
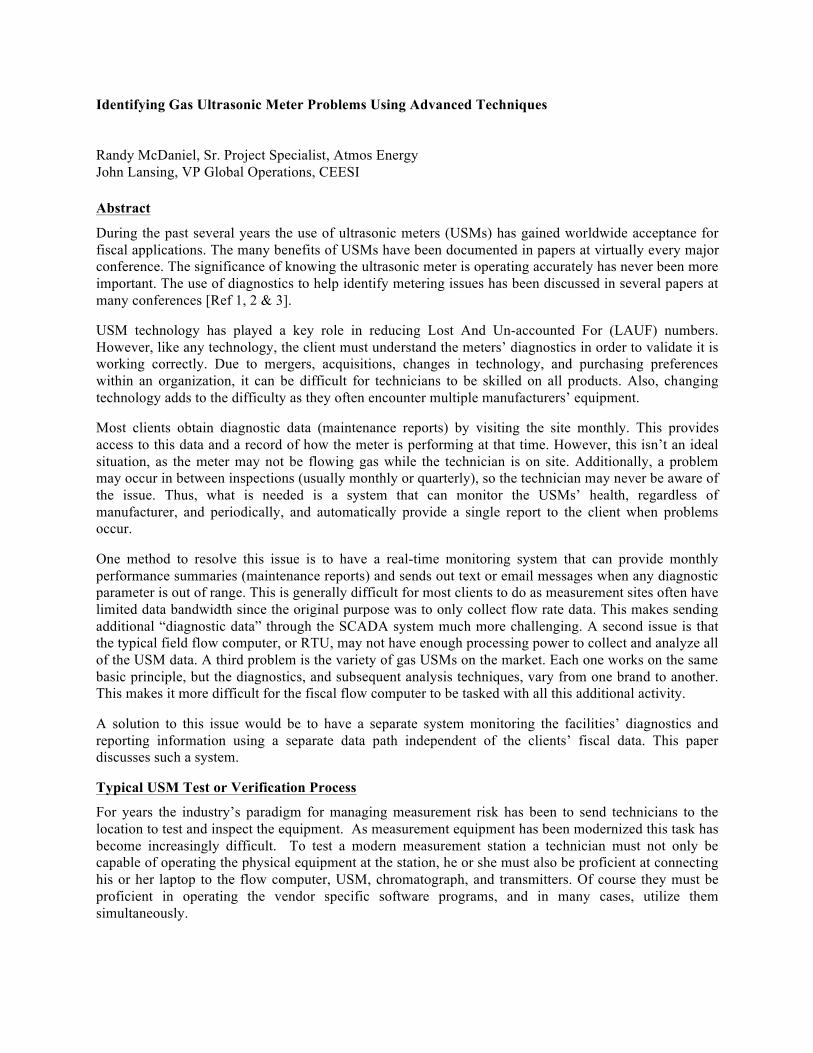
Figure 1 illustrates the measurement equipment, the information flow, and the people that may be involved in reviewing measurement information from an on-site meter test.
Figure 1. Meter Test Information Flow
The Problem of Stranded Data
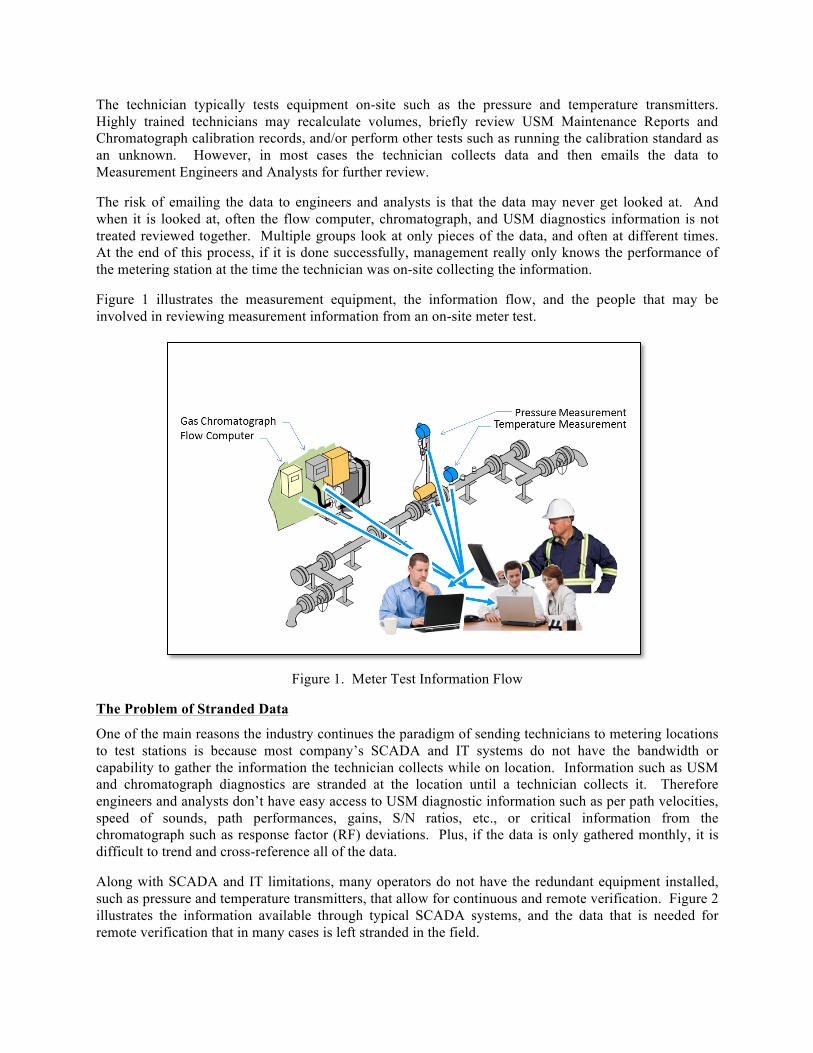
One of the main reasons the industry continues the paradigm of sending technicians to metering locations to test stations is because most company’s SCADA and IT systems do not have the bandwidth or capability to gather the information the technician collects while on location. Information such as USM and chromatograph diagnostics are stranded at the location until a technician collects it. Therefore engineers and analysts don’t have easy access to USM diagnostic information such as per path velocities, speed of sounds, path performances, gains, S/N ratios, etc., or critical information from the chromatograph such as response factor (RF) deviations. Plus, if the data is only gathered monthly, it is difficult to trend and cross-reference all of the data.
Along with SCADA and IT limitations, many operators do not have the redundant equipment installed, such as pressure and temperature transmitters, that allow for continuous and remote verification. Figure 2 illustrates the information available through typical SCADA systems, and the data that is needed for remote verification that in many cases is left stranded in the field.

!
Figure 2. Meter Test Information Flow with Stranded Diagnostics
New Verification Paradigm
At the end of the day companies want to minimize measurement risk. However, the typical on-site testing paradigm may not be fully meeting this goal. Since the information from a meter test is gathered and analyzed by different groups, it is easy to lose sight of the big picture. A more comprehensive verification process would allow engineers and analysts to verify the USM configuration, the path velocity measurements, the gas profile, and the average velocity and actual volume calculations performed by the meter. The process would verify the volume handoff from the USM to the Flow computer. The process would also verify the pressure and temperature measurements and the chromatograph’s performance. The verification process would take advantage of cross referencing diagnostics such as comparing the USM Speed of Sound (SOS) to the AGA 10 calculated SOS, and it would also verify the flow computer compressibility and volume calculations.
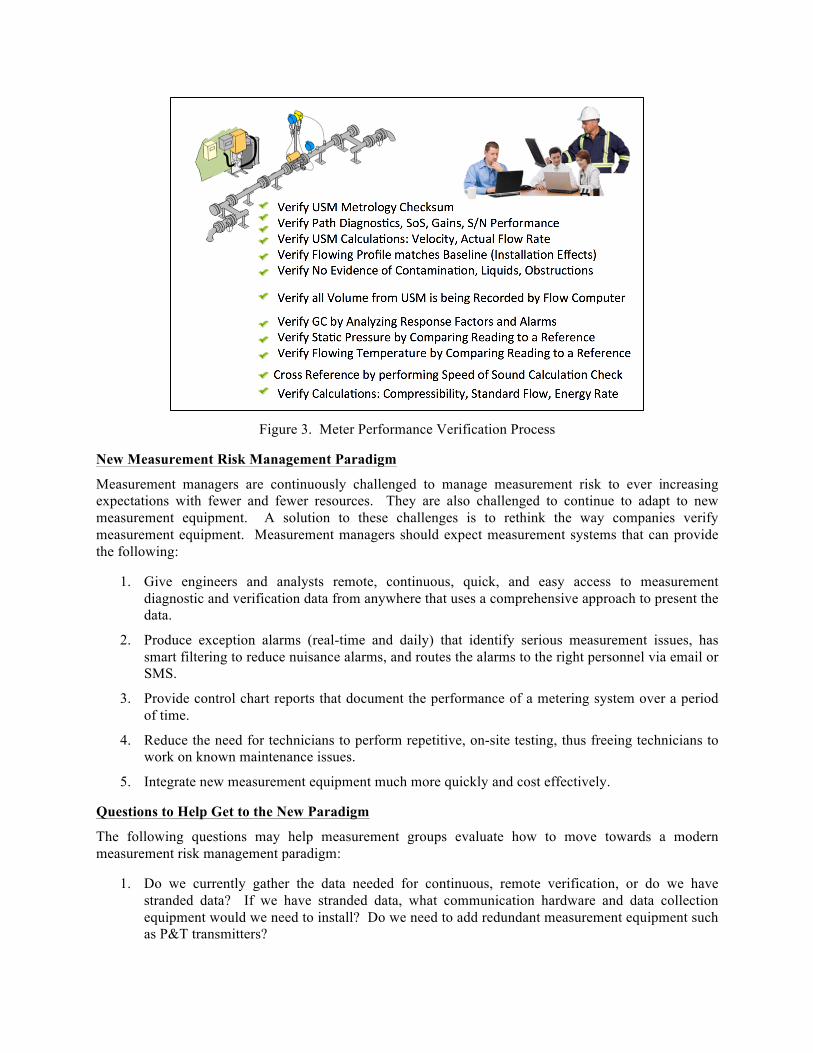
Figure 3 illustrates an all-inclusive sequence of checks that would provide engineers and analysts much more certainty about the performance of the measurement system.
!
Figure 3. Meter Performance Verification Process
New Measurement Risk Management Paradigm
Measurement managers are continuously challenged to manage measurement risk to ever increasing expectations with fewer and fewer resources. They are also challenged to continue to adapt to new measurement equipment. A solution to these challenges is to rethink the way companies verify measurement equipment. Measurement managers should expect measurement systems that can provide the following:
1. Give engineers and analysts remote, continuous, quick, and easy access to measurement diagnostic and verification data from anywhere that uses a comprehensive approach to present the data.
2. Produce exception alarms (real-time and daily) that identify serious measurement issues, has smart filtering to reduce nuisance alarms, and routes the alarms to the right personnel via email or SMS.
3. Provide control chart reports that document the performance of a metering system over a period of time.
4. Reduce the need for technicians to perform repetitive, on-site testing, thus freeing technicians to work on known maintenance issues.
5. Integrate new measurement equipment much more quickly and cost effectively.
Questions to Help Get to the New Paradigm
The following questions may help measurement groups evaluate how to move towards a modern measurement risk management paradigm:
1. Do we currently gather the data needed for continuous, remote verification, or do we have stranded data? If we have stranded data, what communication hardware and data collection equipment would we need to install? Do we need to add redundant measurement equipment such as P&T transmitters?

!
2. If the diagnostic information is being collected through our SCADA and IT system, are we warehousing it in a way that it is easily accessible by measurement engineers and analysts?
3. How do we create processes to automatically analyze the information and publish exception alarms?
4. How do we create control chart tools so that measurement engineers and analysts can efficiently analyze measurement information and understand the performance of a metering system?
New Approach: A Continuous Measurement Monitoring System (CMMS)
The challenges facing measurement managers begs for a new approach. In the old measurement paradigm pieces of the measurement diagnostics information were stored in several places, isolated from each other, and in many cases in systems not designed to manage measurement risk. For example data may be stored in gas control, measurement gas quality analysis, and measurement accounting systems. Perhaps the solution is to gather sufficient diagnostics information continuously into one system with the primary purpose of helping measurement groups manage measurement risk. A system of this nature could be thought of as a Continuous Measurement Monitoring System (CMMS).
Challenges to Implementing a CMMS
The biggest challenges to building a CMMS internally is dedicating the time and resources to produce a system that truly solves the problems of stranded data, provides quick and easy access, generates meaningful exception alarming, and incorporates powerful control charting capabilities. To help meet these challenges, CMMS’s are commercially available, but in many cases require measurement groups to educate upper management on the value of the new technology. New technology makes CMMS more viable today by incorporating the following:
• With the advent of the Cloud and the various secure, and VPN communication technologies on the market, it is now possible for measurement groups to build secondary networks for diagnostic data. This allows bypassing or augmenting the limited bandwidth of traditional SCADA and IT network infrastructure. This allows for measurement diagnostic information to be continuously collected.
• New technology also provides many solutions to host Web Portals, either in the Cloud, or behind corporate firewalls, that give measurement managers, engineers, analysts, and technicians remote, quick, and easy access to comprehensive diagnostic information. This allows users to easily subscribe to exception alarms and control chart reports and generally does not require any specialized software to be installed.
The following two figures illustrate examples of CMMS network topology solutions. Figure 4 illustrates an example of a CMMS behind a company’s corporate firewall. This figure illustrates a secondary diagnostic data network collecting stranded data through the Cloud. It also illustrates another method to feed the CMMS data via the company’s existing gas control and measurement accounting system servers. This data is being transferred via FTP to the CMMS server.

!
Figure 4. CMMS Hosted behind Firewall
Figure 5 illustrates a CMMS hosted in the Cloud. The functionality of the two solutions is the same. For simplicity the figures do not illustrate many of the security features that can be implemented such as firewall controls and SSL and VPN connections with encryption.
Figure 5. Cloud Hosted CMMS
!
What Kind of Problems Can a CMMS Find?
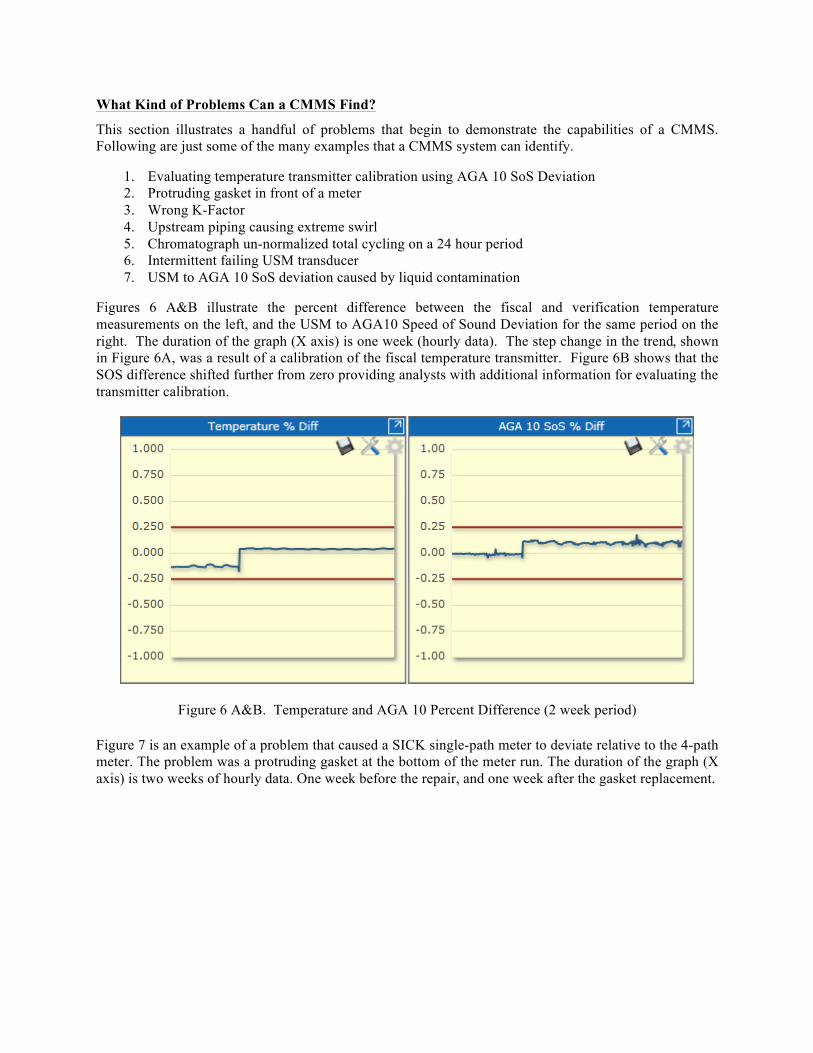
This section illustrates a handful of problems that begin to demonstrate the capabilities of a CMMS. Following are just some of the many examples that a CMMS system can identify.
1. Evaluating temperature transmitter calibration using AGA 10 SoS Deviation 2. Protruding gasket in front of a meter 3. Wrong K-Factor 4. Upstream piping causing extreme swirl 5. Chromatograph un-normalized total cycling on a 24 hour period 6. Intermittent failing USM transducer 7. USM to AGA 10 SoS deviation caused by liquid contamination
Figures 6 A&B illustrate the percent difference between the fiscal and verification temperature measurements on the left, and the USM to AGA10 Speed of Sound Deviation for the same period on the right. The duration of the graph (X axis) is one week (hourly data). The step change in the trend, shown in Figure 6A, was a result of a calibration of the fiscal temperature transmitter. Figure 6B shows that the SOS difference shifted further from zero providing analysts with additional information for evaluating the transmitter calibration.
Figure 6 A&B. Temperature and AGA 10 Percent Difference (2 week period)
Figure 7 is an example of a problem that caused a SICK single-path meter to deviate relative to the 4-path meter. The problem was a protruding gasket at the bottom of the meter run. The duration of the graph (X axis) is two weeks of hourly data. One week before the repair, and one week after the gasket replacement.

!
Figure 7. Single-path vs. 4-path SICK ACFH Volumes (two weeks)
Figure 8 shows an example of a meter factor issue with a flow computer. The K-Factor was not entered correctly in the flow computer. This caused an approximate 0.45% under-registration. Once the K-Factor was corrected, the volumes obtained from the flow computer agreed with the volumes acquired directly from the USM.
Figure 8. Incorrect K-Factor in Flow Computer
The approximate average flow rate per hour during the time where the K-Factor was incorrect was on the order of 355 MSCFH. Each day this amounted to an accumulated volume of approximately 8.500 MMSCFD. An error of 0.45% under-registration resulted in the loss of approximately 38 MSCF per day. Assuming $3.00 per thousand, this translates into perhaps $120 per day, or on the order of $3,400 lost revenue per month.
!
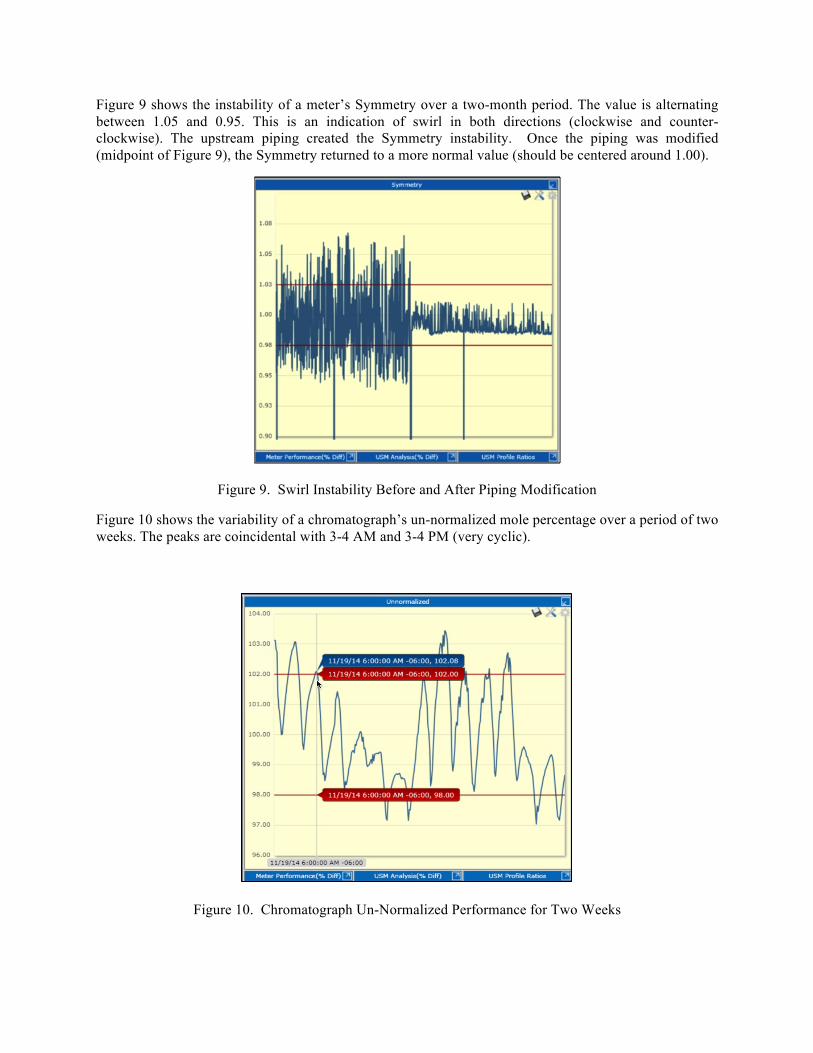
Figure 9 shows the instability of a meter’s Symmetry over a two-month period. The value is alternating between 1.05 and 0.95. This is an indication of swirl in both directions (clockwise and counter-clockwise). The upstream piping created the Symmetry instability. Once the piping was modified (midpoint of Figure 9), the Symmetry returned to a more normal value (should be centered around 1.00).
Figure 9. Swirl Instability Before and After Piping Modification
Figure 10 shows the variability of a chromatograph’s un-normalized mole percentage over a period of two weeks. The peaks are coincidental with 3-4 AM and 3-4 PM (very cyclic).
Figure 10. Chromatograph Un-Normalized Performance for Two Weeks

!
Figure 11 shows an example of path performance dropping to zero periodically, and how the gains increase during failure. More than likely this path has some form of contamination that caused the pulse detection to reject the waveform. This generally is also reflected by and increased gain that can be seen in the graph immediately below the path 3 performance graph. The time interval on the X-axis is 2 weeks.
Figure 11. Path 3 Intermittent Failure Over a Two-Week Period
Figure 12 shows the trend of a USM SOS to AGA 10 calculated SOS percent deviation over a two-week period. The cause of the percent difference trending below the lower control limit can be attributed to the C6+ component increasing to a much higher value during the period of the increased difference. This can be seen in Figure 13.

!
Figure 12. AGA 10 Percent Deviation Over a Two-Week Period
Figures 12 and 13 show that the C6+ mole percentage can be correlated with the USM to AGA 10 percent deviation. This relationship suggests that the C6+ split is not being properly accounted for in the AGA 10 calculation.
Figure 13. C6+ Change Over a Two-Week Period
Figure 14 shows a response factor (RF) deviation problem with Iso-Pentane. The X-axis period is for two months. During this two-month period the GC was repaired (about 1 month into this graph), and afterwards the daily RF deviations returned to expected values.

!
Figure 14. Iso-Pentane RF Before and After Repair
Figure 15 shows the results a configuration checksum change in a meter. The X-axis contains two weeks of data. The CMMS identified the date and time of a change to the meter configuration (see step change in the figure) providing analysts information to further investigate the reason for the change. The meter’s configuration would need to be compared using the vendor software to identify the parameter that changed.
Figure 15. Meter Configuration Check-sum Change
Conclusions
Today a system that provides continuous measurement monitoring of a USM metering station’s performance is now more practical than ever. Through the use of new Cloud and web based technologies,

!
more automation is being achieved today in order to lower meter station uncertainty. An entire facility can now be monitored on a “quasi" real-time basis. Problems like liquid contamination from hydrates, blocked flow conditioners, contamination buildup within the metering facility, and much more can be quickly identified and immediately communicated to the measurement engineers, analysts, and technicians via email or text messages.
By incorporating CMMS, not only is the USM facility station uncertainty lowered, the need for monthly site visits to verify the accuracy of pressure and temperature transmitters is also reduced/eliminated by incorporating separate, redundant measurements for each meter run. With the addition of AGA 10 SOS being computed by the CMMS, problems with the gas chromatograph can also be quickly identified. This even includes components in the flowing stream that are not being detected like H2 and He.
With the emphasis on operating groups to “do more with less,” every aspect of field maintenance is being reviewed through the lens of reducing costs. Fewer site visits can increase vehicle longevity, reduce exposure time for potential vehicular accidents, and reduce vehicle emissions that translate into a better environment for everyone.
Finally, calling this system a Continuous Measurement Monitoring System (CMMS) isn’t fully descriptive. Perhaps it should be called a Complete Measurement Verification System (CMVS) since it not only reports when a “condition” exists, it verifies the operation of all the ancillary equipment including the flow computer, P&T transmitters and GC. Instead of thinking in terms of a CMMS reducing measurement uncertainty, think of it as increasing measurement certainty by ensuring all equipment is operating correctly 24/7/365.
References
1. John Lansing, How Today’s USM Diagnostics Solve Metering Problems, North Sea Flow Measurement Conference, October 2005, Tonsberg, Norway
2. Klaus Zanker, Diagnostic Ability of the Daniel Four-Path Ultrasonic Flow Meter, Southeast Asia Flow Measurement Workshop, 2003, Kuala Lumpur, Malaysia
3. John Lansing, Advanced Ultrasonic Meter Diagnostics, Western Gas Measurement Short Course, May 2007, Seattle, Washington, USA