Identifying and Quantifying the Zone of Indifference
93
Clemson University TigerPrints All Dissertations Dissertations 8-2017 Identifying and Quantifying the Zone of Indifference Phillip W. Jasper Clemson University, [email protected] Follow this and additional works at: hps://tigerprints.clemson.edu/all_dissertations is Dissertation is brought to you for free and open access by the Dissertations at TigerPrints. It has been accepted for inclusion in All Dissertations by an authorized administrator of TigerPrints. For more information, please contact [email protected]. Recommended Citation Jasper, Phillip W., "Identifying and Quantifying the Zone of Indifference" (2017). All Dissertations. 2004. hps://tigerprints.clemson.edu/all_dissertations/2004
Transcript of Identifying and Quantifying the Zone of Indifference

Clemson UniversityTigerPrints
All Dissertations Dissertations
8-2017
Identifying and Quantifying the Zone ofIndifferencePhillip W. JasperClemson University, [email protected]
Follow this and additional works at: https://tigerprints.clemson.edu/all_dissertations
This Dissertation is brought to you for free and open access by the Dissertations at TigerPrints. It has been accepted for inclusion in All Dissertations byan authorized administrator of TigerPrints. For more information, please contact [email protected].
Recommended CitationJasper, Phillip W., "Identifying and Quantifying the Zone of Indifference" (2017). All Dissertations. 2004.https://tigerprints.clemson.edu/all_dissertations/2004

IDENTIFYING AND QUANTIFYING THE ZONE OF INDIFFERENCE
A Dissertation
Presented to
the Graduate School of
Clemson University
In Partial Fulfillment
of the Requirements for the Degree
Doctor of Philosophy
Human Factors Psychology
by
Phillip W. Jasper M.S.
August 2017
Accepted by:Dr. Eric Muth, Committee Chair
Dr. Adam Hoover
Dr. Patrick Rosopa
Dr. Elliot Jesch

ii
ABSTRACT
As of 2013, the proportion of overweight and obese adults had risen to 36.9% for
men, and 38.0% for woman, globally. New methods of weight management are required to
combat this upward trend. These new methods must address issues of traditional
approaches, mitigate external influences that lead to unhealthy eating behaviors, and
embrace advances in technology. The Bite Counter is a wearable tool that monitors intake
by counting the bites a wearer takes. The purpose of this study was to determine if the
“zone of indifference,” the zone within which people can eat more or less without reporting
a noticeable difference in satiety, actually exists, by quantifying the lower and upper
boundaries of the zone. Specifically, it was hypothesized that changes in eating behavior
would occur at bite targets outside of the zone, when participants were made aware of their
eating targets, compared to participants who were not made aware. No changes in eating
behavior were expected at bite targets within the zone regardless of whether or not
participants were mindful of their eating targets. Data were collected from 208 participants
eating a meal of macaroni and cheese in a laboratory setting. In a 2 (PRESENTATION: bites vs.
alarm) x 6 (TARGET: 12-22 bites) between-subjects design, the participants were either given a
specific bite count target (bites condition) or were told to stop eating when an alarm
sounded (alarm condition). The bite targets ranged from 12 to 22 bites in increments of two.
The alarm, if present, was set to a bite target using the same range. Bite count was
measured post-meal as the main dependent variable along with grams consumed, bite size,
and post-meal satiety. Results from the study showed a strong, positive correlation between
bite count and bite target in the alarm condition (r = .765) and that bite count increased up
until bite target 20 before leveling off in the bites condition. Additionally, it was shown that
grams consumed and bite target were moderately positively correlated in the alarm

iii
condition (r = .303) and grams consumed increased up to bite target 16, leveled off, and
then decreased beyond bite target 20 in the bites condition. In reference to behavior
change, an increase in bite size was observed in the bites condition for bite targets 12
through 16 but no change in bite size was observed in the alarm condition. Finally, results
showed that post-meal satiety levels held constant for bite targets 18 and 20 but surpassed
the “slightly full” threshold at bite target 22. These results suggest the zone of indifference
is real, and under the experimental conditions in this study was 18-20 bites of the served
macaroni and cheese meal.

iv
ACKNOWLEDGMENTS
I would first like to extend my appreciation to my committee members for their
support on this project. I want to thank Dr. Elliot Jesch for his insight into food science and
his unique perspective on the eating behavior of humans. I would like to thank Dr. Patrick
Rosopa for his guidance running the statistical analyses presented in this study. I would
also like to thank Dr. Adam Hoover for his sharp eye and technical support.
I would then like to thank my lab mates, of which I have had many. Specially, I
would like to thank James Salley, Mike Wilson, Sarah Beadle, Jackie McSorley, and
Amelia Kinsella who has been with me on this journey since day one.
Next, I want to extend my appreciation to my friends and family who have
supported and encouraged me throughout the entirety of my graduate education. Without
the care and love from those closest to me I would not have been able to present this work.
Finally, I want to extend my eternal gratitude to Dr. Eric Muth, my long time
mentor. His unwavering patience has been a blessing. It is through the opportunities he has
provided that I have been able to achieve this dream.

v
TABLE OF CONTENTS
TITLE PAGE ....................................................................................................................... i
ABSTRACT ........................................................................................................................ ii
ACKNOWLEDGMENTS ................................................................................................. iv
LIST OF TABLES ............................................................................................................ vii
LIST OF FIGURES ......................................................................................................... viii
CHAPTER
I. INTRODUCTION.....................................................................................1
Purpose ...................................................................................................................................1
Obesity Epidemic ...................................................................................................................1
Zone of Indifference ..............................................................................................................2
Cues that influence the location of the stop sign ...................................................................4
Self-monitoring ......................................................................................................................6
Previous work and current motivation ...................................................................................8
Current study ........................................................................................................................10
Design ..................................................................................................................................12
Hypotheses ...........................................................................................................................13
II. METHODS .............................................................................................18
Participants ...........................................................................................................................18
Materials ..............................................................................................................................19
Measures ..............................................................................................................................23
Procedure .............................................................................................................................23
Analysis................................................................................................................................26
III. RESULTS..............................................................................................28
Subjects ................................................................................................................................28
Hypothesis tests ...................................................................................................................29
Bite count ...........................................................................................................................30
Grams consumed ................................................................................................................32
Bite size ..............................................................................................................................35
Post-meal satiety ................................................................................................................36
Post-meal satiety (10 min after) .........................................................................................38

vi
Table of Contents (Continued)
IV. DISCUSSION.........................................................................................40
Zone of Indifference ............................................................................................................40
Criteria for inclusion in the Zone of Indifference ................................................................41
Contrasts ..............................................................................................................................42
Bites as an accessible unit of measure .................................................................................44
Limitations ...........................................................................................................................46
Conclusion ...........................................................................................................................49
REFERENCES ....................................................................................................................51
APPENDICES...................................................................................................................55
A: SLIM scale
B: Protocol
C: Tests of normality
D: F-tests with covariates (age, gender, BMI)
E: Pre-meal satiety correlations
F: F-tests with pre-meal satiety covariate
G: Comparison of historical vs. new data

vii
LIST OF TABLES
Table Page
1 Experimental design.................................................................................. 13
2 Experimental design with comparisons .....................................................27
3 Expected Zone of Indifference ...................................................................27
4 Subject demographics ...................................................................................29
5 Mean bite count..........................................................................................32
6 Planned comparisons for bite count ...........................................................32
7 Mean grams consumed ............................................................................. 35
8 Planned comparisons grams consumed .................................................... 35
9 Mean bite size ........................................................................................... 37
10 Planned comparisons bite size .................................................................. 37
11 Mean post-meal satiety ............................................................................. 38
12 Mean post-meal satiety (10 min after) ...................................................... 39
13 Contrasts: 16 vs 18-20 .............................................................................. 43
14 Contrasts: 22 vs 18-20 .............................................................................. 43

viii
LIST OF FIGURES
Figure Page
1 Zone of indifference .................................................................................... 3
2 Social facilitation zone ................................................................................ 4
3 Impression management zone ..................................................................... 5
4 Completion compulsion zone ......................................................................5
5 Visible food records zone ............................................................................6
6 Expected bite count ................................................................................... 14
7 Expected grams consumed ....................................................................... 15
8 Expected bite size ...................................................................................... 16
9 Expected post-meal satiety ........................................................................ 17
10 Early version of the Bite Count..................................................................20
11 New version Bite Counter ......................................................................... 21
12 Schematic of wrist roll motion .................................................................. 21
13 Instrumented eating station ........................................................................ 22
14 Laptops ...................................................................................................... 22
15 Results: Bite count .................................................................................... 32
16 Results: Grams consumed ........................................................................ 35
17 Results: Bite size ...................................................................................... 36
18 Results: Post-meal satiety ......................................................................... 38
19 Results: Post-meal satiety (10 min after) .................................................. 38

1
Introduction
Purpose
The purpose of this study was to determine if the “zone of indifference,” the zone within
which people can eat more or less without reporting a noticeable difference in satiety, actually
exists, by quantifying the lower and upper boundaries of the zone. Specifically, it was
hypothesized that differences in bite count, grams consumed, bite size, and satiety would occur
at bite targets outside of the zone, when participants were made aware of their eating targets,
compared to participants who were not aware. No differences in bite count, grams consumed,
bite size, and satiety were expected at bite targets within the zone regardless of whether or not
participants were mindful of their eating targets.
Obesity Epidemic
The proportion of adults classified as overweight or obese (BMI of 25 or greater) had
risen to 38% for men, and 40% for women globally as of 20141. The increasing rates of
overweight and obesity have been attributed to nearly 3.5 million deaths annually2. These
statistics classify overweight and obesity as an epidemic3. Researchers are developing new
mobile health technologies to reduce global rates of obesity. These new technologies aim to
assist weight-management and help individuals self-monitor more effectively.
At the foundation of weight management lies the relationship between energy intake and
energy expenditure. In the context of weight loss, the relationship is such that energy intake
must be less than energy expenditure for weight loss to occur4. Weight management, specifically
in the context of weight loss, can become problematic due to the difficulty of monitoring energy
intake. It has been shown that self-monitoring of energy intake requires conscious effort and can
be challenging even with the aid of various tools such as diet diaries5. Furthermore, the degree

2
of conscious engagement in self-monitoring of energy intake can be influenced by both internal
and external cues. These cues can lead to an increase or decrease in intake relative to a range6 of
energy intake within which individuals can eat more or less without experiencing an appreciable
difference in satiety.
Zone of Indifference
Obesity has become an epidemic in part because people are often unaware of how much
they consume, and have a tendency to eat beyond their energy expenditure needs. The zone of
indifference is a qualitative term that refers to this notion that people may overeat or under eat
without knowing it7. Specifically, the zone of indifference represents a range of consumption
(e.g. range of number of bites people take) in which no differences in satiety are reported.
There is no formula or established criteria that determine the zone. The purpose of this study was
to determine if the zone of indifference could be quantified by assigning concrete values to the
lower and upper boundaries of the zone in terms of bite count during a specific eating activity.
Figure 1 represents the zone of indifference of a neutral eater. This eater normally eats in
such a way that their eating activity is void of any cues influencing intake in either direction. In
this case the eater will stop eating in the middle of the zone, represented by the stop sign, and
their degree of satiety will lie in a neutral position between being ‘hungry’ and being ‘full’. If
they were to stop eating earlier for any reason, the stop sign would move towards the low end of
the zone. Their degree of satiety would still lie between being ‘hungry’ and ‘full’. However,
their energy intake would be less than normal. If they were to stop eating later for any reason,
the stop sign would move towards the high end of the zone. They would still be satiated.
However, their energy intake would be greater than normal. As per the definition of the zone of
indifference, the low boundary of the zone represents the smallest quantity one can consume yet

3
still feel satiated. The high boundary of the zone represents the largest quantity one can eat
without being uncomfortably full.
----------|----- -----|----------
There are many cues that influence where the point at which an individual will stop
eating will fall in relation to the zone during any given eating activity. The following sections
will examine some of these cues and discuss how each of them influence the point at which one
would stop eating. These cues will be presented in the context of a neutral eater and how the
point at which they stop eating will change based on the presence of the various cues under
discussion.
Low end High end
Zone of Indifference
Figure 1. This is a visualization of the zone of indifference for a meal consumed by a neutral
eater. The anchor points used by the scale are “greatest imaginable hunger” to “greatest
imaginable fullness” with “neither hungry nor full” as the midpoint. The neutral eater stops
eating when they are neither hungry nor full.
Greatest
imaginable
hunger
Greatest
imaginable
fullness
Neither hungry nor full Slightly
hungry
Slightly
full

4
Cues that influence when an individual stops eating relative to the zone
Social facilitation
Eating is a highly social activity and the eating behavior of an individual can be
influenced by the presence of others8. One study demonstrated that subjects eating in pairs, or
groups of four, consumed more than subjects that ate alone9. Another study showed that
individuals will consume more with friends and members of the same gender10. This
phenomenon has been coined “social facilitation”. Based on these observations, if a neutral eater
were to eat with friends or other members of the same gender, we can expect the point at which
they stop eating will move closer to the high end of the zone (Figure 2). This tells us that they
will have consumed more than they normally would.
----------|--------- -|----------
Impression management
The social context of an eating activity can also move the stopping point towards the low
end of the zone. One study showed that people will consume less dessert with strangers than
with friends11. Another study demonstrated that females will consume less when eating with a
male12. This phenomenon has been referred to as “impression management.”13 Based on these
observations, if a neutral eater were to eat with strangers or members of the opposite gender, we
can expect their stopping point to move closer to the low end of the zone (Figure 3). This tells us
that they will have consumed less than they normally would.
Greatest
imaginable
hunger
Greatest
imaginable
fullness
Figure 2. Stopping point falls closer to the high end of the zone in the presence of social facilitation.

5
----------|- ---------|----------
Completion compulsion
The presence of food can also influence where one’s stopping point may fall in relation to
the zone. Research has shown that people will continue an eating activity simply if more food is
available and not necessarily because they are hungry14. This is called “completion
compulsion.” One study supported the occurrence of completion compulsion by demonstrating
that individuals will cease eating and report feeling full not only when they are physically full
(i.e. full stomach), but also when they are psychologically full (i.e. they believe they have eaten
enough)15. In the context of a neutral eater, if more food is available in the eating environment
we can expect them to consume more than normal. This would result in their stopping point
moving closer to the high end of the zone (Figure 4).
----------|--------- -|----------
Visible food records
Research has shown that individuals will eat less when feedback of their eating activity is
visible16. This feedback can take the form of un-bussed food remnants such as chicken wing
Greatest
imaginable
hunger
Greatest
imaginable
fullness
Greatest
imaginable
hunger
Greatest
imaginable
fullness
Figure 3. Stopping point falls closer to the low end of the zone as a result of impression management.
Figure 4. Stopping point falls closer to the high end of the zone as a result of completion compulsion.

6
bones left on the table17, used bottle caps that are allowed to accumulate on a bar in front of a
patron or the accumulation of candy wrappers that are not thrown away18. These types of
remains are referred to as “visible food records.” As opposed to plate waste commonly referred
to as “leftovers,” visible food records are comprised of non-consumable elements. The presence
of visible food records has been show to lead to a reduction in consumption. In the context of a
neutral eater, we can expect the presence of a visible food record would lead them to consume
less than they normally would. This would move their stopping point towards the low end of the
zone for this eating activity (Figure 5).
----------|- ---------|----------
Self-monitoring
Self-monitoring to stay within the low end of the zone of indifference can be very
challenging, but is an important aspect of successful weight management19. As such, new tools
are needed to combat the detrimental influences of cues as well as mitigate the inconveniences of
traditional self-monitoring regimens. Specifically, new tools are needed to give people feedback
that they have reached the low end of the zone of indifference so that they can stop eating before
they enter the high end of the zone or beyond. This is particularly true, because the
physiological satiety cues lag behind the actual crossing into the zone from a behavioral
perspective20.
Greatest
imaginable
hunger
Greatest
imaginable
fullness
Figure 5. Stopping point falls closer to the low end of the zone in the presence of visible food records.

7
In recent years, researchers have begun to develop and test new technologies that aim to
help individuals increase healthy eating behaviors. Many of these new technologies look to
automate the elements of self-monitoring that have proven to be problematic using traditional
methods. Tools such as the Mandometer employ an eating station that monitors changes in plate
weight as a user removes food at each bite and calculates eating rate21. This information is
presented on a screen to the user, with the aim of getting the eater to eat within certain
parameters such as a specific eating rate and bite size. However, the Mandometer is an entire
eating station and is not well suited for use outside of the home. Americans are eating out more
and more22, thus the lack of portability of the Mandometer may limit its accessibility.
The 10S Fork is another tool to help individuals self-monitor. It aims to control a user’s
eating rate by monitoring how often he or she moves the fork from his or her plate to his or her
mouth. If the fork detects more than one bite in a 10 second span, a discrete alarm sounds
indicating to the eater to slow down. The premise behind this tool is that slower eating will
result in a reduction in intake23. The major limitation of the 10S Fork is that it only works if one
actually uses the fork. This requires individuals to carry the utensil with them at all times, and
similarly to the Mandometer, may limit its usage in eating situations that occur outside of the
home, or with foods that are not consumed with a fork.
The Bite Counter is another tool that monitors intake. It is a watch that employs a bite
counting algorithm by monitoring wrist roll activity to detect each bite of food a user takes. The
user is then provided with a real time bite count. Wearers may use this feedback to know where
they are relative to the zone of indifference, while they are eating24. Additionally, users can
preset an alarm on the device to sound when a certain number of bites has been reached, e.g., at
the low end of the zone of indifference.

8
Where the Mandometer and 10SFork fail in their portability and intrusiveness, the Bite
Counter provides a solution that allows for people to bring self-monitoring to virtually all eating
scenarios as it is simply worn as a watch and operates as such outside of eating activities.
Furthermore, the Bite Counter provides a beneficial environmental cue in the form of bite count
feedback that may act as a visible food record similar to that of bottle caps and candy wrappers –
potentially leading to a reduction in consumption and ultimately moving the point at which
individuals stop eating towards the low end of the zone of indifference25.
Previous work and current motivation
Recent work in our laboratory demonstrated the efficacy of an early version of the Bite
Counter. Two separate studies reported in Jasper et al., (2016) demonstrated bite count feedback
as an environmental cue to eat less in the presence of cues encouraging individuals to eat more
(i.e. social facilitation and unlimited food source), and showed the feasibility of pairing bite
count with a consumption goal. The first study reported in Jasper et al., (2016) had participants
eat a meal in the laboratory with others, and eat from a large plate or a small plate, while wearing
the Bite Counter. This condition was referred to as “free eating,” as participants were given no
instruction on how much to eat. Results showed that individuals who received bite count
feedback from the Bite Counter consumed significantly less, on average 26 grams less, than
those who did not receive bite count feedback. The second study reported in Jasper (2016) used
the same paradigm while giving everyone bite count feedback and either a low 12 bite goal, or a
high 22 bite goal. These targets represent how one could use an instruction along with bite count
feedback to eat to either the low or high boundary of the zone of indifference. Results from this
study showed that individuals can and will use bite count feedback to reach a target as
participants were able to stop eating at or near their goal.

9
The key takeaways from the two studies described in Jasper et al., (2016) were that bite
count feedback acts as an environmental cue that moves the point at which individuals stop
eating towards the low end of the zone of indifference, and that bite count feedback can be paired
with consumption goals. However, there was one unexpected finding that provided the
motivation for the current study. It was found that grams consumed between the low and high
goal groups, and the free eaters were similar. Given that bite counts were similar between free
eaters and those in the 22 bite group, similar consumption was expected. However, similar
levels of grams consumed between the 12 bite group and the 22 bite group was unexpected. The
explanation was found in that the 12 bite group took significantly larger bites compared to free
eaters and those in the 22 bite group.
The underlying causal mechanism for this change in bite size in the 12 bite group is
uncertain. However, it can be inferred that some characteristic of the verbal instructions for the
low goal (i.e. telling them to take 12 bites) caused this change. One possible explanation is that
participants perceived the 12 bite instruction to be well below the lower boundary of the zone of
indifference. Thus in an effort to reach satiety, while still achieving the goal, they increased their
bite size. This purposeful change in behavior provides some evidence that the low goal was
outside of the zone of indifference.
There is also evidence that suggests the 22 bite target used in the second study fell
outside of the zone of indifference as well. Although no bite size change was observed in this
condition participants fell short of reaching their goal, on average 4.5 bites short. This suggests
that the 22 bite goal may have been perceived as being above the high boundary of the zone of
indifference. If the 22 bite goal had been perceived as within the zone of indifference,

10
participants should have reached the goal. It is possible that participants believed eating all the
way to the high goal would have resulted in an uncomfortable level of fullness.
The findings from the previous study offer up one major question: what are the
boundaries of the zone of indifference in which individuals will successfully take different
number of bites without altering bite size while reporting comparable post-meal satiety? The
current study attempted to answer this question by identifying the threshold between
inappropriate and appropriate bite targets that result in bite size change. Additionally, the study
examined if having an instruction presented in a way that makes participants aware of the target
“take x number of bites” replaced by an instruction that hides the exact target from the
participants “stop at the alarm,” would prevent bite size change, regardless of the bite target.
Current Study
The purpose of the current study was to determine if the zone of indifference is
quantifiable by assigning values to the upper and lower boundaries of the zone in terms of the
number of bites taken by eaters in a laboratory without altering other behaviors, e.g., bite size.
The identification of this zone could assist in determining what information can be given to
individuals that will result in a reduction of intake but not a decrease in ratings of satiety.
In an effort to quantify the lower and upper boundaries, bite target (12-22 bites) and bite
target presentation (alarm vs. bites) were manipulated. The purpose of the bite target
manipulation was to capture a range of bites in which the expected zone would fall, but also to
include bite targets that would fall outside either end of the zone. The purpose of the bite target
presentation manipulation was to either make participants aware by telling them their bite target,
or to keep them unaware by telling them to stop eating when an alarm sounds. If participants are
aware of their target, as they approach the boundaries of the zone they may change their behavior

11
in order to compensate, e.g., change their bite size. If they are kept unaware of their target their
behavior should not change regardless of the target’s relation to the zone. The range of bites
presented in the bite target manipulation should allow for behavior change in the bites condition
to be observed.
A change in bite size is a critical behavior change that suggests participants are trying to
compensate for some abnormality in their eating environment. Hence, an aware participant may
exhibit bite size change in response to having a bite target outside of the zone. If the bite target
is perceived as an appropriate amount of food, there would be no motivation to change bite size.
Bite target presentation may also effect eating behaviors such as bite size. Changes in
behavior were expected in the bites condition when participants were given bite targets outside
of the zone. However, no changes in behavior were expected for those in the alarm condition.
The alarm in the alarm condition acted as a cue to stop eating similar to the cue provided by the
bite target number in the bites condition. However, this cue differed in the sense that participants
were not informed as to when the alarm would sound. Since the bite target at which the alarm
was set to go off was unknown to the participants, the participants should not have changed their
behavior in response to being told to cease eating when the alarm sounded. For example, when
participants were told to take 12 bites, they may have perceived that number to be
inappropriately low and thus made the decision to take larger bites than normal. However, if
instead participants were told to stop at the alarm, which was set at 12 bites, participants would
not be able to pre-judge the alarm setting as low, normal, or high, and thus would not be able to
make decisions to change behavior, unless they had suspicions about when the alarm would
sound. Thus, if the presence of the bite target number made participants aware and led them to

12
change their bite size, an alarm at an undisclosed level should render them unaware with no pre-
judged need to change bite size.
In reference to the alarm condition, if an alarm goes off in the “zone of indifference” no
reaction is to be expected. If the alarm goes off outside the lower boundary of the zone,
judgments may occur such that people would think “I’m not done,” would react by taking one or
two large bites prior to stopping and rate being less than fully satiated. Similarly, if the alarm
goes off outside the upper boundary of the zone, judgments may occur such that people may
think “I’m getting too full” and take smaller bites or stop. Judgments can also occur as a result of
receiving the bites condition in the form of pre-judgments, judgments during eating (reassessing
after each bite, “Will I be able to reach fullness the way I feel at this current bite?”), or nearing
completion.
Design
This study was a 2 x 6 between-subjects design. The first IV was PRESENTATION and
had two levels: alarm (A) where participants were instructed to stop eating when an alarm
sounded and bites (B) where participants were told how many bites to take. The second IV was
TARGET and had six levels: 12, 14, 16, 18, 20, 22. Each target level represented a number of
bites at which an alarm would sound or the number of bites the participants would be instructed
to take. The main DV’s of the study were bite count, grams consumed, bite size, and post-meal
satiety. The experimental design table can be found in Table 1.

13
Table 1. Experimental design table. The study was a 2 x 6 between-subjects design. The
individual cells are labelled with “A” for alarm condition and “B” for bites condition, crossed
with each of the bite targets “12”, “14”, “16”, “18”, “20” and “22”. Hence, throughout the
remainder of the manuscript, individual cells and contrasts can be referred to using this cell
nomenclature, e.g. A12 vs. B12.
Hypotheses
The following hypotheses were informed by the results of Jasper et al., (2016). The
results from that study showed that free eaters, individuals who wore the Bite Counter and
received bite count feedback, but were not given any instruction or goals, took 18 bites on
average.
Bite Count
H1: In the alarm condition (A), it was hypothesized that bite count would be positively
correlated with bite target, such that each increase in bite target would correspond to a
subsequent significant increase in bite count. Results from Wilson (2015) suggest that
participants would stop eating once the alarm sounds26. As a result, it was expected that
participants would successfully eat to their bite targets in each condition using the alarm. Figure
6 shows hypothesized bite count by participants in the alarm condition at each bite target relative
to those in the bites condition and free eaters.
H2: In the bites condition (B), it was hypothesized that bite count would increase until the
upper boundary of the zone was met, after which bite count would level off and hold constant.
TARGET
PR
ES
EN
TA
TIO
N
12 14 16 18 20 22
Alarm
(A)
A12 A14 A16 A18 A20 A22
Bites
(B)
B12 B14 B16 B18 B20 B22

14
Results from Jasper (2016) showed that participants would fail to reach a bite target if that target
is perceived as unreasonably high. Figure 6 shows hypothesized bite count by participants in the
bites condition at each bite target relative to those in the alarm condition and free eaters.
Figure 6. Expected results for bite count by presentation type for each bite target relative to free
eaters. The zone of indifference is highlighted by the orange rectangle and hypothesized to be
between 16-20 bites. In the alarm condition, as bite target increases bite count increases. In the
bites condition, as the bite target increases bite count increases until the bite target reaches the
upper boundary of the zone where bite count then levels off and holds constant.
Grams consumed
H3: In the alarm condition, it was hypothesized that grams consumed would be positively
correlated with bite target, such that each increase in bite target would correspond to a
subsequent significant increase in grams consumed. Figure 7 shows hypothesized grams
consumed by participants in the alarm condition at each bite target relative to those in the bites
condition and free eaters. The figure shows that as bite target increases, grams consumed
increases.
0
5
10
15
20
25
12 14 16 18 20 22
Bit
e co
un
t
Target
Bite Count
Alarm Bites Free eaters

15
H4: In the bites condition, it was hypothesized that grams consumed would decrease as
the bite target crosses the lower boundary of the zone, increase as the bite target traverses the
zone, and would continue to hold at the same level as the bite target exits the upper boundary of
the zone. Results from Jasper (2016) showed that participants compensate for perceived low bite
targets (i.e. 12 bites) by taking larger bites. This change in bite size may offset bite count to such
an extent that participants end up consuming more food than participants in conditions with
perceived reasonable bite target. Figure 7 below shows hypothesized grams consumed by
participants in the bites condition at each bite target relative to those in the alarm condition and
free eaters.
Figure 7. Expected results for grams consumed by presentation type for each bite target relative
to free eaters. In the alarm condition, as bite target increases, grams consumed increases. In the
bites condition, as the bite target approaches the lower boundary of the zone grams consumed
decreases. As the bite target increases from the lower boundary to the upper boundary of the
zone grams consumed increases. As bite target increases beyond the upper boundary grams
consumed levels off and holds constant.
0
20
40
60
80
100
120
140
160
180
200
12 14 16 18 20 22
Gra
ms
Target
Grams consumed
Alarm Bites Free eaters

16
Bite Size
H5: In the bites condition, it was hypothesized that bite size would increase below the
lower boundary of the zone of indifference. Results from Jasper (2016) showed that participants
would increase their bite size when given a perceived, unreasonably low bite target. Figure 8
shows hypothesized bite size by participants in the bites condition at each bite target relative to
those in the alarm condition and free eaters. There was no hypothesized effect of bite target on
bite size in the alarm condition.
Figure 8. Expected results for bite size by presentation type for each bite target relative to free
eaters. In the bites condition, as the bite target approaches the lower boundary of the zone bite
size decreases. There is no change in bite size as the bite target increases beyond the lower
boundary of the zone. In the alarm condition, there is no effect of bite target on bite size.
Post-meal satiety
H6: In the alarm condition, it was hypothesized that satiety levels would decrease below
the lower boundary of the zone and increase beyond the upper boundary of the zone relative to
ratings within the boundaries of the zone. Since participants in the alarm condition would not
0
2
4
6
8
10
12
14
16
12 14 16 18 20 22
Gra
ms
per
bit
e
Target
Bite size
Alarm Bites Free eaters

17
know their bite targets, they would not change their behavior in such a way that they end their
meal within the zone if given a target outside of the hypothesized zone. In other words,
participants with low bite target would stop eating before satiation, and participants with high
bite target would eat beyond fullness. Figure 9 shows hypothesized post-meal satiety ratings by
participants in the alarm condition at each bite target relative to those in the bites condition and
free eaters. There was no hypothesized effect of bite target on satiety in the bites condition, as it
is expected that smaller bite targets will result in larger bite sizes (and vice-versa), resulting in
relatively balanced satiety levels across all bite targets.
Figure 9. Expected results for post-meal satiety by presentation type for each bite target relative
to free eaters. In the alarm condition, as bite target increases to the lower boundary of the zone
post-meal satiety ratings increase. No change in post-meal satiety ratings will be observed as
bite target increases from the lower to the upper boundary of the zone. As the bite target
increases beyond the upper boundary of the zone post-meal satiety ratings increase. In the bites
condition there is no effect of bite target on post-meal satiety ratings.
0
10
20
30
40
50
60
70
80
90
100
12 14 16 18 20 22
Sati
ety
rati
ng
Target
Post-meal satiety
Alarm Bites Free eaters

18
Methods
Participants
This study was reviewed and approved by Clemson University’s Institutional Research
Board. Participants were recruited in groups of four from the student population of Clemson
University using the Psychology Department’s internal human subjects recruitment system.
Specifically, four male and four female participants were recruited for each session for a total of
eight participants to fill four slots per session. A minimum of three participants were required to
run a session. This recruitment method was used to assist in balancing gender in each condition.
The objective was to run four different sessions per condition: one all male, one all female, and
two mixed sessions. Those with a history of eating disorder were not allowed to participate.
Participants received four credits towards their class required research participation.
Required sample size was calculated using Jasper et al., (2016) and the Power and
Sample Size program (Dupont & Plummer, 2009). A power analysis was completed to
determine the optimal sample size for the current study. The following values were used as
inputs for the power analysis. An alpha = .05, power = .8, mean difference = 5.3, within group
standard deviation = 3.6 (pooled), and an experimental/control ratio = 1. A sample size of eight
per condition was calculated. The current study was interested in also detecting potentially
weaker effects of bite target. In order to increase the change of finding these potentially weaker
effects, the current study was over powered and the sample size per condition was doubled to 16.
After balancing for gender and condition sample size, a total of 208 subjects were used for the
study (107 Female, Age 16 – 30yrs, BMI 14.9 - 52, 179 Caucasian).
This study used historical data for conditions B12 and B22. These data were obtained
from Jasper et al., (2016). New data were collected for all of the other conditions. The data

19
collection procedure for these historical data was similar to the new data collection procedure
with several very important differences. The historical data used an earlier version of the Bite
Counter device (described in Materials) that had a different display. Both devices displayed bite
count in a number, but the newer device also displayed “BITES". Other differences include a
different male experimenter used for B12 only and the data collection occurred in a different
year and season. A list of the considerations concerning the historical data and the current study
data can be found in Appendix G.
Materials
Study Meal. Stouffer’s brand party size macaroni & cheese was used as the meal. This
meal was selected because it was easy to prepare in the laboratory, was acceptable for either
lunch or dinner, and is amorphous and thus can be eaten in different sized bites. This item was
also selected because it provided the necessary amount of macaroni and cheese in a single
package required for each experimental session. This item also performed well as the food item
for Jasper (2016). The food was served on Chinet Classic White Dinner Plates, which had a
diameter of 26.4cm. The meal was prepared in a Proctor Silex 18 quart Roaster Oven. The
roaster oven fits in the lab and allows for the frozen macaroni and cheese to be prepared safely.
The macaroni and cheese was heated for 90 minutes at a temperature of 232.2o C before serving.
Bite target. The bite target started at 12 and increased in increments of two up to 22.
The lower and upper bounds, 12 and 22 respectively, come from Jasper (2016). Twelve bites
represent a bite target level low enough to elicit a bite size change compared to free eaters,
specifically an increase in bite size. Twenty two bites represent a bite target that is high enough
that most eaters will have difficulty reaching the target. The average bite count of free eaters
using the current plate size was 17.9 with a SD of 5.2. Thus the current bite target range

20
represents the average bite count of free eaters plus/minus one standard deviation. The bite
target was given to subjects either by an instruction on how many bites to take, or they were
given an instruction to stop eating when an alarm sounds.
Bite Counter. The Bite Counter is a watch-like device that uses a gyroscope and
computer algorithm to detect a wrist-roll motion (Figure 12) that is characteristic of taking a bite
of food. The Bite Counter monitors intake by counting bites. The device has to be turned on at
the start of eating and off at the end of eating. During eating it can display bite count for the
current eating activity (EA) in real-time. Between meals, the device has a user review function
which when pressed can display total bite count for the day, steps taken, among other
information. For the current study, bite count was displayed in all conditions during eating. In
addition, all participants, in all conditions were told that the device displays bite count. The only
difference in the functional operation of the device was that in the alarm condition, the alarm was
set to sound at the target, whereas in the bites condition, participants were told to stop eating
when the bite count on the device reached the target.
Furthermore, two versions of the Bite Counter were used for this study. The historical
data used for conditions B12 and B22 were collected using an early version of the Bite Counter
(Figure 10). The new data was collected using a newer Bite Counter (Figure 11). The two
versions of the Bite Counter operate similarly but differ in their size and display visibility.
Specifically, the earlier device was 44 x 44 x 12 mm with a display size of 20 x 8 mm. The
newer device is 34 x 35 x 12mm with a display size of 25 x 15 mm. The potential limitations
presented by the use of two separate devices are addressed in the Limitations section.

21
Figure 10. Early version of the Bite Counter
Figure 11. New version of the Bite Counter.
Figure 12. Schematic of wrist roll motion.
Instrumented eating station. Participants ate in groups of four at a table customized for
the purpose of monitoring bite count and food weight (Figure 13). The table included four scales
hidden in recesses cut out at each place setting. Four cameras were mounted above the eating

22
station, each monitoring one participant. All of the measuring equipment was connected to two
laptops (Dell Latitude E6520) that were located near the eating station (Figure 14).
Figure 13. The eating station with recessed scale revealed at station 2.
Figure 14. Two Dell Latitude E6520 laptops were used to store raw sensor data.
Cisco PVC300 cameras. Four Cisco PVC300 cameras were mounted above the eating
station, each positioned to monitor food as it was brought from the plate to the mouth (Cisco
Systems, Inc., San Jose, CA). The video recordings were used to clarify any questions about an
eating session that arose after the session was complete.

23
Satiety Labeled Intensity Magnitude (SLIM) scale. The SLIM scale allows for a
quantitative index of hunger and fullness. Developed by Cardello, Schutz, Lesher, and Merrill
(2005), the SLIM scale is a sensitive, reliable, and easy-to-use scale for measuring perceived
satiety. The SLIM scale can be found in Appendix A. The SLIM scale is a 100mm long visual
analog scale anchored at the low and high ends by ‘Greatest Imaginable Hunger’ and ‘Greatest
Imaginable Fullness’ respectively and the zone of indifference is expected to fall between
‘Slightly Hungry’ and ‘Slightly Full’, or 41-66 numerically.
Measures
The main dependent variables for the current study were bite count, grams consumed,
bite size, and post-meal satiety. Bite count was collected for each participant using the Bite
Counter. True bite count was also obtained using the “ground truthing” method which involves
watching videos of the eating sessions and counting each bite, however true bite count was not
used for analyses based on findings from Jasper et al., (2016) that found no significant difference
in device bite count and true bite count. Grams consumed were calculated using the pre and post
eating measurements recorded by hidden scales. Bite size was calculated by dividing grams
consumed by bite count. Post-meal satiety was measured using the visual-analog SLIM scale.
Procedure
To ensure that each Bite Counter was free of existing data, the devices were reset using
the computer based Bite Counter software prior to each experimental session. To reset each
device, the Bite Counters were connected to a laptop PC via the USB cable and then cleared
using the software.
On the day of the scheduled experimental session, participants entered the laboratory and
completed both an informed consent form as well as a demographic questionnaire. The

24
participants were then introduced to the study. Following the introduction, height and weight
were measured and recorded and used to derive BMI. Hip and waist circumference and body fat
percentage were also measured. Next, each participant completed the first of four SLIM scales19
which recorded their current satiety levels. Next, each participant completed the relationship
questionnaire. Upon completion of the measurements and questionnaires, the participants were
moved to the instrumented eating station. The macaroni and cheese was then removed from the
roaster oven and placed at the center of the pre-set table.
The participants were instructed to not touch the macaroni and cheese container as it was
hot and to listen to all instructions carefully before serving themselves and eating. The
instructions can be found in the Appendix B along with the rest of the experimental script.
Included in the instruction was the independent variable of TARGET, “please take XX bites” if
they were to receive the bites condition or “please stop eating when the alarm sounds,” if they
were to receive the alarm condition.
After the spoken instructions, participants completed the second SLIM scale. The second
SLIM scale was introduced here to determine if the presence of the food or relocation to the
eating station had an effect on satiety. Participants were then instructed to put on the Bite
Counter. To ensure proper usage of the Bite Counter, a visual demonstration was given.
Participants were told to “turn on the Bite Counter by pressing the top button once, you will hear
a series of beeps, the device will read “HELLO” and then display “0 BITES” indicating the
device has been turned on.” For the current study, bite count was displayed for all conditions. As
stated in the materials section, all participants in all conditions were told that the device displays
bite count. The only difference in the functional operation of the device was that in the alarm

25
condition, the alarm was set to sound at the target, whereas in the bites condition, participants
were told to stop eating when the bite count on the device reached the target.
Participants were then allowed to serve themselves one at a time. Upon self-serving
their desired portion of macaroni and cheese, participants were instructed to wait until instructed
before eating in order for the experimenters to obtain a stable weight of the portion served. Once
a stable weight was recorded the participants were instructed to turn on their Bite Counters and
commence eating.
The participants were encouraged to eat as naturally as possible and were allowed to
converse with the other participants. Once a participant indicated that they were finished with
their current course and would like additional servings, plate waste weight was recorded by the
experimenters. The experimenter then served any additional servings to the participants so as to
not interfere with the on-going Bite Counter recording. Specifically, the experimenter served an
amount as requested by the participant. Once the additional serving was served, the participants
again waited for the experimenter to obtain a stable weight before being instructed to continue
eating. If a participant finished eating and no additional servings were desired, plate waste was
measured and the participant was instructed to “Turn the Bite Counter off by again pressing the
left button, you will hear a series of beeps indicating the device has turned off.” The participants
were then instructed to complete a post-meal SLIM scale identical to the pre-meal SLIM scales.
A 10-minute timer was set for each participants following the completion of this third SLIM
scale. Participants waited at the table until all participants had finished eating. Once all
participants finished they were instructed to gather their SLIM scales and find their place at the
main table where they were to complete the eating behavior questionnaire. Once they finished
their eating behavior questionnaire they were instructed to wait patiently until the 10 minute

26
timer sounds. Once the timer for each participant sounded, they were instructed to complete
their last SLIM scale. Once all final SLIM scales had been completed the participants were
provided with a debriefing of the study. The debriefing can be found in Appendix B.
Participants were then offered a copy of the consent form they signed prior to starting the study
and were dismissed.
Data were downloaded from the Bite Counters by connecting to a laptop PC and using
the Bite Counter software. Thus, after completing each experimental session, the Bite Counters
were again connected to a laptop PC via USB cable. Using the Bite Counter software, data from
each device were saved with the participant’s study ID number and the files placed in a
designated folder. After saving the data from the completed experimental session, the Bite
Counters were cleared of the data. Each experimental session used Bite Counters with no data
on them.
Analysis
The current study was a planned contrasts study27. A contrast is a linear combination of
means whose numerical weights add up to zero, allowing comparison of different treatments.
This procedure allows for the comparison of one mean to another single mean or a combination
of means. An important element of the planned contrasts approach is limiting the size of the
family of contrasts a priori to just those of interest. By limiting the number of tests to only those
of interest (as opposed to exploring all possible comparisons), more powerful tests of the
contrasts are ensured when the familywise error rate is controlled. In order to set an upper bound
on overall significance level in response to changes in familywise error rate due to increase in
number of significant tests being performed, a Modified Bonferroni Procedure was conducted28.
Furthermore the Welch’s T was used in all instances due to concerns over the potential for

27
unequal variances between the conditions29. The planned comparisons of interest are detailed in
Table 2.
In addition to individual planned comparisons, a contrast test was conducted to compare
variable data questioned to be “inside” the zone to variable data at bite targets suggested to be
outside of the “outside” the zone. This specific contrast test aided in highlighting whether a zone
boundary existed between specific bite targets30.
Table 2 has a list of the individual planned comparisons. These comparisons are where
significant differences were expected to be observed. These planned comparisons compared
observations from the alarm condition to the corresponding cell of the same bite target in the
bites condition. For example, the first planned comparison compared bite count by those given
the alarm condition set at 16 bites (A16) to those given the bites condition at 16 bites (B16).
There were also planned comparisons examining grams consumed and bite size for presentation
type.
TARGET
DV 12 14 16 18 20 22
Alarm
vs.
Bites
# of Bites * * *
Grams * * *
Bite size * *
Satiety
Table 2. Experimental design. An asterisk indicated the cell that was compared between the
alarm and the bites conditions.
TARGET
DV 12 14 16 18 20 22
Alarm vs.
Bites
# of Bites = = = = = <
Grams > > = = = <
Bite size > > = = = =
Satiety > > = = = <
Table 3. The above table shows the expected zone of indifference in the orange box. The
symbols in the table indicate expected directional results of those in the bites condition relative
to those in the alarm condition for each dependent variable.

28
RESULTS
Subjects
Before conducting statistical analyses, the data were checked for outliers for all
dependent variables. To identify outliers, first the interquartile range (IQR) was calculated for
each condition. Next, data points that were three times less than the IQR from the 25th percentile
and three times greater than the IQR from the 75th percentile were identified as potential outliers.
For example the IQR for condition B12 was 1. The 25th percentile was 12 and the 75th percentile
was 13. Thus data points that were three times the IQR (3 x 1 = 3) less than 12 or greater than 13
were identified as outliers. Using these values, two data points were identified as outliers,
having values of eight and 17 respectively. Using this method, outlier analysis was conducted on
the main dependent variable bite count fist, and identified 14 participants as outliers. These
individuals had recorded bite counts of three times less than the IQR from the 25th percentile or
three times greater than the IQR from the 75th percentile for their respective conditions. These
data from participants identified as outliers were further checked for proper entry and any
notable considerations prior to removal. One participant noted that they took a last bite that
wasn’t counted. The detection of this bite would have excluded this data point from being
considered an outlier. Thus, thirteen of the 14 participants were removed. Outlier analysis
conducted for the other dependent variables identified no additional outliers.
A breakdown of final sample size used for analysis by condition can be found in Table 4.
Furthermore, data from dependent variables used for the planned comparison were checked for
normality using the Shapiro-Wilk test. Specifically, bite count, grams consumed, and bite size
were checked for normality. Due to the nature of the bite count data, non-normally distributed

29
data was expected, with the majority of the data containing the same value within a condition.
Data for grams consumed were normally distributed. Data for bite size were normally
distributed with the exception of B12 and B22. A table containing the results of the normality
tests for each dependent variable can be found in Appendix C.
TARGET
Present. 12 14 16 18 20 22
Alarm
N
Age
BMI
Female
16
18.7±0.7
24.3±5.6
8
12
20.3±2.1
26.4±3.4
6
16
19.7±2.5
24.7±6.2
7
14
20.4±2.3
25.4±8.4
7
16
20.1±2.7
22.5±2.7
10
14
23.2±4.0
24.7±4.1
4
Bites
N
Age
BMI
Female
26
18.3±1.0
22.7±3.0
14
16
19.1±0.7
24.0±3.7
9
15
19.1±1.2
26.0±6.4
8
14
18.6±0.6
22.9±3.2
7
14
18.6±.06
23.7±5.2
7
22
18.8±1.4
22.2±1.8
11
Table 4. Subject demographics by condition. Sample size, age, BMI, and sex.
Hypothesis Tests
The following section contains the results graph for each dependent variable by
presentation type. Following each graph is a table of the planned t-tests for that dependent
variable. A modified Bonferroni was conducted to control for familywise error rate. The
modified Bonferroni procedure works by adjusting the critical alpha value when running
multiple tests within a single dependent variable. The critical alpha value is divided by each
number of test with a single dependent variable, reducing the critical value with each test. This
procedure provides a set of critical values by which the significance of the group of tests can be
compared. The test with the highest significance value is compared against the highest critical
value, then the next highest significance value is compared against the next highest critical value,

30
and so on for the remainder of the tests. The Bonferroni procedure was conducted for each
group of planned comparisons for bite count, grams consumed, and bite size. The new critical
values for each test are provided in the tables below.
Bite Count
Hypothesis one (H1) stated that in the alarm condition, bite count would be positively
correlated with bite target, such that each increase in bite target would correspond to a
subsequent increase in bite count. A Pearson correlation was calculated to assess the relationship
between bite target and bite count in the alarm condition. A strong, statistically significant
positive correlation was found between bite target and bite count (r= .765, n = 195, p <0.001),
supporting the hypothesis. Participants were given the instruction of eating to an alarm, however
the level at which the alarm was set was unknown to the participants. It may be possible that
since participants were unaware of when the alarm would sound they were deprived of a
criterion (i.e. bite number) against which they could make judgments, judgments that might
otherwise result in an observable change in behavior or an outright failure to reach the target. In
other words, since participants were blinded to the level of their alarm it’s feasible they felt no
reason or motivation to change their eating behavior as seen in the bites condition. This was in
fact observed in participants’ ability to eat to their alarm successfully regardless of the bite target
at which the alarm was set.
Hypothesis two (H2) stated that in the bites condition, bite count would increase until the
upper boundary of the hypothesized zone is met (B20), after which bite count would level off
and hold constant. Results support this hypothesis. As can be seen in Figure 14, bite count does
not increase past B20 and there was a significant difference in mean bite count for B20 (20.1±.3)
and B22 (17.5±4.8) conditions; t(21.2) = 2.46, p = 0.023. As can be seen in Table 5,

31
participants told to take 22 bites failed to do so, taking on average 4.9 bites less than those given
the alarm at 22 bites. As opposed to the alarm condition, by providing participants with an overt
target, i.e., a specific number of bites to take, participants were able to make judgments based on
preconceived notions of how much one should eat. In this specific case, it is possible
participants judged the degree to which they believe their assigned bite target was appropriate for
the given context. In other words, participants may have judged whether their assigned bite
target was less than normal, normal, or greater than normal for the current eating context. An
evaluation of bite count in the bites condition supports this notion. Specifically, when told to
take 22 bites participants failed to do so compared to those given the alarm at 22 bites who
successfully did. This finding supports the hypothesis that a verbal 22 bite target may be
perceived as too many bites under this paradigm.
Planned comparisons for bite count can be found in Table 6. As can be seen, a
significant difference was found between A22 (22.5±1.5) and B22 (17.5±4.8); t(26.9) = 4.5, p<
0.001.
Figure 15. Graph of means for number of bites by presentation type.
0
5
10
15
20
25
12 14 16 18 20 22
Nu
mb
er o
f b
ites
Target
Bite Count
Alarm Bites

32
TARGET (mean ± SD)
Presentation 12 14 16 18 20 22
Alarm (A) 12.4±1.3 13.9±.3 16.3±.4 18.2±1.3 19.0±3.0 22.5±1.5
Bites (B) 12.2±1.1 14.5±.8 16.3±.7 18.0±.0 20.1±.3 17.5±4.8
Table 5. Mean and standard deviations for bite count per condition.
New critical
value Bites (B) condition
TARGET Old crit / test # 16 20 22
Alarm (A)
condition
16 .05 / 1 = .05 -.08 ± .21,
p= 0.705
20 .05 / 2 = .025
-1.1 ± .75,
p= 0.177
22 .05 / 3 = .016
4.9 ± 1.1,
p< 0.001
Table 6. Planned comparisons for bite count. Each planned comparison cell contains: mean
difference ± standard error difference (alarm minus bites), and p-value. Comparisons A16 v
B16, A20 v B20, and A22 v B22 had the first, second, and third highest p-values respectively
and thus were compared to the first, second, and third new critical values provided by the
modified Bonferroni procedure. Cells in BOLD indicate significant differences.
Grams consumed
Hypothesis three (H3) stated that in the alarm condition, grams consumed would be
positively correlated with bite target, such that each increase in bite target would correspond to a
subsequent increase in grams consumed. A Pearson correlation was computed to assess the
relationship between bite target and grams consumed in the alarm condition. A mild to
moderate, statistically significant positive correlation was found between bite target and grams
consumed (r = .303, n = 195, p <0.001), thus supporting the hypothesis. This was to be expected
as grams consumed and bite count have been shown to be highly correlated27. Similar to H1,
relating the alarm condition to bite count, providing an alarm deprives the participants of a
criteria against which they can judge the “normality” of their target – thus they do not change
their behavior, i.e. bite size. Since no change in bite size was expected or observed in the alarm

33
condition, the findings that grams consumed was positively correlated with bite target is of no
surprise.
Hypothesis four (H4) stated that in the bites condition, grams consumed would decrease
as the bite target crosses the lower boundary of the hypothesized zone (B14 B16), increase as
the bite target traverses the hypothesized zone (B16 B20), and would continue to hold at the
same level as the bite target exits the upper boundary of the hypothesized zone (B20 B22).
Results do not support this hypothesis. As can be seen in Figure 15, grams consumed increased
as from B14 (207.94±52.36) to B16 (235.59±89.38), however the difference was not significant
t(22.3) = -1.04, p = 0.308. Furthermore, grams consumed held constant between B16 and B20.
Finally, grams consumed decreased significantly between B20 (233.01±56.57) and B22
(174.55±58.36); t(28.5) = 2.99, p= 0.006. It was expected that a change in bite size below B16
(described below) would have a significant enough effect that total grams consumed in those
conditions would be greater than those conditions with a higher bite target but no expected
change in bite size. Results show that grams consumed increased as bite targets increased from
B12 to B16. An examination of bite size (below) indicates increased bite sizes at B12, B14, and
B16 relative to others. Since targets B12-B16 reported increased yet similar bite sizes, it can be
expected that grams consumed would increase as the targets increase from B12 to B16. As bite
size returns to normal at B18, grams consumed decreased. Grams consumed then increased
slightly as bite target increases B18 to B20. However, once beyond B20, grams consumes
decreased. This decreased consumption at B22 can be seen as a result of individuals failing to
eat to the bite target of 22.
Planned comparisons for grams consumed can be found in Table 8. As can be seen, once
the modified Bonferroni procedure is conducted, the difference found between A12

34
(137.65±58.34) and B12 (175.82±60.37); t(32.8) = -2.03, p= 0.05 was found to be significant.
Additionally, the difference between A14 (160.36±50.43) and B14 (207.94±52.36); t(24.3) = -
2.43, p= 0.023 was found to be significant. Finally, a significant difference was found between
A22 (289.41±80.01) and B22 (174.55±58.36); t(21.8) = 4.64, p< 0.001.
Figure 16. Graph of means for grams consumed by presentation type.
TARGET (mean ± SD)
Presentation 12 14 16 18 20 22
Alarm (A) 137.7±58.3 160.4±50.4 188.1±63.0 191.9±54.0 229.0±72.1 289.4±80.0
Bites (B) 175.8±60.4 207.9±52.4 235.6±89.4 220.5±47.2 233.0±56.6 174.6±58.4
Table 7. Mean and standard deviations for grams consumed per condition.
0
50
100
150
200
250
300
350
12 14 16 18 20 22
Gra
ms
Target
Grams Consumed
Alarm Bites

35
New critical
value Bites (B) condition
TARGET Old crit / test # 12 14 22
Alarm (A)
condition
12 .05 / 1 = .05 -38.2 ± 18.8,
p= .05
14 .05 / 2 = .025
-47.6 ± 19.6,
p= 0.023
22 .05 / 3 = .016
114.9 ± 24.7,
p < 0.001
Table 8. Planned comparisons for grams consumed. Each planned comparison cell contains:
mean difference ± standard error difference (alarm minus bites), and p-value. Comparisons A12
v B12, A14 v B14, and A22 v B22 had the first, second, and third highest p-values respectively
and thus were compared to the first, second, and third new critical values provided by the
modified Bonferroni procedure. Cells in BOLD indicate significance.
Bite size
Hypothesis five (H5) stated that in the bites condition, bite size would increase below the
lower boundary of the hypothesized zone (B12-B14). Results partially support this hypothesis.
As can be seen in Figure 16, mean bite sizes at B12, B14, and B16 are greater than at bite targets
18, 20 and 22; t(68.4) = -3.53, p < 0.001. This could be due to an intentional increase in bite size
to compensate for a perceived inadequate food quantity. If true, this change in behavior supports
the hypothesis that bite targets of 16 and fewer may be perceived as too few under the current
paradigm. In other words, participants may have felt that to reach satiety and “make every bite
count” they needed to take larger bites than normal.
Planned comparisons for bite size can be found in Table 10. No differences were found
between the alarm condition and bites condition for either bite target 12 or 14.

36
Figure 17. Graph of means for bite size by presentation type.
TARGET (mean ± SD)
Presentation 12 14 16 18 20 22
Alarm (A) 11.2±5.3 11.5±3.8 11.3±4.3 10.5±3.1 12.4±4.4 12.8±3.4
Bites (B) 14.6±5.5 14.4±3.7 14.5±5.7 12.2±2.6 11.6±2.8 10.4±3.7
Table 9. Mean and standard deviations for bite size per condition.
New critical value Bites (B) condition
TARGET Old crit / test # 12 14
Alarm (A)
condition
12 .05 / 2 = .025 -3.3 ± 1.7 ,p= 0.063
14 .05 / 1 = .05 -2.8 ± 1.4, p= 0.064
Table 10. Planned comparisons for bite size. Each planned comparison cell contains: mean
difference ± standard error difference (alarm minus bites), and p-value. Comparisons A14 v B14
and A12 v B12 had the first and second highest p-values respectively and thus were compared to
the first and second new critical values provided by the modified Bonferroni procedure.
Post-meal satiety 1 (immediately following meal)
Hypothesis six (H6) stated that in the alarm condition, satiety levels would decrease
below the lower boundary of the hypothesized zone (A12-A14) and increase beyond the upper
boundary of the zone (A22) relative to ratings within the boundaries of the zone (A16-A20).
Results partially support this hypothesis. As can be seen in Figure 17, satiety rating levels
decrease below A18 and increase above A20 relative to ratings between A18 and A20. This
0
2
4
6
8
10
12
14
16
18
12 14 16 18 20 22
Gra
ms
per
bit
e
Target
Bite Size
Alarm Bites

37
indicates that satiety levels did not change much between A18 and A20 possibly due to the
participants being within the “zone of indifference.” A full explanation of how the zone related
to these findings can be found in the discussion section.
Figure 18. Graph of means for post-meal satiety immediately following completion of the meal
by presentation type.
TARGET(mean ± SD)
Presentation 12 14 16 18 20 22
Alarm (A) 44.0±14.7 51.5±14.2 54.7±15.0 65.4±16.7 64.1±13.3 63.8±14.1
Bites (B) 49.4±15.7 54.8±18.1 54.1±18.3 65.5±14.5 65.3±14.7 73.1±14.7
Table 11. Means and standard deviations for post-meal satiety ratings immediately following the
meal.
0
20
40
60
80
100
12 14 16 18 20 22
SLIM
rat
ing
Target
Post-meal satiety (Immediately)
Alarm Bites

38
Post-meal satiety (10 minutes after completion of meal)
Figure 19. Graph of means for post-meal satiety 10 minutes following completion of the meal by
presentation type.
TARGET (mean ± SD)
Presentation 12 14 16 18 20 22
Alarm (A) 53.6±11.7 60.0±17.7 57.0±14.0 66.3±15.9 66.7±13.4 58.4±14.9
Bites (B) 49.4±15.7 62.9±18.1 61.5±14.3 63.7±13.9 69.6±18.6 73.1±14.7
Table 12. Means and standard deviations for post-meal satiety ratings 10 minutes following the
completion of the meal.
0
20
40
60
80
100
12 14 16 18 20 22
SLIM
rat
ing
Target
Post-meal satiety (10 minutes after)
Alarm Bites

39
Discussion
The purpose of this study was to determine if the zone of indifference was quantifiable by
assigning values to the lower and upper boundaries of the zone. Specifically, it was to assess at
what bite targets, given via two different types of presentation, changes in number of bites,
grams consumed, bite size, and satiety would be observed.
Zone of indifference
As previously defined, the “zone of indifference” describes a range of food consumption
where an individual can cease eating without reporting differences in satiety. The findings of the
present study indicate that this zone can be quantified across individuals based on bite count and
amount of food consumed.
Analyses revealed that participants told to take 22 bites failed to do so. This finding
supports the hypothesis that a verbal 22 bite target is perceived as too many bites under this
paradigm. This further supports the hypothesis that a 22 bite target is outside of the upper
boundary of the zone of indifference, as participants were too full to continue eating up to this
target. The zone of indifference represents the range of “normal eating” as perceived by an
individual. Thus, an individual given a bite target within the zone should have no problem eating
to that target. As seen in the data, participants told to take 22 bites failed to do so, thus
suggesting that a bite target of 22 is outside of the zone of indifference.
When examining bite size it was found that participants increased their bite size when
told to take 12, 14, or 16 bites relative to participants who received higher bite targets. This
change in behavior may be the result of participants believing that 12-16 bites is not an adequate
number of bites to take in order to satisfy their hunger under this context. In other words, they
are mindful that 12-16 bites may not result in satiety. This finding of a change in behavior

40
suggests that the lower boundary of the zone is in fact a little higher (bite target 18) than the
hypothesized lower boundary (bite target 16).
Post-meal satiety can further highlight the zone of indifference under the current
conditions. When mapped onto the SLIM scale described in the methods section, the zone of
indifference ranges from “slightly hungry” to “slightly full”, or 41-66 numerically. Within these
values, individuals are determined to be satiated. Individuals would not be able to report
perceptual difference in satiety levels that fall within this range. An examination of the data
shows that those told to take 20 bites reported post-meal satiety levels equal to the upper
boundary of the zone of indifference (SLIM = 66). This supports the hypothesis that 20 bites
represents the upper boundary of the zone of indifference. Furthermore, those told to take 22
bites reported post-meal satiety levels above the “slightly full” range further supporting the
hypothesis that 22 bites is outside of the zone of indifference.
Criteria for inclusion in the zone of indifference
Based on the above discussion, three criteria are suggested to determine whether or not a
bite target can be considered within the zone of indifference. These criteria are:
1. When told the number of bites to take, participants must be able to successfully eat to that
target without feeling uncomfortably full.
2. When told the number of bites to take, participants must not exhibit a purposeful change
in behavior in response to their given bite target.
3. Post-meal satiety levels must fall between 41-66 on the SLIM scale, or between “slightly
hungry” and “slightly full”, regardless of presentation type.

41
Based on the above criteria, the findings regarding bite count, bite size, and post-meal
satiety support the notion that the zone of indifference exists, and under the current context, is
18-20 bites. This is slightly narrower than the hypothesized zone of 16-20 bites.
Based on the findings we can eliminate bite target 22 from the zone as participants failed
to take 22 bites when told to do so, violating criteria 1. Furthermore, we can eliminate bite
targets 12-16 from the zone of indifference due to the increased bite size observed in participants
told to take 12-16 bites, violating criteria 2. Finally, further evidence for the exclusion of bite
target 22 from the zone is seen in satiety ratings greater than 66, violating criteria 3. This leaves
targets 18-20 as candidates for inclusion in the actual zone of indifference under the current
paradigm.
It may also be possible to use the above criteria to create an algorithm to automate the
identification of a bite target location relative to the zone. For example, based on the above
criteria, a modified “IF, THEN” statement could be written. One example of the algorithm could
be, “IF (bite target achieved), AND (no bite size change), AND (post-meal satiety = 41-66),
THEN (true = inside zone).” This type of algorithm could be used to apply the above criteria to
other eating activities taking place under difference settings and using difference food items.
Contrasts
To further investigate the suggestion that a 16-bite target and a 22-bite target are outside
of the zone and not inside the zone, a contrast test was conducted post-hoc to compare values at
bite target 16 and 22 to a new sample comprised of values from bite targets 18-20. To do this,
values between bite targets 18-20 were collapsed for each DV to create a new sample. This new
sample was then compared to the values at 16 and 22 for each DV. Significant differences
between 16 and 22 and the new 18-20 sample would provide further support that 16 and 22 are

42
outside of the zone, and that the zone is in fact 18-20 bites for the current paradigm. Results
from the test are provided in Table 13 and 14 below.
Table 13. Contrast table comparing values at bite target 16 to a new sample created containing
the values from bite targets 18-20.
Table 14. Contrast table comparing values at bite target 22 to a new sample created containing
the values from bite targets 18-20.
No significant difference were reported between 18-20 and 22. However, examining
results from the contrast test revealed a significant difference in number of bites between 16 and
18-20. This was to be expected as individuals in target levels 16, 18, and 20 were all successful
in eating to their respective targets. An interesting finding is the significant difference between
bite target 16 and 18-20 on post-meal satiety. This significant difference shows that individuals
had a perceptual difference in satiety between 16 bites and 18-20 bites. One characteristic of the
zone is no difference in satiety while inside the zone. Based on this result 16 violates that
criteria and thus the results from this test further support 16 bites as being outside of the zone.
This critical piece of evidence suggests that there is a range of bites which people can take while
still reporting similar levels of satiety. Specifically, evidence suggests that the zone of
indifference in bites under the current conditions for the meal used in this study is 18-20 bites.
Contrast Value of Contrast Std. Error t df Sig (2-tailed)
No. of bites -5.06 1.01 -5.03 189 .000
Grams -14.86 30.56 -.49 189 .627
Bite size 2.72 2.04 1.33 189 .184
Satiety -21.76 6.88 -3.17 188 .002
Contrast Value of Contrast Std. Error t df Sig (2-tailed)
No. of bites 1.30 0.96 1.36 189 .177
Grams 1.38 29.15 0.05 189 .962
Bite size -0.74 1.86 -0.40 189 .689
Satiety 8.38 6.49 1.29 188 .198

43
In other words, people can take slightly fewer or slightly more bites than they otherwise would
without knowing it because they won’t perceive differences in satiety as a result of a difference
in the number of bites they take.
Bites as an accessible unit of measure
The purpose of this study was simply to determine if there was in fact a quantifiable zone
of indifference, what the boundaries were under the current paradigm, and whether that zone
could be measured in terms of bite count. The reason bite count and bites as a unit of measure in
general are of interest is because bites may represent “accessible” unit of measure than the more
commonly used, referenced, and marketed unit of calories. For example, at the completion of
the session, participants were asked the following question: “Which request do you feel you
would be more successful at fulfilling, A) “Please take 15 bites of macaroni and cheese, or B)
“Please eat 500 calories of macaroni and cheese.” Verbal responses were near unanimous in
support of the first proposed request, the request to take a certain number of bites. This theory is
further supported by research that shows humans are poor estimators of caloric content and
caloric intake31.
This is of further interest when taking into consideration how “calorie obsessed” we are
as a society32. Examining a grocery store aisle quickly reveals this obsession in various forms
such as “100 calorie snack packs.” Additionally, a glance at a restaurant menu will reveal a
plethora of low calorie food options. It also seems that every other commercial on TV is
advertising a new lower calorie food product. Calories are marketed as the primary unit to
monitor intake, but results from this study call into question the true utility of such a measure.
From a scientific standpoint, caloric content of food is important as it provides a fundamental
understanding of the building blocks and energy content of food items. From a pragmatic

44
standpoint however, since research shows that people are poor users of calorie information even
when trained and given tools to count calories33, why keep pushing calorie information on the
public? Much research has been done on how to best get nutritional information across to the
consumer including how to increase saliency of caloric content34. As reported earlier rates of
overweight and obesity are on the rise. It seems logical, that if calorie counting was effective,
that increased investment in caloric saliency would help reduce these rates, but that is not the
case1. A goal of our research is to examine a bite count unit of measure that has been shown to
be easier to understand and respond to.
The results from this study could be used to inform nutritionists and dietitians in such a
manner that they can better guide their patients to make healthier eating decisions. For example,
results from this study show that individuals can be presented the number of bites to take to
achieve an eating target. Future studies could consider a presentation in the form of the number
of calories to take, however results from this study show that people are already apt at
responding to bite targets.
Results from this study show that there is a range of bites in which people can take more
or less, without reporting differences in satiety. Specifically, they can take different number of
bites and still satisfy their hunger. Knowing that people can respond to a presentation on the
number of bites to take, it should be feasible to identify the lowest number of bites one could
take and still feel full. Professionals could use that number to help their patients eat less while
still reaching satiety.
Satisfying hunger may be an important element of successful weight management for
most people. Perpetual hunger because of a restricted diet is one major reasons people fail to
comply with a diet over time35. Thus, if we can get people to eat a little less while still feeling

45
comfortable, we can be that much closer to reducing intake in a manageable and sustainable way
ultimately leading to a decrease in weight and increase in compliance with a weight management
protocol.
Limitations
The first limitation of this study was the use of historical data for conditions B12 and
B22. As mentioned in Methods, these historical data were collected using an early version of
the Bite Counter device. The early version and the new version of the Bite Counter differed
significantly in physical size and display visibility. This difference in device design may have
altered how participants interacted and responded to the device. Although all participants were
told the devices count bites and would display bite count as they ate, the early version of the
device only displayed a number, whereas the newer device displayed a number and the word
“BITES” underneath. Furthermore, the display on the newer device is larger than the display on
the early device. The newer device has a display size of 25mm x 15mm whereas the earlier
device had a display size of 20mm x 8mm. While the actual numbers were similar in size, the
difference in display size may have altered participants’ ability to view their bite count resulting
in different behaviors. Finally, condition B12 was administered using a different male
experimenter. It is recommended that conditions B12 and B22 be re-administered using the new
version of the Bite Counter to account for this confound presented by the two different devices
and ensure comparability of B12 and B22 to the new data that was collected.
As with most studies conducted at a university laboratory this study suffered from a
homogenous subject pool. The subject pool was primarily Caucasians with a mean age of 19.
This could be a potential weakness in part due to potential differences in eating behaviors
observed across racial groups, but also in differences in eating behaviors of college students

46
relative to non-students. For example, a college student may try to eat as much of a free meal as
possible as a result of a restricted financial situation. Future studies could examine the abilities
of different age brackets to respond to the various presentation types presented in the current
study.
Our goal was to have at least one session of all male and one all female, and two mixed
sessions for each condition. Due to participant no shows at least one condition had an imbalance
in either age, gender, or BMI composition. Due to this imbalance, F-tests were conducted poat-
hoc on the main dependent variables using gender, age, and BMI as covariates. Regarding the
dependent variable bite count, none of the covariates were found to be significant. Regarding the
dependent variable grams consumed, gender was found to be significant however its inclusion
did not alter the significance of the focal independent variables. Neither age nor BMI were
found to be significant covariates with grams consumed. Regarding the dependent variable bite
size, gender was found to be significant however its inclusion did not alter the significance of the
focal independent variables. Neither age nor BMI were found to be significant covariates with
bite size. Regarding the dependent variable post-meal satiety, BMI was found to be significant
however its inclusion did not alter the significance of the focal independent variables. Neither
gender nor age were found to be significant covariates with post-meal satiety. Full results of the
covariate analyses can be found in Appendix D.
All participants were instructed to abstain from eating at least three hours prior to the
study. Although pre-meal satiety levels were measured they were not controlled for in the
current study. As such, a post-hoc correlation between pre-meal satiety levels and the main
dependent variables were conducted. Results of these analyses showed a significant negative
correlation between pre-meal satiety and grams consumed (r = -.286, p < .001) and bite size (r =

47
-.254, p < .001). In other words, the greater the initial hunger of the participants, the more grams
they were likely to consume as a result of an increased bite size. Furthermore, a significant
positive correlation was found between pre-meal satiety and post-meal satiety (r = .387, p <
.000). Full results of the correlation analyses can be found in Appendix E.
Due to the significant correlation between pre-meal satiety levels and the dependent
variables grams consumed, bite size, and post-meal satiety, F-tests were conducted on these
dependent variables using pre-slim satiety as a covariate. Pre-meal satiety was found to be a
significant covariate with each of the three dependent variables however its inclusion did not
alter the significance of the focal independent variables for either of the three tests. Full results
of the covariate analyses can be found in Appendix F.
Another major limitation is the experimental setting. Psychological research suffers from
behavior changes elicited by subjects simply being in a laboratory. It is possible that eating in a
laboratory may be awkward for participants. Furthermore, it may be even more awkward eating
with strangers in the laboratory as supported by research discussed in the introduction on social
eating. Thus, it is appropriate to assume that eating behavior observed in the current study may
limit generalizability of the findings of this study. However, measures have been taken to ensure
the eating environment elicited as naturalistic behaviors as possible. After the design and
construction of the laboratory paradigm, data were collected on subjects’ attitudes towards eating
using the paradigm. Results from those studies showed that subjects reported eating in a manner
comparable to how they would eat outside of the laboratory. Although error is to be expected in
these responses, the findings that people assumed to be eating naturally lends support that the
laboratory eating paradigm tool is useful for conducting eating behavior research as presented in
this study.

48
The presentation of user bite count on the Bite Counter device could present another
limitation. The current study used bite counters that showed bite count in all conditions. It is
possible that this information could have changed participant behavior due to potential demand
characteristics. It is possible that by viewing their bite count participants could have made
judgments about the true purpose of the study during their participation. Future studies could
examine replacing the bite count feedback on the device with “ON” being displayed instead.
Another potential limitation is the food item used. The current study used a very specific
food item. Future studies could examine how the outcomes of the procedures used in the current
study would change if the food item were manipulated. For example, future studies could
examine what effect a manipulation to the nutrient content of the food would have on the
identified zone.
As noted, the SLIM scale was used to index satiety. The presentation of the SLIM scale
could provide a potential limitations as the reference points on the scale are spaced unevenly.
This type of scale is called a “category-ratio” scale and contains verbal labels of expressed
intensity along a line that reflect numerical ratios among the perceived intensities36. This novel
presentation method may have confused participants and resulted in less accurate reports of
satiety. Future studies could examine using a modified SLIM scale that presents reference points
equally along the scale. A statistical correction could be used post hoc to adjust the
measurements appropriately.
Conclusion
The literature up until this point has merely suggested that the zone of indifference may exist.
The purpose of this study was to determine if the zone actually existed by quantifying the lower
and upper boundaries of the zone in terms of the number of bites people take. Based on the

49
findings of the current study, not only is the zone real, but it can be measured and quantified
using the set of criteria presented in this study. Based on these criteria, the zone of indifference
under the current conditions for the meal described in this study is 18-20 bites. Although this
zone is only representative of a single meal under a research setting, the procedure and criteria
for establishing the zone could be applied to other eating scenarios.

50
References
1. World Health Organization (2016, June). Obesity and overweight fact sheet.
2. Ng. M, et. al., (2013) Global, regional, and national prevalence of overweight and obesity
in children and adults during 1980-2013: a systematic analysis for the Global Burden of
Disease Study 2013.
3. James. T. P., (2004) Obesity: The worldwide epidemic. Clinics in Dermatology. 22, 276-
280
4. Jakicic, M. J., Clark, K., Coleman, D. R., Donnelly, E. J., Foreyt, J., Melanson, E., Volek,
J., & Volpe, S. (2001). Appropriate intervention strategies for weight loss and prevention
of weight regain for adults. American College of Sports Medicine, 12, 2145-2156.
5. Burke, L, E., Sevick, M, A., (2011), Self-monitoring in weight loss: a systematic review
of the literature. Journal of the Academy of Nutrition and Dietetics. 201 (1), 92-102
6. Wansink, B., (2010) From mindless eating to mindlessly eating better. Physiology &
Behavior. 100, 454-463
7. Herman, P. C., & Polivy, J. (1983). A boundary model for the regulation of eating.
Psychiatric Annals. 13 (12): 918-927
8. Polivy, J., Herman, C. P., Hackett, R., & Kuleshnuy, I. (1986). The effects of self-
attention and public attention on eating in restrained and unrestrained subjects. Journal of
Personality and Social Psychology, 50(6), 1253.
9. Clendenen, V., Herman, C., & Polivy, J., (1994) Social facilitation of eating among
friends and strangers. Appetite, 23, 1-13
10. De Castro, J., (1994) Family and friends produce greater social facilitation of food intake
than other companions. Physiology and Behavior, 56, 445-455

51
11. Salvy, S., Jarrin, D., Paluch, R., Irfan, N., & Pilner, P., (2006) Effects of social influence
on eating in couples, friends, and strangers. Appetite, 49, 92-99
12. Pilner, P., & Chaiken, S., (1990) Eating, social motives, and self-presentation in women
and men. Journal of Experimental Social Psychology. 26, 240-254
13. Salvy, S. J., Vartanian, L R., Coelho, J. S., Jarrin, D., & Pilner, P. P., (2008) The role of
familiarity on modeling of eating and food consumption in children. Appetite. 50(2): 514-
518
14. Siegel, P., (1957) The Completion Compulsion in Human Eating. Psychological Reports.
3.
15. Rolls, B., Bell, E., & Waugh, B., (2000) Increasing the volume of food by incorporating
air effects satiety in men. The American Journal of Clinical Psychology. 361-368
16. Jasper, P., James, M., Hoover, A., & Muth, E., (2016) Effects of Bite Count Feedback
from a wearable device and goal setting on consumption in young adults. Journal of the
Academy of Nutrition and Dietetics. 116(11), 1785-1793
17. Payne, C., & Wansink, B., (2007) Counting Bones, environmental cues that decrease
food intake. Perceptual and Motor Skills, 104(1), 273-276
18. Baker, R., & Kirschenbaum, D., (1998) Self-monitoring may be necessary for successful
weight control. Behavioral Therapy, 24(3), 377-394
19. Butryn, M., L., Phelan, S., Hill, J. O., Wing, R. R., (2007) Consistent self-monitoring og
weight: A key component of successful weight loss maintenance. Obesity. 3091-3096
20. Plata-Salaman, C. R. (1991) Regulation of hunger and satiety in Man. Digestive
Diseases. 9; 253-268
21. Mandometer, AB Mando, Sweden

52
22. Kant, A., & Graubard, B., (2003) Eating out in American, 1987-2000: trends and
nutritional correlates. Preventive Medicine, 38(2), 243-249
23. 10S Fork, Slowcontrol, Paris, France.
24. Dong Y, Hoover A, Scisco J, Muth E. A new method for measuring meal intake in
humans via automated wrist motion tracking. Applied Psychophyisology Biofeedback.
2012;37(3):205-215.
25. Jasper, P., James, M., Hoover, A., & Muth, E., (2016) Effects of Bite Count Feedback
from a wearable device and goal setting on consumption in young adults. Journal of the
Academy of Nutrition and Dietetics. 116(11), 1785-1793
26. Wilson, M., Kinsella, A., & Muth, E. (2016) User compliance rates of a wrist-work
eating activity monitor. Proceedings of the Human Factors and Ergonomics Society
Annual Meeting. October 2016.
27. Myers, J. L., Well, A., D., & Lorch, R. F., (2010) Research design and statistical analysis.
Routledge. 248-251, 259, 265.
28. Simes, R. J., (1986) An improved Bonferroni procedure for multiple tests of significance.
Biometrics. 73 (3) 751-754
29. Ruxton, G. D., (2006) The unequal variance t-test is an underused alternative to Student’s
t-test and the Mann-Whitney U test. Behavioral Ecology. 17(4): 688-690
30. Myers, J. L., Well, A., D., & Lorch, R. F., (2010) Research design and statistical analysis.
Routledge. 239
31. Salley, J, N., Hoover, A. W., Wilson, M. L., Muth, E. R., (2016) Comparison between
human and bite-based methods of estimating caloric intake. Journal of the Academy of
Nutrition and Dietetics. 116 (10) 1568-1577.

53
32. Elber, B., Kersh, R., Brescoll, V. L., & Dixon, B. (2009) Calories labeling and food
choices: A first look at the effects on low-income people in New York City. Health
Affairs 28 (6) 1110-1121.
33. Berrut, G., Favreau, A. M., Dizo, E., Tharreau, B., Poupin, C., Gueringuili, M.,
Fressinaud, P., & Ritz, P. (2002) Estimation of calorie and protein intake in aged patients:
Validation of a method based on meal portions consumed. Journal of Gerontology. 57
(1) 52-56
34. Burton, S., Creyer, E. H., Kees, J., & Huggins, K. (2006) Attacking the obesity epidemic:
The potential health benefits of providing nutrition information in restaurants. American
Journal of Public Health. 96 (1) 1669-1675.
35. LaPorte, D. J. & Stunkard, A. J., (1990) Predicting attrition and adherence to a very low
calorie diet: a prospective investigation of the eating inventory. International Journal of
Obesity. 14 (3): 197-206
36. Borg, G. (1982). A category scale with ratio properties for intermodal and interindividual
comparisons. Psychophysical judgment and the process of perception. 25-34

54
Appendix A
SLIM Scale
Participant #:_________ Station #: ______________
Date:______________ Time:______________
Please rate the degree of hunger/fullness that you currently feel by putting a slash (/) mark
somewhere on the line below.
Greatest Imaginable Fullness
Extremely Full
Very Full
Moderately Full
Slightly Full
Neither Hungry nor Full
Slightly Hungry
Moderately Hungry
Very Hungry
Extremely Hungry
Greatest Imaginable Hunger

55
Appendix B
Protocol
Recruitment
1. Participants will be recruited via the SONA website.
2. 8 participants will be recruited per session. 4 participants will be kept for the
experimental session with the remaining participants being given credit and rescheduled
for another time.
a. This will help ensure that 4 participants are run at each session, even if there are
no-shows
b. This will help with balancing gender during the study.
3. After someone signs up, send them the following e-mail:
Dear Participant,
Thank you for expressing interest in our study. The study includes coming into the Applied
Psychophysiology Laboratory (422 Brackett Hall), where some body measurements including
height, weight, and Body Mass Index (BMI) will be measured, familiarization with the Bite
Counter device will occur, and a meal of macaroni and cheese will be eaten with several other
participants.
Your session will take place at XX:XXam/pm on XX/YY (date)
Thank you again for your interest.
Sincerely,
(experimenter)
Laboratory session
Materials
Consent form
Experimenter Note Sheet
Participant Notes Sheet
Demographics questionnaire
Relationship questionnaire
4x Satiety Labeled Intensity Magnitude (SLIM) scale
Eating Behavior Inquiry
Large plate: Chinet Classic White Dinner Plate. 26.4cm diameter
Red plastic cups 532mL
500ml liquid measuring cup.
Plastic forks

56
Napkins
Proctor Silex 18 quart Roaster Oven
Hot plates (2)
Oven mitts (2)
Protective plastic gloves.
Serving spoon
Stouffer’s Party Size Macaroni and Cheese
Instrumented Eating Station
Food preparation
1. 1 hour and 30 minutes prior to the scheduled arrival of the participants, plug in the roaster
oven and set the temperature to 450 degrees Fahrenheit (450F) for pre-heating. Allow 15
minutes for the roaster oven to pre-heat
2. After pre-heating the roaster oven, locate the macaroni and cheese in the freezer and
remove one box of 76oz Stouffer’s Party Size Macaroni and Cheese. Take the aluminum
macaroni and cheese container from the box.
3. Using the scale on top of the computer cabinet, weigh the macaroni and cheese prior to
cooking and record the weight on the experimenter note sheet.
4. Put on a pair of plastic gloves and remove the aluminum lib from the macaroni and
cheese.
5. Using oven mitts, place the oven rack holding the macaroni and cheese into the roaster
oven.
6. Set the timer for 70 minutes.
7. Once the timer goes off and the 70 minute cook time is complete, Leave oven on.
8. Leave macaroni and cheese in the oven until the participants are ready to serve
themselves.
9. Before allowing the participants to serve themselves, weigh the macaroni and cheese
after cooking and record the weight on the experimenter note sheet.
Bite Counter
10. To program the Bite Counter do the following (should be performed prior to arrival of
participant).
a. To set parameters, select “Device” and then select “Set the Parameters”. Once you
do this a pop up window with radio button controls. The parameters you can set
fall under three categories: “Live Display”, “Review Display” and “Alarm”
i. Live Display: This controls what is displayed with the device is in “Bite
Count” mode. Select “Bites” (note: Only one of the three radio buttons
can be active).
ii. Review Display: This controls what stored information the user can cycle
through on the device when the device is in “Time” mode. Activating the
radio button means that it will be included in the display. Select the radio
buttons for Time, Bites, and Bites/day.
iii. Click “OK”.

57
b. Disconnect the Bite Counter
Eating Station
11. Prepare the eating station prior to the arrival of the participants.
12. Position the table cloth so that the holes cut for the scales are located properly above each
scale such that only the pressure plate of each scale is visible. Note that each scale has
two strips of 3 inch long Velcro loop material in the center of the pressure plate.
13. Turn on the scales. Allow them to boot up and zero-out.
14. Adhere one (1) large plastic greenish plate to each scale.
15. Firmly press each plate onto its respective scale’s pressure plate as to connect both pieces
of Velcro. Lightly pull on each plate to ensure a secure connection of the Velcro.
16. Place a plastic cup at each station.
17. Using the liquid measuring cup, pour 450ml of water into each cup using the water
fountain outside. Use a tray to carry cups back to the eating station
18. Place a napkin at each eating station.
19. Place one plastic fork on each napkin.
20. Place the two (2) hot plates in the center of the table.
Participant folder
21. Locate the box of File Folders on top of the file cabinet in 421.
22. Create four (4) folders containing the following materials (Appendix C – K):
a. Consent Form (2)
b. Participant Note Sheet
c. Demographics Questionnaire
d. Relationship Questionnaire
e. 4x SLIM scale
f. Eating Behavior Inquiry
23. On the tab of each file folder write each participant’s ID number, date, and time of the
session.
a. ID Number should be 1 – 4 , corresponding to eating station number.
24. Record each participants Bite Counter number on the participant note sheet
25. Place the four folders at the main table.
Participants
26. Greet the participants
27. Upon the participants’ arrival, introduce yourself and thank them again for their
participation.
28. Give a brief over view of the proceedings. Say the following: “I am going to give you a
quick overview of what we will be doing today. First, we will take a few basic body
measurements and fill out a few pre-meal questionnaires and scales. We will then
instruct you on how to use the Bite Counter device which you will be wearing while
you eat. You will then be allowed to serve and eat the macaroni and cheese. After

58
the meal we will fill out a few more questionnaires and scales, we will debrief you
and you will be free to leave.”
29. Direct the participants to file folder containing the consent form. Instruct them to read it,
initial each page and sign and date the last page of the form. Say the following: “Some
things on the form may not apply to you. If you have any questions feel free to ask.”
30. Once the participant has finished reading and signing the consent form begin the body
measurements.
31. Measure height (to the nearest ¼ inch) and weight (to the nearest ½ pound) using the
Tanita WB-3000 scale. Record all measurements on the Participant Note Sheet. To take
the measurements, perform the following:
NOTE: Take all height and weight measurements with participant in stocking or bare feet.
a. Power on the device, and wait for it to start up and zero itself.
b. Extend the stadiometer so that it is above the participant’s head.
c. Ask the participant to step onto the scale with their back to the stadiometer.
d. Level the stadiometer with the participant’s head, and record height and weight.
e. Measure height to the nearest quarter inch.
32. Give each participant the first SLIM scale. Say the following: “This scale indexes how
hungry or full you feel currently. Please make the scale appropriately.”
33. Give each participant the relationship questionnaire. Say the following: “This form is to
collect information regarding any possible relationships you may have with the other
participants. If you have any questions feel free to ask.”
34. Upon completion of the above steps, direct each participant to the eating station and sit
them at their pre-assigned station.
35. Using oven mitts, remove the macaroni and cheese from the roaster oven using the
handles on the oven rack.
36. Weigh the macaroni and cheese after cooking and record the weight on the experimenter
not sheet
37. Place the macaroni and cheese on the hot plates in the middle of the eating station.
38. Place the serving spoon into the macaroni and cheese.
39. Issue the participants their predetermined Bite Counter
40. Instruct the participants on the use of the Bite Counter using the Bite Counter Instructions
document. Say the following:
a. “Place the Bite Counter on your wrist of the hand you eat with”
b. “When instructed you will turn the Bite Counter on by pressing the top
button once”
c. “Once the device is turned on, the device will be in Bite Count mode and the
device will now display your active bite count.”
d. “Continue to eat as you normally do.”

59
e. “Once you have finished and have taken the last bite of food, turn the device
off by pressing the top button once.”
41. Give the participants the following instruction:
a. Depending on the experimental condition say either “You are free to serve
yourself as much as you want. After you serve your desired portion please wait
until instructed before eating”
b. “Please drink with your hand that is NOT wearing the Bite Counter, the
hand that you do not eat with”
c. “There are scales beneath your trays that are measuring the weight change
in your food. We ask that if you set your utensil down, please set it on the
napkin beside your plate. Also, please try to keep your hands off of the
plate.”
d. “Please note that there is sensitive equipment and wiring on the underside of
the table. Please try to avoid jolting the table with your knees.”
e. “If you need or would like more at any point, please let us know and we will
serve you. After being served your desired portion please until instructed
before continuing to eat.”
f. “We will be sitting over here quietly. Please holler at us if you would like
more macaroni and cheese and we will serve you.”
g. Then say the following depending on condition
i. “We ask that you please eat until the alarm on your device sounds”
(alarm condition condition),
ii. “We ask that you lease take XX bites” (bites condition condition)
h. “Again, feel free to serve yourselves as much as you want. If you would like
additional servings, let us know and we will serve you.”
42. Give the participants the second SLIM scale. Say the following: “This scale is identical
to the one you filled out before. Again, it indexes how hungry or full you feel
currently, please mark it appropriately.”
43. Instruct the participants to serve themselves.
44. Once the participants serve their food, BUT BEFORE EATING begin recording.
a. Start the video recording before you start the scale/bite counter recording.
b. To begin the video recording, right click on the video screen.
c. Click “Manual record.”
d. Click the colored square in the EatStat program to begin recording bite and scale
data.
e. Record pre meal weight on experimenter note sheet (Wet+Plastic)
45. Make a note of any problems or anomalies that arise.
46. Monitor the equipment to make sure that everything is running as it should be.
47. If the participant finishes or wants to get seconds (or thirds), stop the recording.
a. Stop the scale/bite counter data before stopping the video.
b. Click the colored square in the EatStat program to pause recording.

60
c. Right click the video monitors.
d. Click “Manual Record” to end the video recording.
e. Record post meal or course (Waste+Plastic) weight on the experimenter note
sheet.
48. Resume the data recording when the participant returns with seconds or thirds.
49. If finished, immediately instruct the participants to complete the third SLIM scale. Say
the following: “This scale is identical to the one you filled out before the meal. Again,
it indexes how hungry or full you feel currently, please mark it appropriately.”
50. Start the 10 minute timer on the laptop for each participant as soon as they complete the
third SLIM
51. Once all participants indicate completing the meal direct them back to the main table.
52. Have the participants wait until their 10 minute timer is up and then give them the fourth
SLIM scale. During the 10 minutes, they can do whatever they want except talk about
the food or the study.
53. Once the participants have completed all of the post meal scales, collect the papers and
return to the participants file folder.
54. Offer a copy of the consent form to the participants to take home is desired.
55. Debrief the participants. Say the following: “The purpose of this study is to quantify the
‘zone of indifference ’ in terms of the number of bites people take. What that means is,
there is a range between which people can eat more or less than they otherwise would
as a result of things in their environment. Our goal is to take advantage of some of
these things to help people eat less and make healthier decisions when it comes to eat.”
56. Once the session is finished, shut down the equipment (unless you are doing a backup)
and clear the table.
57. Weigh the left over macaroni and cheese and record weight on experimenter note sheet.
58. Throw away aluminum macaroni and cheese container, plates, cups, napkins, and
utensils.
59. Download the Bite Counter data using the instructions in Appendix A.
Computer Boot-up
1. Unlock the cabinet and boot up both laptops.
2. The password for each laptop is “tiger5”.
3. Click “EatStat.exe”. This is the program that monitors the bite count and the scale data.
4. Click “Start” then “Record.” This will not actually begin recording data; it will just begin
monitoring the devices. (Do this on each laptop)
5. Clicking “Record” will open a new window showing the video from two of the four
cameras. The top laptop will show stations 1 and 2, and the bottom laptop will show
stations 3 and 4:

61
Station 1 Station 2
(Blank) (Blank)
(Blank) (Blank)
Station 3 Station 4
a. Make sure that each camera is focused on the correct station.
6. If there are any errors, close all windows and restart them. If this does not fix the
problem, contact the graduate assistant.
Data Recording
1. Once all of the participants have been allowed to serve their food, begin the recording.
2. Always start the video first and end the video last.
3. Right click on EACH video and choose “Manual Record.”
4. Within the EatStat window, click the green square button with the station number. The
button will change to red.
5. Once the participants have served themselves and have begun eating, check all of the data
readouts and make sure they are changing as they should.
6. It is not necessary to constantly monitor the laptops. However, check them from time to
time to make sure that there are no errors (e.g. frozen screens, equipment failures, etc.)
7. When the graduate assistant tells you to end the recording, click the red square buttons in
both EatStat windows.
8. Right click each video and click manual record again.

62
Video Conversion
A: Before Video Conversion:
1: Note down the approximate time when the subject has started eating their meal.
2: Once the subject has finished his meal, note down the end time and go to the corresponding
camera recording folder on the relevant laptop.
3: Every recording creates the new “.dat” file. The recorded “dat” files are stored in the specific
naming convention i.e. “CameraName | S00A | Year (4) | Month (2) | Date (2) | Hrs (2) | Min (2) |
Sec (2) | msec (3)” and file stores the recording lasting up to 5 minutes. The file size should be
around 30 MB for 5 minutes recording duration. There will be multiple dat files for one meal
depending on the duration. Verify the dat files for start time and size.
B: Video conversion:
1: Open the “Playback System” from the “Start menu”.
2: Click “Open Recording and provide username and password as “admin/admin”.
3: Check whether the same day is highlighted in the calendar in the left corner.
4: Select the recording for required camera (as shown below) depending upon the particular
subject under recording and click OK. (The top row is camera 1 and the bottom row is camera 2)
5: The video will be loaded in the playback system.
6: Scroll bar can be used to start video at required time.
7: Once the start time is set click the “Cue In” (red circled button below) this specifies the start
time of video conversion. Slide the scroll to the end of the required end time and click “Cue Out”
(green circled button below).
8: After this click “Save Video”. In the dialog box provide the converted file destination and
name.
(The file destination should be the same recording folder for that subject i.e. C00000 or C00001
and file name should be of the format “| Year (4) | Month (2) | Date (2) | Hrs (2) | Min (2) | Sec

63
(2) | msec (3).asf” ex: “20120202113610778.asf”. It can be taken from the recorded .dat file
name in the recording folder as mentioned in step A:3).The Export Format should be set to
“ASF”. Set the “Use Profile” to “Windows Media 8 for Local Area Network (768 kbps) as
shown below. Also check the “Export Audio”.
9: Click OK and the process will start indicating the progress in the dialog.
Data Backup
1. Connect the external hard drive (found in the cabinet) to Laptop 1.
2. On the laptop, perform the following steps:
a. Go to “Computer.”
b. Open the “C:\” drive.
c. Right click the “Recording” folder.
d. Click “Copy”.
e. Return to the “Computer” folder.
f. Open the External Hard Drive
g. Open Laptop 1 (if you are backing up Laptop 2, open the Laptop 2 folder instead).
h. Right click within the folder and click “Paste.”
i. If it asks you if you want to overwrite any files, click “Do not copy these items.”
3. Once the files are finished copying, close all windows.
4. Right click on the USB icon in the bottom right corner.
5. Click “Eject External Drive.”
6. Disconnect the external hard drive.
7. Repeat these steps for laptop 2.

64
8. Once all of the data has been backed up, shut down each laptop. Place the hard drive,
Clorox wipes, and latex gloves in the cabinet.
9. Close and lock the cabinet.
Clearing the Data
1. The laptops have a limited amount of hard drive space and must be cleared at least once a
week.
2. Ensure that all of the data on the laptops has been backed up.
3. Within the “C:\Recording” folder:
a. NEVER delete the “Camera” folder or “Folder 1” or “Folder 2”
b. Open “Camera”
c. Delete all files within this folder.
d. Repeat for “Folder 1” and “Folder 2”.

65
APPENDIX C
Tests of Normalityb
Condition Kolmogorov-Smirnova Shapiro-Wilk
Statistic df Sig. Statistic df Sig.
BCbites
1.00 .272 16 .003 .857 16 .017
2.00 .315 26 .000 .824 26 .000
3.00 .530 12 .000 .327 12 .000
4.00 .355 16 .000 .644 16 .000
5.00 .462 16 .000 .546 16 .000
6.00 .502 14 .000 .438 14 .000
7.00 .313 14 .001 .842 14 .017
9.00 .318 16 .000 .746 16 .001
10.00 .534 14 .000 .297 14 .000
11.00 .299 14 .001 .828 14 .011
12.00 .195 22 .029 .824 22 .001
TotalGrams
1.00 .120 16 .200* .950 16 .482
2.00 .125 26 .200* .946 26 .191
3.00 .186 12 .200* .925 12 .330
4.00 .153 16 .200* .925 16 .206
5.00 .106 16 .200* .981 16 .970
6.00 .163 14 .200* .918 14 .205
7.00 .151 14 .200* .929 14 .300
8.00 .147 14 .200* .944 14 .473
9.00 .150 16 .200* .964 16 .727
10.00 .119 14 .200* .957 14 .667
11.00 .122 14 .200* .972 14 .905
12.00 .174 22 .083 .924 22 .094
BiteSizeBC
1.00 .151 16 .200* .916 16 .147
2.00 .163 26 .073 .873 26 .004
3.00 .186 12 .200* .925 12 .332
4.00 .221 16 .035 .900 16 .081
5.00 .102 16 .200* .967 16 .783
6.00 .155 14 .200* .925 14 .255
7.00 .164 14 .200* .950 14 .555
8.00 .147 14 .200* .944 14 .473
9.00 .134 16 .200* .966 16 .762
10.00 .118 14 .200* .951 14 .569
11.00 .204 14 .116 .892 14 .086

66
12.00 .168 22 .108 .891 22 .020
*. This is a lower bound of the true significance.
a. Lilliefors Significance Correction
b. BCbites is constant when Condition = 8.00. It has been omitted.

67
APPENDIX D
F-tests for each dependent variable using gender, age, and BMI as covariates.
DV: bite count, Covariate: gender
Source Type III Sum
of Squares
df Mean Square F Sig.
Corrected Model 1785.712a 12 148.809 36.849 .000
Intercept 5801.489 1 5801.489 1436.607 .000
Sex 10.991 1 10.991 2.722 .101
Instruction 19.564 1 19.564 4.845 .029
Target 1620.881 5 324.176 80.275 .000
Instruction *
Target 204.023 5 40.805 10.104 .000
Error 734.976 182 4.038
Total 55494.000 195
Corrected Total 2520.687 194
a. R Squared = .708 (Adjusted R Squared = .689)
DV: bite count, Covariate: age
Source Type III Sum
of Squares
df Mean Square F Sig.
Corrected Model 1774.726a 12 147.894 36.083 .000
Intercept 470.260 1 470.260 114.734 .000
Age .006 1 .006 .001 .971
Instruction 15.214 1 15.214 3.712 .056
Target 1477.857 5 295.571 72.114 .000
Instruction *
Target 177.638 5 35.528 8.668 .000
Error 745.961 182 4.099
Total 55494.000 195

68
Corrected Total 2520.687 194
a. R Squared = .704 (Adjusted R Squared = .685)
DV: bite count, Covariate: BMI
Source Type III Sum
of Squares
df Mean Square F Sig.
Corrected Model 1774.807a 12 147.901 36.089 .000
Intercept 1878.329 1 1878.329 458.325 .000
BMI .086 1 .086 .021 .885
Instruction 18.294 1 18.294 4.464 .036
Target 1605.417 5 321.083 78.347 .000
Instruction *
Target 196.820 5 39.364 9.605 .000
Error 745.880 182 4.098
Total 55494.000 195
Corrected Total 2520.687 194
a. R Squared = .704 (Adjusted R Squared = .685)
DV: grams consumed, Covariate: gender
Source Type III Sum
of Squares
df Mean Square F Sig.
Corrected Model 375052.700a 12 31254.392 9.026 .000
Intercept 354743.648 1 354743.648 102.446 .000
Sex 94983.960 1 94983.960 27.430 .000
Instruction 5264.517 1 5264.517 1.520 .219
Target 140439.136 5 28087.827 8.111 .000
Instruction *
Target 150222.566 5 30044.513 8.677 .000
Error 630216.566 182 3462.728
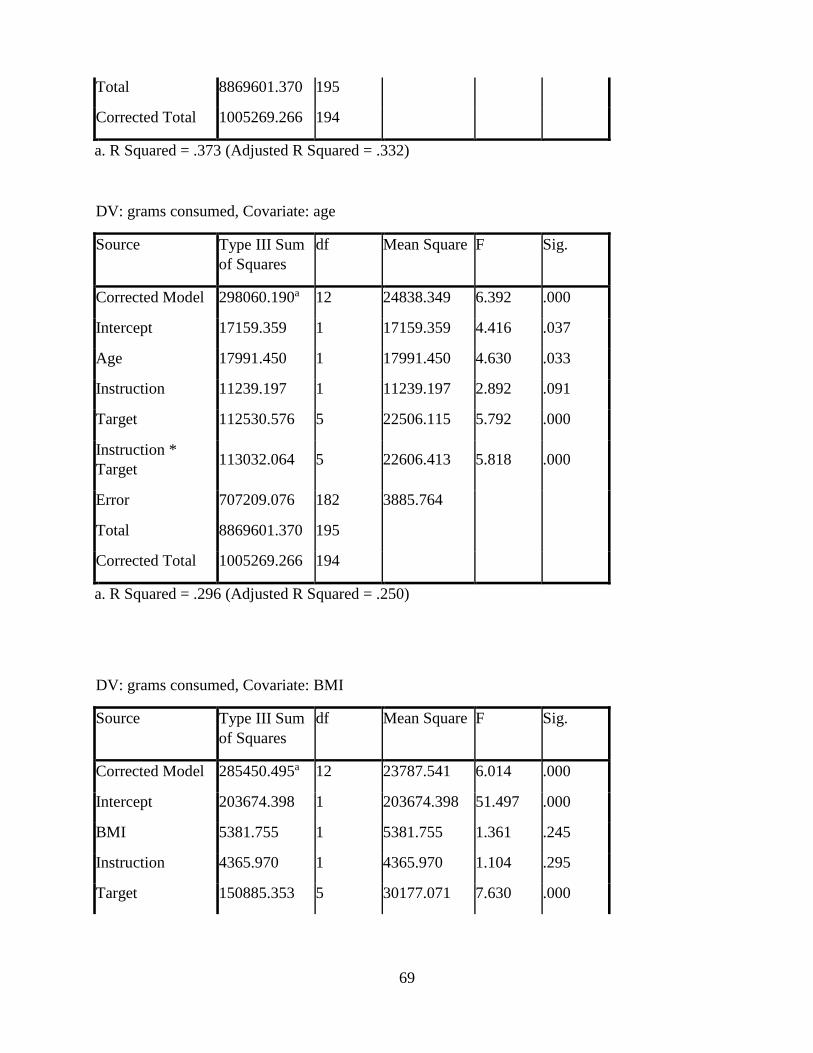
69
Total 8869601.370 195
Corrected Total 1005269.266 194
a. R Squared = .373 (Adjusted R Squared = .332)
DV: grams consumed, Covariate: age
Source Type III Sum
of Squares
df Mean Square F Sig.
Corrected Model 298060.190a 12 24838.349 6.392 .000
Intercept 17159.359 1 17159.359 4.416 .037
Age 17991.450 1 17991.450 4.630 .033
Instruction 11239.197 1 11239.197 2.892 .091
Target 112530.576 5 22506.115 5.792 .000
Instruction *
Target 113032.064 5 22606.413 5.818 .000
Error 707209.076 182 3885.764
Total 8869601.370 195
Corrected Total 1005269.266 194
a. R Squared = .296 (Adjusted R Squared = .250)
DV: grams consumed, Covariate: BMI
Source Type III Sum
of Squares
df Mean Square F Sig.
Corrected Model 285450.495a 12 23787.541 6.014 .000
Intercept 203674.398 1 203674.398 51.497 .000
BMI 5381.755 1 5381.755 1.361 .245
Instruction 4365.970 1 4365.970 1.104 .295
Target 150885.353 5 30177.071 7.630 .000

70
Instruction *
Target 160367.402 5 32073.480 8.110 .000
Error 719818.771 182 3955.048
Total 8869601.370 195
Corrected Total 1005269.266 194
a. R Squared = .284 (Adjusted R Squared = .237)
DV: bite size, Covariate: gender
Source Type III Sum
of Squares
df Mean Square F Sig.
Corrected Model 947.274a 12 78.939 5.133 .000
Intercept 1052.506 1 1052.506 68.439 .000
Sex 503.859 1 503.859 32.763 .000
Instruction 95.626 1 95.626 6.218 .014
Target 109.594 5 21.919 1.425 .217
Instruction *
Target 220.804 5 44.161 2.872 .016
Error 2798.922 182 15.379
Total 33751.181 195
Corrected Total 3746.196 194
a. R Squared = .253 (Adjusted R Squared = .204)
DV: bite size, Covariate: age
Source Type III Sum
of Squares
df Mean Square F Sig.
Corrected Model 490.501a 12 40.875 2.285 .010
Intercept 84.196 1 84.196 4.707 .031
Age 47.086 1 47.086 2.632 .106
Instruction 114.938 1 114.938 6.425 .012

71
Target 115.519 5 23.104 1.292 .269
Instruction *
Target 152.035 5 30.407 1.700 .137
Error 3255.695 182 17.888
Total 33751.181 195
Corrected Total 3746.196 194
a. R Squared = .131 (Adjusted R Squared = .074)
DV: bite size, Covariate: BMI
Source Type III Sum
of Squares
df Mean Square F Sig.
Corrected Model 461.663a 12 38.472 2.132 .017
Intercept 754.820 1 754.820 41.826 .000
BMI 18.248 1 18.248 1.011 .316
Instruction 83.908 1 83.908 4.649 .032
Target 78.555 5 15.711 .871 .502
Instruction *
Target 228.298 5 45.660 2.530 .031
Error 3284.534 182 18.047
Total 33751.181 195
Corrected Total 3746.196 194
a. R Squared = .123 (Adjusted R Squared = .065)
DV: post-meal satiety, Covariate: gender
Source Type III Sum
of Squares
df Mean Square F Sig.
Corrected Model 15034.664a 12 1252.889 5.301 .000
Intercept 69864.474 1 69864.474 295.619 .000

72
Sex 90.366 1 90.366 .382 .537
Instruction 357.309 1 357.309 1.512 .220
Target 13284.747 5 2656.949 11.242 .000
Instruction *
Target 558.676 5 111.735 .473 .796
Error 42776.223 181 236.333
Total 725594.000 194
Corrected Total 57810.887 193
a. R Squared = .260 (Adjusted R Squared = .211)
DV: post-meal satiety, Covariate: age
Source Type III Sum
of Squares
df Mean Square F Sig.
Corrected Model 15605.164a 12 1300.430 5.577 .000
Intercept 2569.927 1 2569.927 11.021 .001
Age 660.866 1 660.866 2.834 .094
Instruction 772.056 1 772.056 3.311 .070
Target 10556.002 5 2111.200 9.054 .000
Instruction *
Target 922.678 5 184.536 .791 .557
Error 42205.723 181 233.181
Total 725594.000 194
Corrected Total 57810.887 193
a. R Squared = .270 (Adjusted R Squared = .222)
DV: post-meal satiety, Covariate: BMI

73
Source Type III Sum
of Squares
df Mean Square F Sig.
Corrected Model 15880.303a 12 1323.359 5.712 .000
Intercept 14553.723 1 14553.723 62.823 .000
BMI 936.005 1 936.005 4.040 .046
Instruction 507.912 1 507.912 2.192 .140
Target 13622.767 5 2724.553 11.761 .000
Instruction *
Target 761.180 5 152.236 .657 .656
Error 41930.584 181 231.661
Total 725594.000 194
Corrected Total 57810.887 193
a. R Squared = .275 (Adjusted R Squared = .227)

74
APPENDIX E
Correlation tables for pre-meal satiety and the dependent variables overall and by condition.
Correlation of pre-meal satiety and bite count
(overall)
PreSLIM1 BCbites
PreSLIM1
Pearson Correlation 1 -.042
Sig. (2-tailed) .557
N 195 195
BCbites
Pearson Correlation -.042 1
Sig. (2-tailed) .557
N 195 195
Correlation of pre-meal satiety and bite count (by condition)
Condition PreSLIM1 BCbites
1.00
PreSLIM1
Pearson Correlation 1 -.093
Sig. (2-tailed) .731
N 16 16
BCbites
Pearson Correlation -.093 1
Sig. (2-tailed) .731
N 16 16
2.00
PreSLIM1
Pearson Correlation 1 -.140
Sig. (2-tailed) .494
N 26 26
BCbites
Pearson Correlation -.140 1
Sig. (2-tailed) .494
N 26 26
3.00
PreSLIM1
Pearson Correlation 1 -.245
Sig. (2-tailed) .443
N 12 12
BCbites
Pearson Correlation -.245 1
Sig. (2-tailed) .443
N 12 12
4.00
PreSLIM1
Pearson Correlation 1 .244
Sig. (2-tailed) .363
N 16 16
BCbites
Pearson Correlation .244 1
Sig. (2-tailed) .363
N 16 16
5.00
PreSLIM1
Pearson Correlation 1 -.041
Sig. (2-tailed) .882
N 16 16
BCbites
Pearson Correlation -.041 1
Sig. (2-tailed) .882
N 16 16

75
6.00
PreSLIM1
Pearson Correlation 1 .297
Sig. (2-tailed) .283
N 15 15
BCbites
Pearson Correlation .297 1
Sig. (2-tailed) .283
N 15 15
7.00
PreSLIM1
Pearson Correlation 1 .066
Sig. (2-tailed) .823
N 14 14
BCbites
Pearson Correlation .066 1
Sig. (2-tailed) .823
N 14 14
8.00
PreSLIM1
Pearson Correlation 1 .a
Sig. (2-tailed) .
N 14 14
BCbites
Pearson Correlation .a .a
Sig. (2-tailed) .
N 14 14
9.00
PreSLIM1
Pearson Correlation 1 .190
Sig. (2-tailed) .480
N 16 16
BCbites
Pearson Correlation .190 1
Sig. (2-tailed) .480
N 16 16
10.00
PreSLIM1
Pearson Correlation 1 -.113
Sig. (2-tailed) .701
N 14 14
BCbites
Pearson Correlation -.113 1
Sig. (2-tailed) .701
N 14 14
11.00
PreSLIM1
Pearson Correlation 1 .284
Sig. (2-tailed) .325
N 14 14
BCbites
Pearson Correlation .284 1
Sig. (2-tailed) .325
N 14 14
12.00
PreSLIM1
Pearson Correlation 1 -.417
Sig. (2-tailed) .053
N 22 22
BCbites
Pearson Correlation -.417 1
Sig. (2-tailed) .053
N 22 22
a. Cannot be computed because at least one of the variables
is constant.

76
Correlation of pre-meal satiety and grams consumed
(overall)
PreSLIM1 TotalGrams
PreSLIM1
Pearson Correlation 1 -.286**
Sig. (2-tailed) .000
N 195 195
TotalGrams
Pearson Correlation -.286** 1
Sig. (2-tailed) .000
N 195 195
**. Correlation is significant at the 0.01 level (2-tailed).
Correlation of pre-meal satiety and grams consumed (by condition)
Condition PreSLIM1 TotalGrams
1.00
PreSLIM1
Pearson Correlation 1 .057
Sig. (2-tailed) .834
N 16 16
TotalGrams
Pearson Correlation .057 1
Sig. (2-tailed) .834
N 16 16
2.00
PreSLIM1
Pearson Correlation 1 -.231
Sig. (2-tailed) .255
N 26 26
TotalGrams
Pearson Correlation -.231 1
Sig. (2-tailed) .255
N 26 26
3.00
PreSLIM1
Pearson Correlation 1 -.229
Sig. (2-tailed) .474
N 12 12
TotalGrams
Pearson Correlation -.229 1
Sig. (2-tailed) .474
N 12 12
4.00
PreSLIM1
Pearson Correlation 1 .094
Sig. (2-tailed) .728
N 16 16
TotalGrams
Pearson Correlation .094 1
Sig. (2-tailed) .728
N 16 16
5.00
PreSLIM1
Pearson Correlation 1 -.382
Sig. (2-tailed) .144
N 16 16
TotalGrams
Pearson Correlation -.382 1
Sig. (2-tailed) .144
N 16 16
6.00 PreSLIM1 Pearson Correlation 1 -.197

77
Sig. (2-tailed) .482
N 15 15
TotalGrams
Pearson Correlation -.197 1
Sig. (2-tailed) .482
N 15 15
7.00
PreSLIM1
Pearson Correlation 1 -.251
Sig. (2-tailed) .387
N 14 14
TotalGrams
Pearson Correlation -.251 1
Sig. (2-tailed) .387
N 14 14
8.00
PreSLIM1
Pearson Correlation 1 -.570*
Sig. (2-tailed) .033
N 14 14
TotalGrams
Pearson Correlation -.570* 1
Sig. (2-tailed) .033
N 14 14
9.00
PreSLIM1
Pearson Correlation 1 -.495
Sig. (2-tailed) .051
N 16 16
TotalGrams
Pearson Correlation -.495 1
Sig. (2-tailed) .051
N 16 16
10.00
PreSLIM1
Pearson Correlation 1 -.170
Sig. (2-tailed) .562
N 14 14
TotalGrams
Pearson Correlation -.170 1
Sig. (2-tailed) .562
N 14 14
11.00
PreSLIM1
Pearson Correlation 1 -.391
Sig. (2-tailed) .167
N 14 14
TotalGrams
Pearson Correlation -.391 1
Sig. (2-tailed) .167
N 14 14
12.00
PreSLIM1
Pearson Correlation 1 -.309
Sig. (2-tailed) .161
N 22 22
TotalGrams
Pearson Correlation -.309 1
Sig. (2-tailed) .161
N 22 22
*. Correlation is significant at the 0.05 level (2-tailed).
Correlation of pre-meal satiety and bite size
(overall)

78
PreSLIM1 BiteSize
PreSLIM1
Pearson Correlation 1 -.254**
Sig. (2-tailed) .000
N 195 195
BiteSize
Pearson Correlation -.254** 1
Sig. (2-tailed) .000
N 195 195
**. Correlation is significant at the 0.01 level (2-
tailed).
Correlation of pre-meal satiety and bite size (by condition)
Condition PreSLIM1 BiteSize
1.00
PreSLIM1
Pearson Correlation 1 .077
Sig. (2-tailed) .777
N 16 16
BiteSize
Pearson Correlation .077 1
Sig. (2-tailed) .777
N 16 16
2.00
PreSLIM1
Pearson Correlation 1 -.164
Sig. (2-tailed) .424
N 26 26
BiteSize
Pearson Correlation -.164 1
Sig. (2-tailed) .424
N 26 26
3.00
PreSLIM1
Pearson Correlation 1 -.190
Sig. (2-tailed) .554
N 12 12
BiteSize
Pearson Correlation -.190 1
Sig. (2-tailed) .554
N 12 12
4.00
PreSLIM1
Pearson Correlation 1 .053
Sig. (2-tailed) .847
N 16 16
BiteSize
Pearson Correlation .053 1
Sig. (2-tailed) .847
N 16 16
5.00
PreSLIM1
Pearson Correlation 1 -.393
Sig. (2-tailed) .132
N 16 16
BiteSize
Pearson Correlation -.393 1
Sig. (2-tailed) .132
N 16 16
6.00 PreSLIM1 Pearson Correlation 1 -.201

79
Sig. (2-tailed) .473
N 15 15
BiteSize
Pearson Correlation -.201 1
Sig. (2-tailed) .473
N 15 15
7.00
PreSLIM1
Pearson Correlation 1 -.275
Sig. (2-tailed) .342
N 14 14
BiteSize
Pearson Correlation -.275 1
Sig. (2-tailed) .342
N 14 14
8.00
PreSLIM1
Pearson Correlation 1 -.570*
Sig. (2-tailed) .033
N 14 14
BiteSize
Pearson Correlation -.570* 1
Sig. (2-tailed) .033
N 14 14
9.00
PreSLIM1
Pearson Correlation 1 -.524*
Sig. (2-tailed) .037
N 16 16
BiteSize
Pearson Correlation -.524* 1
Sig. (2-tailed) .037
N 16 16
10.00
PreSLIM1
Pearson Correlation 1 -.163
Sig. (2-tailed) .577
N 14 14
BiteSize
Pearson Correlation -.163 1
Sig. (2-tailed) .577
N 14 14
11.00
PreSLIM1
Pearson Correlation 1 -.494
Sig. (2-tailed) .072
N 14 14
BiteSize
Pearson Correlation -.494 1
Sig. (2-tailed) .072
N 14 14
12.00
PreSLIM1
Pearson Correlation 1 -.027
Sig. (2-tailed) .907
N 22 22
BiteSize
Pearson Correlation -.027 1
Sig. (2-tailed) .907
N 22 22
*. Correlation is significant at the 0.05 level (2-tailed).
Correlation of pre-meal satiety and post-meal satiety
(overall)

80
PreSLIM1 PostMealSatie
ty1
PreSLIM1
Pearson Correlation 1 .387**
Sig. (2-tailed) .000
N 195 194
PostMealSatiety1
Pearson Correlation .387** 1
Sig. (2-tailed) .000
N 194 194
**. Correlation is significant at the 0.01 level (2-tailed).
Correlation of pre-meal satiety and post-meal satiety (by condition)
Correlations
Condition PreSLIM1 PostMealSatie
ty1
1.00
PreSLIM1
Pearson Correlation 1 .513*
Sig. (2-tailed) .042
N 16 16
PostMealSatiety1
Pearson Correlation .513* 1
Sig. (2-tailed) .042
N 16 16
2.00
PreSLIM1
Pearson Correlation 1 .683**
Sig. (2-tailed) .000
N 26 26
PostMealSatiety1
Pearson Correlation .683** 1
Sig. (2-tailed) .000
N 26 26
3.00
PreSLIM1
Pearson Correlation 1 .491
Sig. (2-tailed) .105
N 12 12
PostMealSatiety1
Pearson Correlation .491 1
Sig. (2-tailed) .105
N 12 12
4.00
PreSLIM1
Pearson Correlation 1 .014
Sig. (2-tailed) .960
N 16 16
PostMealSatiety1
Pearson Correlation .014 1
Sig. (2-tailed) .960
N 16 16
5.00
PreSLIM1
Pearson Correlation 1 .494
Sig. (2-tailed) .052
N 16 16
PostMealSatiety1
Pearson Correlation .494 1
Sig. (2-tailed) .052
N 16 16

81
6.00
PreSLIM1
Pearson Correlation 1 .020
Sig. (2-tailed) .946
N 15 14
PostMealSatiety1
Pearson Correlation .020 1
Sig. (2-tailed) .946
N 14 14
7.00
PreSLIM1
Pearson Correlation 1 .071
Sig. (2-tailed) .808
N 14 14
PostMealSatiety1
Pearson Correlation .071 1
Sig. (2-tailed) .808
N 14 14
8.00
PreSLIM1
Pearson Correlation 1 .209
Sig. (2-tailed) .474
N 14 14
PostMealSatiety1
Pearson Correlation .209 1
Sig. (2-tailed) .474
N 14 14
9.00
PreSLIM1
Pearson Correlation 1 .056
Sig. (2-tailed) .836
N 16 16
PostMealSatiety1
Pearson Correlation .056 1
Sig. (2-tailed) .836
N 16 16
10.00
PreSLIM1
Pearson Correlation 1 .186
Sig. (2-tailed) .524
N 14 14
PostMealSatiety1
Pearson Correlation .186 1
Sig. (2-tailed) .524
N 14 14
11.00
PreSLIM1
Pearson Correlation 1 .175
Sig. (2-tailed) .549
N 14 14
PostMealSatiety1
Pearson Correlation .175 1
Sig. (2-tailed) .549
N 14 14
12.00
PreSLIM1
Pearson Correlation 1 .597**
Sig. (2-tailed) .003
N 22 22
PostMealSatiety1
Pearson Correlation .597** 1
Sig. (2-tailed) .003
N 22 22
*. Correlation is significant at the 0.05 level (2-tailed).

82
APPENDIX F
F-tests for each dependent variable using pre-meal satiety as a covariate.
DV: grams consumed
Source Type III Sum
of Squares
df Mean Square F Sig.
Corrected Model 324330.083a 12 27027.507 7.224 .000
Intercept 1332148.207 1 1332148.207 356.054 .000
PreSLIM1 44261.343 1 44261.343 11.830 .001
Instruction 5328.484 1 5328.484 1.424 .234
Target 166784.599 5 33356.920 8.916 .000
Instruction *
Target 92915.475 5 18583.095 4.967 .000
Error 680939.183 182 3741.424
Total 8869601.370 195
Corrected Total 1005269.266 194
a. R Squared = .323 (Adjusted R Squared = .278)
DV: bite size
Tests of Between-Subjects Effects
Dependent Variable: BiteSize
Source Type III Sum
of Squares
df Mean Square F Sig.
Corrected Model 548.528a 12 45.711 2.602 .003
Intercept 4558.299 1 4558.299 259.442 .000
PreSLIM1 105.113 1 105.113 5.983 .015
Instruction 89.138 1 89.138 5.073 .025

83
Target 60.179 5 12.036 .685 .635
Instruction *
Target 124.853 5 24.971 1.421 .219
Error 3197.669 182 17.570
Total 33751.181 195
Corrected Total 3746.196 194
a. R Squared = .146 (Adjusted R Squared = .090)
DV: post-meal satiety
Tests of Between-Subjects Effects
Dependent Variable: PostMealSatiety1
Source Type III Sum
of Squares
df Mean Square F Sig.
Corrected Model 19908.356a 12 1659.030 7.923 .000
Intercept 44048.806 1 44048.806 210.351 .000
PreSLIM1 4964.058 1 4964.058 23.705 .000
Instruction 200.274 1 200.274 .956 .329
Target 11003.321 5 2200.664 10.509 .000
Instruction *
Target 250.999 5 50.200 .240 .944
Error 37902.531 181 209.406
Total 725594.000 194
Corrected Total 57810.887 193
a. R Squared = .344 (Adjusted R Squared = .301)

84
APPENDIX G
Data from two of the 12 conditions reported in the current study were historical data.
Specifically, data reported in the bites condition for B12 and B22 were collected in 2014 and
2013/2014 respectfully.
The data collection procedure for the historical data differed from the new data collection
procedures in the following way. First, as mentioned above, the historical data used an early
version of the Bite Counter device whereas the new data collection used a newer version of the
device. Furthermore, an online dietary recall program was used during the collection of the
historical data. The online dietary recall program proved not to be a useful tool so it was not
implemented for the new data collection. Additionally, the protocol for the historical data had a
five minute difference in food preparation time compared to the new data collection protocol.
The new protocol was updated to include the time between when the food was finished cooking
and then moved to the eating station, which was previously unaccounted for. However the time
the food was in the oven was the same in during both collections.
Regarding the data for B12, these data were collected using a similar procedure as B22
and the new data collected for the current study with the exception that a difference male
experimenter administered the sessions. Additionally, the data for B12 was collected in the fall.
Regarding the data B22, these data were collected using a similar procedure as B12 and
the new data collected for the current study, however these data were collected in the winter and
spring. The new data collection took place solely in the spring.