Identifying and Measuring Crowded Strategies and Trades · equity market-neutral funds was enough...
33
JUNE 2015 RESEARCH INSIGHT LOST IN THE CROWD? Identifying and Measuring Crowded Strategies and Trades Mehmet K. Bayraktar, Stuart Doole, Altaf Kassam, Stan Radchenko June 2015
Transcript of Identifying and Measuring Crowded Strategies and Trades · equity market-neutral funds was enough...
JUNE 2015
RESEARCH INSIGHT
LOST IN THE CROWD? Identifying and Measuring Crowded Strategies and Trades
Mehmet K. Bayraktar, Stuart Doole, Altaf Kassam, Stan Radchenko
June 2015
MSCI.COM | PAGE 2 OF 33 © 2015 MSCI Inc. All rights reserved. Please refer to the disclaimer at the end of this document.
LOST IN THE CROWD? | JUNE 2015
Executive Summary............................................................................ 3
Introduction ....................................................................................... 4
What Are Crowded Trades and Positions? ......................................... 6
Existing Approaches To Measuring Crowding .................................... 7
Returns-based Crowding Metrics ....................................................................... 7
Holdings-based Crowding Metrics ...................................................................... 8
The MSCI Crowding Scorecard ........................................................... 9
Mutual Fund Trading Activity ............................................................................. 9
Investor Heterogeneity and Crowded Trades................................................... 10
Hedge Fund Trading Activity ............................................................................. 12
Pair-wise Correlations ....................................................................................... 13
Valuation Dispersion ......................................................................................... 15
Putting It All Together ...................................................................... 17
Conclusion ....................................................................................... 18
References ....................................................................................... 19
Appendix 1: A Survey of Crowding Metrics ...................................... 21
Appendix 2: MSCI Crowding Metrics – Detailed Methodology ......... 22
A. The Short-Interest Crowding Metric ............................................................. 22
B. The Trading Activity Crowding Metric .......................................................... 22
Appendix 3: Crowding Metrics - Factor by Factor ............................ 24
CONTENTS
MSCI.COM | PAGE 3 OF 33 © 2015 MSCI Inc. All rights reserved. Please refer to the disclaimer at the end of this document.
LOST IN THE CROWD? | JUNE 2015
EXECUTIVE SUMMARY
The “quant meltdown” of August 2007 and the subsequent unfolding of the global financial
crisis highlighted the risks of crowded investment strategies. The rapid growth of “smart
beta” indexes and their use in ETFs has added to the need for scrutiny. Accounting for
crowding risk is necessary for any investment strategy because it may explain a substantial
portion of strategy risk and performance during certain periods, especially during times of
excessive market volatility.1
In this paper, we propose a set of four key metrics — our “MSCI Crowding Scorecard” — for
monitoring and detecting the crowding risk of any investment strategy. This work builds on
our innovative analysis of historical behaviors of investment strategies and MSCI’s next
generation equity risk models which incorporate Systematic Equity Strategies (SES):
MSCI Crowding Scorecard
1. Mutual Fund Trading Activity
2. Hedge Fund Trading Activity
3. Pair-wise Correlations (“co-momentum”)
4. Valuation Dispersion
The first two measures help capture crowding in the trading activity of various market
participants, such as Value and Growth managers, and pinpoint the overlap in trading
activity of otherwise heterogeneous investors. The last two measures capture the pricing
and valuation impacts of such trading activity. Both sets of measures are essential in
developing a Crowding Scorecard.
Finally, using the Crowding Scorecard, we find there were reasons to be moderately
concerned about crowding in the U.S. Momentum factor as of the end of 2014.
The MSCI Crowding Scorecard can also be applied to single stocks, indexes and active
strategies, making it an important tool for investment and risk managers following both
quantitative and fundamental strategies — including recently popular factor index
approaches. Using this approach can help managers understand the risks of overlap in
trading strategies that may not be apparent by focusing on one of these metrics alone.
Our next areas of research are to extend the analysis to a global universe and to build stock-
specific crowding scores.
1 We first discussed the importance of Systematic Equity Strategy (SES) factors in capturing crowding risk in Bayraktar,
Mehmet K., Stan Radchenko, Kurt Winkelmann and Peter J. Zangari. (2013). Employing Systematic Equity Strategies:
Distinguishing Important Sources of Risk from Common Sources of Return. MSCI Research. (Access restricted to clients.)
MSCI.COM | PAGE 4 OF 33 © 2015 MSCI Inc. All rights reserved. Please refer to the disclaimer at the end of this document.
LOST IN THE CROWD? | JUNE 2015
INTRODUCTION
Since the “quant meltdown” of August 2007 and the subsequent unfolding of the global
financial crisis, interest in measuring and monitoring crowding of systematic investment
strategies has grown substantially. The rapid growth of smart beta indexes and their use in
ETFs has only added to the degree of scrutiny.
A prevailing consensus for the cause of the quant meltdown is that similarities in
quantitative equity managers’ holdings and trading styles together with their collective need
for liquidity during the crisis led to sharply negative returns for many popular quantitative
strategies. These outlier returns confounded the average correlations between strategies
that had been historically observed and upon which many quant models’ construction was
predicated.2
Perhaps an even more striking example of a crowded trade took place during the global
financial crisis. This time, the wider investment community “ran for the exits,” pushing the
stock prices of financial firms towards zero. The bounce-back of these securities during
March 2009 was so significant that it resulted in one of the worst-ever historical
performances of the Momentum factor and Momentum-based investment strategies.
By analyzing the historical behaviors of investment strategies, in particular around these
events, as well as drawing on existing academic and empirical research, we have developed
a set of four crowding metrics, which together we call our “MSCI Crowding Scorecard”:
1. Mutual Fund Trading Activity (using mutual fund holdings and trades)
2. Hedge Fund Trading Activity (based on short-interest)
3. Pair-wise Correlations (“co-momentum”)
4. Valuation Dispersion (using price-to-book spreads)
MSCI’s Crowding Scorecard, which can also be applied to single stocks, indexes and active
strategies, is an innovative tool for investment and risk managers following both
quantitative and fundamental strategies — including recently popular factor index
approaches.
2 There is considerable debate as to the exact trigger. For example, Khandani and Lo (2007, 2008) analyzed hedge-fund
data alongside high frequency simulations to suggest that the rapid liquidation of a few (even one) large quantitative
equity market-neutral funds was enough to set events in motion. Others, such as Emrich and Crow (2007, 2008), have
suggested that the enormous growth in assets under management allied to then prevailing levels of leverage in
essentially copycat quant strategies made for a fragile “quant bubble.” They found that portfolio managers had not
noticed that they had changed from being price-takers into price-makers.

MSCI.COM | PAGE 5 OF 33 © 2015 MSCI Inc. All rights reserved. Please refer to the disclaimer at the end of this document.
LOST IN THE CROWD? | JUNE 2015
The MSCI Crowding Scorecard can help managers understand the risks of overlap in trading
strategies that may not be apparent by focusing on one of these metrics alone.
MSCI.COM | PAGE 6 OF 33 © 2015 MSCI Inc. All rights reserved. Please refer to the disclaimer at the end of this document.
LOST IN THE CROWD? | JUNE 2015
WHAT ARE CROWDED TRADES AND POSITIONS?
Crowded trades refer to trading activity involving a significant number of market participants
with large pools of capital who trade in and out of stock positions in order to pursue the
same, or very similar, investment strategies. A crowded position happens when there is a
significant overlap of portfolio positions and allocations as a result of crowded trades which,
in total, add up to a significant share of a stock’s free-float market capitalization.3
Crowded trades generally result (at least in the short- to medium-term) in improved market
efficiency. As a result, the forward-looking (expected) risk-adjusted return of a strategy
declines as it becomes more crowded. Crowding thus reduces the future effectiveness of a
given investment strategy in predicting stock returns. Depending on the extent of frictions,
such as shorting constraints and transactions costs, this overlap of positions among
managers may result in extreme levels of risk when those investors experience negative
shocks in other parts of their portfolios, forcing them to liquidate their positions (selling
what they can, rather than what they would necessarily like to). These “fire sales” may then
cause losses for other investors following the same strategy and result in further
liquidations, driving stock prices into a downward spiral. The “quant meltdown” is now a
classic example of a crowded trade that resulted in significant performance drawdowns.
Crowding risk also affects a wide range of so-called “unanchored” strategies, such as
Momentum or Quality, that do not rely on a consistent or independent estimate of
fundamental value (Hong & Stein (1999), Stein (2009)). Investors tend to employ reasonable
capacity assumptions in pursuing their own strategy, but they may underestimate the
aggregate amount of capital following similar strategies. In this case, stock prices may over-
or under-shoot their fundamental value and experience a sharp correction in subsequent
periods as prices adjust to reflect fundamentals.
Given the potential risks associated with trading such strategies, it is important for managers
to identify and measure them. To help portfolio and risk managers manage these risks, we
have strengthened our models by including Systematic Equity Strategy (SES) factors in all our
new generation MSCI equity models. We view SES factors as proxies of popular, potentially
crowded systematic investment strategies.4 Next, we develop a set of metrics for the
3 Thesmar (2011) and Greenwood and Thesmar (2011) define a crowded trading strategy as one where a significant
amount of assets are tied to the same signal whereas a crowded asset is a stock which is co-owned to a great extent by
traders or portfolio managers using the same signal.
4 The list of new models with SES factors includes: Japan total market equity model, US total market model for long-term
investors, US total market trading model, US sector models, US small cap model, Emerging Market model, Asia equity
model, China International model and Korea model.
MSCI.COM | PAGE 7 OF 33 © 2015 MSCI Inc. All rights reserved. Please refer to the disclaimer at the end of this document.
LOST IN THE CROWD? | JUNE 2015
monitoring and diagnosis of crowding in factors, MSCI’s Crowding Scorecard, which can also
apply to factor indexes, portfolios, alpha signals, trades and even stocks.
EXISTING APPROACHES TO MEASURE CROWDING
When developing MSCI’s Crowding Scorecard, we divided crowding metrics into two broad
categories: returns-based and holdings-based. Although the mix of assets (and how the
assets are managed) of a particular strategy may determine which approach is most
appropriate, we believe both have advantages and disadvantages. We recommend investors
use them together.
Returns-based analysis can provide timely and high frequency measures of investor trading
activity, and hence crowding. Returns-based metrics capture activity that is impacted by the
market’s overall liquidity indirectly and not necessarily by crowding and trading in a
particular strategy. In contrast, holdings-based analysis includes the use of institutional
holdings, flows data and short-interest data, providing a direct measure of institutional
trades and potentially insights into style tilts of investor purchases and sales. However, this
granularity comes at a cost: holdings data have lower publishing frequency compared to
returns data and may be released with a substantial lag.5 Appendix 1 provides a
comprehensive summary of the metrics used in the relevant literature.
RETURNS-BASED CROWDING METRICS
Returns-based crowding metrics may be further divided into metrics that use individual
stock returns data and those that use aggregate fund level returns data.
Strategy crowding is a concentration by investors in stocks with similar properties, leading to
increased correlations. In particular, Lou and Polk (2013) looked at stock-specific6 return
partial-correlations, so-called “co-momentum,” among various sets of stocks (top or bottom
decile, for example) based on rankings of SES-type stock characteristics. Similarly, Cahan et
al. (2012b) proposed using median pairwise stock correlation and median pairwise tail
dependence to evaluate a variety of minimum variance strategies.
Fund-based return metrics follow a similar approach using fund data. For example,
Gustafson and Halper (2010, 2011) used two returns-based measures: median pairwise
monthly excess fund return correlations and signs of a near-zero median return for the fund
peer group allied to low dispersion of returns across the peer group. Pojarliev and Levich
(2013) used fund returns to estimate fund sensitivity to systematic factors in currency
5 SEC regulation allows mutual funds to provide holdings data with a lag up to 45 days.
6 Net of the Fama-French size, value and market factors.
MSCI.COM | PAGE 8 OF 33 © 2015 MSCI Inc. All rights reserved. Please refer to the disclaimer at the end of this document.
LOST IN THE CROWD? | JUNE 2015
markets7 and measured crowding via the percentage difference between the number of
funds with significant positive and negative exposures.
HOLDINGS-BASED CROWDING METRICS
Holdings-based crowding metrics are based on institutional holdings and flows data, short
interest data and valuation-based metrics as measures and symptoms of the crowding of
managers into particular strategies. The underlying idea is that stocks with significant tilts,
either long or short, and especially with a high correlation of changes in these active
weights, might be crowded and thus vulnerable to excess volatility or sharp reversals.
Gustafson and Halper (2010, 2011) calculated average pair-wise correlations for total and
active weights and also looked at average factor exposures to check for signs of
heterogeneity among portfolio managers.
Thesmar (2011) used mutual fund flows data to develop a ”fragility” measure that aims to
capture the similarity in fund flows and concentration of portfolios’ holdings. The measure is
based upon the covariance matrix of flow-driven trades, weighted by ownership, and is high
when stock ownership is concentrated and owners face volatile and correlated flow
patterns.
Cahan et al (2012a) and Hanson and Sunderam (2014) used short interest data8 to detect
factors that institutional investors are tilting on. These papers examine differences in short
interest level between sets of stocks grouped based on their factor exposures, adjusted for
common risk factors. Intuitively, there should be a high degree of difference in the level of
short interest between stocks that score poorly and those that score highly based on an SES
factor because investors are expected to short poorly ranked stocks and go long highly
ranked stocks.
Different markets may benefit from their own specialized crowding measures, especially in
respect of holdings-based metrics. For example, Murakami et al (2014) examined the
influence of crowding on factor performance using a measure emphasizing the influence of
non-resident investors. In recent academic work, Yost-Bremm (2014) looked at the impact of
crowding for factor indexes related to the Fama-French factors at rebalances while Dangl
and Kashofer (2013) focused on signs of over-crowding and over-valuation in minimum
variance investing.
8 Hanson and Sunderam (2014) use the level of short interest while Cahan et al. (2012 a) look at capacity utilization.
MSCI.COM | PAGE 9 OF 33 © 2015 MSCI Inc. All rights reserved. Please refer to the disclaimer at the end of this document.
LOST IN THE CROWD? | JUNE 2015
THE MSCI CROWDING SCORECARD
In this section, we build on the existing literature regarding crowding risk and introduce four
metrics that collectively aim to capture crowding risk:
Mutual Fund Trading Activity (using mutual fund holdings and trades)
Hedge Fund Trading Activity (based on short-interest)
Pair-wise Correlations (“co-momentum”)
Valuation Dispersion (using price-to-book spreads)
MUTUAL FUND TRADING ACTIVITY
Our first measure of crowding captures the factor exposures of the aggregate trading
portfolio of U.S. mutual funds using MSCI’s Peer Analytics dataset. The details of the metric
construction are presented in Appendix 2. Our premise is that crowding in a factor can be
observed via the aggregate holdings and trading of mutual fund managers.
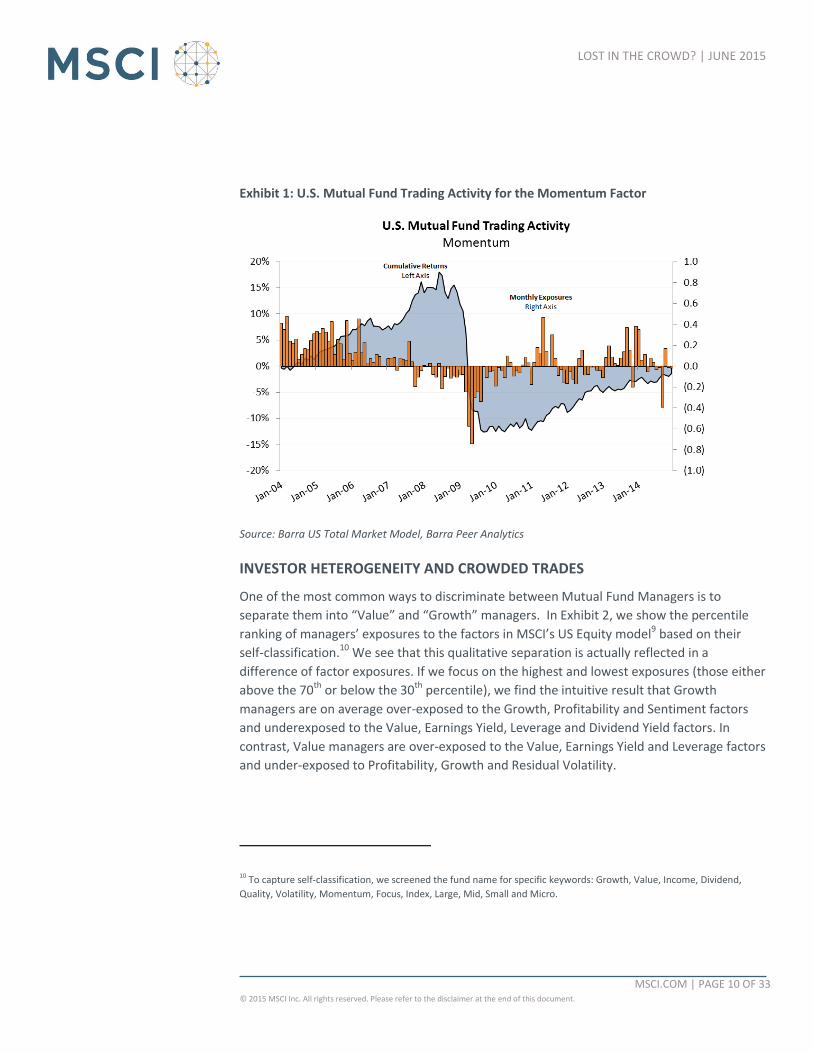
We illustrate the approach using the Momentum Factor in Exhibit 1, which shows the
estimated exposure of the aggregate trading portfolio to the Momentum factor over the
period 2004-2014. We also show the cumulative performance of the factor. The exhibit
indicates that:
Mutual funds were net buyers of Momentum over 2004-2007. The behavior then
changed in 2008 when they became net sellers until the beginning of 2011.
The level of negative exposure to Momentum of mutual funds’ trades was largest during
the Momentum crash of March-April 2009.
Net purchases of Momentum returned near their pre-crisis levels in 2011 and 2013.
MSCI.COM | PAGE 10 OF 33 © 2015 MSCI Inc. All rights reserved. Please refer to the disclaimer at the end of this document.
LOST IN THE CROWD? | JUNE 2015
Exhibit 1: U.S. Mutual Fund Trading Activity for the Momentum Factor
Source: Barra US Total Market Model, Barra Peer Analytics
INVESTOR HETEROGENEITY AND CROWDED TRADES
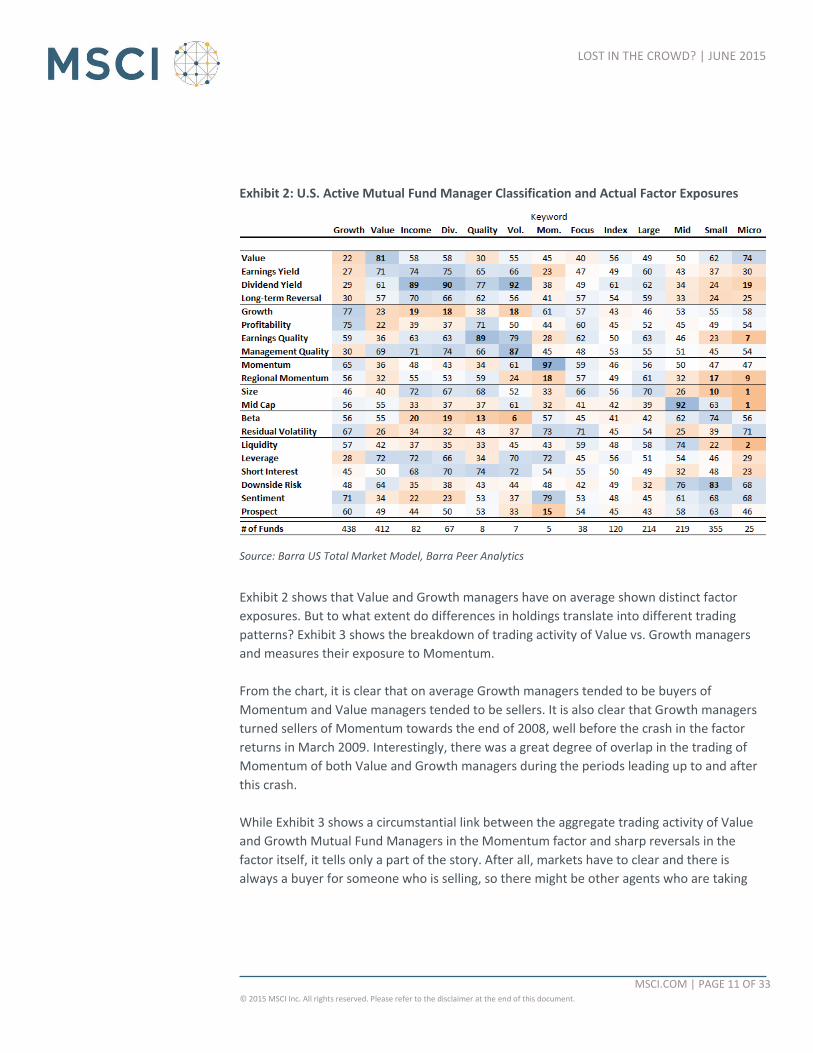
One of the most common ways to discriminate between Mutual Fund Managers is to
separate them into “Value” and “Growth” managers. In Exhibit 2, we show the percentile
ranking of managers’ exposures to the factors in MSCI’s US Equity model9 based on their
self-classification.10 We see that this qualitative separation is actually reflected in a
difference of factor exposures. If we focus on the highest and lowest exposures (those either
above the 70th or below the 30th percentile), we find the intuitive result that Growth
managers are on average over-exposed to the Growth, Profitability and Sentiment factors
and underexposed to the Value, Earnings Yield, Leverage and Dividend Yield factors. In
contrast, Value managers are over-exposed to the Value, Earnings Yield and Leverage factors
and under-exposed to Profitability, Growth and Residual Volatility.
10 To capture self-classification, we screened the fund name for specific keywords: Growth, Value, Income, Dividend,
Quality, Volatility, Momentum, Focus, Index, Large, Mid, Small and Micro.
MSCI.COM | PAGE 11 OF 33 © 2015 MSCI Inc. All rights reserved. Please refer to the disclaimer at the end of this document.
LOST IN THE CROWD? | JUNE 2015
Exhibit 2: U.S. Active Mutual Fund Manager Classification and Actual Factor Exposures
Source: Barra US Total Market Model, Barra Peer Analytics
Exhibit 2 shows that Value and Growth managers have on average shown distinct factor
exposures. But to what extent do differences in holdings translate into different trading
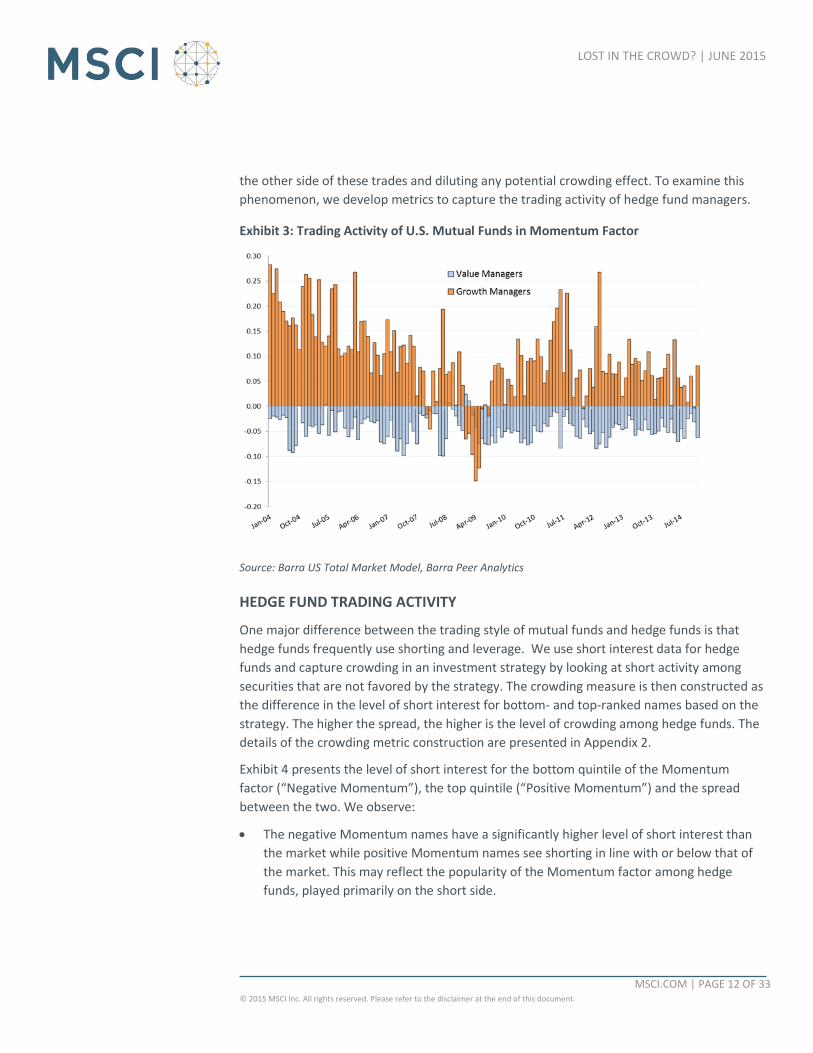
patterns? Exhibit 3 shows the breakdown of trading activity of Value vs. Growth managers
and measures their exposure to Momentum.
From the chart, it is clear that on average Growth managers tended to be buyers of
Momentum and Value managers tended to be sellers. It is also clear that Growth managers
turned sellers of Momentum towards the end of 2008, well before the crash in the factor
returns in March 2009. Interestingly, there was a great degree of overlap in the trading of
Momentum of both Value and Growth managers during the periods leading up to and after
this crash.
While Exhibit 3 shows a circumstantial link between the aggregate trading activity of Value
and Growth Mutual Fund Managers in the Momentum factor and sharp reversals in the
factor itself, it tells only a part of the story. After all, markets have to clear and there is
always a buyer for someone who is selling, so there might be other agents who are taking
MSCI.COM | PAGE 12 OF 33 © 2015 MSCI Inc. All rights reserved. Please refer to the disclaimer at the end of this document.
LOST IN THE CROWD? | JUNE 2015
the other side of these trades and diluting any potential crowding effect. To examine this
phenomenon, we develop metrics to capture the trading activity of hedge fund managers.
Exhibit 3: Trading Activity of U.S. Mutual Funds in Momentum Factor
Source: Barra US Total Market Model, Barra Peer Analytics
HEDGE FUND TRADING ACTIVITY
One major difference between the trading style of mutual funds and hedge funds is that
hedge funds frequently use shorting and leverage. We use short interest data for hedge
funds and capture crowding in an investment strategy by looking at short activity among
securities that are not favored by the strategy. The crowding measure is then constructed as
the difference in the level of short interest for bottom- and top-ranked names based on the
strategy. The higher the spread, the higher is the level of crowding among hedge funds. The
details of the crowding metric construction are presented in Appendix 2.
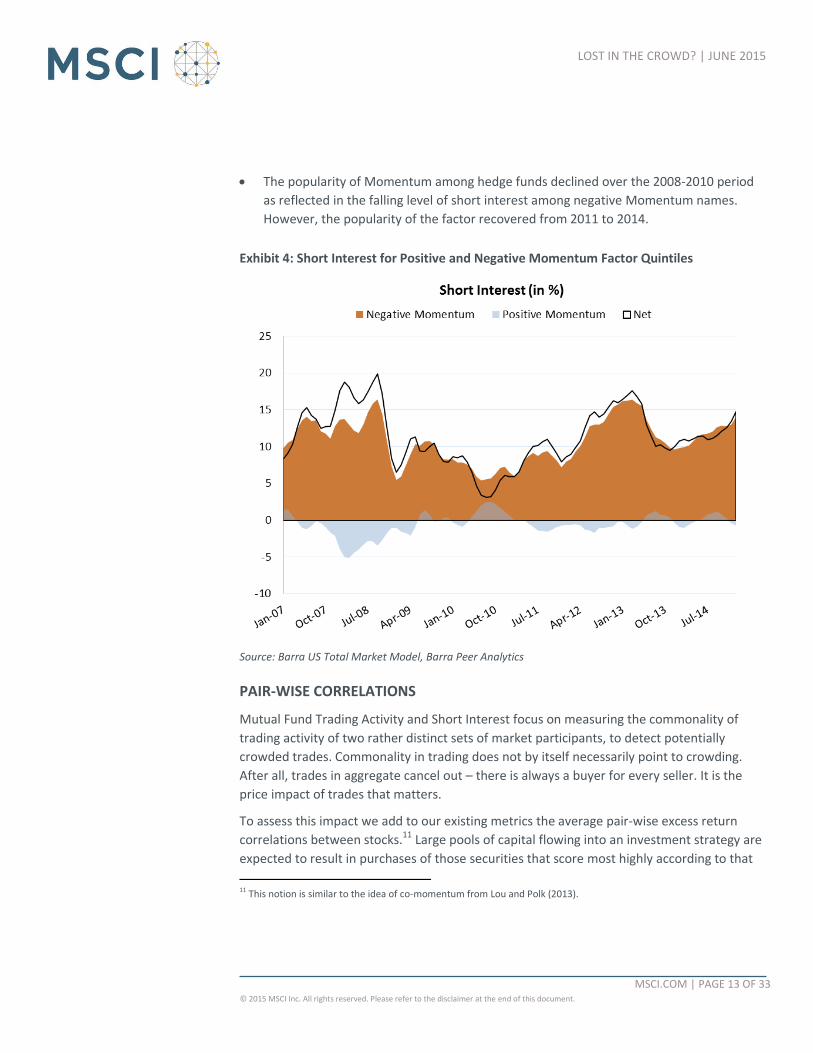
Exhibit 4 presents the level of short interest for the bottom quintile of the Momentum
factor (“Negative Momentum”), the top quintile (“Positive Momentum”) and the spread
between the two. We observe:
The negative Momentum names have a significantly higher level of short interest than
the market while positive Momentum names see shorting in line with or below that of
the market. This may reflect the popularity of the Momentum factor among hedge
funds, played primarily on the short side.
MSCI.COM | PAGE 13 OF 33 © 2015 MSCI Inc. All rights reserved. Please refer to the disclaimer at the end of this document.
LOST IN THE CROWD? | JUNE 2015
The popularity of Momentum among hedge funds declined over the 2008-2010 period
as reflected in the falling level of short interest among negative Momentum names.
However, the popularity of the factor recovered from 2011 to 2014.
Exhibit 4: Short Interest for Positive and Negative Momentum Factor Quintiles
Source: Barra US Total Market Model, Barra Peer Analytics
PAIR-WISE CORRELATIONS
Mutual Fund Trading Activity and Short Interest focus on measuring the commonality of
trading activity of two rather distinct sets of market participants, to detect potentially
crowded trades. Commonality in trading does not by itself necessarily point to crowding.
After all, trades in aggregate cancel out – there is always a buyer for every seller. It is the
price impact of trades that matters.
To assess this impact we add to our existing metrics the average pair-wise excess return
correlations between stocks.11 Large pools of capital flowing into an investment strategy are
expected to result in purchases of those securities that score most highly according to that
11 This notion is similar to the idea of co-momentum from Lou and Polk (2013).

MSCI.COM | PAGE 14 OF 33 © 2015 MSCI Inc. All rights reserved. Please refer to the disclaimer at the end of this document.
LOST IN THE CROWD? | JUNE 2015
strategy. Conversely, outflows of capital are expected to result in sales of those same
securities along with net purchases of securities that have a low score according to the
strategy. In both cases, stock-level pair-wise correlations within the highest and lowest
quartiles are expected to increase.
We measure stock-level correlations by first stripping out the systematic component of
stocks returns (i.e., using stock-specific returns from the long-term US Total Market Model),
and then calculating rolling pair-wise correlations of those securities that fall in either the
top or the bottom quintile of factor scores.
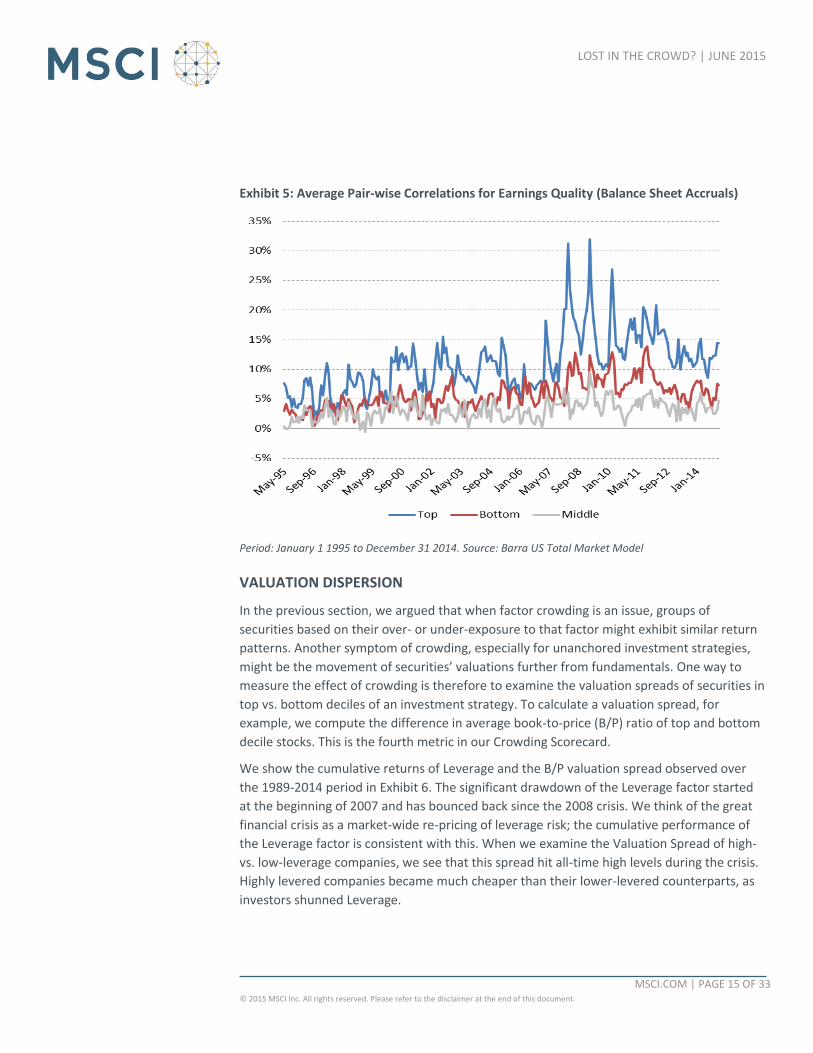
The pair-wise correlations for the Accruals component of the Earnings Quality factor in the
Barra US Total Market Model are shown in Exhibit 5. The chart illustrates a strong seasonal
pattern in correlations during earnings announcement periods. Balance sheet and income
statement information is updated quarterly, so there is increased trading based on this
information. The average pair-wise correlations of both the top and bottom quintiles of this
factor have generally been above the middle quintile, illustrating the popularity of this
factor; the higher pair-wise correlation in the top quintile and the general trend upward in
this measure show the greater and increasing popularity of playing this factor on the long
side (i.e. buying higher Earnings Quality names).
MSCI.COM | PAGE 15 OF 33 © 2015 MSCI Inc. All rights reserved. Please refer to the disclaimer at the end of this document.
LOST IN THE CROWD? | JUNE 2015
Exhibit 5: Average Pair-wise Correlations for Earnings Quality (Balance Sheet Accruals)
Period: January 1 1995 to December 31 2014. Source: Barra US Total Market Model
VALUATION DISPERSION
In the previous section, we argued that when factor crowding is an issue, groups of
securities based on their over- or under-exposure to that factor might exhibit similar return
patterns. Another symptom of crowding, especially for unanchored investment strategies,
might be the movement of securities’ valuations further from fundamentals. One way to
measure the effect of crowding is therefore to examine the valuation spreads of securities in
top vs. bottom deciles of an investment strategy. To calculate a valuation spread, for
example, we compute the difference in average book-to-price (B/P) ratio of top and bottom
decile stocks. This is the fourth metric in our Crowding Scorecard.
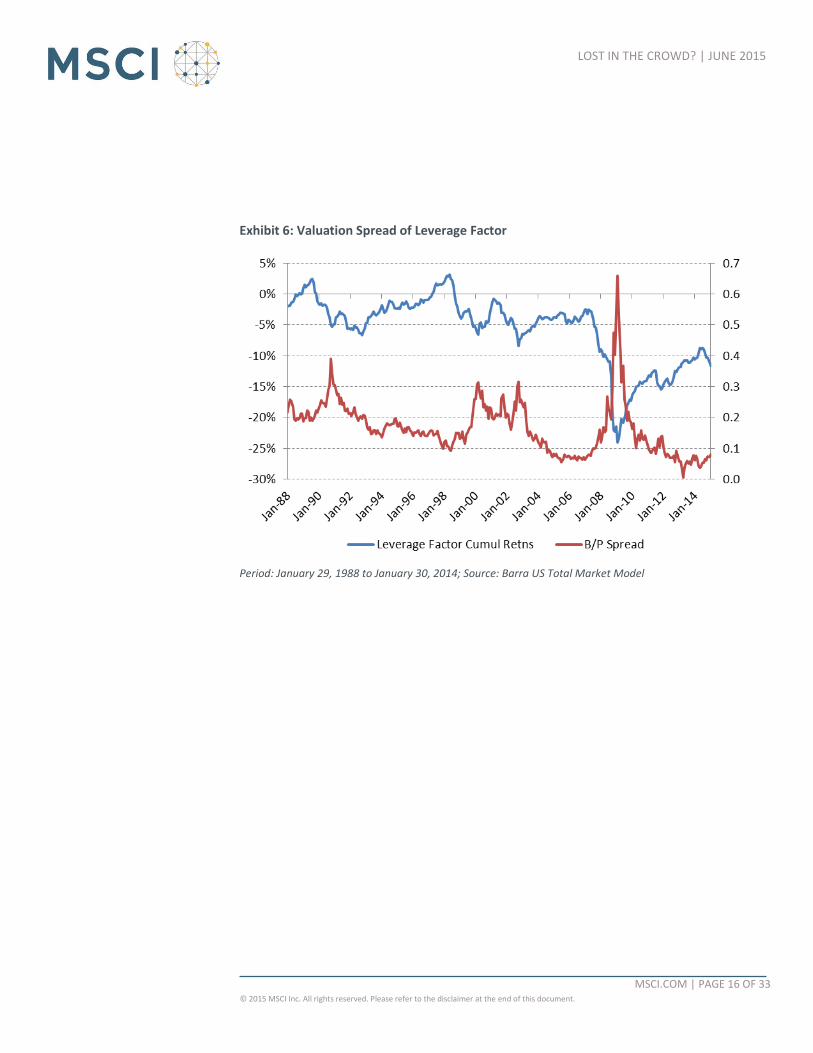
We show the cumulative returns of Leverage and the B/P valuation spread observed over
the 1989-2014 period in Exhibit 6. The significant drawdown of the Leverage factor started
at the beginning of 2007 and has bounced back since the 2008 crisis. We think of the great
financial crisis as a market-wide re-pricing of leverage risk; the cumulative performance of
the Leverage factor is consistent with this. When we examine the Valuation Spread of high-
vs. low-leverage companies, we see that this spread hit all-time high levels during the crisis.
Highly levered companies became much cheaper than their lower-levered counterparts, as
investors shunned Leverage.
MSCI.COM | PAGE 16 OF 33 © 2015 MSCI Inc. All rights reserved. Please refer to the disclaimer at the end of this document.
LOST IN THE CROWD? | JUNE 2015
Exhibit 6: Valuation Spread of Leverage Factor
Period: January 29, 1988 to January 30, 2014; Source: Barra US Total Market Model
MSCI.COM | PAGE 17 OF 33 © 2015 MSCI Inc. All rights reserved. Please refer to the disclaimer at the end of this document.
LOST IN THE CROWD? | JUNE 2015
PUTTING IT ALL TOGETHER
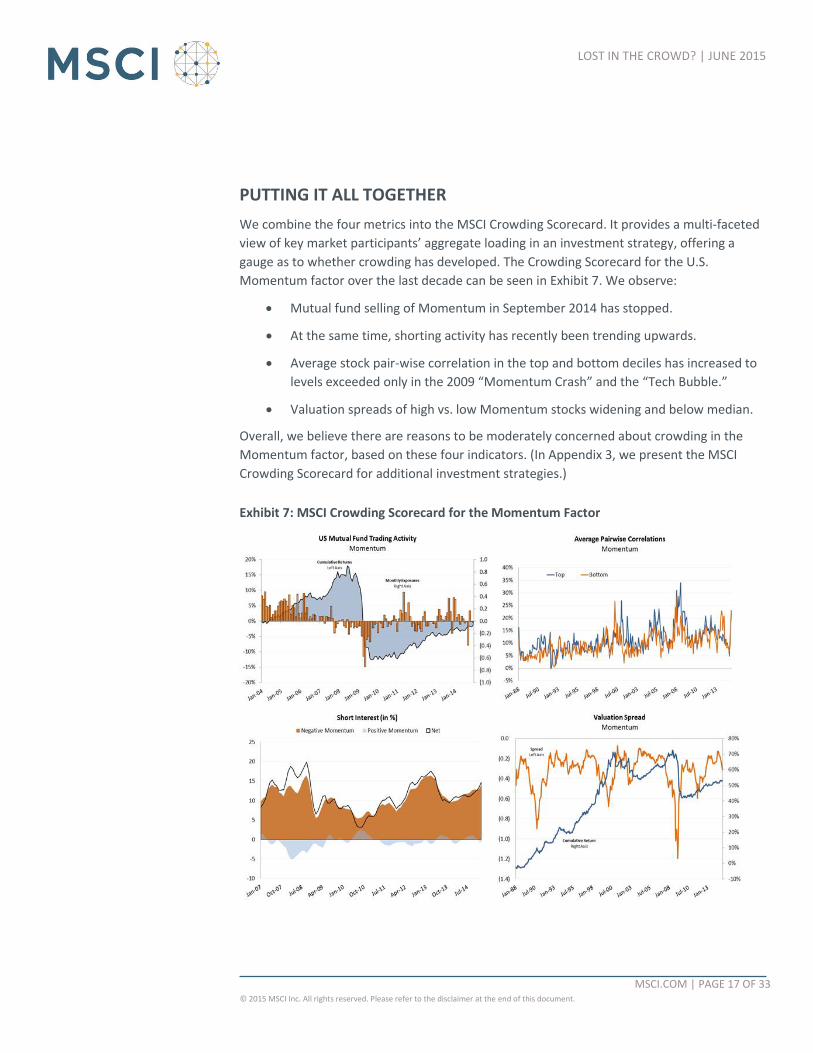
We combine the four metrics into the MSCI Crowding Scorecard. It provides a multi-faceted
view of key market participants’ aggregate loading in an investment strategy, offering a
gauge as to whether crowding has developed. The Crowding Scorecard for the U.S.
Momentum factor over the last decade can be seen in Exhibit 7. We observe:
Mutual fund selling of Momentum in September 2014 has stopped.
At the same time, shorting activity has recently been trending upwards.
Average stock pair-wise correlation in the top and bottom deciles has increased to
levels exceeded only in the 2009 “Momentum Crash” and the “Tech Bubble.”
Valuation spreads of high vs. low Momentum stocks widening and below median.
Overall, we believe there are reasons to be moderately concerned about crowding in the
Momentum factor, based on these four indicators. (In Appendix 3, we present the MSCI
Crowding Scorecard for additional investment strategies.)
Exhibit 7: MSCI Crowding Scorecard for the Momentum Factor
MSCI.COM | PAGE 18 OF 33 © 2015 MSCI Inc. All rights reserved. Please refer to the disclaimer at the end of this document.
LOST IN THE CROWD? | JUNE 2015
CONCLUSION
Interest in crowding has grown substantially over the past decade. The “quant meltdown” of
August 2007 and the subsequent unfolding of the global financial crisis generated significant
interest in the design of metrics to capture the “crowdedness” of an investment strategy.
The rapid growth of factor indexes (also referred to as “smart beta” strategies) and their use
in ETFs has increased the need for managers and investors alike to understand the impact of
crowding.
Given the potential risks associated with such trading strategies, it is important for managers
to identify and measure their crowding risk. In this paper, we developed a set of metrics for
the monitoring and diagnosis of crowding in factors, our MSCI Crowding Scorecard. We
showcased the MSCI Crowding Scorecard for Momentum investment strategy and presented
results for a range of key alpha and risk factors in MSCI’s US Total Market Model to assess
their recent state of crowding.
The MSCI Crowding Scorecard, which can also be applied to single stocks, indexes and active
strategies, is an important tool for investment and risk managers, following both
quantitative and fundamental strategies — including recently popular factor index
approaches. Using this Scorecard can help managers understand the risks of overlap in
trading strategies which may not be apparent by focusing on a single metric alone.
In short, MSCI’s Crowding Scorecard can help managers and investors from getting lost in
the crowd.
MSCI.COM | PAGE 19 OF 33 © 2015 MSCI Inc. All rights reserved. Please refer to the disclaimer at the end of this document.
LOST IN THE CROWD? | JUNE 2015
REFERENCES
Bayraktar, Mehmet K., Stan Radchenko, Kurt Winkelmann and Peter J. Zangari. (2013).
“Employing Systematic Equity Strategies.” MSCI Research.
Cahan, Rochester, Yin Luo, Miguel Alvarez, Javed Jussa, Zongye Chen and Sheng Wang.
(2012a) “Standing Out From the Crowd.” Deutsche Bank, January 31.
Cahan, Rochester, Miguel Alvarez, Yin Luo, Javed Jussa, John Chen and Sheng Wang. (2012b).
“The Risk in Low Risk?” Deutsche Bank, July 19.
Cheung, Wing and Mayank Mishra. (2010). “Crowded Trades: A Bayesian Remedy for Factor-
based Quants.” Nomura working paper.
Dangl, Thomas and Michael Kashofer. (2013). “Minimum-Variance Stock Picking: A Shift in
Preferences for Minimum-Variance Portfolio Constituents.” Vienna University of Technology
working paper.
Emrich, Simon and Charles Crow. (2007). “Quant 2.0?” Morgan Stanley Global Quantitative
Insights, December 18.
Emrich, Simon and Charles Crow. (2008). “Quants — Victims of Circumstance?” Morgan
Stanley Global Quantitative Insights, February 4.
Fraser-Jenkins, Inigo, Saurabh Katiyar, Ian Scott, Shanthi Nair, Mark Diver, Rishav Dev and
Maureen Hughes. (2010). “Benchmarking Quant.” (Series Initiation). Nomura, November 4.
Greenwood, Robin and David Thesmar. (2011). “Stock Price Fragility.” Journal of Financial
Economics, Vol. 102, Issue 3: 26-44.
Gustafson, Keith and Patricia Halper. (2010). “Are Quants All Fishing in the Same Small Pond
with the Same Tackle Box? Journal of Investing, Vol. 19, No. 4: 104-115.
Gustafson, Keith and Patricia Halper. (2011). “Are Quants All Fishing in the Same Small Pond
with the Same Tackle Box?” Annual Northfield Conference presentation.
Hanson, Samuel G. and Adi Sunderam. (2014). “The Growth and Limits of Arbitrage:
Evidence from Short Interest.” The Review of Financial Studies, Vol. 27, No. 4, 1238-1286.
Hong, Harrison and Jeremy C. Stein. (1999). “A Unified Theory of Underreaction, Momentum
Trading, and Overreaction in Asset Markets.” Journal of Finance, Vol. 54, No. 6: 2143-2184.
Khandani, Amir E. and Andrew W. Lo. (2007). “What Happened to the Quants in August
2007?” MIT working paper.
MSCI.COM | PAGE 20 OF 33 © 2015 MSCI Inc. All rights reserved. Please refer to the disclaimer at the end of this document.
LOST IN THE CROWD? | JUNE 2015
Khandani, Amir E. and Andrew W. Lo. (2008). “What Happened to the Quants in August
2007? Evidence from Factors and Transactions Data.” MIT working paper - Published in
Journal of Financial Markets, (2011), Vol. 14, No. 1: 1-46.
Lakonishok, Josef and Bhaskaran Swaminathan. (2010). “Quantitative vs. Fundamental
Institutional Money Managers: An Empirical Analysis.” LSV Asset Management working
paper.
Lou, Dong and Christopher Polk. (2013). “Comomentum: Inferring Arbitrage Activity from
Return Correlations.” Working paper, London School of Economics. Submitted to The Journal
of Political Economy.
Murakami, Akihiro, Naoko Kato and Tomoyo Izumi. (2014). “Active Funds are Still Facing
Headwinds.” Nomura, April 30.
Pojarliev, Momtchil and Richard M. Levich. (2009). “Detecting Crowded Trades in Currency
Funds.” Working paper – published in Financial Analysts Journal, (2011), Vol. 67 No. 1): 26-
39.
Stein, Jeremy C. (2009). “Presidential Address: Sophisticated Investors and Market
Efficiency.” Journal of Finance, Vol. 64, No. 4: 1517-1548.
Thesmar, David. (2011). “Stock Price Fragility, Crowded Trades and Implications for Quant
Managers.” HEC Paris working paper presented at JP Morgan 2011 Quant Conference.
Yost-Bremm, Chris. (2014). “Abnormal Trading Around Common Factor Pricing Models.”
Texas A&M University working paper.
MSCI.COM | PAGE 21 OF 33 © 2015 MSCI Inc. All rights reserved. Please refer to the disclaimer at the end of this document.
LOST IN THE CROWD? | JUNE 2015
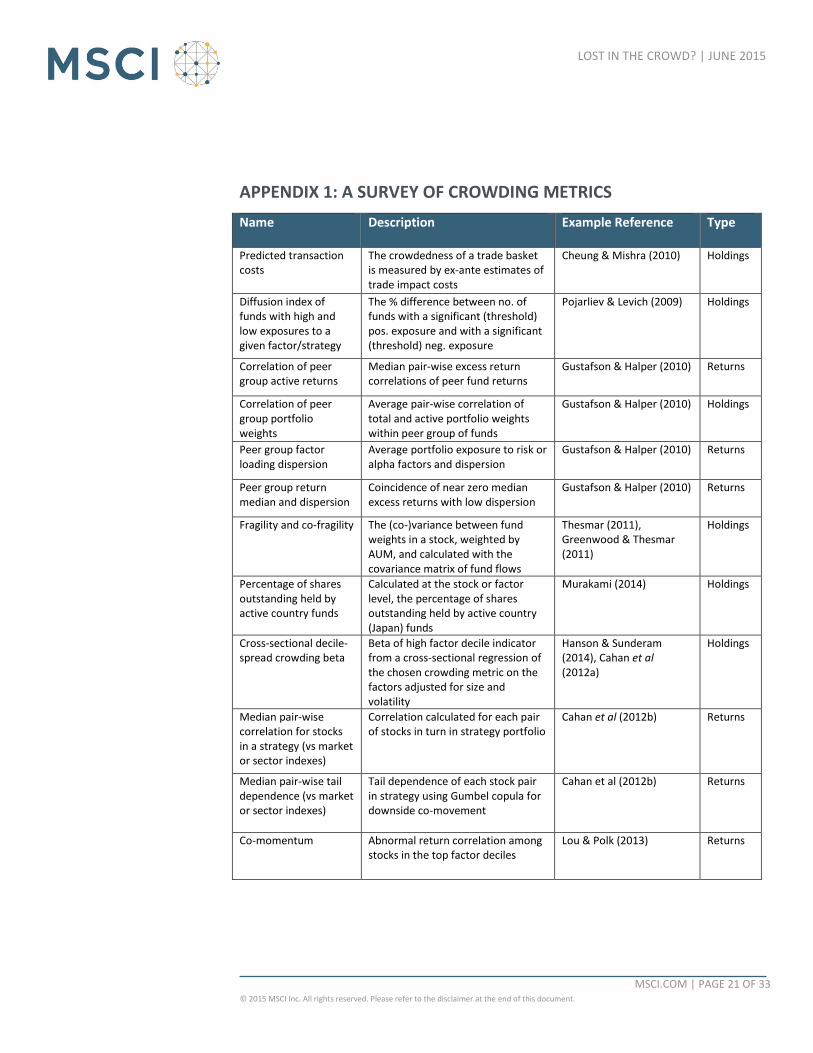
APPENDIX 1: A SURVEY OF CROWDING METRICS
Name Description Example Reference Type
Predicted transaction costs
The crowdedness of a trade basket is measured by ex-ante estimates of trade impact costs
Cheung & Mishra (2010) Holdings
Diffusion index of funds with high and low exposures to a given factor/strategy
The % difference between no. of funds with a significant (threshold) pos. exposure and with a significant (threshold) neg. exposure
Pojarliev & Levich (2009) Holdings
Correlation of peer group active returns
Median pair-wise excess return correlations of peer fund returns
Gustafson & Halper (2010) Returns
Correlation of peer group portfolio weights
Average pair-wise correlation of total and active portfolio weights within peer group of funds
Gustafson & Halper (2010) Holdings
Peer group factor loading dispersion
Average portfolio exposure to risk or alpha factors and dispersion
Gustafson & Halper (2010) Returns
Peer group return median and dispersion
Coincidence of near zero median excess returns with low dispersion
Gustafson & Halper (2010) Returns
Fragility and co-fragility The (co-)variance between fund weights in a stock, weighted by AUM, and calculated with the covariance matrix of fund flows
Thesmar (2011), Greenwood & Thesmar (2011)
Holdings
Percentage of shares outstanding held by active country funds
Calculated at the stock or factor level, the percentage of shares outstanding held by active country (Japan) funds
Murakami (2014) Holdings
Cross-sectional decile-spread crowding beta
Beta of high factor decile indicator from a cross-sectional regression of the chosen crowding metric on the factors adjusted for size and volatility
Hanson & Sunderam (2014), Cahan et al (2012a)
Holdings
Median pair-wise correlation for stocks in a strategy (vs market or sector indexes)
Correlation calculated for each pair of stocks in turn in strategy portfolio
Cahan et al (2012b) Returns
Median pair-wise tail dependence (vs market or sector indexes)
Tail dependence of each stock pair in strategy using Gumbel copula for downside co-movement
Cahan et al (2012b) Returns
Co-momentum Abnormal return correlation among stocks in the top factor deciles
Lou & Polk (2013) Returns
MSCI.COM | PAGE 22 OF 33 © 2015 MSCI Inc. All rights reserved. Please refer to the disclaimer at the end of this document.
LOST IN THE CROWD? | JUNE 2015
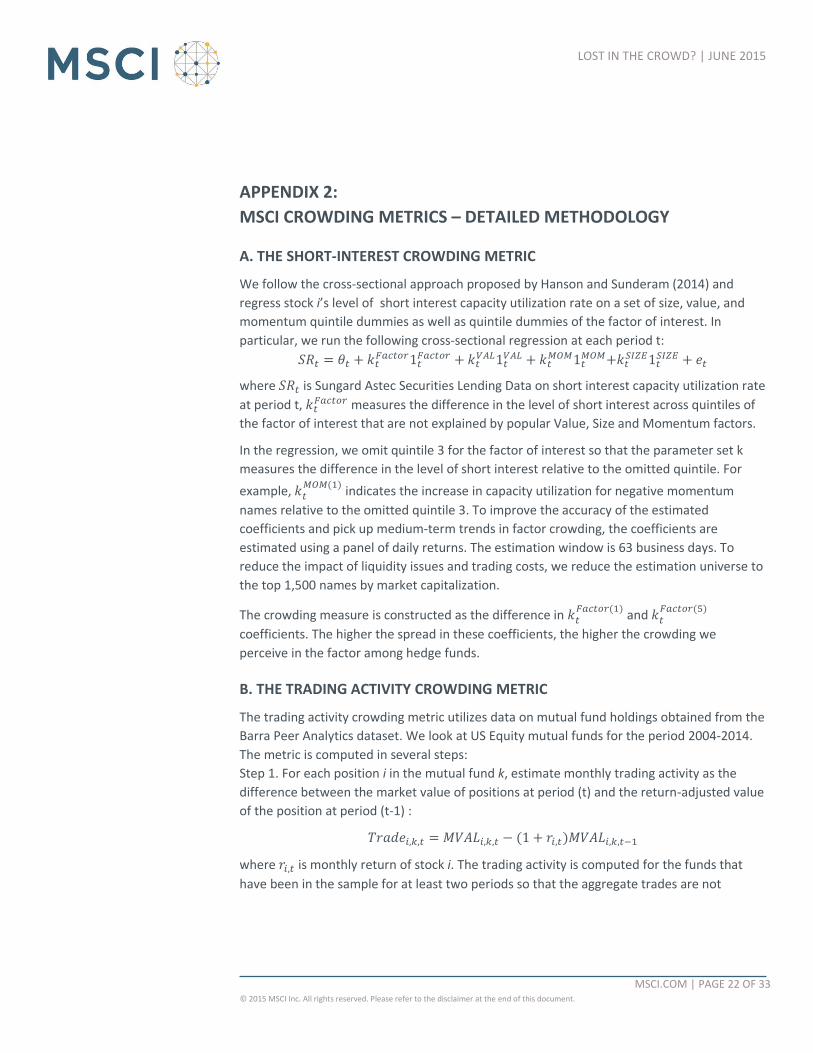
APPENDIX 2:
MSCI CROWDING METRICS – DETAILED METHODOLOGY
A. THE SHORT-INTEREST CROWDING METRIC
We follow the cross-sectional approach proposed by Hanson and Sunderam (2014) and
regress stock i’s level of short interest capacity utilization rate on a set of size, value, and
momentum quintile dummies as well as quintile dummies of the factor of interest. In
particular, we run the following cross-sectional regression at each period t:
𝑆𝑅𝑡 = 𝜃𝑡 + 𝑘𝑡𝐹𝑎𝑐𝑡𝑜𝑟1𝑡
𝐹𝑎𝑐𝑡𝑜𝑟 + 𝑘𝑡𝑉𝐴𝐿1𝑡
𝑉𝐴𝐿 + 𝑘𝑡𝑀𝑂𝑀1𝑡
𝑀𝑂𝑀+𝑘𝑡𝑆𝐼𝑍𝐸1𝑡
𝑆𝐼𝑍𝐸 + 𝑒𝑡
where 𝑆𝑅𝑡 is Sungard Astec Securities Lending Data on short interest capacity utilization rate
at period t, 𝑘𝑡𝐹𝑎𝑐𝑡𝑜𝑟 measures the difference in the level of short interest across quintiles of
the factor of interest that are not explained by popular Value, Size and Momentum factors.
In the regression, we omit quintile 3 for the factor of interest so that the parameter set k
measures the difference in the level of short interest relative to the omitted quintile. For
example, 𝑘𝑡𝑀𝑂𝑀(1)
indicates the increase in capacity utilization for negative momentum
names relative to the omitted quintile 3. To improve the accuracy of the estimated
coefficients and pick up medium-term trends in factor crowding, the coefficients are
estimated using a panel of daily returns. The estimation window is 63 business days. To
reduce the impact of liquidity issues and trading costs, we reduce the estimation universe to
the top 1,500 names by market capitalization.
The crowding measure is constructed as the difference in 𝑘𝑡𝐹𝑎𝑐𝑡𝑜𝑟(1)
and 𝑘𝑡𝐹𝑎𝑐𝑡𝑜𝑟(5)
coefficients. The higher the spread in these coefficients, the higher the crowding we
perceive in the factor among hedge funds.
B. THE TRADING ACTIVITY CROWDING METRIC
The trading activity crowding metric utilizes data on mutual fund holdings obtained from the
Barra Peer Analytics dataset. We look at US Equity mutual funds for the period 2004-2014.
The metric is computed in several steps:
Step 1. For each position i in the mutual fund k, estimate monthly trading activity as the
difference between the market value of positions at period (t) and the return-adjusted value
of the position at period (t-1) :
𝑇𝑟𝑎𝑑𝑒𝑖,𝑘,𝑡 = 𝑀𝑉𝐴𝐿𝑖,𝑘,𝑡 − (1 + 𝑟𝑖,𝑡)𝑀𝑉𝐴𝐿𝑖,𝑘,𝑡−1
where 𝑟𝑖,𝑡 is monthly return of stock i. The trading activity is computed for the funds that
have been in the sample for at least two periods so that the aggregate trades are not
MSCI.COM | PAGE 23 OF 33 © 2015 MSCI Inc. All rights reserved. Please refer to the disclaimer at the end of this document.
LOST IN THE CROWD? | JUNE 2015
impacted by the introduction of new funds in coverage. Many funds do not report their
holdings monthly. For these mutual funds, we pro-rate the estimated trades linearly over
the entire period between rebalancing dates.
Step 2. Compute aggregate dollar value of trading activity across all mutual funds:
𝑇𝑟𝑎𝑑𝑒𝑖,𝑡 = ∑ 𝑇𝑟𝑎𝑑𝑒𝑖,𝑘,𝑡, 𝑖 = 1,2, … , 𝑁
𝐾
𝑘=1
Step 3. Compute normalized trading portfolio weights:
𝑤𝑖,𝑡 = 𝑇𝑟𝑎𝑑𝑒𝑖,𝑡/ ∑ 𝑇𝑟𝑎𝑑𝑒𝑖,𝑡+
𝑁
𝑖=1
where 𝑇𝑟𝑎𝑑𝑒𝑖,𝑡+ = 𝑇𝑟𝑎𝑑𝑒𝑖,𝑡 if 𝑇𝑟𝑎𝑑𝑒𝑖,𝑡 > 0 and 0 otherwise. The resulting trading portfolio is
not dollar-neutral unless the aggregate flows to mutual funds are zero and the aggregate
purchases and sales net each other off.
Step 4. Compute factor exposures of the trading portfolio. We use factor exposures of the
trading portfolio as a measure of crowding. Notice that this measure does not take into
account the aggregate level of trading.
MSCI.COM | PAGE 24 OF 33 © 2015 MSCI Inc. All rights reserved. Please refer to the disclaimer at the end of this document.
LOST IN THE CROWD? | JUNE 2015
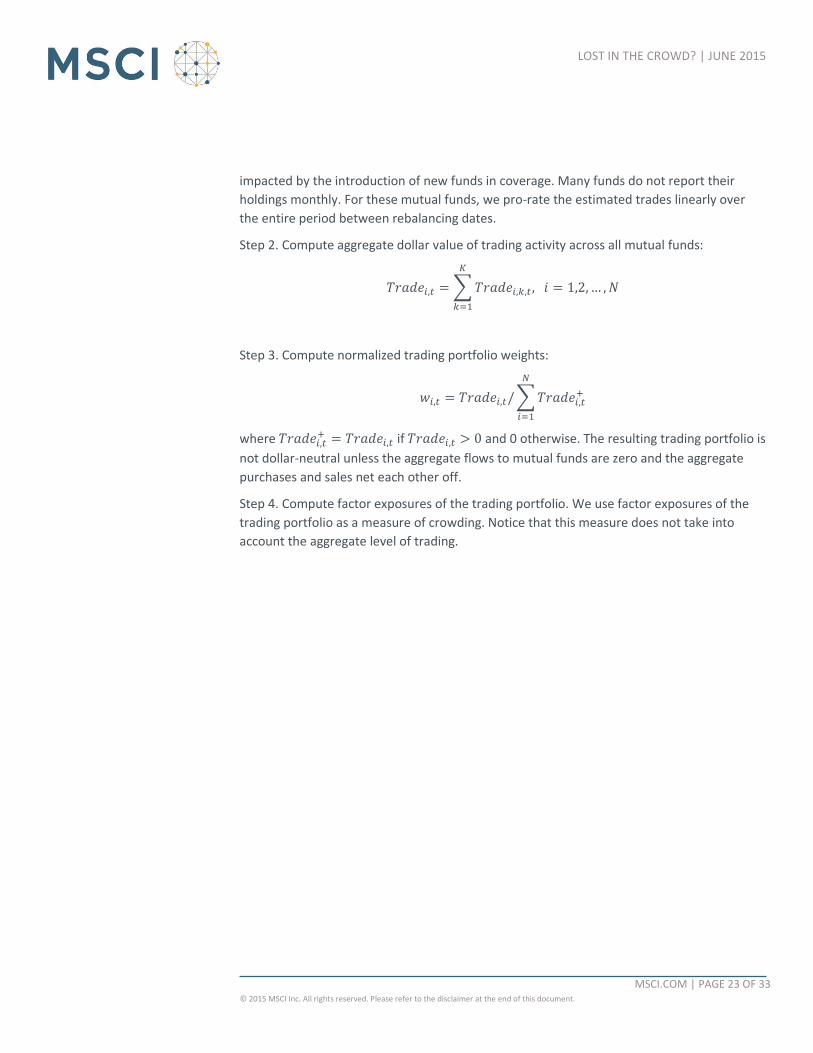
APPENDIX 3: CROWDING METRICS - FACTOR BY FACTOR
PROFITABILITY
Exhibit 8: MSCI Crowding Metrics for the Profitability Factor
MSCI.COM | PAGE 25 OF 33 © 2015 MSCI Inc. All rights reserved. Please refer to the disclaimer at the end of this document.
LOST IN THE CROWD? | JUNE 2015
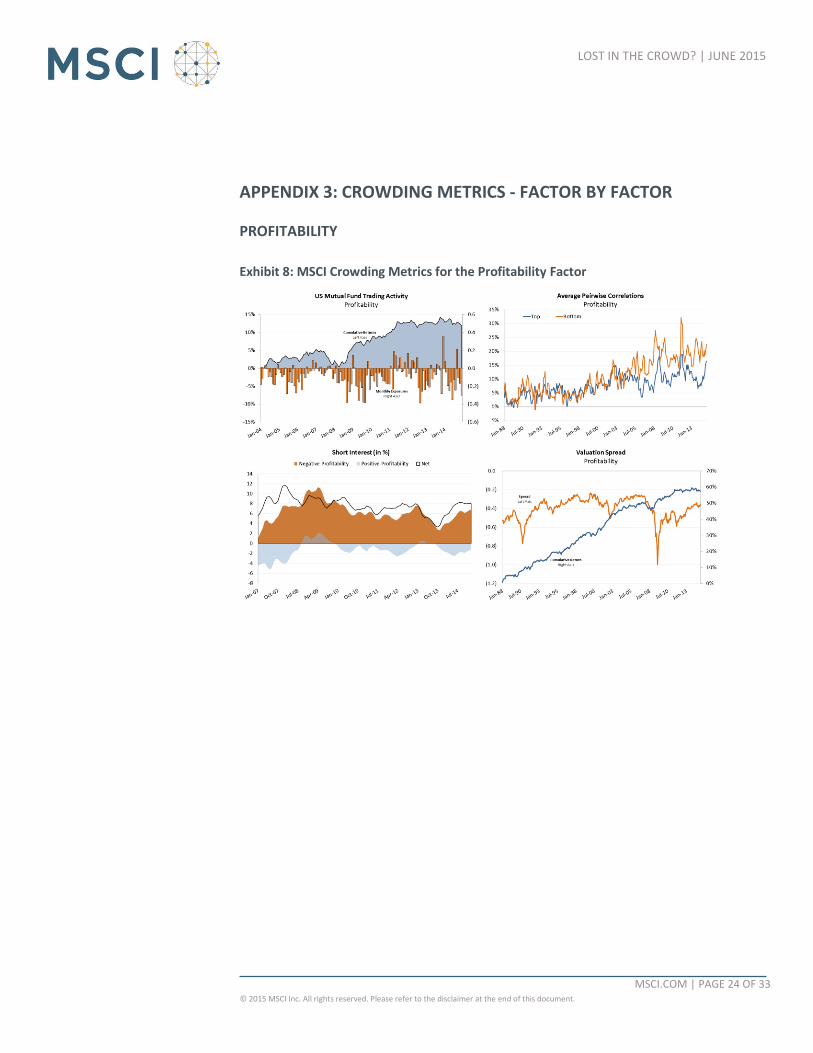
MOMENTUM
Exhibit 9: MSCI Crowding Metrics for the Momentum Factor
MSCI.COM | PAGE 26 OF 33 © 2015 MSCI Inc. All rights reserved. Please refer to the disclaimer at the end of this document.
LOST IN THE CROWD? | JUNE 2015
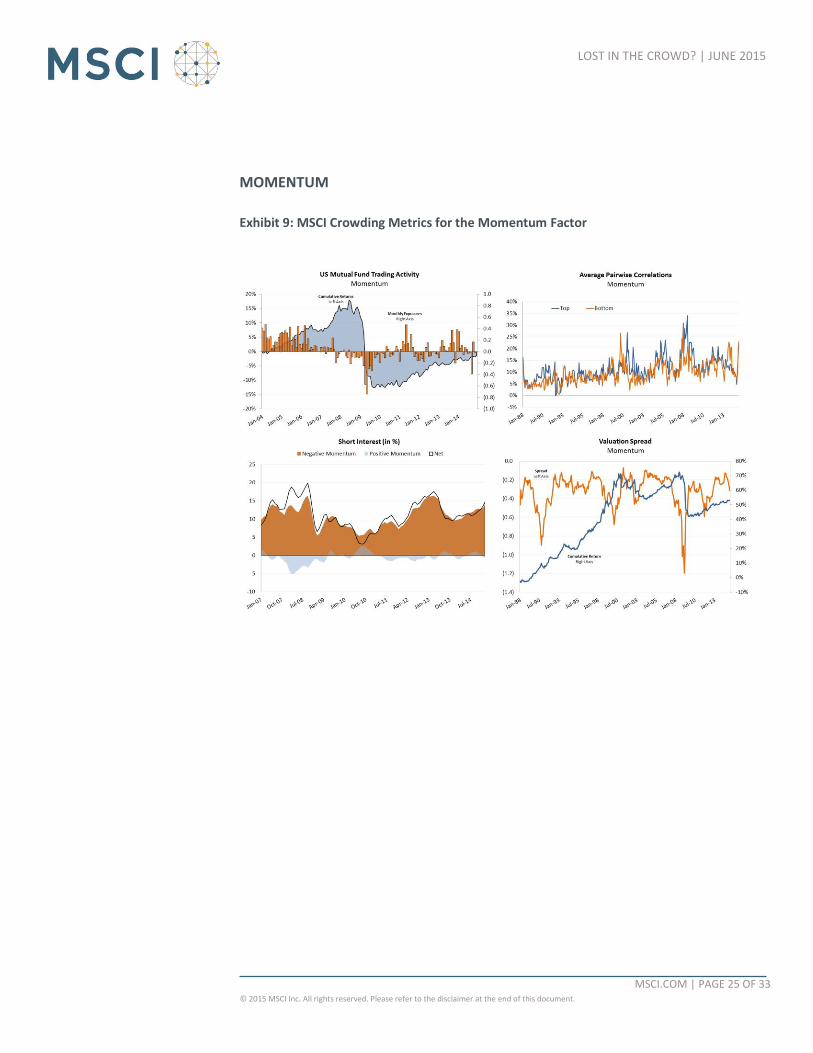
EARNINGS QUALITY
Exhibit 10: MSCI Crowding Metrics for the Earnings Quality Factor
MSCI.COM | PAGE 27 OF 33 © 2015 MSCI Inc. All rights reserved. Please refer to the disclaimer at the end of this document.
LOST IN THE CROWD? | JUNE 2015
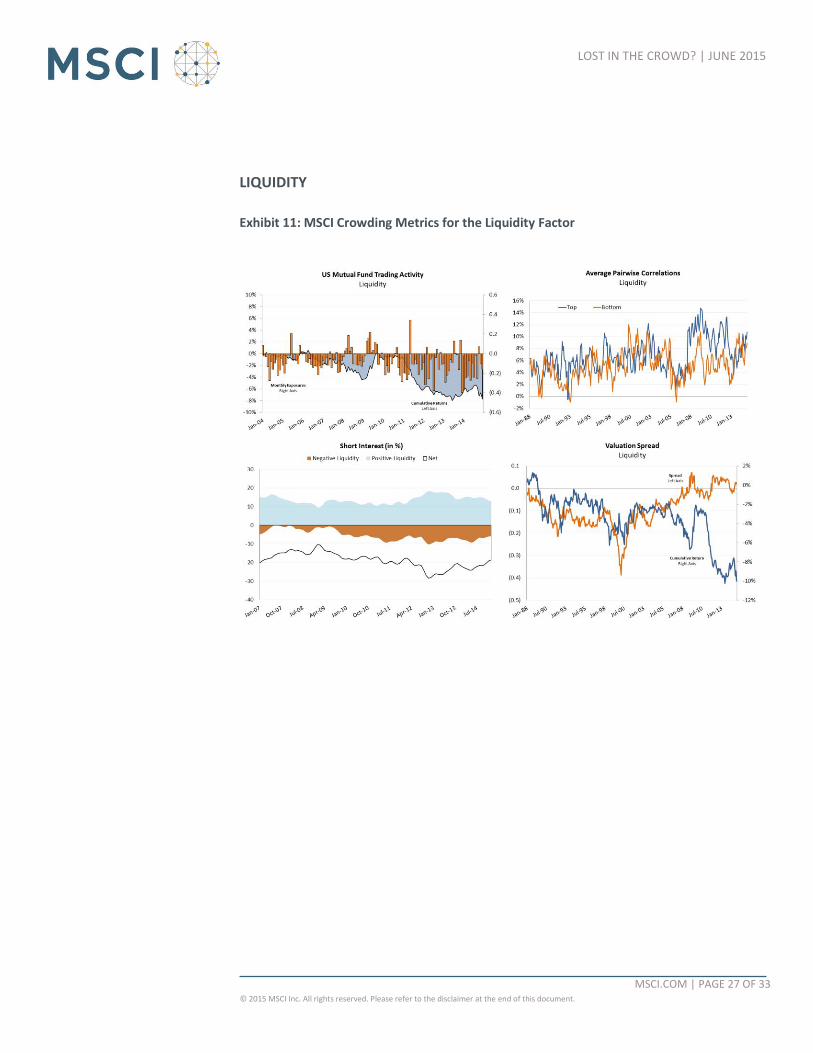
LIQUIDITY
Exhibit 11: MSCI Crowding Metrics for the Liquidity Factor
MSCI.COM | PAGE 28 OF 33 © 2015 MSCI Inc. All rights reserved. Please refer to the disclaimer at the end of this document.
LOST IN THE CROWD? | JUNE 2015
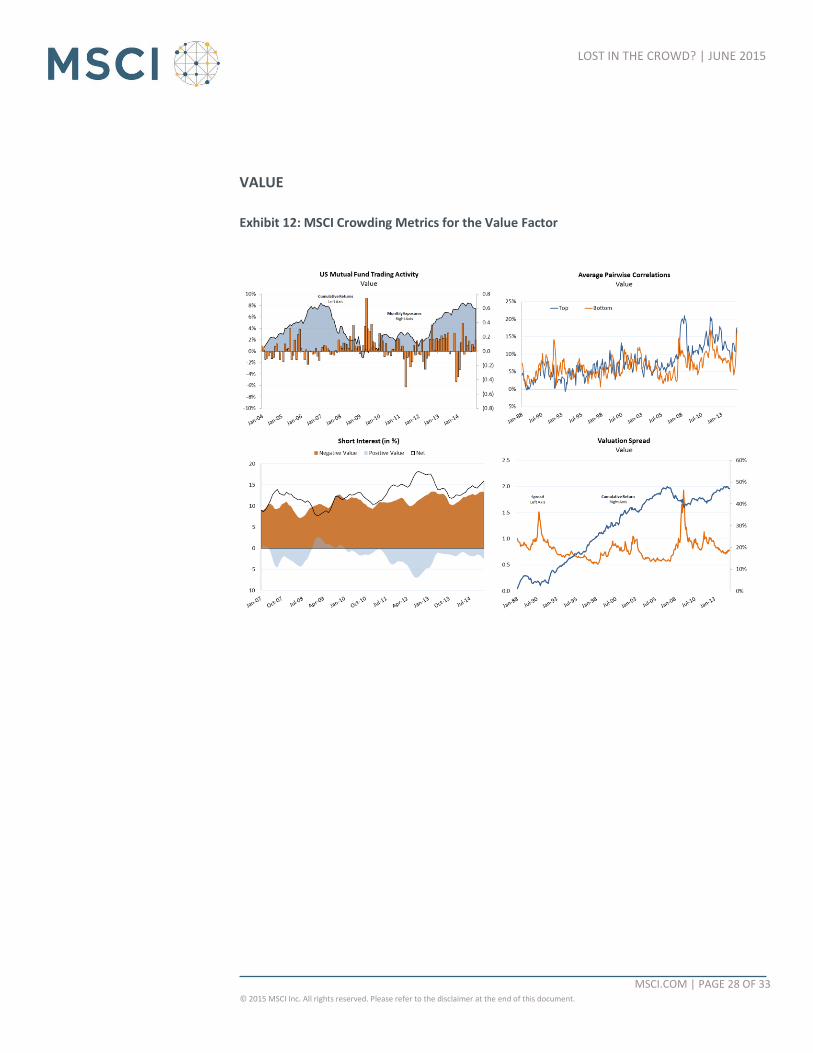
VALUE
Exhibit 12: MSCI Crowding Metrics for the Value Factor
MSCI.COM | PAGE 29 OF 33 © 2015 MSCI Inc. All rights reserved. Please refer to the disclaimer at the end of this document.
LOST IN THE CROWD? | JUNE 2015
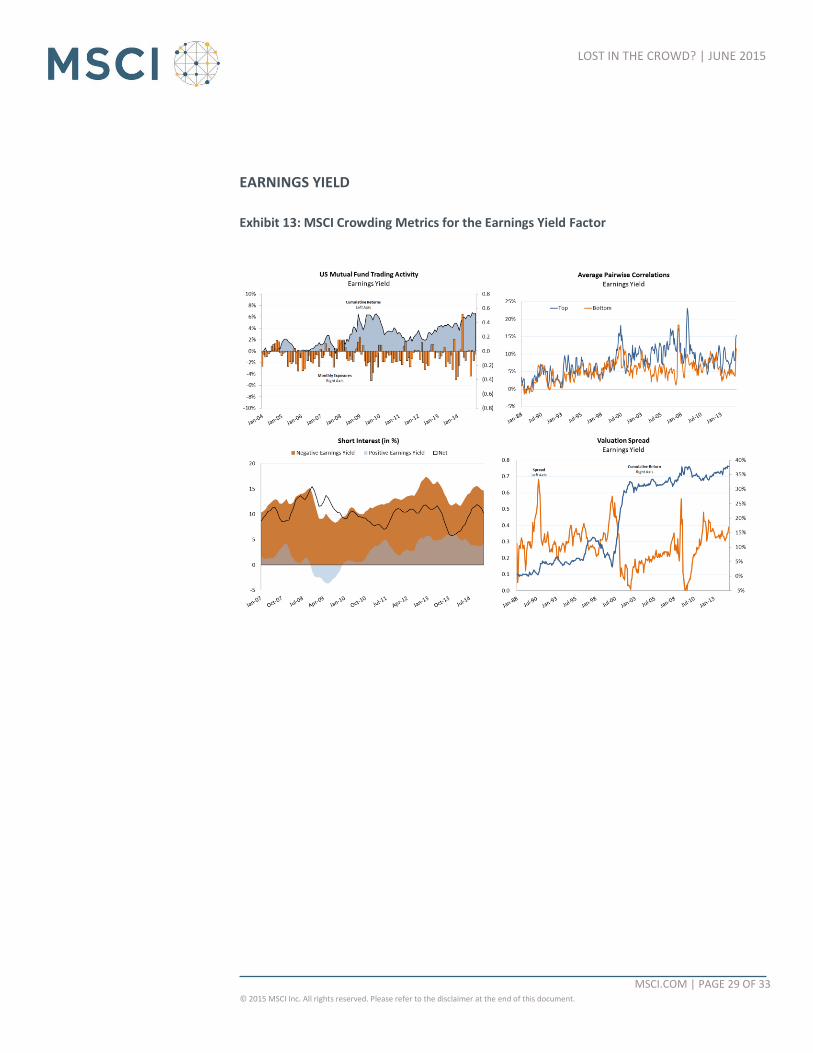
EARNINGS YIELD
Exhibit 13: MSCI Crowding Metrics for the Earnings Yield Factor
MSCI.COM | PAGE 30 OF 33 © 2015 MSCI Inc. All rights reserved. Please refer to the disclaimer at the end of this document.
LOST IN THE CROWD? | JUNE 2015
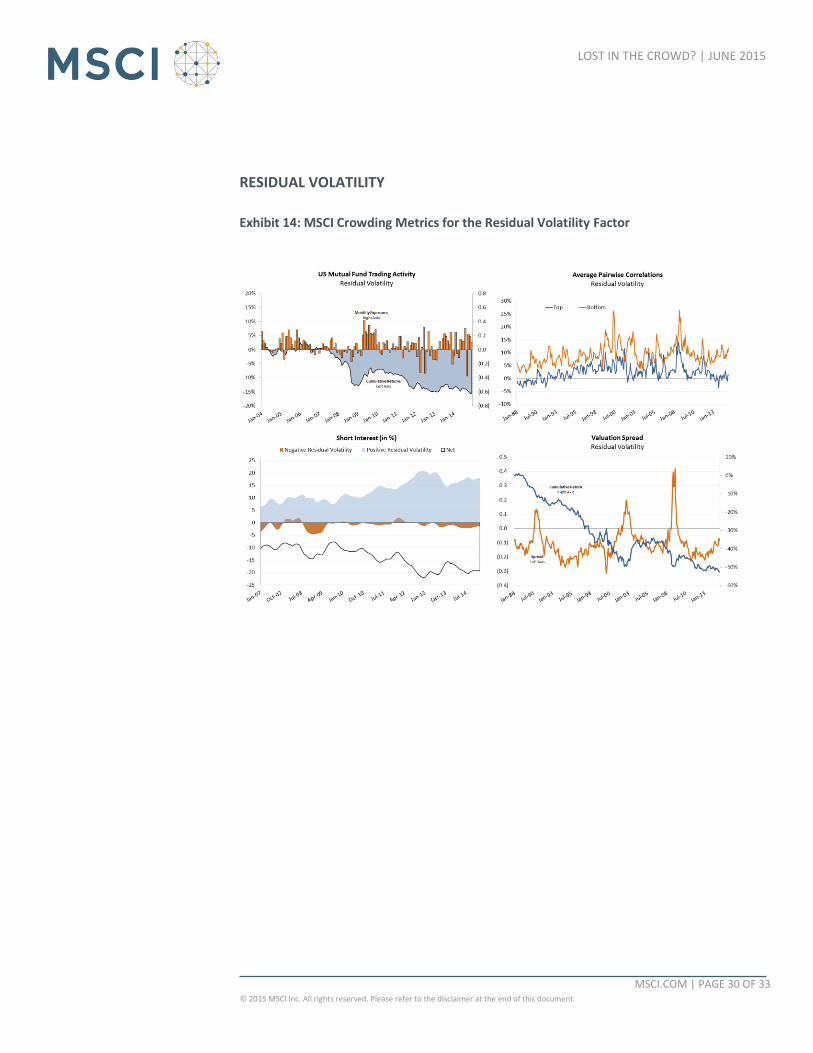
RESIDUAL VOLATILITY
Exhibit 14: MSCI Crowding Metrics for the Residual Volatility Factor
MSCI.COM | PAGE 31 OF 33 © 2015 MSCI Inc. All rights reserved. Please refer to the disclaimer at the end of this document.
LOST IN THE CROWD? | JUNE 2015
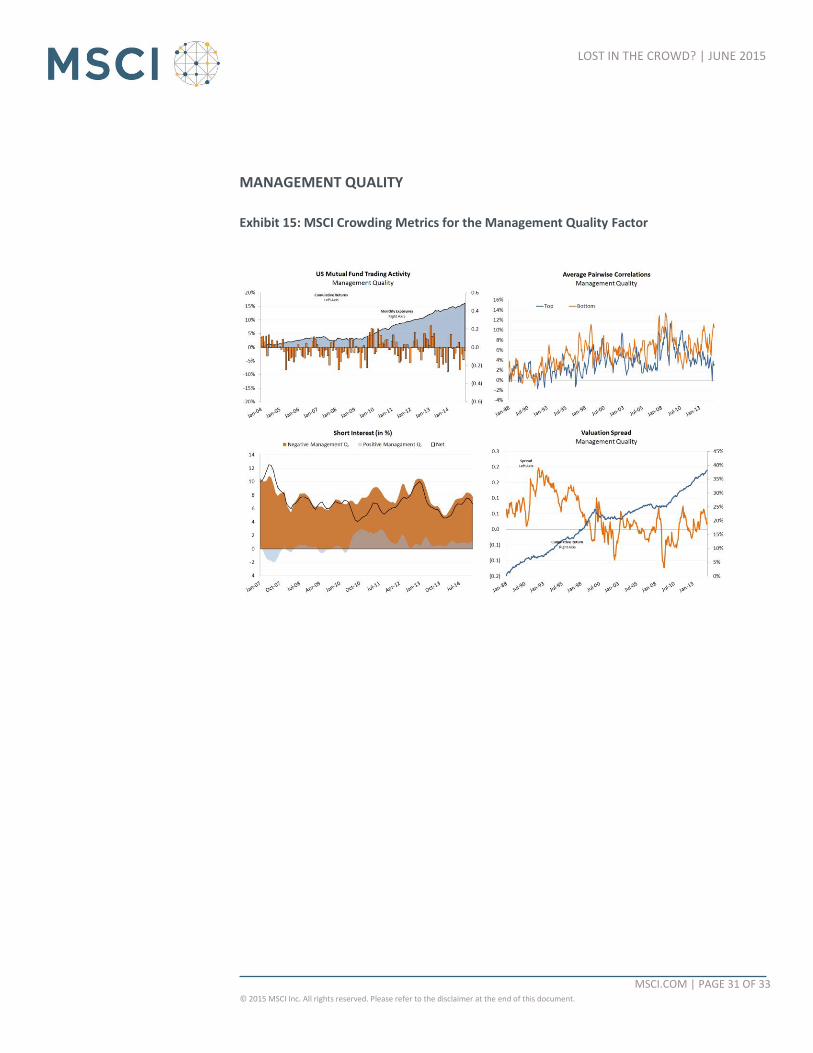
MANAGEMENT QUALITY
Exhibit 15: MSCI Crowding Metrics for the Management Quality Factor

JUNE 2015
RESEARCH INSIGHT
AMERICAS
Americas 1 888 588 4567 *
Atlanta + 1 404 551 3212
Boston + 1 617 532 0920
Chicago + 1 312 675 0545
Monterrey + 52 81 1253 4020
New York + 1 212 804 3901
San Francisco + 1 415 836 8800
Sao Paulo + 55 11 3706 1360
Toronto + 1 416 628 1007
EUROPE, MIDDLE EAST & AFRICA
Cape Town + 27 21 673 0100
Frankfurt + 49 69 133 859 00
Geneva + 41 22 817 9777
London + 44 20 7618 2222
Milan + 39 02 5849 0415
Paris 0800 91 59 17 *
ASIA PACIFIC
China North 10800 852 1032 *
China South 10800 152 1032 *
Hong Kong + 852 2844 9333
Mumbai + 91 22 6784 9160
Seoul 00798 8521 3392 *
Singapore 800 852 3749 *
Sydney + 61 2 9033 9333
Taipei 008 0112 7513 *
Tokyo + 81 3 5290 1555
ABOUT MSCI
For more than 40 years, MSCI’s research-
based indexes and analytics have helped
the world’s leading investors build and
manage better portfolios. Clients rely on
our offerings for deeper insights into the
drivers of performance and risk in their
portfolios, broad asset class coverage and
innovative research.
Our line of products and services includes
indexes, analytical models, data, real estate
benchmarks and ESG research.
MSCI serves 98 of the top 100 largest
money managers, according to the most
recent P&I ranking.
For more information, visit us at
www.msci.com.
* = toll free
CONTACT US
MSCI.COM | PAGE 33 OF 33 © 2015 MSCI Inc. All rights reserved.
This document and all of the information contained in it, including without limitation all text, data, graphs, charts (collectively, the “Information”) is the property of MSCI Inc. or its subsidiaries (collectively, “MSCI”), or MSCI’s licensors, direct or indirect suppliers or any third party involved in making or compiling any Information (collectively, with MSCI, the “Information Providers”) and is provided for informational purposes only. The Information may not be modified, reverse-engineered, reproduced or redisseminated in whole or in part without prior written permission from MSCI.
The Information may not be used to create derivative works or to verify or correct other data or information. For example (but without limitation), the Information may not be used to create indexes, databases, risk models, analytics, software, or in connection with the issuing, offering, sponsoring, managing or marketing of any securities, portfolios, financial products or other investment vehicles utilizing or based on, linked to, tracking or otherwise derived from the Information or any other MSCI data, information, products or services.
The user of the Information assumes the entire risk of any use it may make or permit to be made of the Information. NONE OF THE INFORMATION PROVIDERS MAKES ANY EXPRESS OR IMPLIED WARRANTIES OR REPRESENTATIONS WITH RESPECT TO THE INFORMATION (OR THE RESULTS TO BE OBTAINED BY THE USE THEREOF), AND TO THE MAXIMUM EXTENT PERMITTED BY APPLICABLE LAW, EACH INFORMATION PROVIDER EXPRESSLY DISCLAIMS ALL IMPLIED WARRANTIES (INCLUDING, WITHOUT LIMITATION, ANY IMPLIED WARRANTIES OF ORIGINALITY, ACCURACY, TIMELINESS, NON-INFRINGEMENT, COMPLETENESS, MERCHANTABILITY AND FITNESS FOR A PARTICULAR PURPOSE) WITH RESPECT TO ANY OF THE INFORMATION.
Without limiting any of the foregoing and to the maximum extent permitted by applicable law, in no event shall any Information Provider have any liability regarding any of the Information for any direct, indirect, special, punitive, consequential (including lost profits) or any other damages even if notified of the possibility of such damages. The foregoing shall not exclude or limit any liability that may not by applicable law be excluded or limited, including without limitation (as applicable), any liability for death or personal injury to the extent that such injury results from the negligence or willful default of itself, its servants, agents or sub-contractors.
Information containing any historical information, data or analysis should not be taken as an indication or guarantee of any future performance, analysis, forecast or prediction. Past performance does not guarantee future results.
The Information should not be relied on and is not a substitute for the skill, judgment and experience of the user, its management, employees, advisors and/or clients when making investment and other business decisions. All Information is impersonal and not tailored to the needs of any person, entity or group of persons.
None of the Information constitutes an offer to sell (or a solicitation of an offer to buy), any security, financial product or other investment vehicle or any trading strategy.
It is not possible to invest directly in an index. Exposure to an asset class or trading strategy or other category represented by an index is only available through third party investable instruments (if any) based on that index. MSCI does not issue, sponsor, endorse, market, offer, review or otherwise express any opinion regarding any fund, ETF, derivative or other security, investment, financial product or trading strategy that is based on, linked to or seeks to provide an investment return related to the performance of any MSCI index (collectively, “Index Linked Investments”). MSCI makes no assurance that any Index Linked Investments will accurately track index performance or provide positive investment returns. MSCI Inc. is not an investment adviser or fiduciary and MSCI makes no representation regarding the advisability of investing in any Index Linked Investments.
Index returns do not represent the results of actual trading of investible assets/securities. MSCI maintains and calculates indexes, but does not manage actual assets. Index returns do not reflect payment of any sales charges or fees an investor may pay to purchase the securities underlying the index or Index Linked Investments. The imposition of these fees and charges would cause the performance of an Index Linked Investment to be different than the MSCI index performance.
The Information may contain back tested data. Back-tested performance is not actual performance, but is hypothetical. There are frequently material differences between back tested performance results and actual results subsequently achieved by any investment strategy.
Constituents of MSCI equity indexes are listed companies, which are included in or excluded from the indexes according to the application of the relevant index methodologies. Accordingly, constituents in MSCI equity indexes may include MSCI Inc., clients of MSCI or suppliers to MSCI. Inclusion of a security within an MSCI index is not a recommendation by MSCI to buy, sell, or hold such security, nor is it considered to be investment advice.
Data and information produced by various affiliates of MSCI Inc., including MSCI ESG Research Inc. and Barra LLC, may be used in calculating certain MSCI indexes. More information can be found in the relevant index methodologies on www.msci.com.
MSCI receives compensation in connection with licensing its indexes to third parties. MSCI Inc.’s revenue includes fees based on assets in Index Linked Investments. Information can be found in MSCI Inc.’s company filings on the Investor Relations section of www.msci.com.
MSCI ESG Research Inc. is a Registered Investment Adviser under the Investment Advisers Act of 1940 and a subsidiary of MSCI Inc. Except with respect to any applicable products or services from MSCI ESG Research, neither MSCI nor any of its products or services recommends, endorses, approves or otherwise expresses any opinion regarding any issuer, securities, financial products or instruments or trading strategies and MSCI’s products or services are not intended to constitute investment advice or a recommendation to make (or refrain from making) any kind of investment decision and may not be relied on as such. Issuers mentioned or included in any MSCI ESG Research materials may include MSCI Inc., clients of MSCI or suppliers to MSCI, and may also purchase research or other products or services from MSCI ESG Research. MSCI ESG Research materials, including materials utilized in any MSCI ESG Indexes or other products, have not been submitted to, nor received approval from, the United States Securities and Exchange Commission or any other regulatory body.
Any use of or access to products, services or information of MSCI requires a license from MSCI. MSCI, Barra, RiskMetrics, IPD, FEA, InvestorForce, and other MSCI brands and product names are the trademarks, service marks, or registered trademarks of MSCI or its subsidiaries in the United States and other jurisdictions. The Global Industry Classification Standard (GICS) was developed by and is the exclusive property of MSCI and Standard & Poor’s. “Global Industry Classification Standard (GICS)” is a service mark of MSCI and Standard & Poor’s.
NOTICE AND DISCLAIMER