
Identifying and Analyzing Cryptocurrency Manipulations in Social Media · 2019-02-11 · Mirtaheri,...
10
Identifying and Analyzing Cryptocurrency Manipulations in Social Media Mehrnoosh Mirtaheri USC Information Sciences Institute [email protected] Sami Abu-El-Haija USC Information Sciences Institute [email protected] Fred Morstatter USC Information Sciences Institute [email protected] Greg Ver Steeg USC Information Sciences Institute [email protected] Aram Galstyan USC Information Sciences Institute [email protected] ABSTRACT Interest surrounding cryptocurrencies, digital or virtual currencies that are used as a medium for financial transactions, has grown tremendously in recent years. The anonymity surrounding these currencies makes investors particularly susceptible to fraud—such as “pump and dump” scams—where the goal is to artificially inflate the perceived worth of a currency, luring victims into investing before the scammers can sell their holdings. Because of the speed and relative anonymity offered by social platforms such as Twitter and Telegram, social media has become a preferred platform for scammers who wish to spread false hype about the cryptocurrency they are trying to pump. In this work we propose and evaluate a computational approach that can automatically identify pump and dump scams as they unfold by combining information across social media platforms. We also develop a multi-modal approach for predicting whether a particular pump attempt will succeed or not. Finally, we analyze the prevalence of bots in cryptocurrency related tweets, and observe a significant significant presence of bots during the pump attempts. KEYWORDS cryptocurrency, pump and dump, social media data mining, anom- aly detection 1 INTRODUCTION The inception of blockchain technology [14] gave birth to the pop- ular cryptocurrency Bitcoin (symbol BTC). Since then, thousands of cryptocurrencies have emerged, and their hype has caused mas- sive price swings on the trading markets. In December 2017, BTC quadrupled in market value in just over a month, then within a few days started a gradual decline until it reached half of its peak value. These price changes allowed some investors to realize huge profits, contributing to the allure of cryptocurrencies. Even though most investments are made in relatively established cryptocurrencies, including Bitcoin (BTC) and Ethereum (ETH), there are thousands of other smaller cryptocurrencies. These currencies are prime targets for manipulation by scammers, as evidenced by the proliferation of pump and dump schemes. Pump and dump schemes are those in which a security price inflates due to deliberately deceptive activities. Those fraudulent schemes originated in the early days of the stock market and are now growing rapidly in the cryptocurrency market. The fact that scammers start sell here Figure 1: Pump announcement by admin of a Telegram Channel “Big Pump Signal,” overlayed on the market values of $CLOAK. The announcement precedes the price swing. the Commodity Futures Trading Commission (CTFC) and U.S. Se- curities and Exchange Commission (SEC) have issued several warn- ings [28] against cryptocurrency pump and dump schemes high- lights the severity of the threat. Although in the early days of cryptocurrencies, pump and dump schemes were taking place by marketing teams in ICOs [26] (Initial Coin Offerings), they are taking different forms nowadays. Pump and dump schemes have three major components: (1) a group of scammers; (2) a private or semi-private communication medium where scammers coordinate their illicit activities; and (3) a social media platform for conducting orchestrated campaigns to hype a given coin. In a typical scenario, scammers create groups on platforms such as Telegram or Reddit to coordinate group purchases of a particular cryptocurrency, while creating false hype around it by making public posts (i.e., pump) on social media platforms such as Twitter. Normal traders, who only see the rise in the price and are unaware of malicious activity, might buy the coin hoping to anticipate the next trend, thus boosting the price even further. Once a certain price target is met, the scammers start to sell (i.e., dump) their holdings, leading to a precipitous drop in the price. We illustrate the process with an example mentioned in a Wall Street arXiv:1902.03110v2 [cs.SI] 17 Dec 2019
Transcript of Identifying and Analyzing Cryptocurrency Manipulations in Social Media · 2019-02-11 · Mirtaheri,...

Identifying and Analyzing Cryptocurrency Manipulations inSocial Media
Mehrnoosh MirtaheriUSC Information Sciences Institute
Sami Abu-El-HaijaUSC Information Sciences Institute
Fred MorstatterUSC Information Sciences Institute
Greg Ver SteegUSC Information Sciences Institute
Aram GalstyanUSC Information Sciences Institute
ABSTRACTInterest surrounding cryptocurrencies, digital or virtual currenciesthat are used as a medium for financial transactions, has growntremendously in recent years. The anonymity surrounding thesecurrencies makes investors particularly susceptible to fraud—suchas “pump and dump” scams—where the goal is to artificially inflatethe perceived worth of a currency, luring victims into investingbefore the scammers can sell their holdings. Because of the speedand relative anonymity offered by social platforms such as Twitterand Telegram, social media has become a preferred platform forscammers who wish to spread false hype about the cryptocurrencythey are trying to pump. In this work we propose and evaluatea computational approach that can automatically identify pumpand dump scams as they unfold by combining information acrosssocial media platforms. We also develop a multi-modal approachfor predicting whether a particular pump attempt will succeed ornot. Finally, we analyze the prevalence of bots in cryptocurrencyrelated tweets, and observe a significant significant presence of botsduring the pump attempts.
KEYWORDScryptocurrency, pump and dump, social media data mining, anom-aly detection
1 INTRODUCTIONThe inception of blockchain technology [14] gave birth to the pop-ular cryptocurrency Bitcoin (symbol BTC). Since then, thousandsof cryptocurrencies have emerged, and their hype has caused mas-sive price swings on the trading markets. In December 2017, BTCquadrupled in market value in just over a month, then within a fewdays started a gradual decline until it reached half of its peak value.These price changes allowed some investors to realize huge profits,contributing to the allure of cryptocurrencies. Even though mostinvestments are made in relatively established cryptocurrencies,including Bitcoin (BTC) and Ethereum (ETH), there are thousands ofother smaller cryptocurrencies. These currencies are prime targetsfor manipulation by scammers, as evidenced by the proliferation ofpump and dump schemes.
Pump and dump schemes are those in which a security priceinflates due to deliberately deceptive activities. Those fraudulentschemes originated in the early days of the stock market and arenow growing rapidly in the cryptocurrency market. The fact that
07:00
09:00
11:00
13:00
15:00
17:00
19:00
21:00
23:00
Time
3.8
4.0
4.2
4.4
4.6
4.8
5.0
5.2
5.4
Pric
e
CLOAK Pump Example on 2018-07-12
scammersstart sell here
Figure 1: Pump announcement by admin of a TelegramChannel “Big Pump Signal,” overlayed on themarket valuesof $CLOAK. The announcement precedes the price swing.
the Commodity Futures Trading Commission (CTFC) and U.S. Se-curities and Exchange Commission (SEC) have issued several warn-ings [28] against cryptocurrency pump and dump schemes high-lights the severity of the threat.
Although in the early days of cryptocurrencies, pump and dumpschemes were taking place by marketing teams in ICOs [26] (InitialCoin Offerings), they are taking different forms nowadays. Pumpand dump schemes have three major components: (1) a group ofscammers; (2) a private or semi-private communication mediumwhere scammers coordinate their illicit activities; and (3) a socialmedia platform for conducting orchestrated campaigns to hypea given coin. In a typical scenario, scammers create groups onplatforms such as Telegram or Reddit to coordinate group purchasesof a particular cryptocurrency, while creating false hype aroundit by making public posts (i.e., pump) on social media platformssuch as Twitter. Normal traders, who only see the rise in the priceand are unaware of malicious activity, might buy the coin hopingto anticipate the next trend, thus boosting the price even further.Once a certain price target is met, the scammers start to sell (i.e.,dump) their holdings, leading to a precipitous drop in the price. Weillustrate the process with an example mentioned in a Wall Street
arX
iv:1
902.
0311
0v2
[cs
.SI]
17
Dec
201
9

Mirtaheri, et al.
Journal article1 that we also found in our collected data. In thisexample, the fraudsters coordinated their activities using a publicgroup “Big Pump Signal” on the Telegram messaging app, whichhas more than 60, 000 members. As shown in Figure 1, after thethe coin CLOAK posted on the group at 7:00 PM GMT, the priceinflated immediately after the pump message and dropped shortlyafterwards.
As cryptocurrency trading attracts more public attention, it be-comes extremely important to be able to detect such fraudulentactivities and inform potentially susceptible people before theybecome victims of these crimes. Toward this end, we study theextent to which pump and dump groups on online forums, such asTelegram, are accompanied and correlated with suspicious activityon Twitter and cryptocurrency price movements. In addition, wequantify the ability of machine learning models to predict pumpand dump schemes from our data sources. In particular, we proposeand address the following two predictive tasks:
(1) Predict an unfolding pump operation/advertisement cam-paign happening on Telegram.
(2) Predict whether a detected operation will succeed, i.e., willthe target price mentioned in the Telegram message bereached by the market shortly after the announcement?
Although closely monitoring covert communication of fraud-ulent users on Telegram enables us to detect pump and dumpschemes, in many realistic scenarios we might not have accessto such communication. For instance, some scammers are usingprivate channels with restricted access and membership fees, orcommunicate on different platforms altogether. Furthermore, mostpump and dump events happen in a very short time after a coinis announced on Telegram. Thus, we examine the possibility ofdetecting pump and dump schemes without relying on availabilityof the Telegram data. Remarkably, we demonstrate that it is indeedpossible to detect pump and dump events by leveraging only pub-licly available information, such as Twitter and historical marketdata.
Our main contributions are as follows:
(1) We propose a multi-modal approach to monitor potentiallymalicious activities in cryptocurrency trading by combiningdata from three distinct sources: (i .) Real-time market dataon crytpocurrency trading including both price and volumeinformation; (ii .) Twitter data of cashtag mentions for cryp-tocurrencies; and (iii .) Telegram data that contains potentialmentions of and instructions for pump and dump activities.
(2) We identify pump and dump operations on Telegram mes-sages by manually labeling a fraction of those messages as“pump” versus “not-pump”, and then building a classifier tolabel the remaining messages. Our approach is efficient fordealing with huge numbers of unlabeled messages mention-ing cryptocurrencies and achieves a high precision (Section3).
(3) In Section 4, we explore the possibility of forecasting specificpump and dump activities, as quantified on the two classi-fication tasks, based on different combinations of features
1https://www.wsj.com/graphics/cryptocurrency-schemes-generate-big-coin/
Figure 2: The anatomy of a common pump announcement,containing a “BUY” price and multiple target “SELL” prices.“CP” and “Stop” refer to the current coin price and stop lossrespectively.
extracted from the above-listed data sources. Our results in-dicate that it is indeed possible to forecast such events withreasonable accuracy.
(4) We study the efficacy of pump and dump operations oncryptocurrency price movements and Twitter activity inSection 3.2 and investigate the prevalence of Twitter bots incryptocurrency-related tweets, especially during the allegedpump and dump attacks, and observe that the majority ofhighly active users are bots. (Section 5)
(5) We release2 a comprehensive dataset containing coins, time-stamps, pump messages, and indications of whether or notthe pumps were successful—together with features we ex-tract from Twitter.
2 DATA DESCRIPTIONIn this section we describe the datasets used in our study, explainthe data collection process, and provide basic statistics of the data.
2.1 Telegram DataIn the context of the cryptocurrency market, scammers coordinatewithin groups to inflate the market value for a coin using socialmedia platforms. In particular, the messaging platform Telegram iswidely used for sharing cryptocurrency-related information, includ-ing pump announcements. The reason for Telegram’s popularityamong scammers is that it provides anonymity for the users. Forexample, a Telegram channel consists of an anonymous admin anda set of members; however, the only person who can post to thechannel is the admin who also is the only one who can see the listof members, while his/her identity is anonymous to the members.
We implemented a crawler using the Telegram API3 to collectdata from Telegram channels. The crawling process starts with a setof a few initial channel IDs, and thenwe extend the list by extractingthe other channels’ hyperlinks advertised in the seed channels andadd those channels to our set. We continue to snowball out as new2Available at https://github.com/Mehrnoom/Cryptocurrency-Pump-Dump3https://telethon.readthedocs.io/en/latest/

Identifying and Analyzing Cryptocurrency Manipulations in Social Media
channel IDs appear in the Telegram channels. Due to the nature ofhow private channels are joined (the password to a private channelcan be passed via its URL), it is entirely possible that we wouldcrawl private channels if such URLs are posted in a public channel.We make no distinction between the two classes in our experiment.
Table 1 shows the statistics of the Telegram data. We extractedall the messages containing at least one coin from our coin list in-cluding all the cryptocurrencies provided by CoinMarketCap.com,which resulted in 195,576 messages. The Telegram channels in thetable are categorized by their size (number of members) becausechannels with more members are more likely to contribute to apump event.
Table 1: Telegram data statistics. Top: Histogram of num-ber of channels grouped by their size (i.e., members in eachchannel). Middle: Summary statistics. Bottom: Number ofmessages containing the coins in our coin list.
Channel Size(S) CountS ∈ [0, 100] 51S ∈ (100, 1000] 159S ∈ (1000, 10000] 50S ∈ (10000,∞) 63Number of channels 423Average channel size 6, 084Median channel size 1, 005Total number of messages 195, 576
2.2 Twitter DataOne way of promoting finance-related information on social media,especially Twitter, is to use cashtags, which are ticker symbols ofstocks or cryptocorrencies prefixed by $, e.g., $BTC is the appro-priate cashtag for Bitcoin. Using the Twitter streaming API,4 weimplemented a system that tracks all the cryptocurrencies providedby CoinMarketCap.com, including 1,600 cashtags. We began thedata collection process on March 15, 2018. However, cryptocurren-cies had received a considerable amount of attention prior, towardthe end of the 2017, due to growth in the Bitcoin price which pavedthe path for fraudulent activities. For better coverage of the poten-tially fraudulent events occurring before March 15, 2018, when webegan our data collection, we also purchased tweets from September1, 2017, to March 31, 2018.
The resulting dataset includes 30,760,831 tweets and 3,708,176users in total from September 1, 2017, to August 31, 2018. Figure3 also shows the distributions of the number of users per cashtag.The distribution is heavy-tailed, which suggests that many usersare interested in only a few cashtags, while a small number of userstweet about many cashtags.
2.3 Cryptocurrency Market DataThis dataset consists of the time-series of market values for manycryptocurrencies. We developed a crawler to collect data fromCoinMarketCap.com. Instead of using end-of-the-day historical4https://developer.twitter.com/en/docs/tweets/filter-realtime/overview.html
100
101
102
103
Degree
100
101
102
103
104
105
Use
rs
Figure 3: Users’ degree distribution, showing most users areinterested in only a few cashtags, while some users discussa large number of cashtags.
data, we chose to use data with a five-minute granularity becausepump and dump schemes usually happen within a very short period.The dataset includes all the coins listed on the website at the timewe started the collection process.
3 PUMP AND DUMP ACTIVITIES ONTELEGRAM
As mentioned above, Telegram is a popular choice for scammers toorganize and coordinate pump and dump operations. To analyzesuch activities, let us define the following two notions:
(1) Pump attempt: The act of targeting a coin on Telegram byposting a pump message mentioning the coin as a “pumpattempt.” In Section 3.1 we describe our approach to detectpump messages.
(2) Successful pump attempt: A pump attempt is successfulif the actual price approaches the target price within a timewindow after the first pump message has been posted.
We next describe a simple method for detecting individual pumpattempts and assessing whether those attempts were successful.The pump attempts (either successful or not) are used as groundtruth for building and evaluating predictive models proposed inSection 4.
3.1 Pump Message Identification on TelegramMost of the Telegrammessages in our dataset are about cryptocurrency-related news, advice, and advertisements that are not relevant inthe context of predicting pump and dump activities. Only a smallfraction of those messages contain actual pump announcements. Asshown in Table 1, the number of cryptocurrency-related messagesis large, which would make it prohibitively expensive to manuallylabel them as pump-relevant or not. Fortunately, however, most ofthe pump announcements follow specific patterns, or redundancies,which we are able to detect with machine learning techniques.
Text is the most common format used by Telegram channels forbroadcasting pump events, although some channels embed the coinname in an image to prevent trading bot activities (Figure 1). A
Mirtaheri, et al.
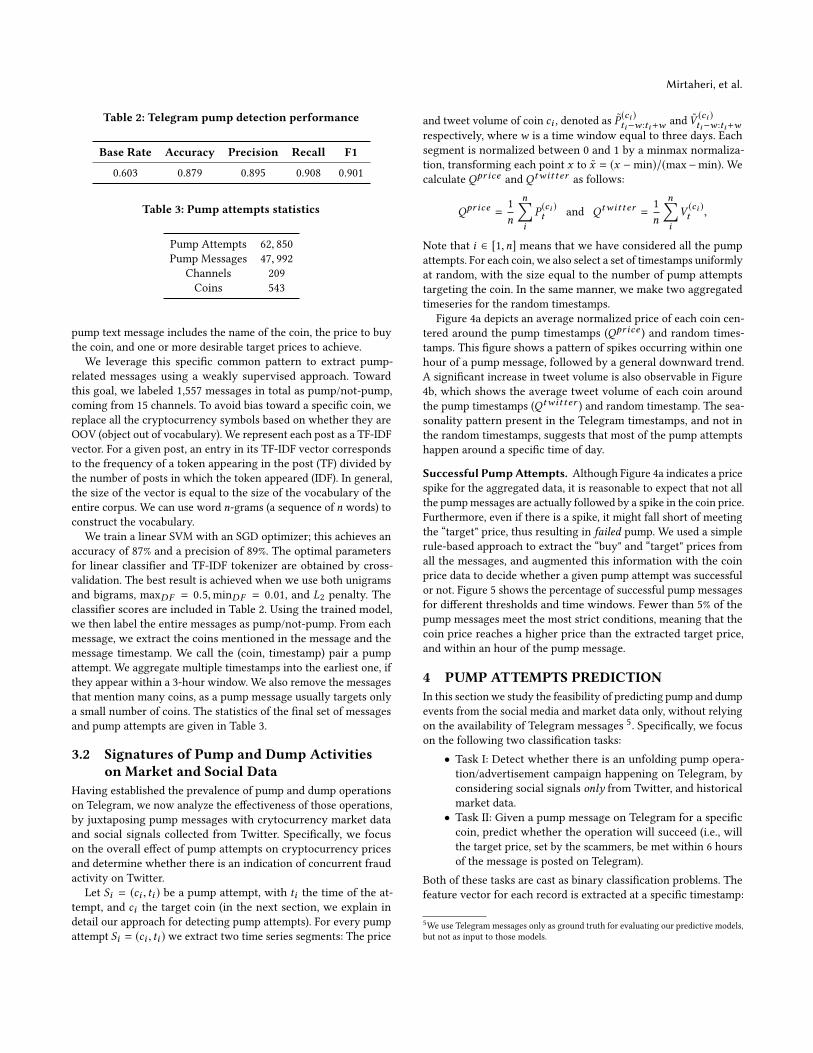
Table 2: Telegram pump detection performance
Base Rate Accuracy Precision Recall F1
0.603 0.879 0.895 0.908 0.901
Table 3: Pump attempts statistics
Pump Attempts 62, 850Pump Messages 47, 992
Channels 209Coins 543
pump text message includes the name of the coin, the price to buythe coin, and one or more desirable target prices to achieve.
We leverage this specific common pattern to extract pump-related messages using a weakly supervised approach. Towardthis goal, we labeled 1,557 messages in total as pump/not-pump,coming from 15 channels. To avoid bias toward a specific coin, wereplace all the cryptocurrency symbols based on whether they areOOV (object out of vocabulary). We represent each post as a TF-IDFvector. For a given post, an entry in its TF-IDF vector correspondsto the frequency of a token appearing in the post (TF) divided bythe number of posts in which the token appeared (IDF). In general,the size of the vector is equal to the size of the vocabulary of theentire corpus. We can use word n-grams (a sequence of n words) toconstruct the vocabulary.
We train a linear SVM with an SGD optimizer; this achieves anaccuracy of 87% and a precision of 89%. The optimal parametersfor linear classifier and TF-IDF tokenizer are obtained by cross-validation. The best result is achieved when we use both unigramsand bigrams, maxDF = 0.5,minDF = 0.01, and L2 penalty. Theclassifier scores are included in Table 2. Using the trained model,we then label the entire messages as pump/not-pump. From eachmessage, we extract the coins mentioned in the message and themessage timestamp. We call the (coin, timestamp) pair a pumpattempt. We aggregate multiple timestamps into the earliest one, ifthey appear within a 3-hour window. We also remove the messagesthat mention many coins, as a pump message usually targets onlya small number of coins. The statistics of the final set of messagesand pump attempts are given in Table 3.
3.2 Signatures of Pump and Dump Activitieson Market and Social Data
Having established the prevalence of pump and dump operationson Telegram, we now analyze the effectiveness of those operations,by juxtaposing pump messages with crytocurrency market dataand social signals collected from Twitter. Specifically, we focuson the overall effect of pump attempts on cryptocurrency pricesand determine whether there is an indication of concurrent fraudactivity on Twitter.
Let Si = (ci , ti ) be a pump attempt, with ti the time of the at-tempt, and ci the target coin (in the next section, we explain indetail our approach for detecting pump attempts). For every pumpattempt Si = (ci , ti ) we extract two time series segments: The price
and tweet volume of coin ci , denoted as P(ci )ti−w :ti+w and V (ci )
ti−w :ti+wrespectively, wherew is a time window equal to three days. Eachsegment is normalized between 0 and 1 by a minmax normaliza-tion, transforming each point x to x = (x −min)/(max−min). Wecalculate Qpr ice and Qtwitter as follows:
Qpr ice =1n
n∑iP(ci )t and Qtwitter =
1n
n∑iV(ci )t ,
Note that i ∈ [1,n] means that we have considered all the pumpattempts. For each coin, we also select a set of timestamps uniformlyat random, with the size equal to the number of pump attemptstargeting the coin. In the same manner, we make two aggregatedtimeseries for the random timestamps.
Figure 4a depicts an average normalized price of each coin cen-tered around the pump timestamps (Qpr ice ) and random times-tamps. This figure shows a pattern of spikes occurring within onehour of a pump message, followed by a general downward trend.A significant increase in tweet volume is also observable in Figure4b, which shows the average tweet volume of each coin aroundthe pump timestamps (Qtwitter ) and random timestamp. The sea-sonality pattern present in the Telegram timestamps, and not inthe random timestamps, suggests that most of the pump attemptshappen around a specific time of day.
Successful PumpAttempts. Although Figure 4a indicates a pricespike for the aggregated data, it is reasonable to expect that not allthe pumpmessages are actually followed by a spike in the coin price.Furthermore, even if there is a spike, it might fall short of meetingthe “target" price, thus resulting in failed pump. We used a simplerule-based approach to extract the “buy" and “target" prices fromall the messages, and augmented this information with the coinprice data to decide whether a given pump attempt was successfulor not. Figure 5 shows the percentage of successful pump messagesfor different thresholds and time windows. Fewer than 5% of thepump messages meet the most strict conditions, meaning that thecoin price reaches a higher price than the extracted target price,and within an hour of the pump message.
4 PUMP ATTEMPTS PREDICTIONIn this section we study the feasibility of predicting pump and dumpevents from the social media and market data only, without relyingon the availability of Telegram messages 5. Specifically, we focuson the following two classification tasks:
• Task I: Detect whether there is an unfolding pump opera-tion/advertisement campaign happening on Telegram, byconsidering social signals only from Twitter, and historicalmarket data.
• Task II: Given a pump message on Telegram for a specificcoin, predict whether the operation will succeed (i.e., willthe target price, set by the scammers, be met within 6 hoursof the message is posted on Telegram).
Both of these tasks are cast as binary classification problems. Thefeature vector for each record is extracted at a specific timestamp:
5We use Telegram messages only as ground truth for evaluating our predictive models,but not as input to those models.

Identifying and Analyzing Cryptocurrency Manipulations in Social Media
750 500 250 0 250 500 750Time
0.42
0.44
0.46
0.48
0.50
Pric
e
Telegram TimestampsRandom Timestamps
(a) Aggregated Price
750 500 250 0 250 500 750Time
0.11
0.12
0.13
0.14
Twee
t Vol
ume
Telegram TimestampsRandom Timestamps
(b) Aggregated Tweet Volume
Figure 4: Price (a) and Twitter (b) time series segments of cryptocurrencies separated by whether they are mentioned in aTelegram pump and dump channel. Segments start 3 hours before and end 3 hours after the mention in a Telegram channel.Timestamps are selected uniformly at random.
0 5 10 15 20 25Time Window (hour)
0.1
0.2
0.3
0.4
0.5
0.6
Suc
cess
Rat
io
Successful Pumps Ratio100% Threshold98% Threshold95% Threshold90% Threshold
Figure 5: Ratio of successful pumps for different thresholdsand timewindows. “100% threshold ” indicates the coin pricebeats the extracted target price. “x% threshold” is when thecoin price either beats the price or reaches the x% of the ex-tracted price.
specifically, it contains data from 6 hours prior to the timestamp.The features of the timestamps are explained next.
4.1 FeaturesTable 4 explains all the features extracted from our data sourcesthat are used for the two prediction tasks. Graph features include:(i.) PageRank score; (ii.) CorEx user embeddings; and (iii. ) userconnected components. These are extracted from the coin-coinnetwork, the pump-user network, and the user-user network, re-spectively. These networks are undirected and temporal, wherethe presence (or absence) of an edge depends on the time range in
which the networks are constructed. Each network is explained inits corresponding feature section.
Economic Features. Include (i) Coin Market Cap, (ii) Volume, and(iii) Price, in h ∈ 1, 2, . . . ,w hours before timestamp t . For eachof these three, we also include percentage change. For example,price percentage change at hour h is priceh+1−priceh
priceh.
Target Price Features. This feature will only be used in the sec-ond classification task (whether the pump succeeds, introduced inSection 4). As explained in Section 3, the definition of success de-pends on the target price mentioned in a pumpmessage. For a givenpumpmessage with a mentioned target price x , we include x−priceh
xfor h ∈ 1, 2, . . . ,w hours before the pump message timestamp.
Twitter Statistics. For a given timestamp t , the features extractedfrom time period [t , t −w] include (i.) the number of tweets men-tioned the cashtag; (ii.) the number of unique users who mentionedthe cashtag in a tweet; and (iii.) the average sentiment of all thetweets mentioning the cashtag calculated using [7].
PageRank Score. We calculate the PageRank score [16] of a coinin the coin-coin graph created at time t , in which the nodes corre-spond to the cashtags, connected by an edge if they are mentionedby the same user, within the period [t - w, t]. The edge weightscorrespond to the number of times two coins are co-mentioned bya user.
CorEx User Embeddings. Consider a bipartite graph containingpump attempts and users as nodes. The edge weight between apump attempt Si = (ci , ti ) and user uj is equal to the number oftimes uj mentions ci in a tweet within the period [t −w, t]. Herewe chose w = 6 hours. We call this graph pump-user networkand denote B ∈ R |S |× |U | as the affiliation matrix of this bipartitegraph, where S and U are the set of pump attempts and usersrespectively. Bij is equal to the weight of the edge connecting Si

Mirtaheri, et al.
Table 4: Description of the features used in the pump predictions and user clustering.
Feature type Description
Twitter Features
• Number of tweets mentioned the cashtag in the period [t , t −w]• Number of unique users mentioned the cashtag in the period [t , t −w]• Average sentiment of all the tweets mentioning the cashtag in the period [t , t −w] calculated
using [7]• PageRank score [16] of a coin in the Coin-Coin graph created at time t• Twitter User Connected Components• CorEx user embedding
Economic Features• Coin market cap and market cap percentage change at h hour before the pump where h ∈
1, 2, . . . , 12• Coin volume and volume percentage change at h hour before the pump where h ∈ 1, 2, . . . , 12• Coin price and price percentage change in BTC unit at h hour before the pump where h ∈
1, 2, . . . , 12• Target price percentage difference with coin price at h hour before the pump where h ∈
1, 2, . . . , 12
and uj . In fact, matrix B represents each pump attempt as a |U |-dimensional vector of user activities, meaning that each user isconsidered as a variable.Wewant to cluster users if their activity arecorrelated. Total Correlation Explanation (CorEx) discovers a latentrepresentation of complex data based on optimizing an information-theoretic approach. More specifically, given a set of n-dimensionalvectorsX ∈ Rm×n , CorEx aims to find latent variables Y =WX thatbest describe the multivariate dependencies of X by minimizingTC(X|Y) + TC(Y). Here, TC is “total correlation” or multivariatemutual information [31].
We apply linear CorEx on B, and find the best number of latentfactors k by plotting the sum of the total correlation for each latentvariable against k . This value starts descreasing significantly whenk = 24. The weight matrix W ∈ Rm×k obtained from applyinglinear CorEx is used as the embedding for the users. Later in Section5 we further explore pump-user network and CorEx clusters foranalysing bot activities.
User Connected Components. We would like to characterizegroups of users that participate in coordinated spreading of “pump"messages on Twitter. Given a coin c and all the pump instancestargeting c , Si = (c, ti ), a bipartite graph is built from the pumpinstances and users. uj is connected to Si if uj tweeted about cwithin the time period [ti − 6, ti ], measured in hours. From thisbipartite graph, we then build a user-user network, in which usersi and j are connected with a weighted edge that corresponds to thetime the users co-tweet about c . After this process, the graph is verydense with usually > 80% of nodes belonging to one connectedcomponent. We sparsify the graph by keeping the top-k edges peruser. Then we calculate the connected components from the graph,dropping connected components consisting of less than 25 users.Each user is now represented by the ID of its connected component.Users that do not correspond to the connected components areignored in this feature representation. Manual inspection of theconnected components showed that they are indeed meaningful,with the largest connected component usually corresponding tousers who are likely involved in pump and dump operations. Given
a coin and a timestamp, we create a feature vector containing thecounts of users tweeting about the coin, grouped by the connectedcomponents they belong to. Intuitively, these features representhow active a group (connected component) has beenwithin a periodfrom t −w to t . We tried k ∈ 1, 2, 3, and the final result does notchange much. However, higher values produced just a handful ofsizable connected components.
4.2 Classification TasksIn this section we explain the experimental setting and predictiontasks design.
Task I: Predicting Pump Attempts. We propose a binary clas-sification task for predicting Telegram pump messages that willhappen in the future, from Twitter activity. In our setup, we usethe timestamps of Telegram messages labeled as pump attemptsby our classifier as positives. We use an equal number of randomtimestamps as negatives.Task II: Will the Pump Succeed? The positives of this task area subset of the positives in Task I—namely, the pumps that havesucceeded. In other words, the target price mentioned in the pumpmessage was successfully met by the market. The negatives of thistask include all the negatives of Task I and some of the positives ofTask 1—specifically, the pump messages that were not successful.In other words, the target price was not reached within 6 hours ofthe pump message.
For both tasks, we train a binary Random Forest classifier. Itmight be possible to improve the classification accuracy by usingsophisticated approaches, i.e., neural nets, but since our focus isto demonstrate the possibility of classification, we focus on tradi-tional methods. We split the dataset into train/test, such that eachsample (c, t) corresponding to coin c at time t is in the training setif t < d and in the test set otherwise. For each coin, d is pickedin way to reach a 75%/25% split. Let Train = S1, S2, ..., Sd andTest = Sd+1, Sk+2, ...Sn , sorted by their timestamps. For eachcoin, we train a separate classifier in the following way:
Identifying and Analyzing Cryptocurrency Manipulations in Social Media
0 5 10 15 20Hour
0.64
0.66
0.68
0.70
0.72
0.74
0.76
AU
C S
core
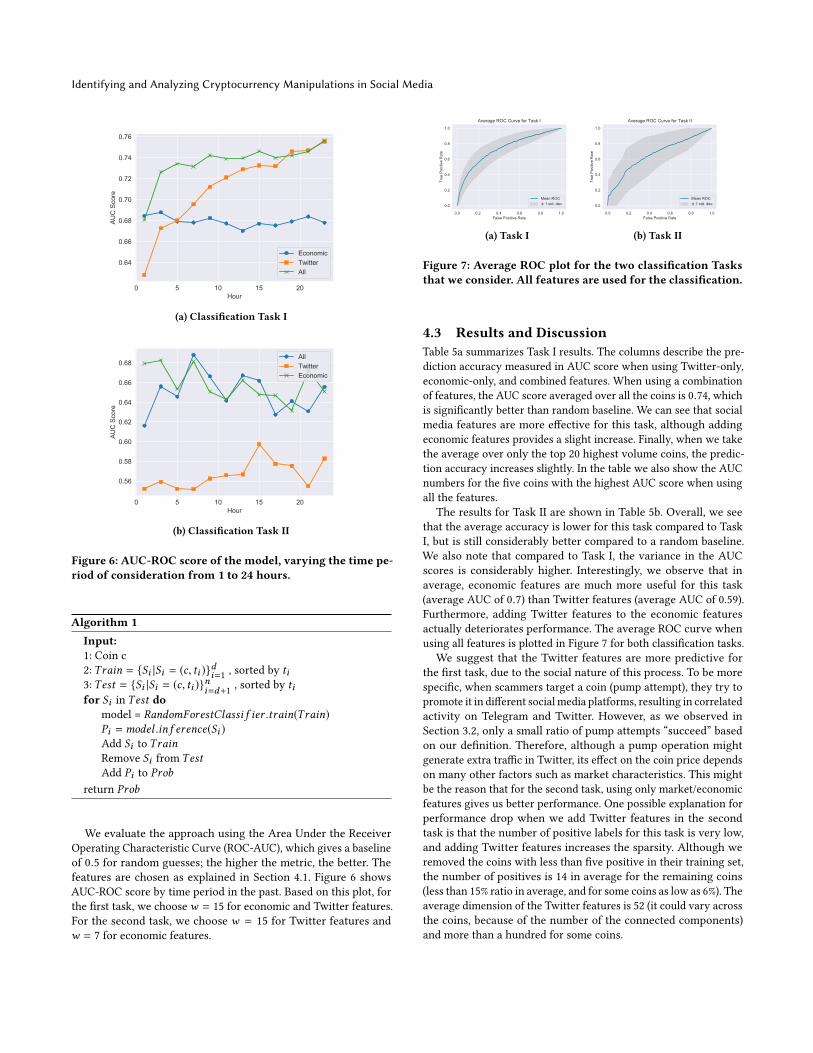
EconomicTwitterAll
(a) Classification Task I
0 5 10 15 20Hour
0.56
0.58
0.60
0.62
0.64
0.66
0.68
AU
C S
core
AllTwitterEconomic
(b) Classification Task II
Figure 6: AUC-ROC score of the model, varying the time pe-riod of consideration from 1 to 24 hours.
Algorithm 1Input:1: Coin c2: Train = Si |Si = (c, ti )di=1 , sorted by ti3: Test = Si |Si = (c, ti )ni=d+1 , sorted by tifor Si in Test do
model = RandomForestClassi f ier .train(Train)Pi =model .in f erence(Si )Add Si to TrainRemove Si from TestAdd Pi to Prob
return Prob
We evaluate the approach using the Area Under the ReceiverOperating Characteristic Curve (ROC-AUC), which gives a baselineof 0.5 for random guesses; the higher the metric, the better. Thefeatures are chosen as explained in Section 4.1. Figure 6 showsAUC-ROC score by time period in the past. Based on this plot, forthe first task, we choosew = 15 for economic and Twitter features.For the second task, we choose w = 15 for Twitter features andw = 7 for economic features.
0.0 0.2 0.4 0.6 0.8 1.0False Positive Rate
0.0
0.2
0.4
0.6
0.8
1.0
True
Pos
itive
Rat
e
Average ROC Curve for Task I
Mean ROC± 1 std. dev.
(a) Task I
0.0 0.2 0.4 0.6 0.8 1.0False Positive Rate
0.0
0.2
0.4
0.6
0.8
1.0
True
Pos
itive
Rat
e
Average ROC Curve for Task II
Mean ROC± 1 std. dev.
(b) Task II
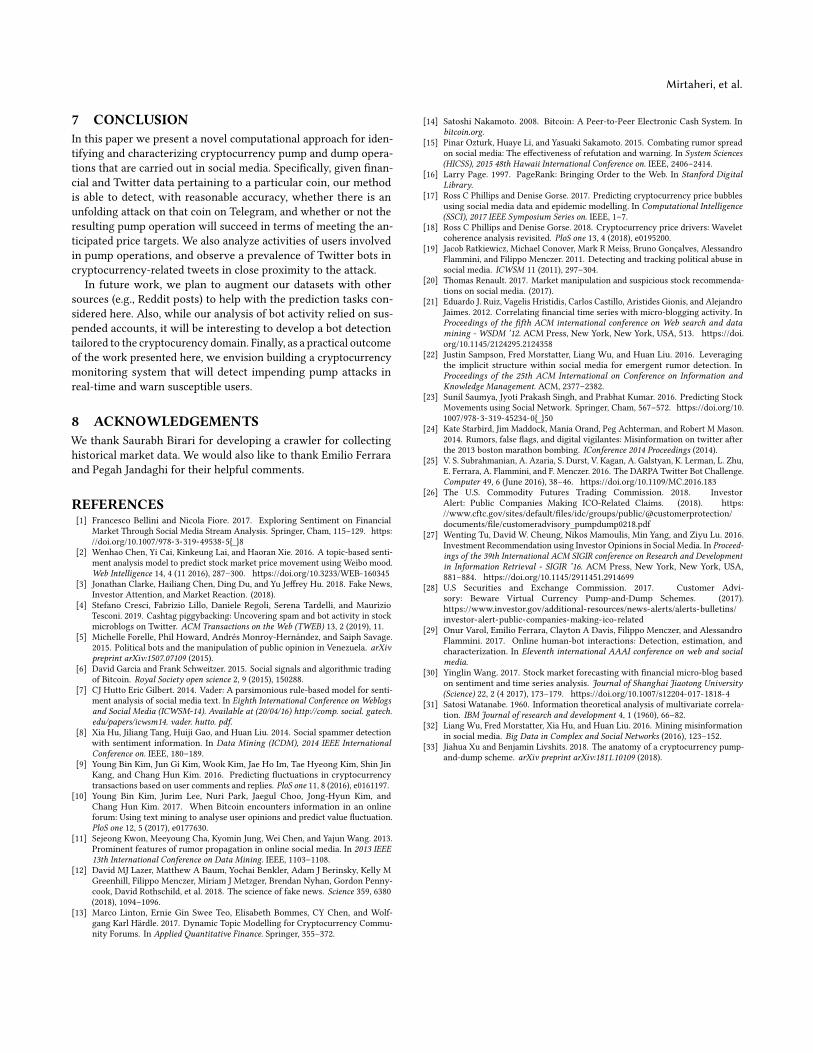
Figure 7: Average ROC plot for the two classification Tasksthat we consider. All features are used for the classification.
4.3 Results and DiscussionTable 5a summarizes Task I results. The columns describe the pre-diction accuracy measured in AUC score when using Twitter-only,economic-only, and combined features. When using a combinationof features, the AUC score averaged over all the coins is 0.74, whichis significantly better than random baseline. We can see that socialmedia features are more effective for this task, although addingeconomic features provides a slight increase. Finally, when we takethe average over only the top 20 highest volume coins, the predic-tion accuracy increases slightly. In the table we also show the AUCnumbers for the five coins with the highest AUC score when usingall the features.
The results for Task II are shown in Table 5b. Overall, we seethat the average accuracy is lower for this task compared to TaskI, but is still considerably better compared to a random baseline.We also note that compared to Task I, the variance in the AUCscores is considerably higher. Interestingly, we observe that inaverage, economic features are much more useful for this task(average AUC of 0.7) than Twitter features (average AUC of 0.59).Furthermore, adding Twitter features to the economic featuresactually deteriorates performance. The average ROC curve whenusing all features is plotted in Figure 7 for both classification tasks.
We suggest that the Twitter features are more predictive forthe first task, due to the social nature of this process. To be morespecific, when scammers target a coin (pump attempt), they try topromote it in different social media platforms, resulting in correlatedactivity on Telegram and Twitter. However, as we observed inSection 3.2, only a small ratio of pump attempts “succeed” basedon our definition. Therefore, although a pump operation mightgenerate extra traffic in Twitter, its effect on the coin price dependson many other factors such as market characteristics. This mightbe the reason that for the second task, using only market/economicfeatures gives us better performance. One possible explanation forperformance drop when we add Twitter features in the secondtask is that the number of positive labels for this task is very low,and adding Twitter features increases the sparsity. Although weremoved the coins with less than five positive in their training set,the number of positives is 14 in average for the remaining coins(less than 15% ratio in average, and for some coins as low as 6%). Theaverage dimension of the Twitter features is 52 (it could vary acrossthe coins, because of the number of the connected components)and more than a hundred for some coins.

Mirtaheri, et al.
Table 5: ROC-AUC test performance on the two binary tasks,averaging 10 different train:test partitions. We show evalu-ations for three feature-sets. From right to left: The right-most is “Both,” utilizing bothfinancial andTwitter. The “Eco-nomic” and “Twitter” utilize economic and Twitter featuresseparately. The average AUC score is reported for (i) all thecoins (ii) 20 coins with the highest dollar volume. The topfive most-predictable coins are also shown for each task.
(a) Classification Task I: Predicting Pump Attempts
Twitter Economic Both
Average AUC (all coins) 0.73 ± 0.07 0.67 ± 0.1 0.74 ± 0.08Average AUC (top 20 vol.) 0.75 ± 0.06 0.68 ± 0.1 0.75 ± 0.07
$ADA 0.85 0.84 0.88$NCASH 0.84 0.81 0.88$DGB 0.79 0.76 0.86$RCN 0.82 0.61 0.85$TRX 0.83 0.81 0.84
(b) Classification Task II: Will the Pump Succeed?
Twitter Economic Both
Average AUC (all coins) 0.59 ± 0.16 0.70 ± 0.19 0.66 ± 0.17Average AUC (top 20 vol.) 0.62 ± 0.18 0.76 ± 0.17 0.71 ± 0.16
$NMR 0.71 0.36 0.94$XEM 0.63 0.66 0.90$XRP 0.77 0.84 0.90$QTUM 0.83 0.80 0.89$ARK 0.47 0.77 0.88
We investigated the reasons for obtaining high accuracy scoresfor some coins but not the others. In particular, we analyzed poten-tial relations between the prediction accuracy and financial indi-cators of a coin such as market cap, volume, and so on. As shownin Table 5b, the accuracy score is typically higher for coins withhigher dollar volume. Our preliminary analysis of other featuresproduced rather ambiguous results, as we did not find meaningfulcorrelations between accuracy and coin features. This may requiremore thorough investigation in the future.
5 PREVALENCE OF TWITTER BOTSIn this section, we study the presence of bot activity around pumpattempts by exploring the pump-user network that we explained inSection 4.1. This bipartite network has 36 connected components,but the largest connected component contains roughly 99% of theusers and 99% of pump attempts. Below we discuss the involvementof Twitter bots in those attempts.
First, from our tweet dataset we extract the tweets containinga Telegram invitation link (e.g., http://t.me/Monsterpumper). Welabel the users associated with these tweets as telegram activeusers.
Next, we use two approaches for classifying a user as a bot.
0.0 0.2 0.4 0.6 0.8 1.0Bot Score
0
200
400
600
800
1000
1200
1400
Use
rs F
requ
ency
Figure 8: Score distribution obtained using Botometer API.Shows the probability of a user being bot.
• Twitter Suspended List. Using the Twitter API, we collectedthe most recent account status of the users in our datasetand checked whether they are still active or suspended byTwitter.
• Botometer Score [29]. Twitter works based on algorithmswith high precision but low recall, since they do not want tomistakenly suspend users that are not bots. So we employedthe Botometer API 6 to detect other potential bots. Given auser id, Botometer returns a probability of that user beinga bot. Botometer classifies users using six types of features:friend, network, content, sentiment, temporal, and user. Fig-ure 8 shows the distribution of the classifier score using allsix features.
A user was classified as a bot if either the user was suspended orits Botometer score is above 0.55 7.
Table 6 shows an increasing ratio by degree. For a given user, thedegree is the sum of the weights of its adjacent edges in the pump-user network and is the number of times the user participated inthe pump operations. This suggests that a larger fraction of highlyactive users are bots, and the ratio increases with the activity level.For example, 84% of the users that participated more than 10K timesin the pump activities are either suspended or are bots, accordingto their Botometer score.
User Clustering. Now we look at different user clusters. Usingthe weight matrixW obtained from applying CorEx on B (explainedin more detail in Section 4.1) we cluster the users of the pump-usernetwork by assigning user ui to arдmaxWi .
Figure 9 shows the ratio of the bots and Telegram-active users ineach cluster. The blue bar shows the ratio of the users that are botsand Telegram-active. Note that the bot ratio is the number of usersthat are either suspended or have a botometer score > 0.55. The firstand second cluster have 734 and 1,011 members respectively where
6https://botometer.iuni.iu.edu/#!/api7We use 0.55 instead of 0.5 suggested by [29] to avoid edge cases

Identifying and Analyzing Cryptocurrency Manipulations in Social Media
Table 6: Ratio of scammer users based on the number oftimes a user contributes to the pump attempts. The ratio ofTelegram active users and suspended users is higher amonghighly active users.
DegreeTotal# Users Suspended
TelegramActive
BotometerScore > 0.55
50 20881 0.19 0.27 0.20100 10969 0.23 0.34 0.20500 2577 0.40 0.37 0.241000 1435 0.46 0.36 0.245000 340 0.56 0.30 0.2510000 179 0.42 0.29 0.36
1 2 3 4 5 6 7 8 9 10 11 12 13 14 15 16 17 18 19 20 21 22 23 24Cluster Number
0.0
0.1
0.2
0.3
0.4
0.5
0.6
0.7
0.8
Rat
io
Typebotstelegram activeoverlap
Figure 9: Ratio of bots and Telegram-active users in eachcluster
more than 80% of them are bots. Cluster 16 is also interesting ina sense that it has 600 members where 50% of them are Telegram-active, and around 60% are bots. Cluster 17 and 18 have 3K memberseach with a low ratio of bot members.
6 RELATEDWORKWe split the discussion of the related work into three complemen-tary threads. First, we focus on fraud in social media and some ofthe efforts that have been taken to address it. Next, we discuss otherwork that analyzes the relation between financial market and socialmedia data. We then describe the effort on studying cryptocurrencyactivity, with a special focus on work that includes social media inits analysis.
Social media has a long history of fraudulent activity, and sometypes of fraud appear in our work. First, when scammers attempt topump a coin by making it look more popular than it actually is, theyare engaging in a specific type of misinformation. Misinformationis a major problem on social media [32], and several recent effortshave tried to detect it [11, 19, 24]. Another burgeoning line of workis bot detection [25]. There is a known connection between bots
and misinformation, wherein bots are actively employed to spreadmisinformation in social networks [5, 12]. We leverage previousliterature in these areas in our approach. The bot labeling approachthat we use in the bot assessment portion is based on previouswork [8]. Additionally, we study the dynamics of users’ reactions tothe pump and dump campaigns. This is similar to previous work onsocial media where similar inputs are used to identify susceptibleusers [15, 22].
The literature on predicting various financial market propertiesexploiting signals from different social media data is quite extensive.[1, 2, 30] use sentiment features to predict stock price movements,while [21, 23, 27] employ network features extracted from varioussocial media interactions. However, only a few papers study stockmarket manipulations on social media. [20] studies pump and dumpin OTC (Over The Counter or Penny stocks) and shows that anabnormally high number of messages on Twitter is associated withprice increase followed by a price reversal. [3] shows the presenceof bot and spam activity on Twitter stock microblogs and comparesTwitter activity with financial data. Authors in [4] uncover andintroduce Cashtag Piggybacking, a type of malicious activity onTwitter in which scammers try to highlight low-value stocks byco-mentioning them in the tweets with high-value stocks.
Several papers study cryptocurrencies, and analysts build modelsto predict their price movement. An example is [9]. In this paperthe authors use cryptocurrency forums to predict the price and vol-ume of cryptocurrencies. In another effort [17] the authors build amodel to predict price fluctuations of cryptocurrencies. Specifically,they use epidemic models on social media activity to predict pricebubbles of cryptocurrencies. [10] further tests how users discusscryptocurrencies and how that discussion impacts price. They foundthat specific topics are likely to be tied to price movements. [18]extends this analysis by using wavelets to predict price movementsbased on social media data. [6] looks into the dynamics underlyingsocial media and how they correlate with cryptocurrency price.They find that opinion polarization has a significant effect on price,and use this to build a model that predicts the price of the cryptocur-rency. In an effort to understand the dynamics of cryptocurrencydiscussions, [13] performed topic modeling on a popular cryptocur-rency discussion forum. They identified several common threadsof discussion, such as bitcoin theft. Moreover, they showed thatdifferent mining technologies have different patterns of adoption onthe forums. Our work stands apart from these methods by movingaway from predicting price and volume movements, and insteadidentifying patterns of malicious behavior.
The work that is most related to ours is [33], where the maingoal is predicting which coin will be pumped based on social signalsfrom Telegram. The authors focus on “pre-pump” messages thatannounce an upcoming pump operation, but do not mention a coin.They developed a model to predict the likelihood of each coin beingthe target of the subsequent pump operation following the “pre-pump” message. Our work is complementary in that we consider aricher set of prediction problems, we use social signals from Twitter,and we provide a user-centric analysis of such pump attacks.
Mirtaheri, et al.
7 CONCLUSIONIn this paper we present a novel computational approach for iden-tifying and characterizing cryptocurrency pump and dump opera-tions that are carried out in social media. Specifically, given finan-cial and Twitter data pertaining to a particular coin, our methodis able to detect, with reasonable accuracy, whether there is anunfolding attack on that coin on Telegram, and whether or not theresulting pump operation will succeed in terms of meeting the an-ticipated price targets. We also analyze activities of users involvedin pump operations, and observe a prevalence of Twitter bots incryptocurrency-related tweets in close proximity to the attack.
In future work, we plan to augment our datasets with othersources (e.g., Reddit posts) to help with the prediction tasks con-sidered here. Also, while our analysis of bot activity relied on sus-pended accounts, it will be interesting to develop a bot detectiontailored to the cryptocurency domain. Finally, as a practical outcomeof the work presented here, we envision building a cryptocurrencymonitoring system that will detect impending pump attacks inreal-time and warn susceptible users.
8 ACKNOWLEDGEMENTSWe thank Saurabh Birari for developing a crawler for collectinghistorical market data. We would also like to thank Emilio Ferraraand Pegah Jandaghi for their helpful comments.
REFERENCES[1] Francesco Bellini and Nicola Fiore. 2017. Exploring Sentiment on Financial
Market Through Social Media Stream Analysis. Springer, Cham, 115–129. https://doi.org/10.1007/978-3-319-49538-5_8
[2] Wenhao Chen, Yi Cai, Kinkeung Lai, and Haoran Xie. 2016. A topic-based senti-ment analysis model to predict stock market price movement using Weibo mood.Web Intelligence 14, 4 (11 2016), 287–300. https://doi.org/10.3233/WEB-160345
[3] Jonathan Clarke, Hailiang Chen, Ding Du, and Yu Jeffrey Hu. 2018. Fake News,Investor Attention, and Market Reaction. (2018).
[4] Stefano Cresci, Fabrizio Lillo, Daniele Regoli, Serena Tardelli, and MaurizioTesconi. 2019. Cashtag piggybacking: Uncovering spam and bot activity in stockmicroblogs on Twitter. ACM Transactions on the Web (TWEB) 13, 2 (2019), 11.
[5] Michelle Forelle, Phil Howard, Andrés Monroy-Hernández, and Saiph Savage.2015. Political bots and the manipulation of public opinion in Venezuela. arXivpreprint arXiv:1507.07109 (2015).
[6] David Garcia and Frank Schweitzer. 2015. Social signals and algorithmic tradingof Bitcoin. Royal Society open science 2, 9 (2015), 150288.
[7] CJ Hutto Eric Gilbert. 2014. Vader: A parsimonious rule-based model for senti-ment analysis of social media text. In Eighth International Conference on Weblogsand Social Media (ICWSM-14). Available at (20/04/16) http://comp. social. gatech.edu/papers/icwsm14. vader. hutto. pdf.
[8] Xia Hu, Jiliang Tang, Huiji Gao, and Huan Liu. 2014. Social spammer detectionwith sentiment information. In Data Mining (ICDM), 2014 IEEE InternationalConference on. IEEE, 180–189.
[9] Young Bin Kim, Jun Gi Kim, Wook Kim, Jae Ho Im, Tae Hyeong Kim, Shin JinKang, and Chang Hun Kim. 2016. Predicting fluctuations in cryptocurrencytransactions based on user comments and replies. PloS one 11, 8 (2016), e0161197.
[10] Young Bin Kim, Jurim Lee, Nuri Park, Jaegul Choo, Jong-Hyun Kim, andChang Hun Kim. 2017. When Bitcoin encounters information in an onlineforum: Using text mining to analyse user opinions and predict value fluctuation.PloS one 12, 5 (2017), e0177630.
[11] Sejeong Kwon, Meeyoung Cha, Kyomin Jung, Wei Chen, and Yajun Wang. 2013.Prominent features of rumor propagation in online social media. In 2013 IEEE13th International Conference on Data Mining. IEEE, 1103–1108.
[12] David MJ Lazer, Matthew A Baum, Yochai Benkler, Adam J Berinsky, Kelly MGreenhill, Filippo Menczer, Miriam J Metzger, Brendan Nyhan, Gordon Penny-cook, David Rothschild, et al. 2018. The science of fake news. Science 359, 6380(2018), 1094–1096.
[13] Marco Linton, Ernie Gin Swee Teo, Elisabeth Bommes, CY Chen, and Wolf-gang Karl Härdle. 2017. Dynamic Topic Modelling for Cryptocurrency Commu-nity Forums. In Applied Quantitative Finance. Springer, 355–372.
[14] Satoshi Nakamoto. 2008. Bitcoin: A Peer-to-Peer Electronic Cash System. Inbitcoin.org.
[15] Pinar Ozturk, Huaye Li, and Yasuaki Sakamoto. 2015. Combating rumor spreadon social media: The effectiveness of refutation and warning. In System Sciences(HICSS), 2015 48th Hawaii International Conference on. IEEE, 2406–2414.
[16] Larry Page. 1997. PageRank: Bringing Order to the Web. In Stanford DigitalLibrary.
[17] Ross C Phillips and Denise Gorse. 2017. Predicting cryptocurrency price bubblesusing social media data and epidemic modelling. In Computational Intelligence(SSCI), 2017 IEEE Symposium Series on. IEEE, 1–7.
[18] Ross C Phillips and Denise Gorse. 2018. Cryptocurrency price drivers: Waveletcoherence analysis revisited. PloS one 13, 4 (2018), e0195200.
[19] Jacob Ratkiewicz, Michael Conover, Mark R Meiss, Bruno Gonçalves, AlessandroFlammini, and Filippo Menczer. 2011. Detecting and tracking political abuse insocial media. ICWSM 11 (2011), 297–304.
[20] Thomas Renault. 2017. Market manipulation and suspicious stock recommenda-tions on social media. (2017).
[21] Eduardo J. Ruiz, Vagelis Hristidis, Carlos Castillo, Aristides Gionis, and AlejandroJaimes. 2012. Correlating financial time series with micro-blogging activity. InProceedings of the fifth ACM international conference on Web search and datamining - WSDM ’12. ACM Press, New York, New York, USA, 513. https://doi.org/10.1145/2124295.2124358
[22] Justin Sampson, Fred Morstatter, Liang Wu, and Huan Liu. 2016. Leveragingthe implicit structure within social media for emergent rumor detection. InProceedings of the 25th ACM International on Conference on Information andKnowledge Management. ACM, 2377–2382.
[23] Sunil Saumya, Jyoti Prakash Singh, and Prabhat Kumar. 2016. Predicting StockMovements using Social Network. Springer, Cham, 567–572. https://doi.org/10.1007/978-3-319-45234-0_50
[24] Kate Starbird, Jim Maddock, Mania Orand, Peg Achterman, and Robert M Mason.2014. Rumors, false flags, and digital vigilantes: Misinformation on twitter afterthe 2013 boston marathon bombing. IConference 2014 Proceedings (2014).
[25] V. S. Subrahmanian, A. Azaria, S. Durst, V. Kagan, A. Galstyan, K. Lerman, L. Zhu,E. Ferrara, A. Flammini, and F. Menczer. 2016. The DARPA Twitter Bot Challenge.Computer 49, 6 (June 2016), 38–46. https://doi.org/10.1109/MC.2016.183
[26] The U.S. Commodity Futures Trading Commission. 2018. InvestorAlert: Public Companies Making ICO-Related Claims. (2018). https://www.cftc.gov/sites/default/files/idc/groups/public/@customerprotection/documents/file/customeradvisory_pumpdump0218.pdf
[27] Wenting Tu, David W. Cheung, Nikos Mamoulis, Min Yang, and Ziyu Lu. 2016.Investment Recommendation using Investor Opinions in Social Media. In Proceed-ings of the 39th International ACM SIGIR conference on Research and Developmentin Information Retrieval - SIGIR ’16. ACM Press, New York, New York, USA,881–884. https://doi.org/10.1145/2911451.2914699
[28] U.S Securities and Exchange Commission. 2017. Customer Advi-sory: Beware Virtual Currency Pump-and-Dump Schemes. (2017).https://www.investor.gov/additional-resources/news-alerts/alerts-bulletins/investor-alert-public-companies-making-ico-related
[29] Onur Varol, Emilio Ferrara, Clayton A Davis, Filippo Menczer, and AlessandroFlammini. 2017. Online human-bot interactions: Detection, estimation, andcharacterization. In Eleventh international AAAI conference on web and socialmedia.
[30] Yinglin Wang. 2017. Stock market forecasting with financial micro-blog basedon sentiment and time series analysis. Journal of Shanghai Jiaotong University(Science) 22, 2 (4 2017), 173–179. https://doi.org/10.1007/s12204-017-1818-4
[31] Satosi Watanabe. 1960. Information theoretical analysis of multivariate correla-tion. IBM Journal of research and development 4, 1 (1960), 66–82.
[32] Liang Wu, Fred Morstatter, Xia Hu, and Huan Liu. 2016. Mining misinformationin social media. Big Data in Complex and Social Networks (2016), 123–152.
[33] Jiahua Xu and Benjamin Livshits. 2018. The anatomy of a cryptocurrency pump-and-dump scheme. arXiv preprint arXiv:1811.10109 (2018).