Strategic Energy Procurement: Using Data to Forecast, Plan & Manage Your Spend
Upload
vuongkhanhCategory
view
226download
0
Identify and Manage Procurement Savings using Advance Compliance Analytics
Pawan Chowdhary, Markus Ettl, Amit
Dhurandhar, Soumyadip Ghosh, Gopikrishna
Maniachari
Business Analytics and Math Sciences
IBM T J Watson Research Center Yorktown Heights, NY 10598
{chowdhar, mettl, adhuran, ghoshs,[email protected]}
Bruce Graves, Bill Schaefer,Yu Tang
Business Analytics and Math Sciences
IBM Global Process Services
{bruceg, wss, [email protected]}
Often the processes for purchasing commodities and services
within a business enterprise are centralized into a procurement
organization. These items would be sourced from one or more
suppliers/vendors based on contract terms and conditions (such
as price, payment terms etc.), availability, and quality or legacy
habit of purchasing service with known vendors. We have found
that many organizations lack appropriate processes and
disciplines to drive demand to preferred suppliers. Thus these
enterprises are unable to leverage the value of the pre-
negotiated contracts due to lack of process education, approval
process steps or appropriate purchasing tools that could result
in significant amounts of spending that would be considered not
compliant (not being sourced through preferred suppliers).
Depending upon the size of the organization such transactions
could range from several million dollars to billions of dollars.
Manually sifting or employing typical query tools to review
large amounts of spend transaction data with multiple attributes
to identify the level of non compliant spend and identify areas to take action is a very daunting task.
In this paper we will discuss the work we have done in the area
of compliance analytics including the measurement of cost
savings due to increased compliance and identification of areas
where the spend transactions tend to be non compliant. We have
built a web enabled advanced analytical solution that embeds a
two phase model as part of the compliance analytics tool (CAT).
In the first step we use advanced data mining techniques to
segment/cluster large spend transactions to quickly identify
areas of improvement (such as department, procurement
category, suppliers, etc). The second step employs portfolio
optimization techniques to further narrow the specific categories
that would provide maximum benefit based on a desired
compliance target or available budget. We will also discuss the
solution architecture in detail that integrates several analytical
along with business intelligence tools such as Cognos and a data warehouse.
Compliance Analytics, Procurement, Spend Analysis, Two
Step Cluster, Optimization, SPSS Modeler, CPLEX.
I. INTRODUCTION (HEADING 1)
The fundamental monetary units of analysis in an enterprises can be characterized into two major parts; spend and revenue. Companies generate revenue by selling goods or services. The cost to the company to generate revenue can be broadly classified as spend. This can come
in the form of buying raw-materials as input to the goods or services being sold for manufacturing oriented companies to the technology services, software, hardware and salaries to personnel for non-manufacturing entities.
The types of spending generally can be of classified
into direct spending (that impacts the product being manufactured such as raw materials, computer memory chip; i.e., cost of goods sold) and indirect spending (such as office supplies, maintenance services, travel, marketing, communication; i.e., sales, general & administrative expenses). This spending is sourced from multiple suppliers/vendors and many organizations typically have negotiated contracts with suppliers for SLA, quality, price, etc. Some contracts are written with back-end rebates in mind where the organization gets back certain percentage of spend when they hit predetermined spend target or special pricing for volume spend. This spending can run into billions of dollars for Fortune 500 companies to hundred of millions for mid size organization. Non-best of breed companies do not have proper processes implemented to audit and monitor the critical procurement decision processes. Some organizations might have a very high level of visibility and control over a few procurement products that are core to their business but beyond that much of the procurement activities may be ad-hoc in nature with minimal supervision. This leads to severe spending leakage that many times gets unnoticed due to lack of visibility or appropriate process and controls. The ability to manage and control the procurement spending can significantly improve the bottom line of companies especially during difficult and challenging economic conditions.
The types of procurement data that are typically
available are purchase orders (PO), invoices, preferred suppliers lists, supplier contracts, general ledger entries, etc. There are many tools [1] in the market that typically process PO and invoice transactions and provide visibility to spending by few standard dimensions such as product, vendor, organization, etc depending upon the availability of the data. Furthermore these tools may have built-in rules engine to assess the quality of the data, cleanse and classify the data to standardize the vendor and product categories [2] [3] and also identify the PO data as
compliant spend (established process) or non-compliant spend (ad-hoc spend). These are mainly reporting tools that can provide excellent drill down visibility into spending across few dimensions but they do not have capability to deep dive into data and determine the problematic spend area across several dimensions [4] [5] at the same time. For example, a typical spend management tool can display the top non-compliant spend by vendors and products but they do not further differentiate the spend within the same dimension by other attributes such as spend size, etc and provide further analysis into different areas of non-compliant spending across several dimensions. Thus, it would remain unclear where to focus attention to maximize the ROI when attacking non-compliance.
The compliance analytics tool (CAT), the topic of
discussion in this paper, is web based solution that uses SPSS, iLOG, and Cognos BI capabilities to deliver state of the art data mining analytics to cluster the spend transactions across several dimensions. It also identifies the focus areas for compliance improvement using portfolio optimization techniques to determine the return on investment (ROI) for a given compliance target or investment. Furthermore the solution provides scenario management capabilities to create appropriate scenarios to evaluate spending using mix of dimensions to segment the data space appropriately. Additionally it also creates several optimization scenarios on top of each segmentation scenario to determine the right investment strategy to increase compliance and get the best ROI. With companies spending several millions to improve the procurement compliance which could save them 2 to 25% of total spend [6], having a right tool to analyze and identify focus area for improvement can enable them to achieve these savings at higher range of the spectrum.
The paper is organized as follows. Section 2 gives an overview of the compliance analytics engines and architecture. Section 3 presents a use case representing the proposed solution. Section 4 provides brief summary and proposed extension to current analytics along with collaboration with other tools.
II. TWO PHASE COMPLIANCE ANALYTICS PROCESS
AND ARCHITECTURE
In this section we will discuss about the analytical engines in the CAT tool and then briefly go over the architecture. CAT analytical modules are designed such that it first quickly identifies areas of non compliance that are most relevant and then enable capability that determine optimal savings given compliance target or investment. This approach is called two phase compliance analytics process which is described in detail below
Two phase compliance analytics process
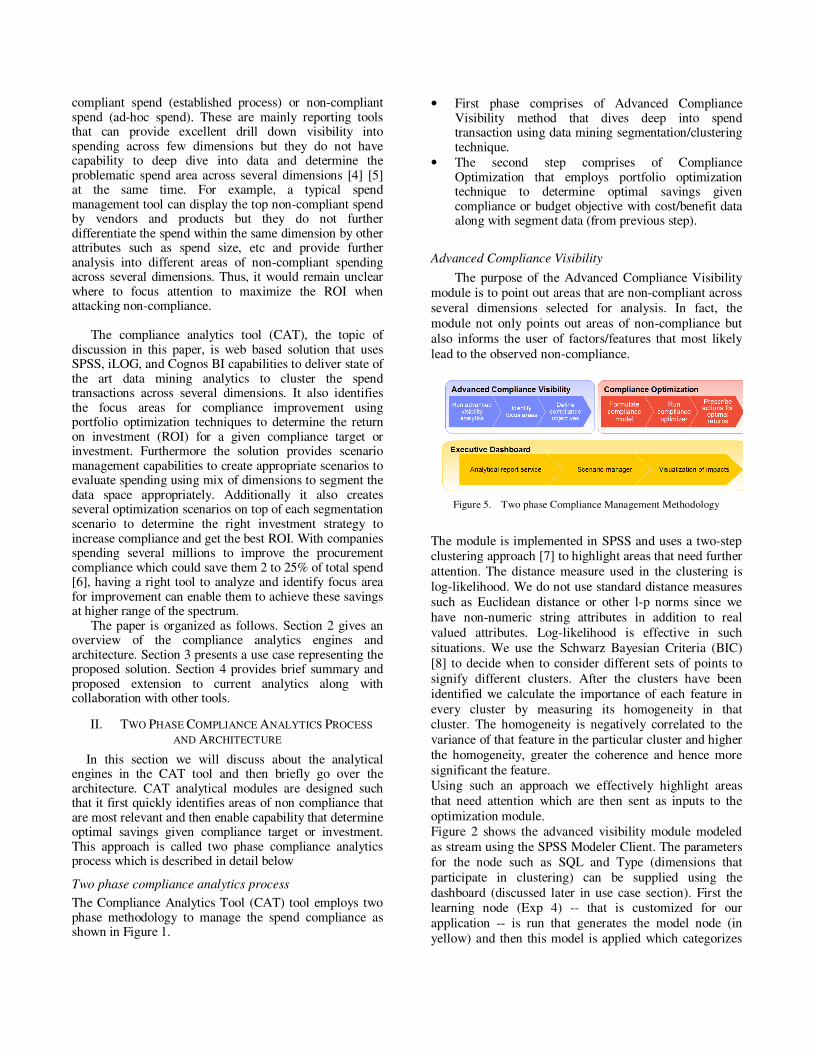
The Compliance Analytics Tool (CAT) tool employs two phase methodology to manage the spend compliance as shown in Figure 1.
• First phase comprises of Advanced Compliance Visibility method that dives deep into spend transaction using data mining segmentation/clustering technique.
• The second step comprises of Compliance Optimization that employs portfolio optimization technique to determine optimal savings given compliance or budget objective with cost/benefit data along with segment data (from previous step).
Advanced Compliance Visibility
The purpose of the Advanced Compliance Visibility module is to point out areas that are non-compliant across several dimensions selected for analysis. In fact, the module not only points out areas of non-compliance but also informs the user of factors/features that most likely lead to the observed non-compliance.
III. EASE OF USE
The module is implemented in SPSS and uses a two-step clustering approach [7] to highlight areas that need further attention. The distance measure used in the clustering is log-likelihood. We do not use standard distance measures such as Euclidean distance or other l-p norms since we have non-numeric string attributes in addition to real valued attributes. Log-likelihood is effective in such situations. We use the Schwarz Bayesian Criteria (BIC) [8] to decide when to consider different sets of points to signify different clusters. After the clusters have been identified we calculate the importance of each feature in every cluster by measuring its homogeneity in that cluster. The homogeneity is negatively correlated to the variance of that feature in the particular cluster and higher the homogeneity, greater the coherence and hence more significant the feature. Using such an approach we effectively highlight areas that need attention which are then sent as inputs to the optimization module. Figure 2 shows the advanced visibility module modeled as stream using the SPSS Modeler Client. The parameters for the node such as SQL and Type (dimensions that participate in clustering) can be supplied using the dashboard (discussed later in use case section). First the learning node (Exp 4) -- that is customized for our application -- is run that generates the model node (in yellow) and then this model is applied which categorizes
Figure 5. Two phase Compliance Management Methodology

each transaction into a specific cluster or segment. The stream execution is programmatically invoked using the SPSS PS-API which is wrapped into the web services for any client to perform such analysis
Figure 2: Advanced Visibility SPSS Stream Model
Compliance Optimization
The compliance optimization module provides the capability of optimizing the compliance improvement investment strategy. Multiple optimization models are supported: the user can minimize the investment required to achieve a specified compliance target for the entire (or parts of the) organization, or maximize the achievable compliance for a given maximum investment budget, or maximize the return-on-investment given a maximum investment budget and/or minimum compliance target. The cost of investing on compliance monitoring can be specified for any arbitrary part of the organization in terms of fixed investments (e.g. procuring a new compliance tool) or in terms of volume-based costs (e.g. 15-mins to review per transaction). Similarly, the benefit of increased compliance can be fixed or volume-based (e.g. volume discounts offered by preferred suppliers). The Figure 6 displays an example of how to capture the cost benefit data. The figure shows three tables (fixed cost, variable cost and savings from improvement). Each table rows define compliance level (v1 = 10%, v2 = 20%, v10 = 100%) and column defines the product categories. For each such combination one can provide the fixed and variable cost to bring the compliance to a particular level and savings that can be obtained to move to that particular compliance level. For example, for product category Marketing and Sales the fixed cost to move from level v6 to v7 (60% to 70%) is $37,500 and variable cost is 0.85% of spend. The benefit to move to this level is about 10% of the spend. These costs could represent multiple actions such as introducing new software tool or establishing / enhancing current compliance process or introducing physical monitoring of Purchase Order at certain clip level, etc.
Figure 3: Cost Benefit Input to Compliance Optimization
Such cost input can be further linked to other dimension such as business units such that each combination has its own cost and savings data that goes as input to the optimization engine. As an example of an optimization scenario, consider the optimization model that maximizes the return-on-investment (ROI) for a given investment budget. The ROI of a business entity is defined as the increase in benefit derived from higher compliance less the additional investment required achieving the higher compliance. Then, the optimization module identifies a prioritized list of investments to make that are ordered in decreasing order of ROI. The list of all possible such orderings can grow exponentially with the number of business entities considered, as well as with the granularity of cost and benefit changes. The optimization module formulates each optimization model as a mathematical program called a mixed-integer linear program and uses IBM's ILog CPLEX optimization solvers to obtain the optimal solution. This is then converted into a prioritized list of investment options to implement. This module scales well with the number of business entities defined, and can identify candidate optimal solutions for problems with 100's of distinct business entities in a few seconds.
Architecture Overview
In this section we will describe how various components interact with each other to provide the seamless solution experience. Figure 4 shows the CAT web based solution architecture. It is a multi tiered web enabled architecture that comprises of presentation layer (BI Reports and scenario manager dashboard), middleware layer (solution management, security component, data access beans, business optimization, etc) and data storage layer (data cleansing component and physical data

warehouse). The description of components that is part of the architecture follows: • Information Integration Services: This component
receives the invoice and purchase order data, cleanse the data and finally stores the data in Spend and Compliance Data Warehouse. This layer also applies following compliance rules to flag a transaction being compliant.
a) Process Compliance:
PO Date should be earlier then Invoice Date PO transaction did not go through normal channel
(Bypass).
b) System Compliance:
Purchase Order number should exist unless exempt product category
c) Vendor Compliance:
Vendor Contract number should exist for each transaction. If any of these rules are violated then the transaction is flagged as non-compliant with appropriate compliance violation flag.
• Spend and Compliance Data Warehouse: This is a data warehouse that stores the raw PO and Invoice data. The database tables related to analytics and scenario management capabilities are also stored in this database.
• Dashboard: This component is mix of Cognos BI portal and adobe flex to deliver the BI report on spend transaction as well as reports from the two analytical engines. The scenario manager, another component listed in the architecture, lets user create new analytical scenario and run them via user interface.
• Business Optimization Services: This component hosts two analytical engines that were discussed in previous section. These engines are wrapped as a web services interface that a client can call with appropriate parameters.
• Management Layer: This component links all other components in the architecture and facilitates communication between them as needed. For example a request to execute an analytics via scenario manager dashboard is received by this component which in turns executes the analytics and then stores the results back in the database.
Figure 4: CAT Architecture
Since the architecture comprises of components, it is easy to add, remove or expand functionality within each component there by enabling the agile development. The use case section will provide more detail on these components by taking one company as an example and walk through various steps to perform analytics and then view the analytics results to identify areas of improvement that provides better return on investment.
III. USE CASE DISCUSSION
To better explain the concept we would walk through a
use case to illustrate the benefits of analytics and also how a user would interact with the solution.
ABC Auto is a dummy company that has several business units (Auto, Truck, Financial Services, etc) that buys various products and services as part of procurement spend across several suppliers to support the business operations. The first step in the CAT Tool would be to get the PO and Invoice data that contains standard attributes such as PO Number, Business Units, Geography, Requester, Product Categories, Supplier, PO Date, Invoice Date, Supplier Contract, Profit Center and Spend in USD. The next step is to put this information in the CAT data warehouse and apply the compliance rules. The data is summarized in the Figure 5.
Figure 5. ABC Auto Spend data summary
Traditional Analysis
The Figure 5 shows very high level of non-compliance at this company. A user performing traditional analysis would try to identify the business units or product categories for which the non-compliance spend is largest and might implement compliance action that might not be cost effective or provide optimal ROI. Figure 6 depicts the traditional approach a user might take to arrive at such decision. The ABC Auto SUV and Van are two largest spend business units and a user might choose them to raise their compliance level higher. Similarly Marketing & Sales or Logistics product categories might be chosen to improve its compliance level. Although we discussed just two dimensions (business units and product category) similar analysis could be performed on other dimensions such as Vendor, Requester, Profit and Cost Center, etc.

Figure 6. BI Report - Spend by Business units and product categories
Analysis using analytical models in CAT Tool
In this section we will walk through CAT dashboard interface to interactively perform the analysis. A user would go to the web URL and select Advanced Visibility Analytics view and then click on “Create Advanced Visibility Scenario Button” to bring up the screen as shown in Figure 7.
Figure 7. Advanced Visibility Analytics scope selection
The user typically enters a scenario name, select dimensions to cluster or segmentation and defines the scope of the data. For this exercise we have selected all the dimensions and all data for analysis and then click on “Run Segmentation” button. This action sends the message to the CAT management layer which in turns invokes the web services passing the segmentation and scope parameters to run the SPSS Model. The results of the advanced visibility analytics are shown below
Figure 8. SPSS Modeler Segmentation Result for Advanced Visibility
Analytics
The analytics divides the data space into five segments based on the dimensions content and scope of the data. For the current analysis the dimensions considered for segmentation are business units, requestor, product categories, vendor and compliance indicator. The largest segment with non compliance spend (blue square) is the segment 1 that comprises of almost 60% of the total spend (red square) within which 97% of the transaction are non compliant. Another important characteristic to notice is the average dollar transaction in this segment is approx $6.7K which is much higher when compared with other clusters (refer to summary section for more information). The segment also shows that ABC Auto Sales business unit is the largest non compliance spends with Marketing and Sales as largest product categories for non compliant spend. It also identifies other attribute such as Requestor name Brian and Vendor or Supplier Starcom being responsible for largest non compliance spend in this segment. Within each cluster each dimension values are independent of other dimensions and the figure just displays the values that contribute most to a particular dimension. For example Requester name Brian may not be directly responsible for largest spend for Auto Sales business unit. Finally the advanced visibility analysis results are stored in the CAT data warehouse so that further analysis can be done using BI reporting capabilities of the tool (Cognos) where ABC Auto sales can be linked to other dimensions such as product categories or Requestor or Vendors for non-compliance spend. Once an appropriate segment is identified to improve the compliance (segment 1 in this example) we can now perform the second phase of the analytics (compliance optimization) to further narrow down to the business units and product categories that would give best ROI when raising the compliance target to 80 percent from current level of 2 percent. To execute the compliance optimization, select segment 1 and then click on “Next” button on Figure 8. Enter the optimization name (for multi scenario comparison) and select an objective (Maximize ROI while achieving a compliance target) and put the value 80 in text below as shown in the Figure 9. Click on Run Optimization button that sends the message to the compliance management component that in turns invokes appropriate web services to run the compliance optimization engine by passing the compliance objective, target and scenario name. A user can create several compliance optimization scenarios on top of single advanced visibility scenario by varying the compliance target or by providing investment limits and finally compare them on the dashboard to make informed decision.

Figure 9. Compliance Optimization Scenario Creation
The result of the optimization run is shown in the Figure 10. This is generated using Cognos Business Intelligence tool and report is divided into three sections (summary, compliance and ROI by business units and detailed ROI table). The summary view displays the total spend in the segment 1 (about $191 M) along with compliance (green box) and investment of $1.4 M required to attain the 80 percent compliance in this segment. The total potential savings that can be achieved is approx $16 M which results in the total aggregated ROI of approx 11.
Please note the bar chart which displays the original compliance and optimized compliance by appropriate business units within the segment 1. The optimization did not bring all the business units compliance to 80 percent (for example Auto Marketing and Auto Parts) or limits the compliance to 80 percent (for example Auto Vans compliance is 81%). This allocation depends upon the cost of raising compliance for each business units from their original level to optimal levels that could provide maximum savings such that entire cluster compliance is 80 percent. The optimization engine gets the appropriate input for cost and benefits attainable to move up the compliance levels by each business units and product categories. The line chart on the right displays the ROI by business units. The business units Auto Sales and Auto Truck provide highest ROI of 12.2 for this segment. The report also displays the ROI by combination of business units and product categories in case one wishes to narrow the scope of raising the compliance level For example in the figure
10 the Auto Sales business unit and Marketing & Sales product category ROI is 13.2. So if one wishes to start with limited investment then they can start with this detail report and select areas they are interested to raise compliance. (Refer to content circled with pink color in the Figure 10).
Use Case Summary
In traditional analysis Auto SUV and Van were top two non compliant business units by spend and could have been selected for compliance improvement but not necessary best selection for ROI as demonstrated by our two step compliance analytics approach. The CAT tool identified Auto Sales and Truck as optimal business units to target for compliance improvement to attain maximum ROI. Although not displayed in the Figure 10, the ROI for the ABC Auto SUV and Marketing & Sales product is about 5.5 which is much less when compare to 13.2 for business unit Auto Sales with same product category.
We mentioned in the earlier section that the average spend per transaction in the segment 1 (selected for the analytics) is about $ 6,700. This is an important observation coming out of the advanced visibility analytics engine as the compliance is typically enforced at transaction level. Hence one can treat this average spend for given business units and product category identified in segment 1 as clip level when a PO is submitted for review. Absence of such analytical driven clip level information could result into setting up of clip level based on user experience or via trial and error which could lead to either very high cost to achieve compliance or spend leakage due to transaction not being monitored.
IV. CONCLUSTION AND NEXT STEP
Business wishing to cut cost and improve the bottom line can take advantage of CAT tool to increase compliance within the procurement activities in their organization. Traditional tool do not have capability to analyze the data across several dimensions at the same time where as CAT Advanced Visibility Analytical module has capability to create clusters/segments across several dimensions with similar characteristics as discussed in the previous section along with its capability to optimize the ROI. With CAT being web based tool with user friendly work flow it is easy for organization to adopt the tool quickly. But to enable such analytics it is important that raw data is complete (all important fields are available in spend transaction) and standard data dimensions such as Vendors, Products, etc are classified [3] correctly. Such data cleansing and data classification of raw data is out of the scope of the CAT tool. We are collaborating with other groups within IBM such as Data Hub that provides such raw data quality assessment, completeness, cleansing and enrichment, etc. Such need for data classification is important when we expand CAT tools capability to analyze the spend across

several clients together and identify cross client savings opportunity such as negotiating with vendor on volume discounting, etc. We are also looking into digitizing vendor contract data (with the help of Data Hub team) which could provide additional savings opportunity (back-end rebate, better service levels, etc) by routing spend to vendors to meet the contracted spend levels.
REFERENCES
[1] “Best Practicies in Spending Analysis – Cure for Corporate Epidemic” Aberdeen Group 2004.
[2] Singh Moninder, etc, “Automated cleansing for spend analytics” Proceeding CIKM '05 Proceedings of the 14th ACM international conference on Information and knowledge management
[3] UNSPSC, The United Nations Standard Products and Services Code, http://www.unspsc.org
[4] Greenfield, Rip, “Spend Analysis: The First Step in Strategic Sourcing”, Proceedings 90th Annual International Supply Chain Conference, May 2005
[5] Bartels, Andrew, “Spend Analysis: Key App, Few Vendors” Forrester Research, July 2004
[6] Kirit Pandit and H. Marmanis “Spend Analysis -The Window into Strategic Sourcing” 2008, pp. 219-235
[7] Marina Meila and David Heckerman, “An Experimental Comparison of Several Clustering and Initialization Methods” In booktitle Machine Learning, 1998, pp. 386-395
[8] Schwarz, Gideon E. (1978). "Estimating the dimension of a model". Annals of Statistics 6 (2): 461–464