
Identification of Transportation Contributions to Urban PM Levels AQRB Mid-Term Review 2004 J.R....
16
Identification of Identification of Transportation Transportation Contributions to Urban PM Contributions to Urban PM Levels Levels AQRB Mid-Term Review 2004 J.R. Brook + many contributors MSC
-
Upload
jeffrey-smith -
Category
Documents
-
view
217 -
download
0
Transcript of Identification of Transportation Contributions to Urban PM Levels AQRB Mid-Term Review 2004 J.R....
Identification of Identification of Transportation Transportation
Contributions to Urban Contributions to Urban PMPM
LevelsLevelsAQRB Mid-Term Review 2004
J.R. Brook + many contributors
MSC
OverviewOverview• PERD 'POL' on transportation and
particulate matter.– Multiple Gov't partners
– Emphasis on organic fraction
• Continuing analysis of Toronto and Vancouver 'TSRI' daily time series of PM2.5 speciation.
– Receptor modelling
• Organic speciation of PM2.5
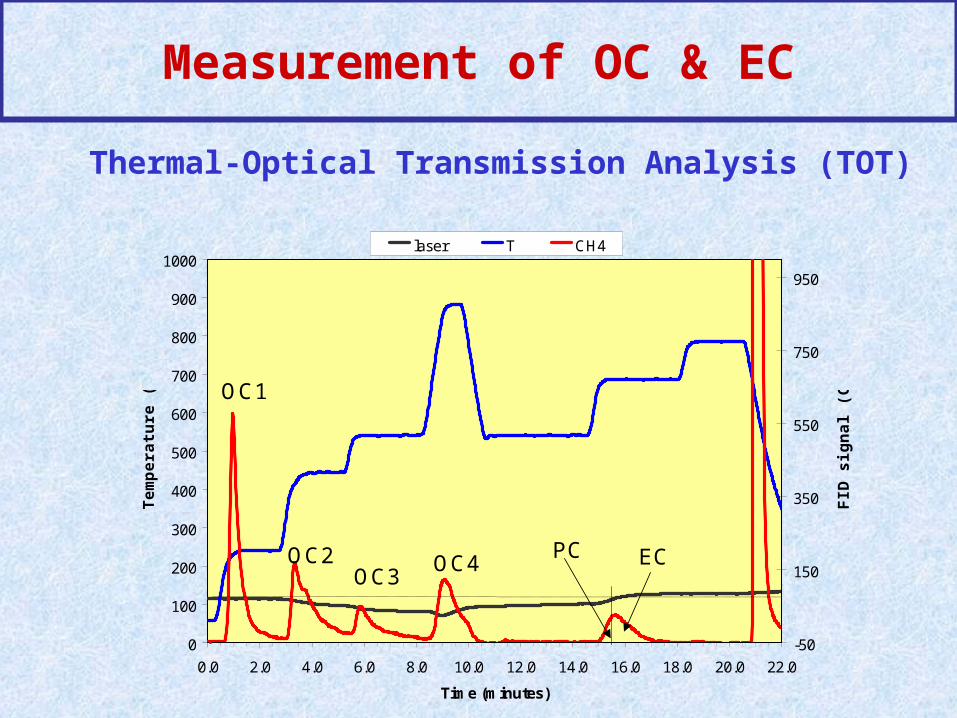
Measurement of OC & EC
0
100
200
300
400
500
600
700
800
900
1000
0.0 2.0 4.0 6.0 8.0 10.0 12.0 14.0 16.0 18.0 20.0 22.0
Time (minutes)
Tem
pe
ratu
re (
C)
-50
150
350
550
750
950
FID
sig
na
l (C
H4
)
laser T CH4
OC1
OC2OC3
ECOC4PC
Thermal-Optical Transmission Analysis (TOT)
OC & EC Measurement Uncertainties
• High OC blanks (7-15 g per filter)• Deposit non-uniformity (~10% variability)• Uncertainty in pyrolysis correction based upon
BC absorbance (laser)• SVOC
– Positive and negative artifacts
• Enhanced charring due to artifacts and blank OC
• EC biased low?
• Conversion from ‘OC’ to ‘OM’
Toronto
Vancouver0.00
0.01
0.02
0.03
0.04
0.05
0.06
0.07
0.08
0.09
0.10
2/14/00 5/24/00 9/1/00 12/10/00 3/20/01 6/28/01 10/6/01 1/14/02
0.0
0.1
0.2
0.3
0.4
0.5
0.6
0.7
0.8
0.9
1.0
0.00
0.02
0.04
0.06
0.08
0.10
0.12
0.14
2/14/00 5/24/00 9/1/00 12/10/00 3/20/01 6/28/01 10/6/01 1/14/02
0.0
0.2
0.4
0.6
0.8
1.0
1.2
Oxa
lic
(g
m-3)
Oth
er a
cid
s (
g m
-3)
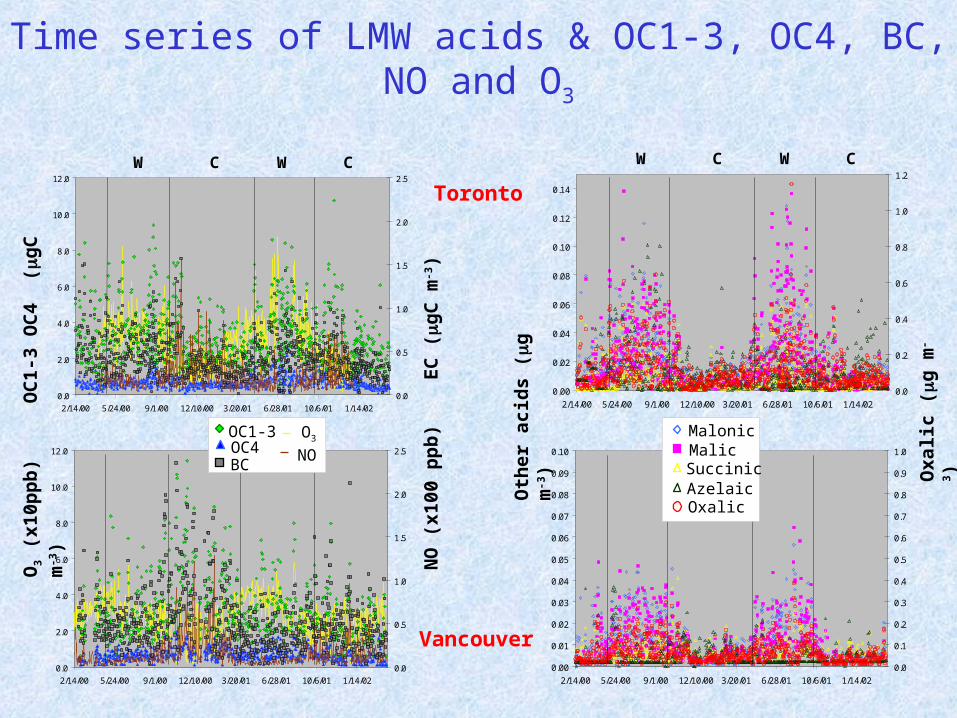
MalonicMalicSuccinicAzelaicOxalic
C WW C
0.0
2.0
4.0
6.0
8.0
10.0
12.0
2/14/00 5/24/00 9/1/00 12/10/00 3/20/01 6/28/01 10/6/01 1/14/02
0.0
0.5
1.0
1.5
2.0
2.5
0.0
2.0
4.0
6.0
8.0
10.0
12.0
2/14/00 5/24/00 9/1/00 12/10/00 3/20/01 6/28/01 10/6/01 1/14/02
0.0
0.5
1.0
1.5
2.0
2.5
NO
(x1
00 p
pb
)
EC
(g
C m
-3)
O3 (
x10p
pb
)
O
C1
-3 O
C4
(
gC
m-3)
OC1-3OC4
O3
BCNO
C WW C
Time series of LMW acids & OC1-3, OC4, BC, NO and O3
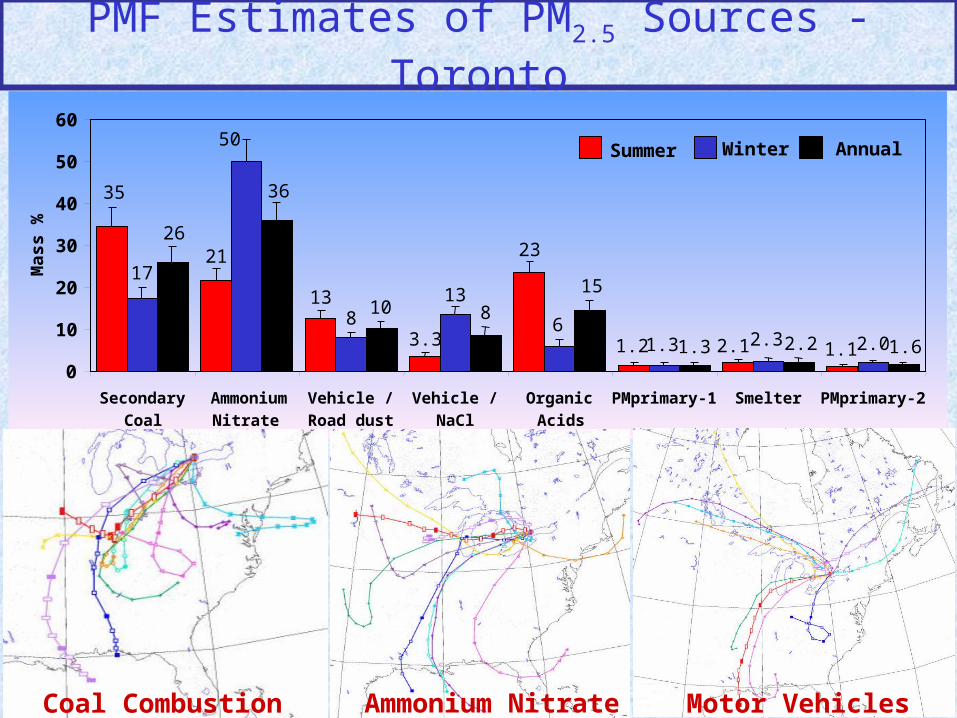
PMF Estimates of PM2.5 Sources - Toronto
1.2 1.12.1
23
13
35
21
3.3 2.31.36
2.08
17
50
13
2.2 1.61.3
15
810
26
36
0
10
20
30
40
50
60
Secondary
Coal
Ammonium
Nitrate
Vehicle /
Road dust
Vehicle /
NaCl
Organic
Acids
PMprimary-1 Smelter PMprimary-2
Mas
s %
Summer Winter Annual
Coal Combustion Ammonium Nitrate Motor Vehicles
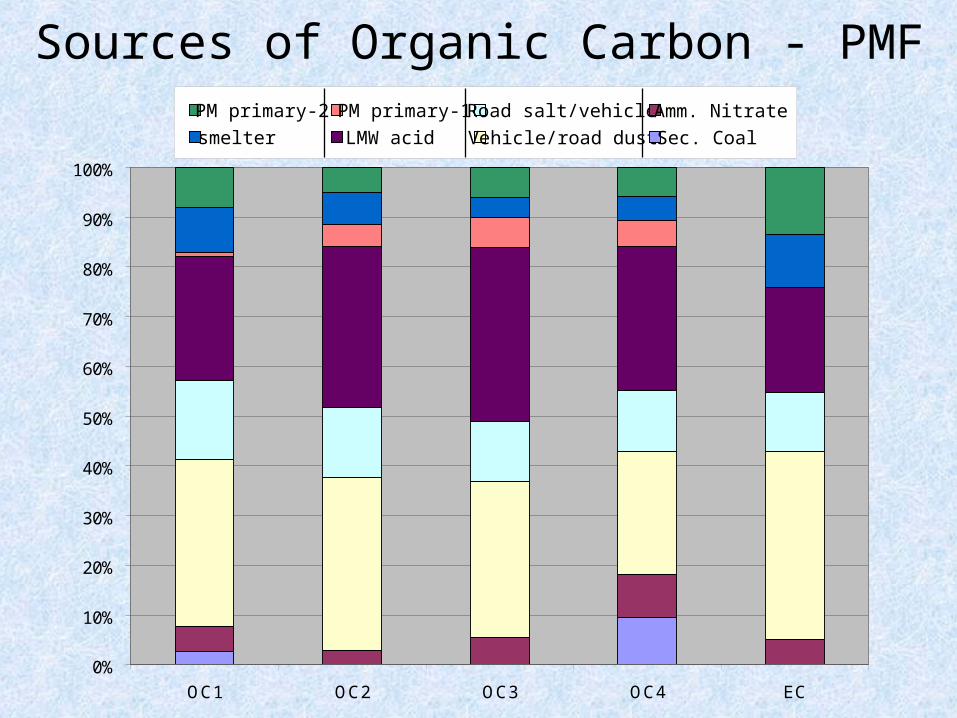
Sources of Organic Carbon - PMF
0%
10%
20%
30%
40%
50%
60%
70%
80%
90%
100%
OC1 OC2 OC3 OC4 EC
PM primary-2
smelter
PM primary-1
LMW acid
Road salt/vehicle
Vehicle/road dust
Amm. Nitrate
Sec. Coal
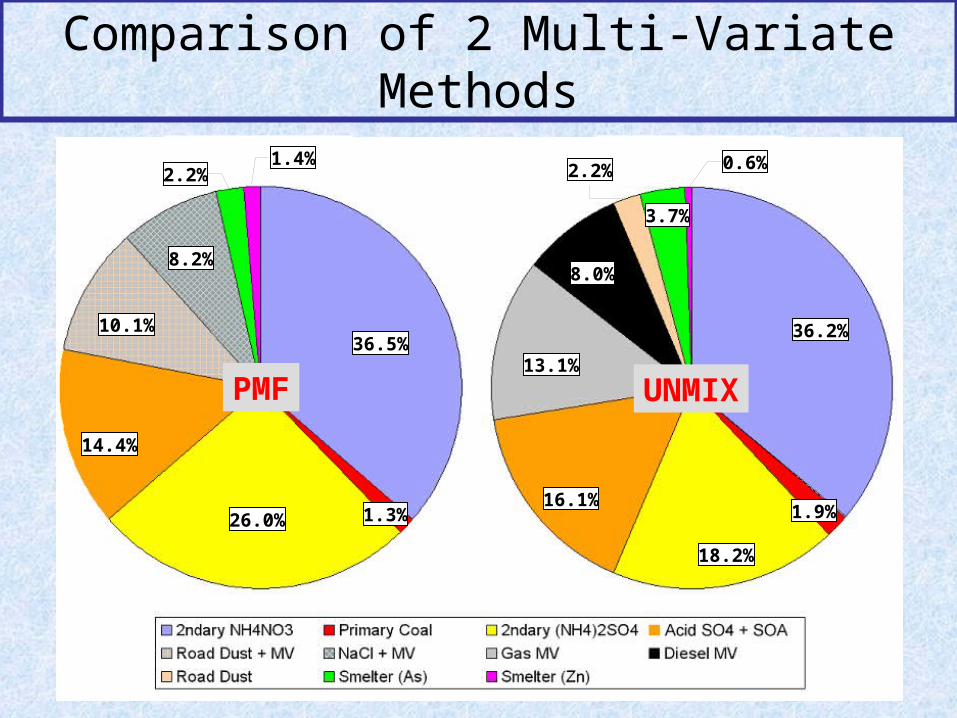
Comparison of 2 Multi-Variate Methods
1.9%
2.2% 0.6%
3.7%
13.1%
8.0%
36.2%
18.2%
16.1%
2.2%1.4%
8.2%
10.1%
14.4%
1.3%
36.5%
26.0%
PMF UNMIX
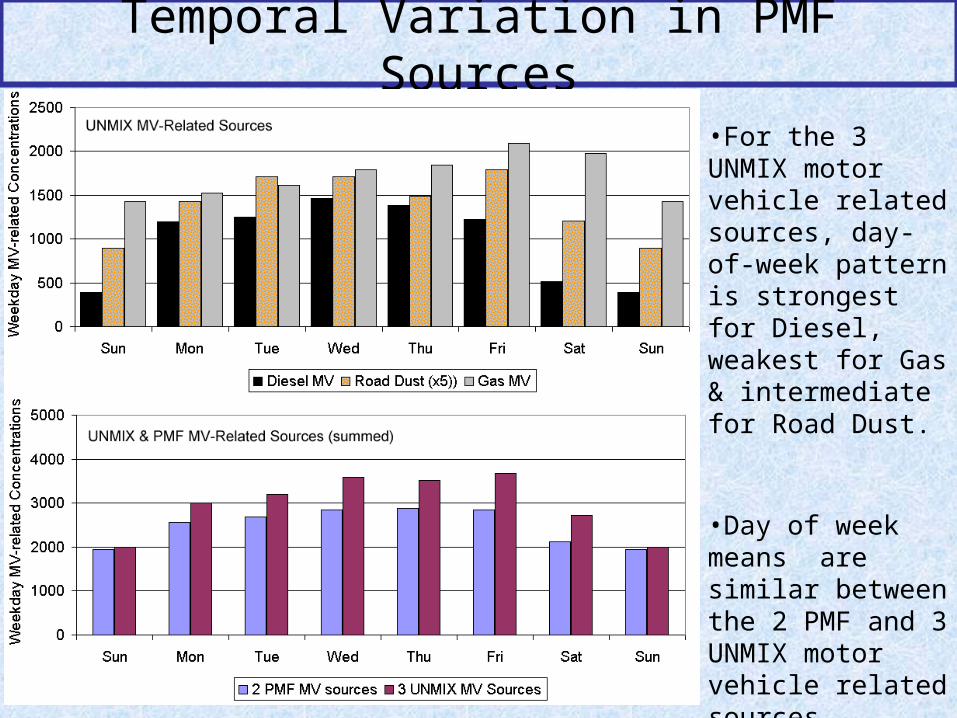
Temporal Variation in PMF Sources
•For the 3 UNMIX motor vehicle related sources, day-of-week pattern is strongest for Diesel, weakest for Gas & intermediate for Road Dust.
•Day of week means are similar between the 2 PMF and 3 UNMIX motor vehicle related sources.
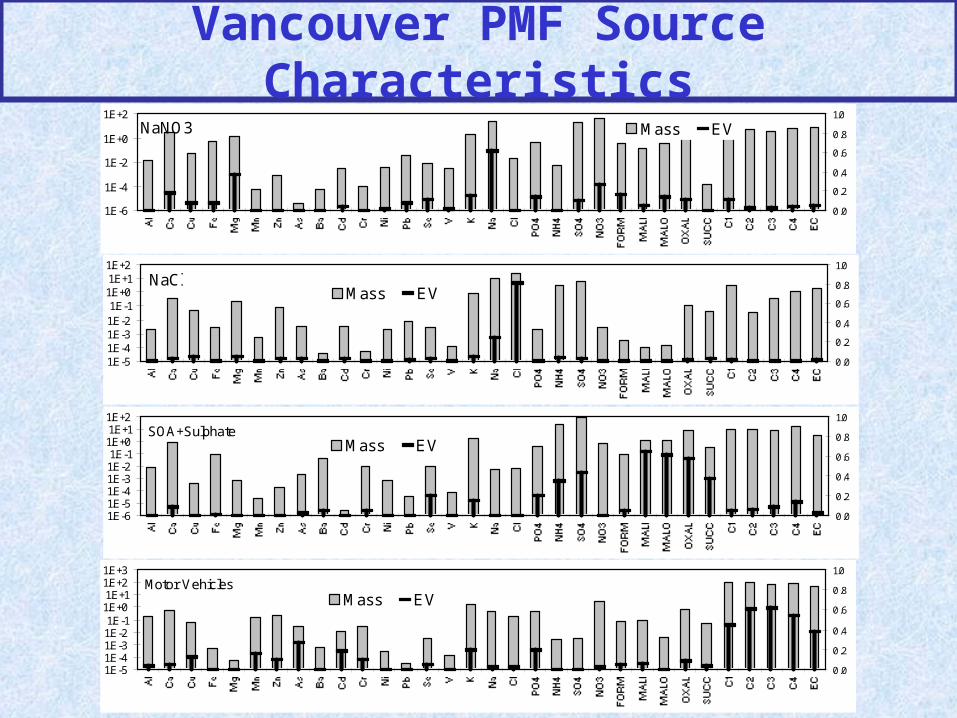
Vancouver PMF Source Characteristics
1.E-61.E-51.E-41.E-31.E-21.E-1
1.E+01.E+11.E+2
0.0
0.2
0.4
0.6
0.8
1.0
Mass EVSOA+Sulphate
1.E-51.E-41.E-31.E-21.E-1
1.E+01.E+11.E+21.E+3
0.0
0.2
0.4
0.6
0.8
1.0
Mass EVMotor Vehicles
1.E-51.E-41.E-31.E-21.E-1
1.E+01.E+11.E+2
0.0
0.2
0.4
0.6
0.8
1.0
Mass EVNaCl
1.E-6
1.E-4
1.E-2
1.E+0
1.E+2
0.0
0.2
0.4
0.6
0.8
1.0
Mass EVNaNO3
PMF Estimate of PM2.5 Sources - Vancouver
0
10
20
30
40
50
60C
rus
tal/
Al
Ni/
Cr
Pb
/As
Ba
/FO
RM
V/N
i
Na
NO
3
Na
Cl
NH
4N
O3
NH
4S
O4
/ac
id
Ve
hic
les
Summer Winter Total
% C
ontr
ibu
tion
to P
M2
.5
R2 = 0.23
0
2
4
6
8
10
12
0 2 4 6 8
R2 = 0.40
0
2
4
6
8
10
12
0 2 4 6 8 10 12
R2 = 0.78
0
2
4
6
8
10
12
14
0 5 10 15 20
R2 = 0.04
0
2
4
6
8
10
12
0 2 4 6 8
OC
1-3
(gC
m-3)
MV-PMF (g m-3) SOA-PMF (g m-3)
Van
couv
erT
oron
to
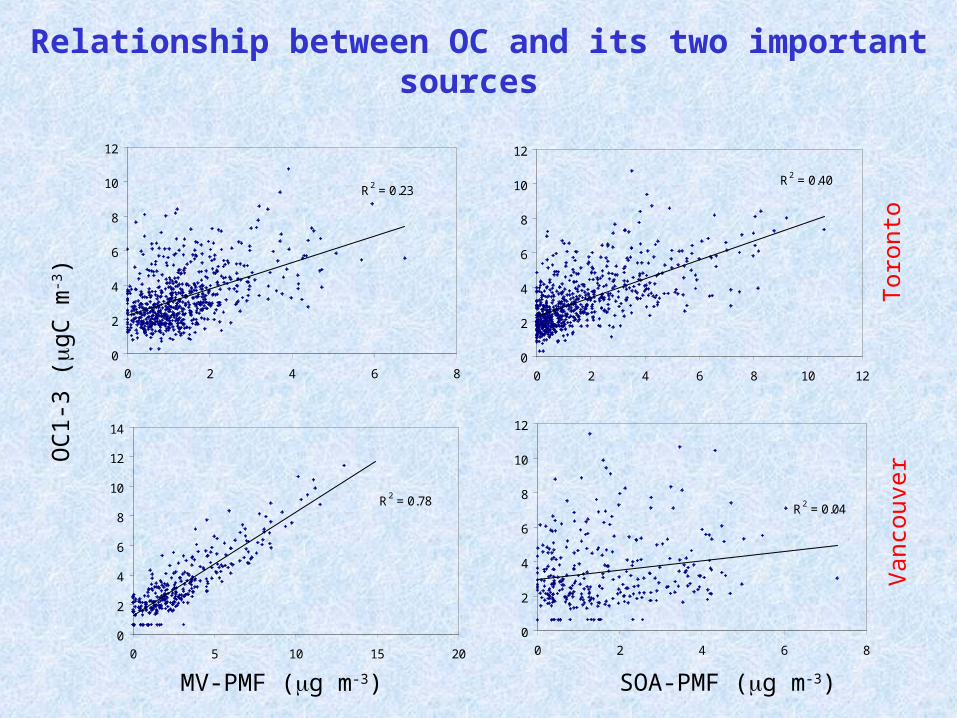
Relationship between OC and its two important sources
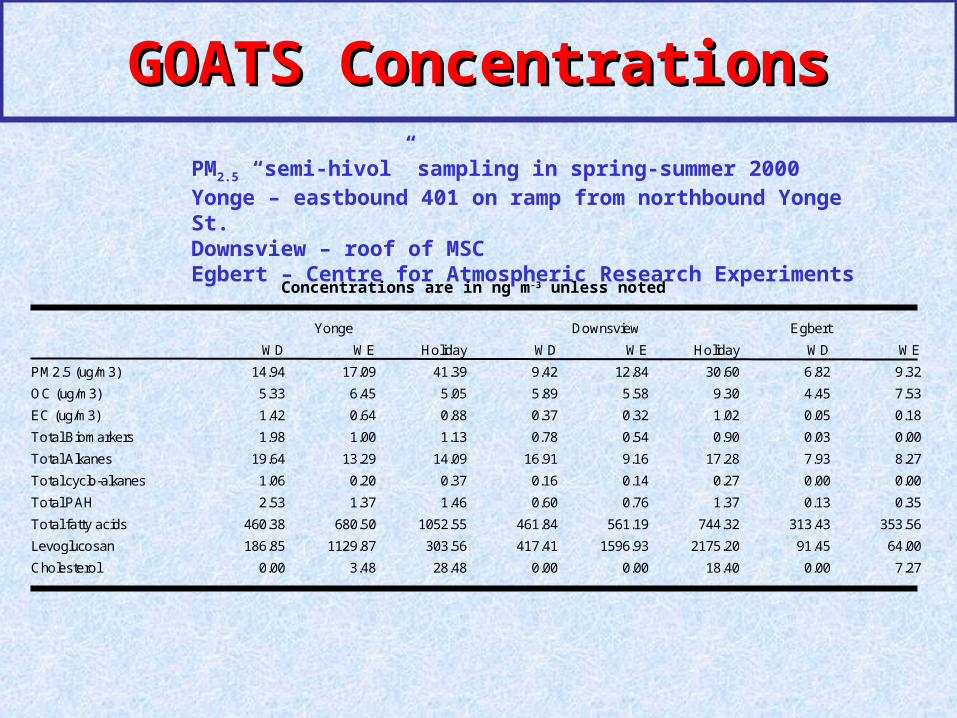
GOATS ConcentrationsGOATS Concentrations
Yonge Downsview Egbert
WD WE Holiday WD WE Holiday WD WE
PM2.5 (ug/m3) 14.94 17.09 41.39 9.42 12.84 30.60 6.82 9.32
OC (ug/m3) 5.33 6.45 5.05 5.89 5.58 9.30 4.45 7.53
EC (ug/m3) 1.42 0.64 0.88 0.37 0.32 1.02 0.05 0.18
Total Biomarkers 1.98 1.00 1.13 0.78 0.54 0.90 0.03 0.00
Total Alkanes 19.64 13.29 14.09 16.91 9.16 17.28 7.93 8.27
Total cyclo-alkanes 1.06 0.20 0.37 0.16 0.14 0.27 0.00 0.00
Total PAH 2.53 1.37 1.46 0.60 0.76 1.37 0.13 0.35
Total fatty acids 460.38 680.50 1052.55 461.84 561.19 744.32 313.43 353.56
Levoglucosan 186.85 1129.87 303.56 417.41 1596.93 2175.20 91.45 64.00
Cholesterol 0.00 3.48 28.48 0.00 0.00 18.40 0.00 7.27
Concentrations are in ng m-3 unless noted
PM2.5 “semi-hivol” sampling in spring-summer 2000Yonge – eastbound 401 on ramp from northbound Yonge St.Downsview – roof of MSCEgbert – Centre for Atmospheric Research Experiments
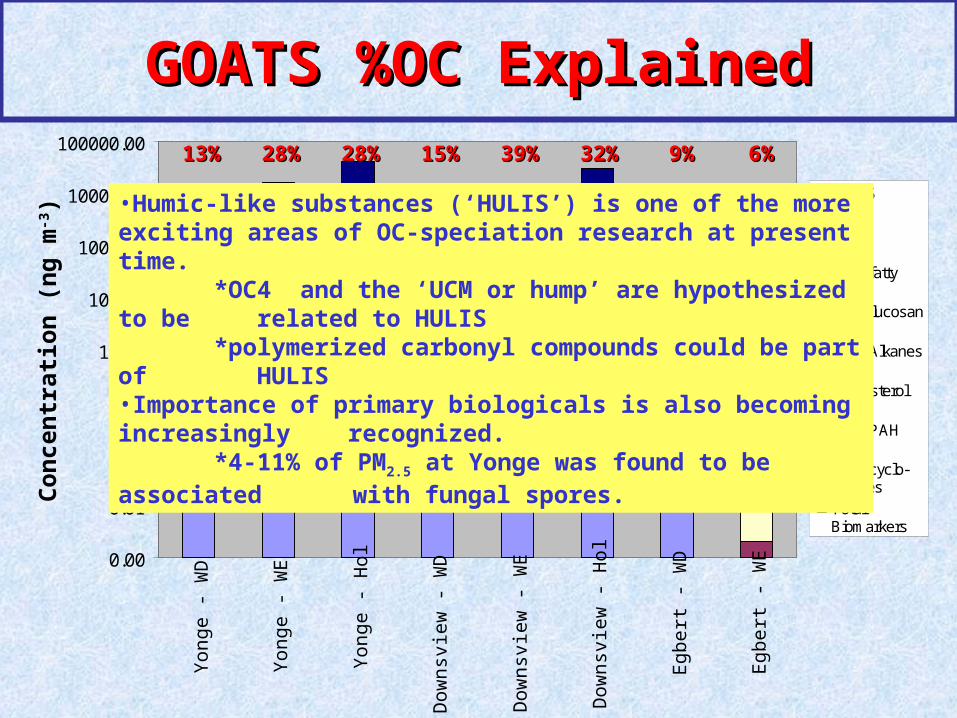
GOATS %OC ExplainedGOATS %OC ExplainedC
on
cen
trat
ion
(n
g m
-3)
0.00
0.01
0.10
1.00
10.00
100.00
1000.00
10000.00
100000.00
Yon
ge -
WD
Yon
ge -
WE
Yon
ge -
Hol
Dow
nsvi
ew -
WD
Dow
nsvi
ew -
WE
Dow
nsvi
ew -
Hol
Egb
ert -
WD
Egb
ert -
WE
PM2.5
OC
Total fattyacidsLevoglucosan
Total Alkanes
Cholesterol
Total PAH
Total cyclo-alkanesTotalBiomarkers
13%13% 28%28% 28%28% 15%15% 39%39% 32%32% 9%9% 6%6%
•Humic-like substances (‘HULIS’) is one of the more exciting areas of OC-speciation research at present time.
*OC4 and the ‘UCM or hump’ are hypothesized to be related to HULIS*polymerized carbonyl compounds could be part of HULIS
•Importance of primary biologicals is also becoming increasingly recognized.
*4-11% of PM2.5 at Yonge was found to be associated with fungal spores.
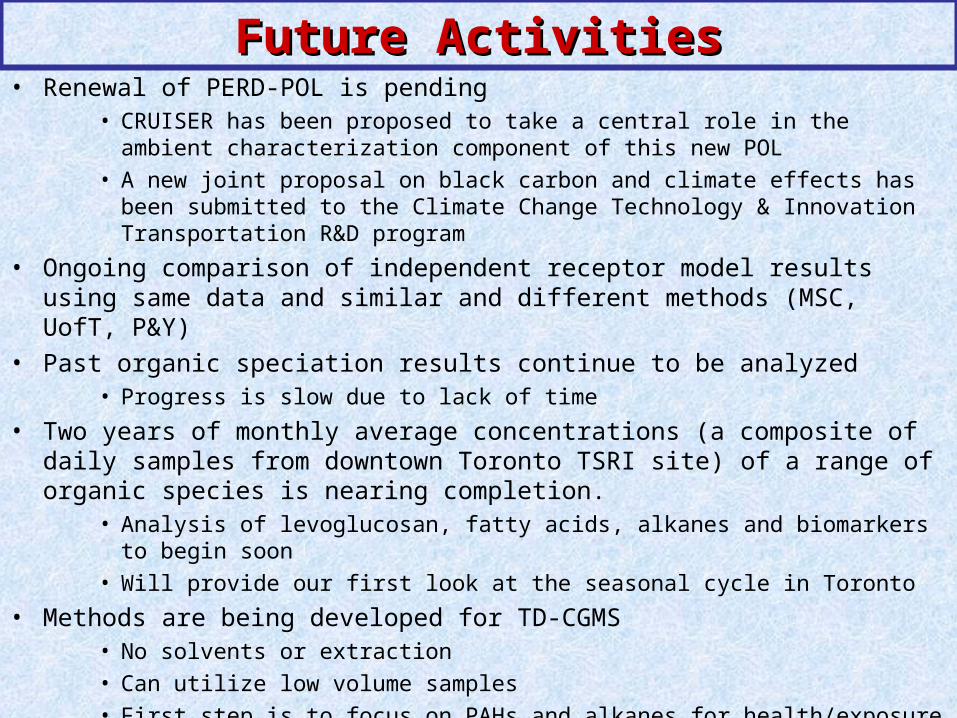
Future ActivitiesFuture Activities• Renewal of PERD-POL is pending
• CRUISER has been proposed to take a central role in the ambient characterization component of this new POL
• A new joint proposal on black carbon and climate effects has been submitted to the Climate Change Technology & Innovation Transportation R&D program
• Ongoing comparison of independent receptor model results using same data and similar and different methods (MSC, UofT, P&Y)
• Past organic speciation results continue to be analyzed• Progress is slow due to lack of time
• Two years of monthly average concentrations (a composite of daily samples from downtown Toronto TSRI site) of a range of organic species is nearing completion.
• Analysis of levoglucosan, fatty acids, alkanes and biomarkers to begin soon
• Will provide our first look at the seasonal cycle in Toronto
• Methods are being developed for TD-CGMS• No solvents or extraction
• Can utilize low volume samples
• First step is to focus on PAHs and alkanes for health/exposure studies
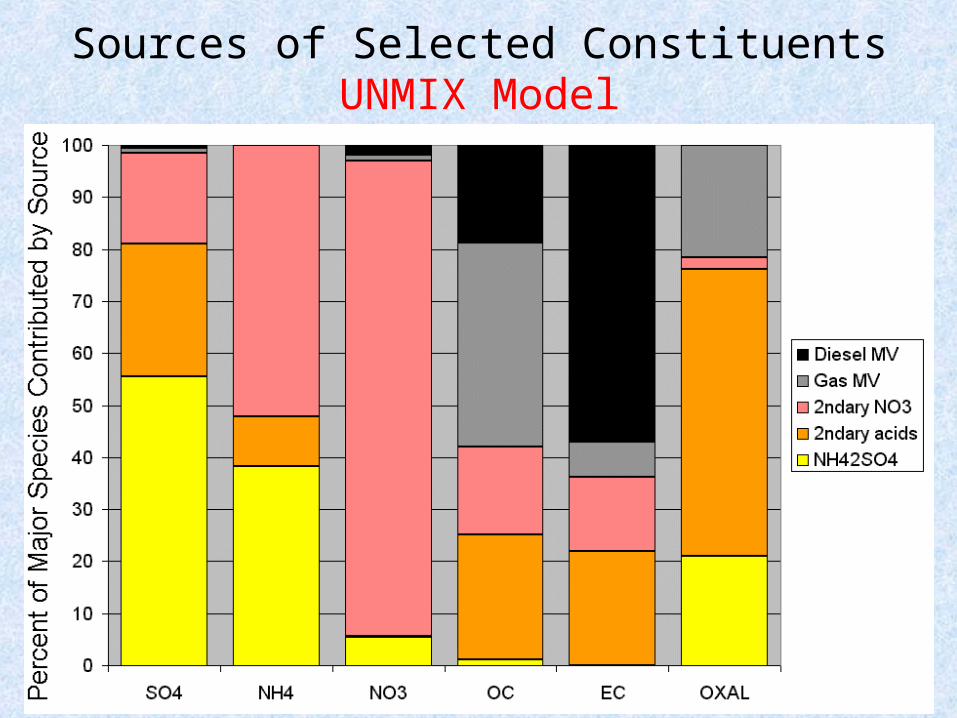
Sources of Selected ConstituentsUNMIX Model


