Identification of the grass family (Poaceae) by using the ... · Poaceae is 4th largest family of...
12
J. Bio. Env. Sci. 2016 175 | Saadullah et al. RESEARCH PAPER OPEN ACCESS Identification of the grass family (Poaceae) by using the plant dna barcodes rbcl and matK Saadullah¹ * , Zaheer-ud-din Khan¹, Muhammad Ashfaq², Zaib-u-Nisa¹ 1 Department of Botany, GC University, Lahore Pakistan 2 Biodiversity Institute Ontario (BIO), University of Guelph, Canada Article published on May 27, 2016 Key words: Poaceae DNA barcoding, Intra-specific, Inter-specific, Bootstrap value. Abstract Due to phenotypic plasticity, with few distinguishable and many overlapping characters, grasses are very difficult to identify by morphological characters, The current research evaluated how standard plant barcode rbcl and matK can help in floristic evaluation of. grasses belonging to a not well studied flora in district Dera Ghazi Khan, Punjab, Pakistan. In this study, 54 specimen belonging to 24 species of Poaceae were examined. Species wise sequencing success for rbcl and matK was 100% and 66.67% respectively. The determination of intra and inter- specific divergence and phylogentic analysis by reconstruction of neighbor joining trees were carried out. The results demonstrated that individually both rbcl and matK totally failed in discrimination of congeneric species. In neighbor joining phylogenetic analysis both rbcl and matK provided well resolved monophyletic tree with weak bootstrap threshold value. While in combination (rbcl+matK) both marker provided well resolved monophyletic tree with strong bootstrap threshold value. * Corresponding Author: Ivaylo Sirakov [email protected] Journal of Biodiversity and Environmental Sciences (JBES) ISSN: 2220-6663 (Print) 2222-3045 (Online) Vol. 8, No. 5, p. 175-186, 2016 http://www.innspub.net
Transcript of Identification of the grass family (Poaceae) by using the ... · Poaceae is 4th largest family of...

J. Bio. Env. Sci. 2016
175 | Saadullah et al.
RESEARCH PAPER OPEN ACCESS
Identification of the grass family (Poaceae) by using the plant
dna barcodes rbcl and matK
Saadullah¹*, Zaheer-ud-din Khan¹, Muhammad Ashfaq², Zaib-u-Nisa¹
1Department of Botany, GC University, Lahore Pakistan
2Biodiversity Institute Ontario (BIO), University of Guelph, Canada
Article published on May 27, 2016
Key words: Poaceae DNA barcoding, Intra-specific, Inter-specific, Bootstrap value.
Abstract
Due to phenotypic plasticity, with few distinguishable and many overlapping characters, grasses are very difficult
to identify by morphological characters, The current research evaluated how standard plant barcode rbcl and
matK can help in floristic evaluation of. grasses belonging to a not well studied flora in district Dera Ghazi Khan,
Punjab, Pakistan. In this study, 54 specimen belonging to 24 species of Poaceae were examined. Species wise
sequencing success for rbcl and matK was 100% and 66.67% respectively. The determination of intra and inter-
specific divergence and phylogentic analysis by reconstruction of neighbor joining trees were carried out. The
results demonstrated that individually both rbcl and matK totally failed in discrimination of congeneric species.
In neighbor joining phylogenetic analysis both rbcl and matK provided well resolved monophyletic tree with weak
bootstrap threshold value. While in combination (rbcl+matK) both marker provided well resolved monophyletic
tree with strong bootstrap threshold value.
*Corresponding Author: Ivaylo Sirakov [email protected]
Journal of Biodiversity and Environmental Sciences (JBES) ISSN: 2220-6663 (Print) 2222-3045 (Online)
Vol. 8, No. 5, p. 175-186, 2016
http://www.innspub.net

J. Bio. Env. Sci. 2016
176 | Saadullah et al.
Introduction
Economically Poaceae (Grass family) is a most
important family of flowering plants. Grasses make
70% of all the crops. On world level, 10000 species
belonging to 600-700 genera are reported. (Chen et
al., 2006). Poaceae is 4th largest family of flowering
plant while among monocotyledon it is at 2nd
position. There is a great diversity in poaceae and
have vital role in the survival of all organism
especially human and animals. The most abundant
plant on earth are grasses of Poaceae that are found
on all continents including Antarctica because grasses
have the unique capability to adopt to all types of
habitats on earth (Kellogg, 1998). About 492 grass
species belonging to 158 genera are reported in
Pakistan (Cope, 1982). In Pakistan, the share of
grasses towards floral biodiversity is about 9%.The
secret of universal success of grasses lies in their
simple and effective structure. Mostly their simple
structure make them very difficult to identify when
combined with large number of taxa of poaceae.
Grasses have unique structural feature that are
generally absent in all other plant species. Moreover,
terminology of poaceae is also different from other
plant families. Some time it can be very difficult to
distinguish among true grass species and cause
confusion because other plant like sedges and rushes
superficially resemble with grasses (Rinovize,1986).
Accuracy in grass species identification play a vital
role in the monitoring of grass lands habitat and in
ecological restoration projects using native
grass species. Classical taxonomic approaches have
no capability to catalog biological diversity before it
disappears. Highly trained taxonomist were required
whom can differentiate among closely related species
but few are being produced today. Now a different
approach is required for the identification of all plant
species especially grasses.
In 2003, “DNA barcoding” a way to identify species
was proposed by a canadian researcher Paul Hebert.
For species level identification, DNA barcoding makes
use of a small typical sequence of DNA which is
different among species but conserved with in species
(Hebert et al., 2003). For all land plants, two plastid
gene regions rbcl and matK were selected as the core
DNA barcodes (CBOL, Plant working Group, 2009 ).
Because of their strong phylogenetic signal both rbcl
and matK played a key role in the phylogenetic
reconstructions of land plants (Chase et al., 1993). In
all previous studies, generic and species level
identification success for both barcodes rbcl and
matK, has been reported 100% and 50-92%
respectively. With supplementary marker the
identification success by both barcodes had increased
from 70-98%. However, in all previous studies, DNA
barcoding had emerged as most effective approach
for the identification of most diverse flora.
In Pakistan, yet no significant step has been taken
towards the development of DNA based biodiversity
inventories as a result all areas are still under
collected. Primarily based on conventional botanical
sampling and identification, in Pakistan taxonomists
were able to identify a total of 6000 species that are
being degraded at a fast pace and lots of species may
face a major risk of extinction (Zabta, 2010).
The main objective of this research work was to test
the utility of DNA barcoding for the correct species
identification that were collected from district Dera
Ghazi Khan (70 38E and 30 03N), Punjab, Pakistan.
Our choice to select this study area showed a
continuous effort to assemble a comprehensive on
line digital library of DNA barcodes for local flora.
Sequence information was gathered for 2 gene
regions (rbcl and matK, ) of 24 species of Poaceae.
Materials and methods
Plant Collection and Tissue sampling
All wild plant specimen belonging to Poaceae were
collected from District Dera Ghazi Khan (70 38E and
30 03N), Punjab, Pakistan. Collection of 54
specimens representing 24 species from 20 genera
was done. Plant tissue from 54 specimens was
collected from fresh leaves and dried in silica gel at
room temperature. For tissue sampling a minimum
one and maximum six specimen from the fresh leaves

J. Bio. Env. Sci. 2016
177 | Saadullah et al.
of each collected plant specimen were taken. Every
sample of plant tissue was about 0.5 cm² in size that
was later used for DNA extraction and barcoding.
Identification of all collected specimen was done with
the help of standard taxonomic keys. As per Jain and
Rao’s, 1977 manual all herbarium specimens were
prepared and deposited as voucher specimen in Dr.
Sultan herbarium of GC University, Lahore.
DNA Extraction, Amplification and Sequencing
Under a project named “GCUDG” on BOLD,
extraction of DNA was carried out from silica gel
dried leaves at the Canadian Centre for DNA
Barcoding (CCDB). University of Guelph, Canada.
Standard protocols of Canadian Centre for DNA
barcoding (CCDB) were followed for DNA extraction
from all collected specimen (Ivanova et al., 2011).
First of all in racked sterile mini tube strips about 0.5
cm2 of dry plant tissue was added. A steel bead about
the size of 3.17 mm was placed in each tube earlier
than it was sealed with a sterile cap strip. Dried tissue
in each mini tube was grounded twice in to fine
powder by tissue Lyser (Qiagen, U.S.A.) which was
run at 28 Hz for 30 seconds. With 2x CTAB buffer,
powdered tissues were incubated for an hour at 65°C.
After incubation, DNA extraction was carried out by
semi-automated method with glass fiber filtration
(Ivanova et al., 2008).
The final concentration of the eluted DNA was 20-40
ng/μL. By following the standard protocol of CCDB,
amplifiaction of both barcodes (rbcl and matK) was
carried at Canadian Cnetre for DNA Barcoding
(CCDB). In this process of amplification of rbcl and
matK, Platinum Taq DNA polymerase (Invitrogen)
and pre-made frozen plates were used (Fazekas et al.,
2012; Kuzmina and Ivanova, 2011). As compared to
rbcl, different PCR condition were applied for matK .
With minimum concentration of primers (0.1 μM),
dNTPs (0.05 mM), and Taq polymerase (0.024 U/μL)
strong amplification of rbcl was done. Without PCR
purification, direct sequencing was enabled by 5-10x
dilution of the amplicons. The primers rbcla-F
(ATGTCACCACAAA CAGAGACTAAAGC) (Levin et
al., 2003) and rbcla-R
(GTAAAATCAAGTCCACCRCG) (Kress and Erickson
2007) were used for all rbcl analysis while the 773 bp
long matK barcode was acquired with the matK-KIM
primers, MatK- 1RKIM-f
(CCCAGTCCATCTGGAAATCTTGGTTC) and MatK-
3FKIM-r (GTACAGTACTTTTGTGTTTACGAG)
described at
http://www.ccdb.ca/CCDB_DOCS/CCDB_PrimerSet
s-plants.pdf
In order to optimize the recovery of amplicon, higher
concentration of all reagents was required for matK
primers (0.5 μM), dNTPs (0.2 mM), and Taq
polymerase (0.1 U/μL). For matK, the quality of
implicon can be improved with 10 time dilution of
DNA (2-4 ng/μL) and smaller reaction volume (7.5
μL). This approach has also reduced the cost of
reaction. Standard protocols of CCDB were used for
cycle sequencing reaction and successive clean-up.
Product were analyzed on ABI 3730 x l capillary
sequencer (Ivanova et al., 2005).
Data Analysis
By using CODONCODE aligner, assembling and
editing of sequences of both barcodes was done
(CodonCode company, Dedham, MA, U.S.A.). Under
a project name “GCUDG” detailed record of all
collected plant specimen with fully edited sequences
and original trace files of both barcode is present on
BOLD.Process IDs, PCR amplification success and
number of base pair in all sequences of matK and rbcl
are given in Table-1. For species identification,
database search against non-redundant nucleotide
database at NCBI
(www.blast.ncbi.nlm.nih.gov/Blast.cgi) was done with
BLAST (Basic Local Alignment Search Tool). Data
analysis was done by Barcode Gap Analysis and
Neighbor Joining Cluster analysis. From aligned
sequence data, for each locus in the dataset,
distribution of pairwise intra-specific and inter-
specific distances was analyzed by Barcode Gap
Analysis (Nearest Neighbor analysis) on BOLD
Systems V.3 (Ratnasingham and Hebert, 2007). For

J. Bio. Env. Sci. 2016
178 | Saadullah et al.
“Barcode Gap Analysis” K2P (Kimura 2 Parameter)
distance model and MUSCLE program was used
(Kimura, 1980; Edgar, 2004;). Among taxa, patterns
of sequence divergence were visualized by means of
neighbor-joining (NJ) cluster analysis which was
performed on MEGA6 (Tamura et al., 2013). Using
default parameters under the profile alignment
option on MEGA6, multiple sequence alignments
were performed with ClustalW (Tamura et al., 2013).
For most of the species in the data set, there were
more than one rbcl and matK sequence. In this
situation generation of consensus barcode of each
species was necessary for ‘neighbor joining’ (N/J)
cluster analysis. By using TaxonDNA 1.7.9, consensus
barcode of each species was obtained (Meier et al.,
2006).In neighbor joining (N/J) cluster analysis,
Kimura 2-Parameter (K2P) distance model was used
for the calculation of genetic distances while with 500
replicates, bootstrap support was assessed (Kimura,
1980; Felsenstein,1985; Edgar, 2004). In data
analysis, gaps on all positions and missing data were
eliminated. Species were identified on the basis of
bootstrap threshold values and monophyly.
Results and discussion
PCR amplification and Sequence recovery
The important criterion for the evaluation of barcode
efficiency is PCR amplification success and sequence
recoverability. The rbcL marker was successfully
amplified from all the samples 54/454 (24/24
species) whereas the matK marker was amplified only
from 16/54 (16/24 species) of the samples.
Table 1. List of collected plant specimen with maximum number of sequences and base pairs of both DNA
barcodes rbcl and matK.
Serial Number Process ID on BOLD Plant name Maximum Number
of Sequences
No. of Bases in matK
Barcodes
No. of Bases in rbcl Barcodes
rbcl matK
1 GCUDG024-12 Apluda mutica 1 Nil Nil 552
2 GCUDG490-13 Aristida adscensionis 1 1 522 552
3 GCUDG475-13 Arundo donax 1 1 796 552
4 GCUDG529-13 Bothriochloa ischaemum 1 1 734 552
5 GCUDG087-12 Cenchrus biflorus 5 Nil Nil 552
6 GCUDG414-13 Cenchrus ciliaris 1 1 798 552
7 GCUDG183-12 Cenchrus pennisetiformis 5 Nil Nil 552
8 GCUDG297-12 Cenchrus setigerus 4 1 781 552
9 GCUDG021-12 Cymbopogon goeringii 2 Nil Nil 552
10 GCUDG375-12 Cymbopogon jawarancusa 5 Nil Nil 552
11 GCUDG405-13 Cynodon dactylon 1 1 746 552
12 GCUDG645-13 Dichanthium annulatum 1 1 768 552
13 GCUDG411-13 Eleusine indica 1 1 819 552
14 GCUDG427-13 Enneapogon polyphyllus 1 1 818 552
15 GCUDG416-13 Eragrostis pilosa 1 1 815 552
16 GCUDG485-13 Heteropogon contortus 1 Nil Nil 516
17 GCUDG594-13 Imperata cylindrica var.
major
6 Nil Nil 552
18 GCUDG400-13 Panicum antidotale 1 1 816 552
19 GCUDG-229-12 Phalaris minor 6 Nil Nil 552
20 GCUDG234-12 Polypogon monspeliensis 5 Nil Nil 552
21 GCUDG482-13 Saccharum bengalense 5 1 735 552
22 GCUDG644-13 Setaria pumila 2 1 787 552
23 GCUDG433-13 Sorghum halepense 1 1 786 552
24 GCUDG417-13 Urochloa ramosa 1 1 805 552

J. Bio. Env. Sci. 2016
179 | Saadullah et al.
In bidirectional sequencing recovery except one all of
the PCR amplicon with 552 bp long target sequence of
rbcl mostly showed no variation in sequence but in
matK there were substantial variation in sequence
length. The aligned sequence length of matK was 522-
819 bp respectively (Table-1). Our results were similar
to previous studies in which no sequence variation
was documented in sequence length of rbcl (Kress et
al., 2005; Roy et al., 2010.) Moreover, in some
research work up to 100% PCR and sequencing
success of rbcl was reported (Zhang et al., 2012; Maia
et al., 2012).
Table 2. Minumum, maximum, mean intra and inter-specific specific values of rbcl and matK by Barcode Gap
Analysis on BOLD
Barcode Loci Minimum Maximum Mean Standard Error (SE)
rbcl Intra specific Distance 0.00 1.62 0.07 0.002
Inter specific Distance 0.00 2.54 0.62 0.025
matK Intra specif Distance 0.00 0.00 0.00 0.00
Inter specific Distance 0.00 5.78 2.00 0.125
Table 3. Mean and maximum intra-specific values of rbcl compared to the nearest neighbor distance. For e
ach species, the mean and maximum intra-specific values are compared to the nearest neighbour distance in the
table above. Where the species is a singleton, N/A is displayed for intra-specific values.
Order Family Species Mean
Intra-Sp
Max
Intra-Sp
Family of Nearest Neighbor Nearest Species Distance
to NN
Poales Poaceae Apluda mutica N/A N/A Poaceae Suaeda fruticosa 0
Poales Poaceae Aristida adscensionis N/A N/A Poaceae Heteropogon contortus 2.54
Poales Poaceae Arundo donax N/A N/A Poaceae Sorghum halepense 1.51
Poales Poaceae Bothriochloa ischaemum N/A N/A Poaceae Dichanthium annulatum 0
Poales Poaceae Cenchrus biflorus 0 0 Poaceae Cenchrus pennisetiformis 0
Poales Poaceae Cenchrus ciliaris N/A N/A Poaceae Cenchrus pennisetiformis 0
Poales Poaceae Cenchrus pennisetiformis 0 0 Poaceae Cenchrus biflorus 0
Poales Poaceae Cenchrus setigerus 0 0 Poaceae Cenchrus pennisetiformis 0
Poales Poaceae Cymbopogon goeringii 0 0 Poaceae Saccharum bengalense 0
Poales Poaceae Cymbopogon jawarancusa 0 0 Poaceae Saccharum bengalense 0
Poales Poaceae Cynodon dactylon N/A N/A Poaceae Heteropogon contortus 1.01
Poales Poaceae Dichanthium annulatum N/A N/A Poaceae Bothriochloa ischaemum 0
Poales Poaceae Eleusine indica N/A N/A Poaceae Enneapogon polyphyllus 1.51
Poales Poaceae Enneapogon polyphyllus N/A N/A Poaceae Eragrostis pilosa 1.26
Poales Poaceae Eragrostis pilosa N/A N/A Poaceae Enneapogon polyphyllus 1.26
Poales Poaceae Heteropogon contortus N/A N/A Poaceae Panicum antidotale 1.01
Poales Poaceae Imperata cylindrica var. major N/A N/A Poaceae Saccharum bengalense 0.25
Poales Poaceae Panicum antidotale N/A N/A Poaceae Heteropogon contortus 1.01
Poales Poaceae Phalaris minor 0.42 1.26 Poaceae Polypogon monspeliensis 0
Poales Poaceae Polypogon monspeliensis 0 0 Poaceae Phalaris minor 0
Poales Poaceae Saccharum bengalense 0 0 Poaceae Cymbopogon goeringii 0
Poales Poaceae Setaria pumila 0 0 Poaceae Cenchrus pennisetiformis 0
Poales Poaceae Sorghum halepense N/A N/A Poaceae Arundo donax 1.51
Poales Poaceae Urochloa ramosa N/A N/A Poaceae Heteropogon contortus 2.02
On the basis of PCR recovery, matK showed poor
performance. In 2007, Kress and Erickson, have
reported highest variation in PCR amplification
success of matK which ranged from 40% to 97%.
According to a study by Lahaye et al. in 2008, matK
showed better recovery rate which indicates that the
PCR recovery rate of matK can be improved in future.
Although, in this study no repeat sequences were
documented in matK as by Fazekas et al., in 2010,
which influenced the sequencing quality.
J. Bio. Env. Sci. 2016
180 | Saadullah et al.
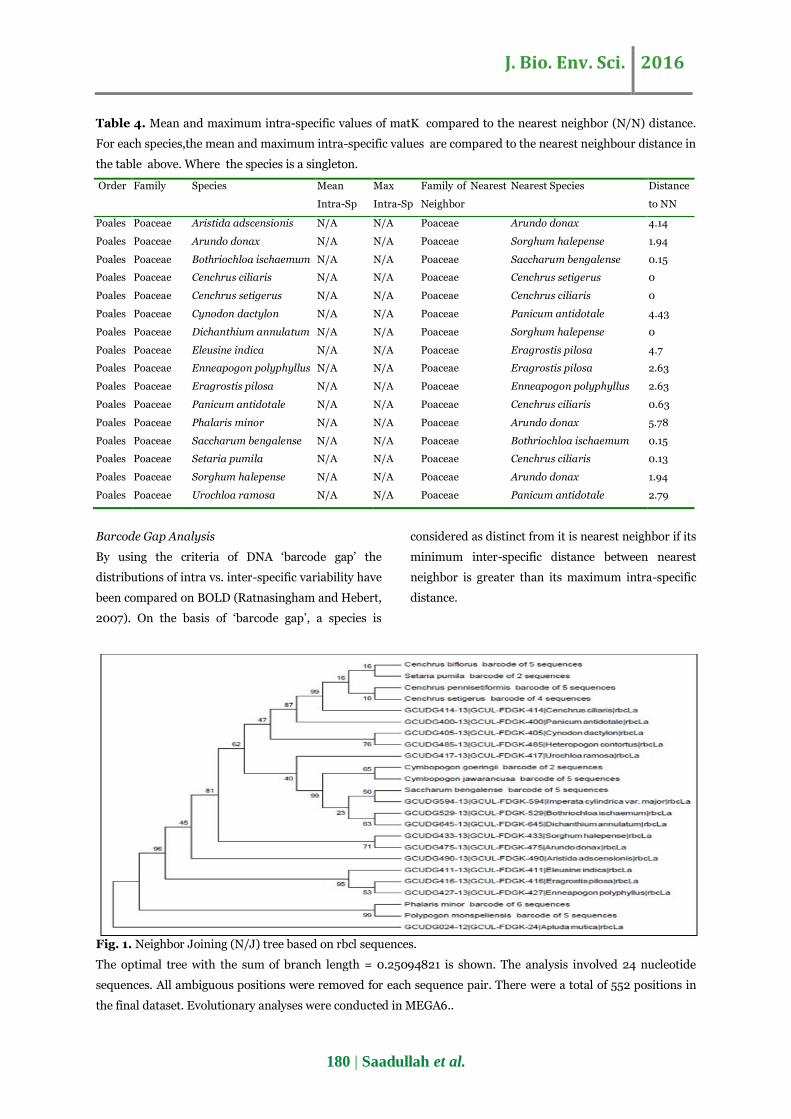
Table 4. Mean and maximum intra-specific values of matK compared to the nearest neighbor (N/N) distance.
For each species,the mean and maximum intra-specific values are compared to the nearest neighbour distance in
the table above. Where the species is a singleton.
Order Family Species Mean
Intra-Sp
Max
Intra-Sp
Family of Nearest
Neighbor
Nearest Species Distance
to NN
Poales Poaceae Aristida adscensionis N/A N/A Poaceae Arundo donax 4.14
Poales Poaceae Arundo donax N/A N/A Poaceae Sorghum halepense 1.94
Poales Poaceae Bothriochloa ischaemum N/A N/A Poaceae Saccharum bengalense 0.15
Poales Poaceae Cenchrus ciliaris N/A N/A Poaceae Cenchrus setigerus 0
Poales Poaceae Cenchrus setigerus N/A N/A Poaceae Cenchrus ciliaris 0
Poales Poaceae Cynodon dactylon N/A N/A Poaceae Panicum antidotale 4.43
Poales Poaceae Dichanthium annulatum N/A N/A Poaceae Sorghum halepense 0
Poales Poaceae Eleusine indica N/A N/A Poaceae Eragrostis pilosa 4.7
Poales Poaceae Enneapogon polyphyllus N/A N/A Poaceae Eragrostis pilosa 2.63
Poales Poaceae Eragrostis pilosa N/A N/A Poaceae Enneapogon polyphyllus 2.63
Poales Poaceae Panicum antidotale N/A N/A Poaceae Cenchrus ciliaris 0.63
Poales Poaceae Phalaris minor N/A N/A Poaceae Arundo donax 5.78
Poales Poaceae Saccharum bengalense N/A N/A Poaceae Bothriochloa ischaemum 0.15
Poales Poaceae Setaria pumila N/A N/A Poaceae Cenchrus ciliaris 0.13
Poales Poaceae Sorghum halepense N/A N/A Poaceae Arundo donax 1.94
Poales Poaceae Urochloa ramosa N/A N/A Poaceae Panicum antidotale 2.79
Barcode Gap Analysis
By using the criteria of DNA ‘barcode gap’ the
distributions of intra vs. inter-specific variability have
been compared on BOLD (Ratnasingham and Hebert,
2007). On the basis of ‘barcode gap’, a species is
considered as distinct from it is nearest neighbor if its
minimum inter-specific distance between nearest
neighbor is greater than its maximum intra-specific
distance.
Fig. 1. Neighbor Joining (N/J) tree based on rbcl sequences.
The optimal tree with the sum of branch length = 0.25094821 is shown. The analysis involved 24 nucleotide
sequences. All ambiguous positions were removed for each sequence pair. There were a total of 552 positions in
the final dataset. Evolutionary analyses were conducted in MEGA6..

J. Bio. Env. Sci. 2016
181 | Saadullah et al.
In this study, only the rbcl sequence of Phalaris
minor showed percent intra-specific divergence
ranges from 0.42% to 1.26% with mean value of 0.07
% while remaining all 23/24 species have 0.00%
intra-specific distance (Table-2 & 3). In the case of
matK, there was only one sequence for each species
so in this situation the calculation of percent intra-
specific divergence was not applicable (N/A) (Table-2
& 4). In this intra-specific distance analysis, 97.78%
sequences of rbcl demonstrated no intra-specific
variation. For rbcl inter-specific divergence varies
from 0.0% to 2.54% while 0.0% to 5.78% was
observed for matK. (Table-3 & 4). For both rbcl and
matK mean interspecific value was 0.62% and 2.00%
respectively (Table-2). In this study, six congeneric
species with rbcl sequence are included; Cenchrus
biflorus, Cenchrus ciliaris, Cenchrus pennisetiformis
Cenchrus setigerus, Cymbopogon goeringii and
Cymbopogon jawarancusa. All congeneric species
were from 2 genera Cenchrus and Cymbopogon
while 2 congeneric species Cenchrus ciliaris and
Cenchrus setigerus were from Cenchrus genus and
have both rbcl and matK.
Fig. 2. Neighbor Joining (N/J) tree based on matK sequences .
The bootstrap consensus tree inferred from 500 replicates is taken to represent the evolutionary history of the
taxa analyzed. Branches corresponding to partitions reproduced in less than 50% bootstrap replicates are
collapsed. The analysis involved 15 nucleotide sequences. All ambiguous positions were removed for each
sequence pair. There were a total of 819 positions in the final dataset.
The rbcl sequences of Cymbopogon goeringii and
Cymbopogon jawarancusa did not form congeneric
pairs with each other but their non-congeneric pairs
remained un-identified with zero percent inter
specific distance (Table-3 & 4).
Pairwise divergences among the congeneric species
were considered the ability of rbcl and matK to
distinguish the species. All congeneric species with
both the rbcl and matK sequences remained
unidentified because their sequence overlapped and
showed zero interspecific distance between one
another (Table-3&4). Generally, in closely related
congeneric species barcoding gaps are usually narrow
due to which large overlap was observed among the
rbcl sequences of congeneric species as compared to
congeneric species with matK sequences. According
to Pettengill and Neel, 2010; Fu et al., 2011; Jiang et
al., 2011 and Yang et al., 2012 in both barcodes rbcl
and matK there was no barcode gap at species level in
several plant genera.

J. Bio. Env. Sci. 2016
182 | Saadullah et al.
Fig. 3. Neighbor Joining (N/J) tree based on rbcl + matK sequences.
The bootstrap consensus tree inferred from 500 replicates is taken to represent the evolutionary history of the
taxa analyzed. Branches corresponding to partitions reproduced in less than 50% bootstrap replicates are
collapsed. The percentage of replicate trees in which the associated taxa clustered together in the bootstrap test
(500 replicates) are shown next to the branches. The analysis involved 15 nucleotide sequences. All ambiguous
positions were removed for each sequence pair. There were a total of 1371 positions in the final dataset.
Total non-congeneric species with rbcl and matK
sequences were 18/24 and 14/16 respectively. Across
all the non-congeneric species, pairwise divergence
among rbcl sequences demonstrated no clear
boundaries between all species and differentiated
only 61.11% while 92.31% species with matK
sequences were successfully differentiated (Table-
3&4). As predicted rbcl demonstrated inadequate
sequence variation to differentiate among closely
related species (Newmaster et al., 2006).
Results of this research work are somewhat similar to
the work of Zhang et al., 2012 and de Vere et al., 2012
whom have distinguished plant groups above the
species or generic levels with the help of barcode gap
and distribution of intra and interspecific distances
among species. The above results indicated that matK
showed more discriminatory power than rbcl.
Hollingsworth et al., 2011 have also reported how the
discriminatory power of matK is greater than rbcl. In
their research work, Gao et al., 2011 have also
reported that among the sequences of fabaceae, matK
demonstrated more discriminatory power than rbcl.
Neighbor Joining (N/J) Cluster Analysis
By using MEGA6, three neighbor joinig (N/J) trees
were constructed from the aligned consensus barcode
sequences of rbcl, matK and rbcl+matK (Fig -1, 2&3)
(Tamura et al., 2013). Clustering of species in the
neighbor joining tree is mostly occurred on the basis
of their genome type. This N/J method has been
followed in many floristic barcoding studies
(Kuzmina et al., 2012; Saarela et al., 2013). In this
method those species were considered to be
discriminated that are monophyletic with bootstrap
support value greater than 50% (Felsenstein, 1985).
Bootstrap evaluation with 500 replicates don’t care
how the tree is correct, its simply offers information
about the steadiness of the tree topology (the
branching order) and it helps to assess whether the
sequence information is good enough to validate the
topology (Berry and Gascuel, 1996). Kimura-2-
Parameter (K2P) model was used for the assessment
of sequence distance (Kimura, 1980). The number of
base substitutions per site were the units of sequence
distances (Tamura et al., 2013). In each tree the
bootstrap values are in the form of numbers which
J. Bio. Env. Sci. 2016
183 | Saadullah et al.
are written on each node. All three trees that were
constructed from the sequences of rbcl, matK and
rbcl+matK were best resolved monophyletic trees
(Fig-1,2&3). On the basis of bootstrap threshold
values both tree of rbcl and matK were almost failed
to identify all species. In both individual trees,
33.33% of nodes (7/21 for rbcl and 4/12 for matK)
have bootstrap values smaller than 50%. (Fig-1 & 2).
The tree constructed from the combination of rbcl
+matK have provided comparatively best resolved
tree in which out of 12 nodes 2 nodes (16.67%) have
bootstrap value smaller than 50%. (Fig--3). That bi-
locus (rbcl +matk) tree was most strongly supported
monophyletic tree because it succeeded to
discriminate 83.33% of species (Fig--3). The results
of the bi-locus rbcl+matK tree were to some extent
similar to the work of Burgess et al., 2011 whom have
reported 93% species identification success with rbcL
& matK which increased to 95% with the inclusion of
the trnH-psbA intergenic spacer.
Conclusion
In current research work standard plant DNA
barcodes, rbcL and matK was evaluated for their
discriminatory power among the species of Poaceae.
In “Barcode Gap Analysis” on BOLD, both rbcl and
matK totally failed to discriminate among congeneric
species. Among non-congeneric species maximum
pairwise divergence (92.31%) was demonstrated by
matK while rbcl was less effective. In neighbor
joining (N/J) phylogenetic analysis, individually and
in combination both rbcl and matK provided well
resolved monophyletic trees. But on the basis of
bootstrap threshold value, individually both rbcl and
matK showed poor performance while their
combination (rbcl+matK) provided well resolved tree
with strong bootstrap support. As a result, 17%
increase in overall species resolution was observed by
the combination of both barcodes (rbcl+matK). In
current research, the barcode results identified the
field specimen which were otherwise impossible to
identify by conventional morphological approach.
Acknowledgment
We thank all staff at the entomology lab, NIBGE,
Faisalabad who provided excellent conditions for our
lab work. We extend special thanks to Prof. Mehbob
and Attaullah Khan for their support and assistance
in this project.
References
Berry V, Gascuel O. 1996. Interpretation of
bootstrap trees, threshold of clade selection, and
induced gain. Molecular Biology and evolution 13,
999-1011.
Burgess KS, Fazekas AJ, Kesanakurti PR,
Graham SW, Husband BC, Newmaster SG,
Percy DM, Hajibabaei M, Barrett SCH. 2011.
Discriminating plant species in a local temperate flora
using the rbcL+matK DNA barcode. Method in
Ecology and Evolution, 2,333–340.
CBOL Plant Working Group. 2009. A DNA
barcode for land plants. Proceeding of National
Academy of Sciences USA 106, 12794–12797.
Chase MW, Fay MF. 2009. Barcoding of plants
and fungi. Science 325, 682–683
Chase MW, Soltis DE, Olmstead RG, Morgan
D, Les DH, Mishler BD, Duvall MR, Price RA,
Hills HG QIUYL, Kron KA, Rettig JH, Conti E,
Palmer JD, Manhart JR, Sytsma KJ, Michaels
HJ, Kress WJ, Karol KG, Clark WD, Hedren
M, Gaut BS, Jansen RK, Kim KJ, Wimpee CF,
Smith JF, Furnier GR, Strauss SH, Xiang QY,
Plunkett GM, Soltis PS. 1993. Phylogenetics of
seed plants, an analysis of nucleotide sequences from
the plastid gene rebel. Annals of the Missouri
Botanical Garden. 80, 528–580.
Chen SL, Sun B, Leu L, Wu Z, Lu S, Li D, Wang
Z, Zhu Z, Xia N, Wu PH, Raven, Young DY.
2006. Flora of China (Poaceae) 22. Science press,
Beijing China and Missouri Botanical Garden,
Missouri USA.

J. Bio. Env. Sci. 2016
184 | Saadullah et al.
Cope TA, Nasir E, Ali SI. 1982. Poaceae. In Flora
of Pakistan. (Eds.) Karachi, Islamabad 143, 40-678.
de Vere N, Rich TCG, Ford CR. 2012. DNA
barcoding the native flowering plants and conifers of
Wales. PLoS ONE 7, 37945.
Edgar RC. 2004. MUSCLE, multiple sequence
alignment with high accuracy and high throughput.
Nucleic Acids Research 32, 1792–1797.
Fazekas AJ, Steeves R, Newmaster SG. 2010.
Improving sequencing quality from PCR products
containing long mononucleotide repeats.
Biotechniques 48, 277–281.
Fazekas AJ, Kuzmina ML, Newmaster SG,
Hollingsworth PM. 2012. DNA barcoding methods
for land plants. Methods in Molecular Biology: In
DNA barcodes, methods and protocols 858.
Felsenstein J. 1985. Confidence limits on
phylogenies. An approach using the bootstrap.
Evolution 39, 783-791.
Fu YM, Jiang WM, Fu CX. 2011. Identification of
species within Tetrastigma (Miq.) Planch. (Vitaceae)
based on DNA barcoding techniques. Journal of
Systematics and Evolution 49, 237–245.
Gao T, Sun Z, Yao H, Song J, Zhu Y. 2011.
Identification of Fabaceae plants using the DNA
barcode matK. Planta Medica 77, 92–94.
Hebert PDN, Cywinska A, Ball SL, deWaard
JR. 2003. Biological identifications through DNA
barcodes. Proceeding of Royal Society of London,
Biological Sciences 270, 313–321.
Ivanova NV, DeWaard JR, Hajibabaei M,
Hebert PDN. 2005. Protocols for high volume DNA
barcoding.
http://www.dnabarcoding.ca/
Ivanova NV, Fazekas AJ, Hebert PDN. 2008,
Semi-automated, membrane-based protocol for DNA
isolation from plants. Plant Molecular Biology
Reporter 26,186–198.
Jain SK, Rao RR, 1977. A Handbook of Field and
Herbarium Methods. Today and Tomorrow’s Printers
& Publishers, New Delhi.
Ivanova N, Kuzmina M, Fazekas A. 2011. CCDB
Protocols. Manual Protocol Employing
Centrifugation. Glass Fiber Plate DNA Extraction
Protocol For Plants, Fungi, Echinoderms and
Mollusks.
http://www.ccdb.ca/CCDB_DOCS/CCDB_DNA_Ext
raction-Plants.pdf
Jiang YC, Ding L, Zhang R, Yang,Y, Zhou,
Tang L. 2011. Identification of the genus
Epimedium with DNA barcodes. Journal of Medicinal
Plants Research 5, 6413–6417.
Kelly LJ, Ameka GK, Chase MW. 2010. DNA
barcoding of African Podostemaceae (river-weeds), a
test of proposed barcode regions. Taxon 59, 251–260.
Kimura M. 1980. A simple method for estimating
evolutionary rates of base substitutions through
comparative studies of nucleotide sequences. Journal
of molecular evolution 16, 111-120.
Kress WJ, Wurdack KJ, Zimmer EA, Weigt
LA, Janzen DH. 2005 Use of DNA barcodes to
identify flowering plants. Proceeding of the National
Academy of Sciences USA 102, 8369–8374.
Kress WJ, Erickson DL. 2007. A two-locus global
DNA barcode for land plants: the coding rbcl gene
complements the non-coding trnH-psbA spacer
region. PLoS ONE 2, 508.
Kress WJ, Erickson DL, Swenson NG. 2010.
Advances in the use of DNA barcodes to build a
community phylogeny for tropical trees in a Puerto

J. Bio. Env. Sci. 2016
185 | Saadullah et al.
Rican Forest Dynamics Plot. PLoS ONE 5,15409.
Kuzmina M, Ivanova N. 2011 PCR Amplification
for Plants and Fungi.
http://www.ccdb.ca/CCDB_DOCS/CCDB_Amplificat
ion-Plants.pdf
Kuzmina ML, Johnson K, Barron HR, Hebert
PDN. 2012. Identification of the vascular plants of
Churchill, Manitoba, using a DNA barcode library.
BioMed Central Ecology 12, 25.
Lahaye RM, Van der Bank, Bogari. 2008. DNA
barcoding the floras of biodiversity hotspots.
Proceeding of the National Academy of Science USA
105, 2923–2928.
Levin RA, Wagner W, Hoch PC. 2003. Family-
level relationships of Onagraceae based on
chloroplast rbcl and ndhF data. American Journal of
Botany 90, 107–115.
Liu J, Moller M, Gao LM, Zhang DQ, Li DZ.
2011. DNA barcoding for the discrimination of
Eurasian yews (Taxus L., Taxaceae) and the discovery
of cryptic species. Molecular Ecology Resources 11,
89–100.
Maia VH, Mata CS, Franco LO, Cardoso MA,
Cardoso SRS. 2012. DNA barcoding Bromeliaceae:
achievements and pitfalls. PLoS ONE 7(1), 29877.
Meier R, Shiyang K, Vaidya G, Peter KLN.
2006. DNA Barcoding and taxonomy in Diptera, a
tale of high intraspecific variability and low
identification success. Syst Biol 55, 715–728.
Newmaster SG, Fazekas AJ, Ragupathy S.
2006. DNA barcoding in land plants: Evaluation of
rbcl in a multigene tiered approach. Canadian
Journal of Botany 84, 335–441.
Newmaster SG, Ragupathy S. 2009. Testing plant
barcoding in a sister species complex of pantropical
Acacia (Mimosoideae, Fabaceae).Molecular Ecology
Resource 9, 172–180.
Peter Hollingsworth M, Sean Graham W,
Damon Little P. 2011. Choosing and Using a Plant
DNA Barcode. PLoS ONE 6(5), 19254.
Pettengill JB, Neel MC. 2010. An evaluation of
candidate plant DNA barcodes and assignment
methods in diagnosing 29 species in the genus
Agalinis (Orobanchaceae). American Journal of
Botany 97, 1391–1406.
Ratnasingham S, Hebert PDN. 2007. BOLD, The
Barcode of Life Data System (www.barcodinglife.org).
Mol. Ecol. Notes 7, 355–364.
Roy S, Tyagi A, Shukla V, Kumar A, Singh
UM. 2010. Universal plant DNA barcode loci may
not work in complex groups: A case study with Indian
Berberis Species. PLoS ONE 5(10), 13674.
Ren BQ, Xiang XG, Chen ZD. 2010. Species
identification of Alnus (Betulaceae) using nrDNA and
cpDNA genetic markers. Molecular Ecology
Resources 10, 594–605.
Rinovize SA. 1986. A survey of leaf blade Anatomy
in Grasses VIII. Kew Bull 41, 323-338.
Saarela JM, Sokoloff PC, Gillespie LJ,
Consaul LL, Bull RD. 2013. DNA barcoding the a
Canadian Arctic Flora: core plastid barcodes
(rbcl+matK) for 490 Vascular Plant Species. PLoS
ONE 8, 36.
Spooner DM. 2009. DNA barcoding will frequently
fail in complicated groups: an example in wild
potatoes. American Journal of Botany 96, 1177–1189.
Starr JR, Naczi RFC, Chouinard BN. 2009.
Plant DNA barcodes and species resolution in sedges
(Carex, Cyperaceae). Moecular Ecology Resources 9,
151–163.

J. Bio. Env. Sci. 2016
186 | Saadullah et al.
Tamura K, Stecher G, Peterson D, Filipski A,
Kumar S. 2013. MEGA6, Molecular Evolutionary
Genetics Analysis version 6.0. Molecular Biology and
Evolution 30, 2725-2729
Pettengill J.B, Neel MC. 2010. An evaluation of
candidate plant DNA barcodes and assignment
methods in diagnosing 29 species in the genus
Agalinis (Orobanchaceae). American Journal of
Botany 97, 1391–1406.
Roy S, Tyagi A, Shukla V, Kumar A, Singh
UM. 2010. Universal plant DNA barcode loci may
not work in complex groups: A case study with Indian
Berberis Species. PLoS ONE 5(10), 13674.
Yang JB, Wang YP, Moller M, Gao LM, Wu D.
2012. Applying plant DNA barcodes to identify
species of Parnassia (Parnassiaceae). Moecular
Ecology Resources 12, 267–275.
Zabta Shinwari K. 2010. Medicinal plants research
in Pakistan. Journal of Medicinal Plants Research
4(3),161-176.
Zhang CY, Wang FY, Yan HF, Hao G, Hu CM.
2012. Testing DNA barcoding in closely related
groups of Lysimachia L. (Myrsinaceae). Molecular
Ecology Resources 12, 98–108.