Identification of Principal Factors of Fabric Aesthetics ...
23
Identification of Principal Factors of Fabric Aesthetics by the Evaluation of Experts on Textile and Untrained Consumers Hiroyuki Kanai 1 , Faculty of Textile Science and Technology, Shinshu University, Nagano 386-8567, Japan Mika Morishima, International Young Researchers Empowerment Center, Shinshu University, Nagano 386-8567, Japan Kentaro Nasu, and Toyonori Nishimatsu Faculty of Textile Science and Technology, Shinshu University, Nagano 386-8567, Japan Kiyohiro Shibata AOKI Inc., Kanagawa 224-8688, Japan Toshio Matsuoka Mie Prefecture Industrial Research Institute, Mie 514-0819, Japan brought to you by CORE View metadata, citation and similar papers at core.ac.uk provided by Shinshu University Institutional Repository
Transcript of Identification of Principal Factors of Fabric Aesthetics ...

Identification of Principal Factors of Fabric Aesthetics by the Evaluation of Experts on
Textile and Untrained Consumers
Hiroyuki Kanai1,
Faculty of Textile Science and Technology, Shinshu University, Nagano 386-8567, Japan
Mika Morishima,
International Young Researchers Empowerment Center, Shinshu University, Nagano
386-8567, Japan
Kentaro Nasu, and Toyonori Nishimatsu
Faculty of Textile Science and Technology, Shinshu University, Nagano 386-8567, Japan
Kiyohiro Shibata
AOKI Inc., Kanagawa 224-8688, Japan
Toshio Matsuoka
Mie Prefecture Industrial Research Institute, Mie 514-0819, Japan
brought to you by COREView metadata, citation and similar papers at core.ac.uk
provided by Shinshu University Institutional Repository

Abstract
One of the important end-use performance measures of fabrics and other textile
products is the handle, which measures the quality of fabrics as evaluated by reactions
obtained not only tactilely but also visually. The well-known Kawabata Evaluation
System (KES) includes both an objective evaluation and a prediction method of the
handle. However, objective evaluations of the handle based on a visual perception of
fabric aesthetics have not been investigated systematically. Thus, as the first step of a
systematic study, we attempted to carry out a sensory evaluation of fabric aesthetics by
experts on textile and untrained consumers using worsted and spun silk woven fabrics,
which have different material effect and structural effect. Thereafter, the mean
preference scores were examined by factor analysis to identify the principal factors of
fabric aesthetics. From the result, it was found that two common factors––“Luster and
depth sensation” and “Surface roughness sensation”––were identified tentatively as the
principal factors of fabric aesthetics.
Key words: Fabric aesthetics, Principal factor, Sensory evaluation, Factor analysis,
Material effect, Structural effect

1. Introduction
Based on the analysis of the Establishment and Enterprise Census [1], a survey
conducted every 5 years by the Ministry of Internal Affairs and Communications
(MIAC) of Japan, the numbers of establishments and employees in the Japanese textile
industry have been decreasing almost 30% every 5 years since 1996. The decrease in the
number of skilled technicians, who are important to the quality maintenance of textile
products, is an especially serious problem. Hence, there is a strong need for a technology
that can contribute to the quality maintenance of textile products.
The Kawabata evaluation system (KES) is one technology aimed at improving the
quality of textile products. Kawabata et al. [2] developed a measurement system for
dynamic properties of woven fabrics (i.e., the tensile, shear, bending, compression and
the friction properties), and proposed a characterization method as a means of
estimating the hand property by evaluation of the reactions obtained from tactile
perception. The estimation technique of the sensory-based, subjective hand property
using physical properties contributes to the clarification of quality control standards
and the promotion of efficiency in the development process of new products.
However, a consumer’s impression of a woven fabric is influenced by not only the hand
property perceived tactilely, but also the aesthetic properties perceived visually. Hence,
designers at production companies and technicians at fabric manufacturers must have
detailed meetings on the fabric aesthetics at an early stage of the manufacturing
development process. Technicians produce a fabric by trial and error and then confirm
that the fabric satisfies the requirement of the designer. This process increases of
development cost of new woven fabrics.
In spite of its importance in the actual manufacturing process, the systematic study on
fabric aesthetics has been quite few by comparison with study on fabric handle.
Howorth et. al. [3] attempted to obtain the adjectives that affect the fabric handle

using multiple factor analysis, and identified tentatively as smoothness, stiffness and
thickness. Similarly, Kawabata [2] also suggested four adjectives as smoothness,
stiffness, crispness, fullness and softness. Based on this report, these adjectives are
prescribed as principal factors which affect the fabric handle in Japanese industrial
standards [4].
As one of a few study on fabric aesthetics, Brand [5] considered fabric aesthetics as a
relationship among a minimum of six concepts (i.e., Style, Body, Cover, Surface texture,
Drape, and Resilience). Hoffman [6] suggested 36 effective adjectives representing a
good or bad fabric aesthetics for subjective evaluation. Binns [7] focused on the problem
involved in judgment according to the attribute of persons, and compared among
experts in the textile trade, untrained adults and children on the quality judgment of
wool fibers.
There are some extensive theoretical and practical investigation for defining and
measuring the fabric aesthetics. Nevertheless, fabric aesthetics has not been defined in
a standard way, because the principal factors that determine fabric aesthetics have not
been identified.
Thus, as a first step in a systematic study, we have attempted to carry out a sensory
evaluation of fabric aesthetics by groups of experts on textile industry and untrained
consumers using worsted and spun silk woven fabrics, which have different material
effect and structural effect. Thereafter, factor analysis has been applied to the mean
preference scores to identify the principal factors of fabric aesthetics. Furthermore, the
differences in evaluation between the two tester groups have been investigated.

2. Samples
Six samples were woven experimentally in three different weaves––plain, twill, and
satin––using worsted and spun silk yarn. The yarn count of worsted and spun silk yarn
are both 16.7×2 tex. The weave density is 60 ends and 55 picks per 2.54 cm on the plain,
90 ends and 70 picks per 2.54 cm on the twill, 110 ends and 65 picks per 2.54 cm on the
satin. These samples were dyed black with a reactive dye and a mordant dye in order
that the black color was similar between samples. The color of the samples (i.e., L*a*b*,
as prescribed by CIE [8]) was measured with five specimens for each sample by a
colorimeter (KONICA MINOLTA CR-400), as shown in Figure 1. As the differences of
the value, the hue and the chroma of six woven fabrics were quite low, the samples were
judged to be the same color.
(a) L* (value) (b) Color difference in a* b* space
Figure 1. Result of L*a*b* measurement of samples
20
10
2
0
4
6
8
12
14
16
18
22
24
L*
(val
ue)
0 5-5
-5
5Plain (silk)Twill (silk)Satin (silk)Plain (worsted)Twill (worsted)Satin (worsted)
- b* (blue)
+a* (red)
-a*
(gre
en)
+ b* (yellow)
4321-1-2-3-4-1
-2
-3
-4
4
3
2
1

3.Experimental
3.1 Persons
Nine Japanese individuals skilled in color inspection of fabrics were recruited as
experts on textile industry (hereinafter referred to as the “experts”). Color inspection is
one of the fabric inspection steps in the dyeing process. The inspectors judge the
agreement between a color in a color table and the color of a dyed fabric. The experts
consisted of five men and four women. Their experience as inspectors was between 5
and 25 years. Twenty untrained Japanese individuals were recruited as the untrained
consumers (hereinafter referred to as the “consumers”). The consumers consisted of 20
male university students, aged 20 to 29, all in their twenties.
3.2 Sensory evaluation
Sensory evaluation is a method for assigning a score according to the impression
obtained from a fabric sample using several adjectives with a prescribed scale. Nakaya’s
paired comparison method [9] was applied. The persons evaluated fifteen paired
specimens, consisting of pairs of the six samples (i.e., 6C2), by only visual sensation
using 26 adjectives referred to in conventional studies [5-6, 10] on a 5-point scale (e.g.,
+2 pt: specimen A is much rougher, +1 pt: specimen A is slightly rougher, 0 pt: neither, -1
pt: specimen B is slightly rougher, -2 pt: specimen B is much rougher). As described
below, these adjectives were classified into sub categories as “Luster”, “Depth of dyeing”,
“Roughness”, “Handling” and “Preference”. Where the 6 adjectives relate to the
“Handling” are the impressions that arise when fabrics are touched, squeezed, rubbed.
But in this study, the persons predicted and judged these evaluations by only the sense
of sight. In contrast, other adjectives relate to “Luster”, “Depth of dyeing”, “Roughness”
and “Preference” are the impressions that arise when fabrics are observed visually.
Where the adjectives relate to the “Preference” are the inclusive impression obtained

not only tactilely but also visually in general. But in this study, the evaluation was
carried out by only sense of sight.
A sample stand was illuminated by a CIE standard light source unit with standard
illuminant D65 (manufactured by Intec) at an angle of 30 with respect to the horizontal.
Consequently, the angle of the incidence was set to 30. The sitting heights of the testers
were set to give angles of observation of 0°. The observation distance between the
position of person’s eyes and sample stand was about 70 5 cm.
The 200-milimeter-square specimen was set so that the warp yarn was aligned
vertically with the sample stand. Illuminance perpendicular to the horizontal plane at
the center of the sample stand was 1446 98 lx. To remove the influence of tactile
perception on the evaluation, the persons were given instructions not to touch the
samples. The experiment room was maintained at 23 3C, and 50 4%R.H. .
(1) Adjectives related to “Luster” (5 words)
“Glossy”, “Rich (with respect to highlights)”, “Garish”, “Glittery”, and “Shiny
(2) Adjectives related to “Depth of dyeing” (6 words)
“Deep”, “Dark”, “Regular (with respect to contrast)”, “Vivid”, “Red”, and “Blue”
(3) Adjectives related to “Roughness” (4 words)
“Rough”, “Fine”, “Smooth”, and “Sleek”
(4) Adjectives related to “Handling” (6 words)
“Soft”, “Sandy-looking”, “Damp-looking”, “Light”, “Full”, and “NUMERI *”
(5) Adjectives related to “Preference” (5 words)
“High-class”, “Delicate”, “Elegant”, “Beautiful” and “Composed”
*“NUMERI” represents a response to factors such as smoothness, flexibility, and
softness obtained from the tactile perception of a fine worsted fabric [11].

4. Results and Discussion
4.1 Coefficient of consistency
In the sensory evaluation, the evaluation of the persons is based on individual criteria,
which are subjective and often ambiguous. In cases in which evaluation criterions are
vague, the evaluation of individuals may not be consistent. Hence, the extent of the
consistency of the evaluation of individuals was investigated in this study by calculating
the “coefficient of consistency” () [9] using equation 1.
Where "d" is the circular triad. Suppose there are three samples A1, A2 and A3 among
which the comparisons are to be made. An inconsistency for this triad occurs if "A1 is
superior to A2", "A2 is superior to A3", "A3 is superior to A1". Such a triad is called a
circular triad.
Thereafter, within the groups of testers, the mean values of the coefficients of
consistency (.adjeach
Group ) were calculated for each adjective using equation 2 (cf. Figure 2).
As shown in Figure 2, the mean value of coefficient of consistency for each adjective
was over 0.88 (i.e., 88.0.
exp adjeach
erts in the experts and over 0.83 (i.e., 83.0.
adjeach
Consumers )
in the consumers. Thus, significant consistency of the evaluations was observed in both
groups (Significance Level (S.L.) = 0.10). In particular, the mean value of the evaluation
of five adjectives related to “Luster” and that of six adjectives related to “Dyeing depth”
were 93.0.
Lusterofadj
Consumers and 93.0.
dyeingofDepthofadj
Consumer in the consumers and (indicating
a superior consistency) 98.0.
exp Lusterofadj
erts and 97.0.
exp dyeingofDepthofadj
erts in the experts.
From these results, it was concluded that persons in the experts evaluated fabric
aesthetics based on a precise criterion.
)1(4
241
3.
kk
dadjperson

d: number of circular triads[9]
k: number of samples
)2(1.
...
. n
n
sub
adjsubadj
group
n: number of persons (experts: n = 9, consumers: n = 20)
Figure 2. Mean value of coefficient of consistency in both groups
0
0.2
0.4
0.6
0.8
1
Glo
ssy
Gar
ish
Ric
hSh
iny
Glit
tery
Dee
pD
ark
Reg
ular
Blu
eR
edV
ivid
Rou
ghFi
neSm
ooth
Slee
k
Soft
Dam
p-lo
okin
gFu
llN
UM
ER
ISa
ndy-
look
ing
Lig
ht
Hig
h-cl
ass
Ele
gant
Bea
utif
ulD
elic
ate
Com
pose
d
Coe
ffic
ient
of
cons
iste
ncy
()
Adj. related to ‘Preference’Adj. related to ‘Luster’Adj. related to ‘Depth of dyeing’Adj. related to ‘Roughness’
Adj. related to ‘Handling’
NU
ME
RI
Skilled testers
Consumer testers

4.2 Coefficient of agreement
As mentioned above, the persons in both groups showed significant consistency in their
evaluations. It is also necessary to analyze the agreement of the criterion among the
individuals in each group. Consequently, the coefficient of agreement () [9] was
calculated for each adjective using equation 3. The significance on coefficient of
agreement was investigated statistically. From the result, the coefficient of agreement
on all adjectives reached significance level (S.L. = 0.01) in both groups.
Furthermore the difference of coefficients of agreement among the experts and
consumers was analyzed using the t-test whether the difference of the coefficient of
agreement statistically reach the significance level. 15 numbers of the coefficient of
agreement were calculated with score of each comparison pair of sample (i.e. k where
"k" was the number from 1 to 15). Then the difference of the mean value of the
coefficient of agreement ( k = ) between the experts and consumers were assessed by
the parametric independent t-test as shown in Table1. From the result, the mean value
( k ) of coefficients of agreement on each comparison pair of samples and the significant
differences (S.L. = 0.01 ‘**’, S.L. = 0.05 ‘*’) were shown in Figure 3.
As shown in figure 3, the mean value of coefficient of agreement ( k ) of the experts
was superior to that of the consumers on four adjectives related to “Luster” and “Depth
of dyeing” (S.L. =0.05). In contrast, the coefficient of agreement ( k ) of the consumers
was superior to that of the experts on four adjectives related to “Handling” and
“Preference” (S.L. < 0.05). Thus, although the persons belonging to the experts had a
common criterion for “Luster” and “Depth of dyeing”, because these are related to their
occupations, they did not show agreement on their criteria for other adjectives.

)3(12
22
..
CC kn
adjgroup
)(22 ijij
ijkn xnxCC
i, j: sample number
number of persons who evaluated “sample i was superior than sample j”
n: number of persons (experts: n = 9, consumers: n = 20 )
k: number of samples (k = 6 )
Figure 3. Mean value of coefficient of agreement in both groups
0
0.2
0.4
0.6
0.8
1
Glo
ssy
Gar
ish
Ric
hSh
iny
Glit
tery
Dee
pD
ark
Reg
ular
Blu
eR
edV
ivid
Rou
ghFi
neSm
ooth
Slee
k
Soft
Dam
p-lo
okin
gFu
llN
UM
ER
ISa
ndy-
look
ing
Lig
ht
Hig
h-cl
ass
Ele
gant
Bea
utif
ulD
elic
ate
Com
pose
d
*
**
**
Coe
ffic
ient
of a
gree
men
t (
)
**
**
**
*
** 1% significance level* 5% significance level
NU
ME
RI
Adj. related to ‘Preference’Adj. related to ‘Luster’Adj. related to ‘Depth of dyeing’Adj. related to ‘Roughness’
Adj. related to ‘Handling’
Skilled testers
Consumer testers

Table1. t-test of mean value ( k ) of coefficients of agreement in both groups
T-value P-Value Significance
Glossy 1.752 0.091
Garish 1.703 0.100
Rich 2.992 0.006 **
Shiny 3.548 0.001 **
Glittery 2.221 0.035 *
Deep 0.134 0.895
Dark 0.400 0.692
Regular 1.029 0.312
Blue 3.113 0.004 **
Red 0.691 0.495
Vivid 1.353 0.187
Rough 0.519 0.608
Fine 0.683 0.500
Smooth 1.227 0.230
Sleek 0.853 0.401
Soft 0.444 0.660
Damp-looking 0.370 0.714
Full 0.867 0.393
NUMERI 8.987 > 0.001 **
Sandy-looking 2.539 0.017 *
Light 0.317 0.753
High-class 2.175 0.038 *
Elegant 1.815 0.080
Beautiful 1.248 0.222
Delicate 0.001 0.999
Composed 0.048 0.024 *
Preference
Adjective
Luster
Depth ofdyeing
Roughness
Handling

4.3 Mean preference score and ANOVA
The mean preference score is an average evaluation score of each group. Assuming the
evaluation score of persons against the comparison pair of certain samples is even, the
evaluation score agree with the difference of mean preference score of the two samples.
But the mean preference score satisfy the following condition : tt 61 ( t : Number of
samples, : Mean preference score).
The profiles of the mean preference scores for each adjective are shown in figure 4.
The signs (plus or minus) of the mean preference scores for the adjectives related to
“Luster” and “Depth of dyeing” differed by yarn material. Hence, the evaluations of
these adjectives were mainly influenced by material effect. On the other hand, the signs
of the mean preference scores for the adjectives related to “Roughness” differed by
weave types. Hence, the evaluations of these adjectives were mainly influenced by
structural effect. In addition, the signs of the mean preference scores for the adjectives
related to “Handling” and “Preference” were not significantly affected by either yarn
material or weave types. Hence, the evaluations of these adjectives were influenced by
both material effect and structural effect.
The tendencies mentioned above were found in both groups. There were also some
differences between two groups with regard to adjectives related to “Depth of dyeing”.
Namely, in the evaluations by the experts, the darker and deeper the sample, the redder
it was evaluated. In contrast, in the evaluations by the consumers, the darker and the
deeper the sample, the bluer it was evaluated.
When a fabric is dyed black, several dyes are combined. Thus, the dyed black color of
fabrics was classified according to extraction of redness and that of blueness. Because of
this, a common way of thinking may be behind the results observed from the experts.
Namely, samples dyed to a black including more red was evaluated darker and deeper
than those dyed to a black including bluer. Consequently the criterion of the experts on
the evaluation of depth (“Deep”) depend their classification of the blackness with
respect to red or blue. On the other hand, the criterion of the consumers depended on
the vividness of the black color rather than redness or blueness.
Analysis of variance (ANOVA) was applied to the evaluation scores for assessing the
main effect and combination effect. The main effect shows the effect due to the
characteristics of each sample. And the combination effect which is included in the
unexplainable standard error shows the effect due to the comparison pair of samples.
From the results of ANOVA on the mean preference score, the combination effects
were not significant for any adjectives in either group (S.L. > 0.01). The main effect on
“NUMERI” was not significant (S.L. > 0.01) in the consumers. Therefore, the following
analysis was carried excluding "NUMERI" for the consumers.

(a) Consumer testers (b) Skilled testers
Figure 4. Profiles of mean preference score
-1.00 -0.50 0.00 0.50 1.00
Glossy
Garish
Rich
Shiny
Glittery
Deep
Dark
Regular
Blue
Red
Vivid
Rough
Fine
Smooth
Sleek
Soft
Damp-looking
Full
NUMERI
Sandy-looking
Light
High-class
Elegant
Beautiful
Delicate
Composed
-1.00 -0.50 0.00 0.50 1.00
Glossy
Garish
Rich
Shiny
Glittery
Deep
Dark
Regular
Blue
Red
Vivid
Rough
Fine
Smooth
Sleek
Soft
Damp-looking
Full
NUMERI
Sandy-looking
Light
High-class
Elegant
Beautiful
Delicate
Composed
Plain (silk) Twill (silk) Satin (silk)Plain (worsted) Twill (worsted) Satin (worsted)
Mean preference score Mean preference score
NUMERI NUMERI
Adj. related to ‘Preference’Adj. related to ‘Luster’Adj. related to ‘Depth of dyeing’Adj. related to ‘Roughness’
Adj. related to ‘Handling’

4.4 Identification of principal factors of fabric aesthetics
Factor analysis [12] was applied to the mean preference scores of the twenty-six
adjectives for the experts and those of twenty-five adjectives (“NUMERI” excluded) for
the consumers.
The first stage of factor analysis is to calculate the correlation coefficients between
mean preference scores of each adjective. Then the factor matrix is obtained using the
principal factor solutions with repeated assumption of communality which is the
proportion of the variance ascribed to the action of the common factors. Communality
ranges from 0 to 1, and the degree of the difference between communality and unity is
explained by the experimental error.
Axes of the factor matrix are rotated by Varimax method so that the structure of the
sensory evaluation relations is indicated more clearly.
Two components with eigenvalues greater than 1.0, representing 89% of the
cumulative percentage of the experts and 95% of that of the consumers, were obtained.
The rotated factor matrices are shown in Tables 2 and 3.
In both groups, factor 1 has a high positive loading for adjectives related to the
“Luster” (i.e., “Rich (with respect to highlights)”, “Too shiny”, and “Glittery”) and a high
negative loading for adjectives related to the “Depth of dyeing” (i.e., “Dark”, and
“Deep”); therefore, the first principal factor was interpreted as “Luster and depth
sensation”. Similarly, factor 2 has either a high positive or high negative factor loading
for adjectives related to “Roughness” (i.e., “Rough”, “Sleek”, “Smooth”, and “Fine”);
therefore, the second principal factor was interpreted as “Surface roughness sensation”.
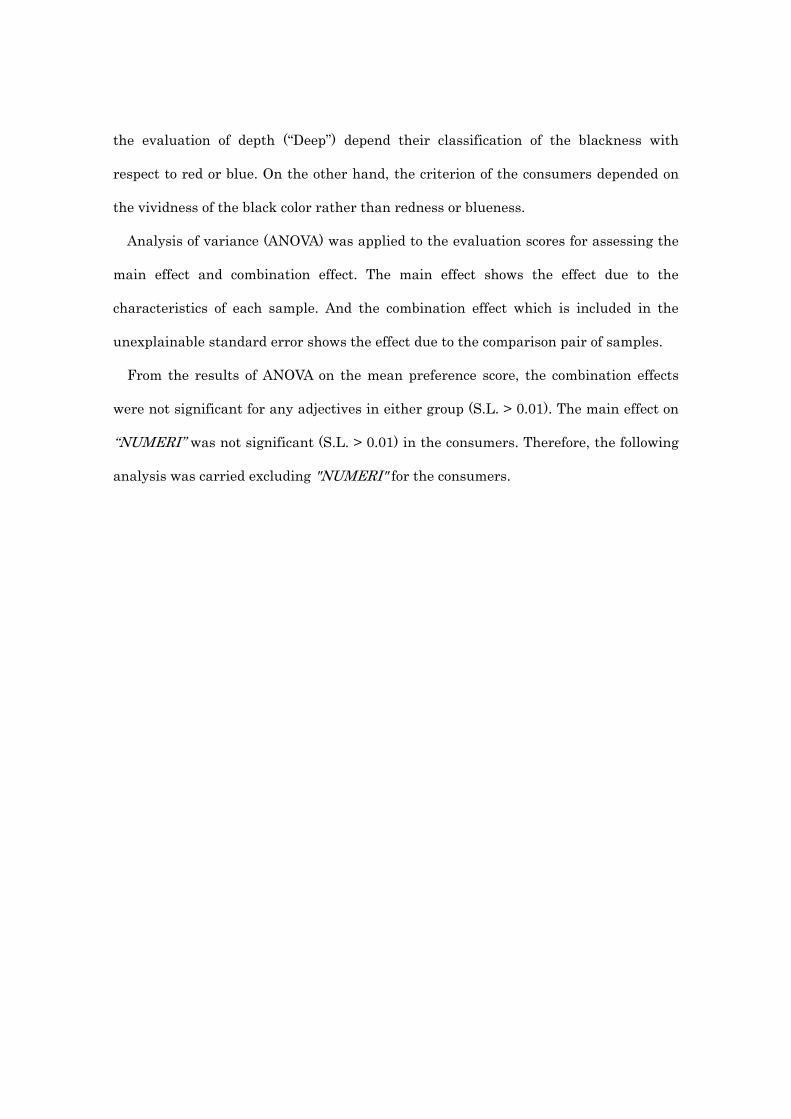
The factor scores of each sample are shown in figure 5. As mentioned above, because
the adjectives related to “Luster” and “Depth of dyeing” were influenced by material
effect, the factor score “Luster and depth sensation” was affected mainly by material
effect. The spun silk fabrics gave a strong impression of luster because these fabrics had

positive factor scores. In contrast, the worsted fabrics gave a strong impression of depth
because the worsted fabrics had negative scores.
These impressions were the reactions obtained from observation of light reflectivity
which occurred at the surface of fabrics as stimuli.
The differences in light reflectivity caused by the surface texture of fibers are related
to the material effect. Specifically, specular reflection occurs due to the sleek surface of
silk fibers, and diffusion reflection occurs due to the existence of scales on the surface of
worsted fibers. Because of the increase in diffusion reflection, black appears deeper in
worsted fabrics. Therefore in other words, the “Luster and depth sensation” is the sense
which is due to the intensity of light reflectivity.
The factor score “Luster and depth sensation” was also affected slightly by structural
effect. Specifically, the factor scores increase in the order of satin, plain, twill in both the
spun silk and the worsted fabrics.
We considered that the affect of the structural effect is due to the length of the
floating yarn. Specifically, the floating yarn appears shorter in the plain weave because
the warp and weft yarn are interlaced. In contrast, the floating yarn appears longer in
the satin weave because the satin weave repeats on three ends. Because of the increase
in the specular reflection of the floating yarn, the color of the incident lighting appears
on the samples. Thus, the satin gave a stronger impression of luster.
Similarly, the factor score “Surface roughness sensation” was affected mainly by the
structural effect. The surface of the plain weave was evaluated as smooth relative to the
twill and the satin weaves by both groups. In other words,“Surface roughness
sensation” is the sense which is due to the pattern of light reflectivity.

Table2. Factor loading for the consumer testers
Factor Adjective Factor 1 Factor 2 Communality Adjective category
1 Deep -1.00 0.02 1.00 Depth of dyeing
Dark -1.00 -0.08 1.00
Red 0.95 -0.08 0.92
Vivid -0.87 0.42 0.94
Regular -0.89 0.43 0.98
Shiny 1.00 0.07 1.00 Luster
Rich 0.99 0.02 0.98
Glittery 0.96 -0.28 1.00
Garish 0.98 0.17 0.99
Composed -0.94 0.34 1.00 Preference
High-class -0.89 0.44 0.99
Elegant -0.86 0.49 0.98
Full 0.94 0.08 0.89 Handling
Damp-looking -0.86 0.49 0.98
2 Rough 0.40 -0.91 0.98 Roughness
Fine -0.26 0.97 1.00
Smooth -0.21 0.98 1.00
Sleek -0.08 0.99 0.99
Light 0.55 0.83 1.00 Handling
Sandy-looking -0.07 0.99 0.98
Soft 0.11 0.99 1.00
Delicate -0.26 0.96 0.99 Preference
Blue -0.65 -0.39 0.58
Glossy 0.54 0.62 0.68
Beautiful -0.74 0.67 1.00
Factor loading (after varimax rotation)

Table3 Factor loading for the skilled testers
Factor Adjective Factor 1 Factor 2 Communality Adjective category
1 Deep -0.99 0 1.00 Depth of dyeing
Dark -0.98 0.04 1.00
Red -0.90 0.34 1.00
Vivid -0.95 0.21 0.98
Blue 0.82 -0.44 0.89
Shiny 0.83 -0.51 0.99 Luster
Rich 0.87 -0.43 1.00
Glittery 0.85 -0.49 1.00
Garish 0.91 -0.34 1.00
Glossy 0.90 -0.17 1.00
Composed -0.81 0.55 0.98 Preference
Elegant -0.80 0.57 1.00
Full -0.92 -0.16 0.99 Handling
2 Rough 0.33 -0.92 1.00 Roughness
Fine -0.40 0.91 1.00
Smooth -0.19 0.95 0.96
Sleek 0.12 0.94 0.96
Light -0.18 0.91 1.00 Handling
Sandy-looking -0.07 0.96 0.98
Delicate -0.45 0.89 1.00 Preference
Regular -0.72 0.65 1.00
Soft -0.72 0.66 1.00
Damp-looking -0.43 0.52 1.00
NUMERI 0.15 0.02 1.00
High-class -0.78 0.58 1.00
Beautiful -0.67 0.73 0.95
Factor loading (after varimax rotation)
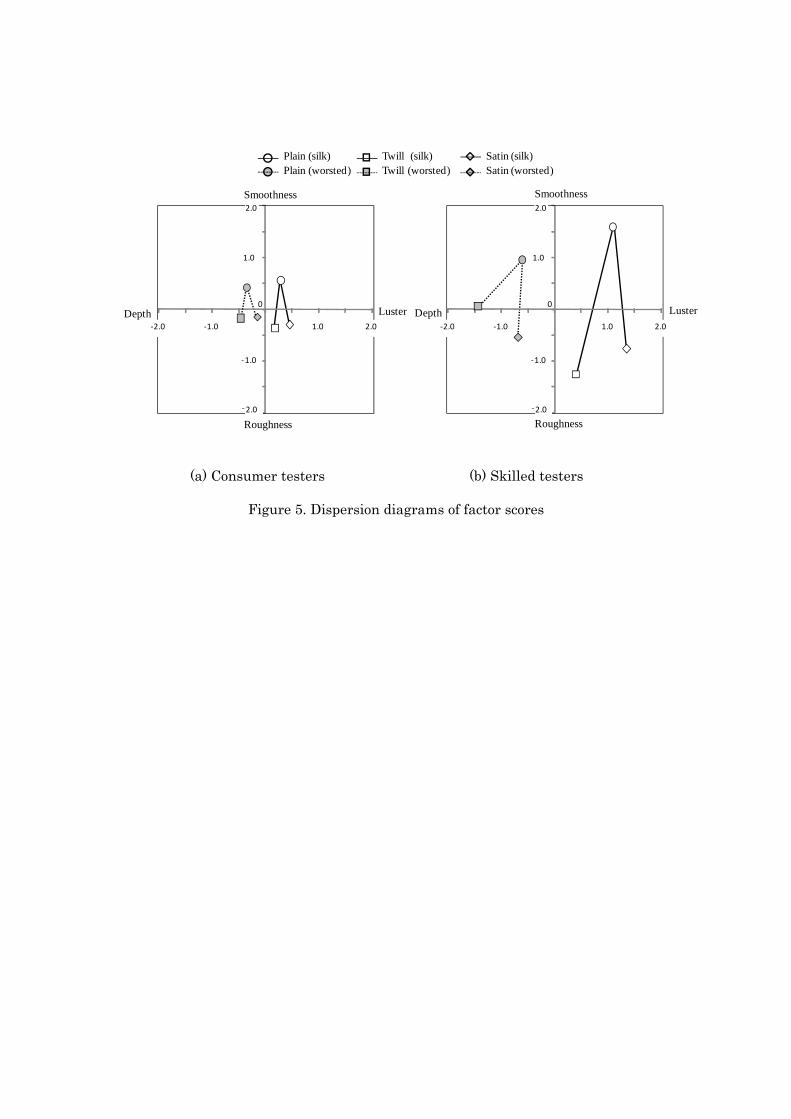
(a) Consumer testers (b) Skilled testers
Figure 5. Dispersion diagrams of factor scores
‐1.0
0
1.0
‐2.0
2.0
‐2.0 ‐1.0 1.0 2.0
‐1.0
0
1.0
‐2.0
2.0
‐2.0 ‐1.0 1.0 2.0
Plain (silk) Twill (silk) Satin (silk)Plain (worsted) Twill (worsted) Satin (worsted)
Roughness
Smoothness
LusterDepth
Roughness
Smoothness
LusterDepth

5. Conclusions
In this study, in order to identify the principal factor of the fabric aesthetics evaluated
by the reaction obtained from visual examination, the sensory evaluation of six samples
having different material and structural effect was attempted by a group of experts and
a group of consumers. Thereafter, factor analysis was applied. Furthermore, the
differences in the evaluations of two groups were analyzed and the following
conclusions were obtained.
In order to compare the reliability of the criterion used between experts and consumers,
the coefficients of consistency () and agreement () were calculated. Because “Luster”
and “Depth of dyeing” properties require expertise, the consistency () and agreement
() of the criteria of the experts is superior to that of the consumers. However, the
agreement () of the criteria among the persons is not necessarily for other adjectives.
From the result of factor analysis applied to the mean preference scores, two common
factors––“Luster and depth sensation” and “Surface roughness sensation”––were
extracted from both groups of testers. Consequently, these factors were identified as the
principal factors of fabric aesthetics for the tested samples. “Luster and depth
sensation” is mainly due to the intensity of light reflectivity such as material effect. In
contrast, “Surface roughness sensation" is mainly due to the pattern of light reflectivity
such as structural effect.

Acknowledgments
This study was supported by a Grant-in-Aid for Scientific Research Program (No. 16700203) by
the Ministry of Education, Science, Sports, and Culture of Japan. This paper is dedicated to the first
principal, Chotaro Harizuka, on the occasion of the 100th anniversary of the Faculty of Textile
Science and Technology, Shinshu University. We wish to thank Mr Eiken Kuzutani and Mr Shouji
Uesaka, students at Shinshu University, for their assistance.
References
1. Ministry of Internal Affairs and Communications (MIAC), “Establishment and
Enterprise Census”, MIAC, Tokyo, (2006)
2. Kawabata S., “The Standardization and Analysis of Hand Evaluation”, 2nd edn,,
HESC. Textile Mach. Sci. Jpn., Osaka, (1980)
3. Howorth W.S., The Handle of Suiting, Lingerie, and Dress Fabrics, J. Text. Inst., 49,
T540 (1956)
4. Japanese Industrial Standards (JIS) L 0207, “Glossary of terms used in textile
industry (Dyeing and finishing) (2005)
5. BRAND R. H., Measurement of aesthetics analysis of aesthetic components, Textile
Res. J. 34, 791-804 (1964)
6. Hoffman, R. M., Measuring the Aesthetic Appeal of Textiles, Textile Res. J., 56, 428-
434 (1965)
7. Binns H., A Comparison between the judgments of individuals skilled in the textile
trade and children, J. Text. Inst., 17, T615 (1964)
8. ISO 11664-4 (CIE S 014-4/E) “Colorimetry - Part 4: CIE 1976 L*a*b* Colour space”,
(2008)
9. Research Committee of Sensory Evaluation, “Sensory Evaluation Handbook”, Union

of Japanese Scientists and Engineers, Tokyo, (1973), p. 366-385
10. Kobayashi, S., Evaluation of Handling, Journal of Textile Mach. Sci. Jpn.
(predecessor journal of J. Text. Eng.), 26, 88-94 (1973)
11. Kawabata, S., The “Feeling: Development of the Objective Evaluation of Fabric
Hand”, Nippon Gomu Kyokaishi, 63, 158-164, (1990)
12. Okuno, T., “Multivariate Analysis” 2nd edn., Union of Japanese Scientists and
Engineers, Tokyo, (1981), p. 323-368