
Identification of pigments by multispectral imaging; a flowchart ...
12
RESEARCH ARTICLE Open Access Identification of pigments by multispectral imaging; a flowchart method Antonino Cosentino Abstract The literature on the application of Multispectral and Hyperspectral imaging for identification of pigments on artworks is sparse. While these methods do not provide the analytical capability that spectroscopies do offer, the use of spectral imaging has the advantage of being a rapid and relatively low-cost solution for the examination of large areas. This paper presents a flowchart for the identification of historical pigments applied with gum Arabic using multispectral imaging (wavelength ranging from 360 to 1700 nm) performed with a modified digital camera for infrared, visible and ultraviolet photography; and an InGaAs camera for infrared reflectography. The flowchart method will be most successful on paint made of one layer of pure pigment, and it can selectively discriminate only a fraction of the 56 pigments analyzed. Though, considerably limited in its analytical capabilities, the low cost and speed of the workflow make the method worthwhile, even if only to localize retouching and areas appearing the same hue but painted with different pigments. The InGaAs camera is the only expensive instrument used in this study but its cost is relatively affordable for the average painting conservation studio since only a model with a low pixel count is required (320×256 pixels) rather than a more sophisticated InGaAs scanner system. Introduction Multispectral imaging (MSI) [1,2] and Hyperspectral Imaging [3-6], have been suggested as methods for the non-destructive identification of pigments. Though, it is mandatory to point out that these methods are problem- atic and the user may be subjected to draw conclusions that remain uncertain, essentially, because pigments are often mixed and overlapped in layers to make the de- sired color and effect. To identify pigments with an acceptable degree of cer- tainty, at least one other material specific technique must be used to complement hyper or multispectral im- aging diagnostics. The use of MSI to tentatively identify pigments has an important advantage justifying its appli- cation: the rapid and low-cost survey of large areas. The intention of this paper is to show that with a flowchart based methodology it is possible to tentatively identify some historical pigments by means of MSI performed with simplified equipment and without the aid of im- aging analysis software. This method doesn’t claim to allow the identification of all different pigments, but it will work for those which present peculiar behaviors in the range of the electromagnetic spectrum readily ob- servable with an IR-VIS–UV modified digital camera (360–1100 nm) and an InGaAs camera (900–1700 nm). In this way, selected pigments are likely to be identified by means of MSI examination. This simplified approach, though demonstrated to be limited in its analytical diag- nostic capabilities, has the benefit of being accessible and easy to implement by professionals in the art con- servation and examination field. This method is more likely to succeed when applied on artworks where pigments have been applied in one single layer and not mixed; as is the case with miniatures [6,7], drawings [8] and prints. Unlike other references, which sug- gest the use of software algorithms to analyze the MSI im- ages, this paper proposes a more straightforward method simply based on visual examination and the use of a photo- editing software for the characterization of features appar- ent in the image. Multispectral imaging Imaging methods This paper illustrates a flowchart method for pigment identification based on the acquisition of MSI images in 4 spectral bands: Ultraviolet, UV (360–400 nm); Visible, Correspondence: [email protected] Independent Scholar at “Cultural Heritage Science Open Source” Blog, chsopensource.org, Piazza Cantarella 11, Aci Sant’Antonio 95025, Italy © 2014 Cosentino; licensee Chemistry Central Ltd. This is an Open Access article distributed under the terms of the Creative Commons Attribution License (http://creativecommons.org/licenses/by/2.0), which permits unrestricted use, distribution, and reproduction in any medium, provided the original work is properly credited. Cosentino Heritage Science 2014, 2:8 http://www.heritagesciencejournal.com/content/2/1/8
Transcript of Identification of pigments by multispectral imaging; a flowchart ...

Cosentino Heritage Science 2014, 2:8http://www.heritagesciencejournal.com/content/2/1/8
RESEARCH ARTICLE Open Access
Identification of pigments by multispectralimaging; a flowchart methodAntonino Cosentino
Abstract
The literature on the application of Multispectral and Hyperspectral imaging for identification of pigments onartworks is sparse. While these methods do not provide the analytical capability that spectroscopies do offer, theuse of spectral imaging has the advantage of being a rapid and relatively low-cost solution for the examination oflarge areas. This paper presents a flowchart for the identification of historical pigments applied with gum Arabicusing multispectral imaging (wavelength ranging from 360 to 1700 nm) performed with a modified digital camerafor infrared, visible and ultraviolet photography; and an InGaAs camera for infrared reflectography. The flowchartmethod will be most successful on paint made of one layer of pure pigment, and it can selectively discriminateonly a fraction of the 56 pigments analyzed. Though, considerably limited in its analytical capabilities, the low costand speed of the workflow make the method worthwhile, even if only to localize retouching and areas appearingthe same hue but painted with different pigments. The InGaAs camera is the only expensive instrument used in thisstudy but its cost is relatively affordable for the average painting conservation studio since only a model with a lowpixel count is required (320×256 pixels) rather than a more sophisticated InGaAs scanner system.
IntroductionMultispectral imaging (MSI) [1,2] and HyperspectralImaging [3-6], have been suggested as methods for thenon-destructive identification of pigments. Though, it ismandatory to point out that these methods are problem-atic and the user may be subjected to draw conclusionsthat remain uncertain, essentially, because pigments areoften mixed and overlapped in layers to make the de-sired color and effect.To identify pigments with an acceptable degree of cer-
tainty, at least one other material specific techniquemust be used to complement hyper or multispectral im-aging diagnostics. The use of MSI to tentatively identifypigments has an important advantage justifying its appli-cation: the rapid and low-cost survey of large areas. Theintention of this paper is to show that with a flowchartbased methodology it is possible to tentatively identifysome historical pigments by means of MSI performedwith simplified equipment and without the aid of im-aging analysis software. This method doesn’t claim toallow the identification of all different pigments, but it
Correspondence: [email protected] Scholar at “Cultural Heritage Science Open Source” Blog,chsopensource.org, Piazza Cantarella 11, Aci Sant’Antonio 95025, Italy
© 2014 Cosentino; licensee Chemistry CentralCommons Attribution License (http://creativereproduction in any medium, provided the or
will work for those which present peculiar behaviors inthe range of the electromagnetic spectrum readily ob-servable with an IR-VIS–UV modified digital camera(360–1100 nm) and an InGaAs camera (900–1700 nm).In this way, selected pigments are likely to be identifiedby means of MSI examination. This simplified approach,though demonstrated to be limited in its analytical diag-nostic capabilities, has the benefit of being accessibleand easy to implement by professionals in the art con-servation and examination field.This method is more likely to succeed when applied on
artworks where pigments have been applied in one singlelayer and not mixed; as is the case with miniatures [6,7],drawings [8] and prints. Unlike other references, which sug-gest the use of software algorithms to analyze the MSI im-ages, this paper proposes a more straightforward methodsimply based on visual examination and the use of a photo-editing software for the characterization of features appar-ent in the image.
Multispectral imagingImaging methodsThis paper illustrates a flowchart method for pigmentidentification based on the acquisition of MSI images in4 spectral bands: Ultraviolet, UV (360–400 nm); Visible,
Ltd. This is an Open Access article distributed under the terms of the Creativecommons.org/licenses/by/2.0), which permits unrestricted use, distribution, andiginal work is properly credited.
Cosentino Heritage Science 2014, 2:8 Page 2 of 12http://www.heritagesciencejournal.com/content/2/1/8
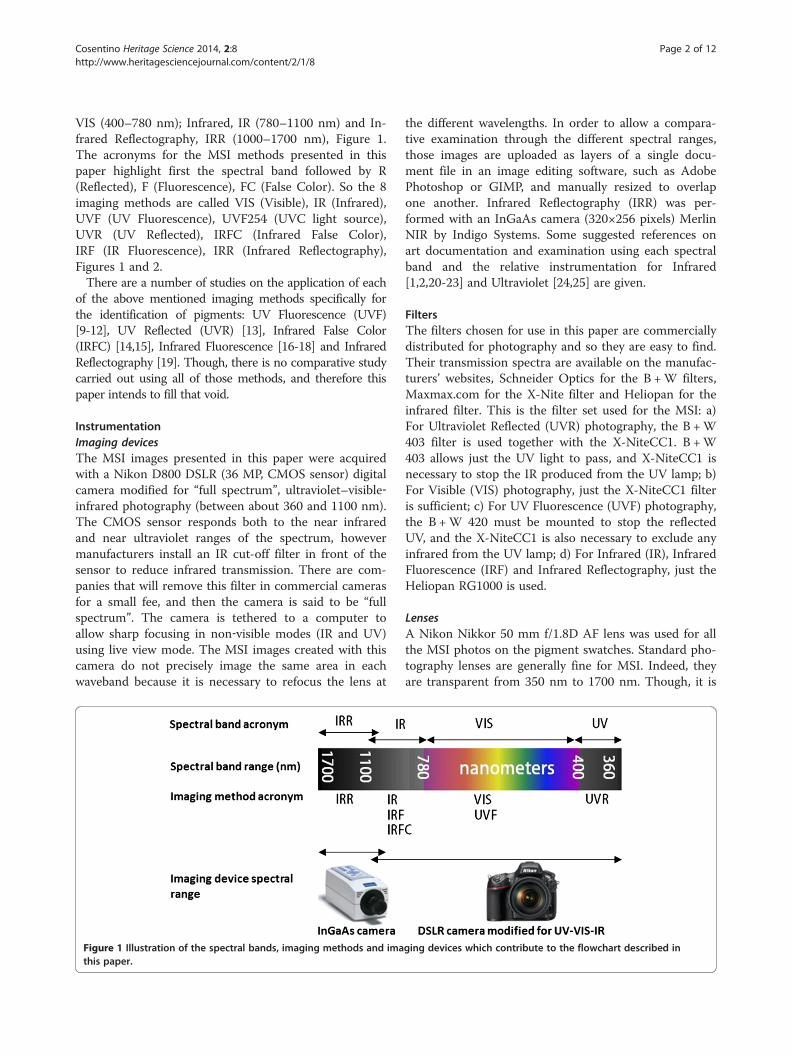
VIS (400–780 nm); Infrared, IR (780–1100 nm) and In-frared Reflectography, IRR (1000–1700 nm), Figure 1.The acronyms for the MSI methods presented in thispaper highlight first the spectral band followed by R(Reflected), F (Fluorescence), FC (False Color). So the 8imaging methods are called VIS (Visible), IR (Infrared),UVF (UV Fluorescence), UVF254 (UVC light source),UVR (UV Reflected), IRFC (Infrared False Color),IRF (IR Fluorescence), IRR (Infrared Reflectography),Figures 1 and 2.There are a number of studies on the application of each
of the above mentioned imaging methods specifically forthe identification of pigments: UV Fluorescence (UVF)[9-12], UV Reflected (UVR) [13], Infrared False Color(IRFC) [14,15], Infrared Fluorescence [16-18] and InfraredReflectography [19]. Though, there is no comparative studycarried out using all of those methods, and therefore thispaper intends to fill that void.
InstrumentationImaging devicesThe MSI images presented in this paper were acquiredwith a Nikon D800 DSLR (36 MP, CMOS sensor) digitalcamera modified for “full spectrum”, ultraviolet–visible‐infrared photography (between about 360 and 1100 nm).The CMOS sensor responds both to the near infraredand near ultraviolet ranges of the spectrum, howevermanufacturers install an IR cut-off filter in front of thesensor to reduce infrared transmission. There are com-panies that will remove this filter in commercial camerasfor a small fee, and then the camera is said to be “fullspectrum”. The camera is tethered to a computer toallow sharp focusing in non‐visible modes (IR and UV)using live view mode. The MSI images created with thiscamera do not precisely image the same area in eachwaveband because it is necessary to refocus the lens at
Figure 1 Illustration of the spectral bands, imaging methods and imathis paper.
the different wavelengths. In order to allow a compara-tive examination through the different spectral ranges,those images are uploaded as layers of a single docu-ment file in an image editing software, such as AdobePhotoshop or GIMP, and manually resized to overlapone another. Infrared Reflectography (IRR) was per-formed with an InGaAs camera (320×256 pixels) MerlinNIR by Indigo Systems. Some suggested references onart documentation and examination using each spectralband and the relative instrumentation for Infrared[1,2,20-23] and Ultraviolet [24,25] are given.
FiltersThe filters chosen for use in this paper are commerciallydistributed for photography and so they are easy to find.Their transmission spectra are available on the manufac-turers’ websites, Schneider Optics for the B +W filters,Maxmax.com for the X-Nite filter and Heliopan for theinfrared filter. This is the filter set used for the MSI: a)For Ultraviolet Reflected (UVR) photography, the B +W403 filter is used together with the X-NiteCC1. B +W403 allows just the UV light to pass, and X-NiteCC1 isnecessary to stop the IR produced from the UV lamp; b)For Visible (VIS) photography, just the X-NiteCC1 filteris sufficient; c) For UV Fluorescence (UVF) photography,the B +W 420 must be mounted to stop the reflectedUV, and the X-NiteCC1 is also necessary to exclude anyinfrared from the UV lamp; d) For Infrared (IR), InfraredFluorescence (IRF) and Infrared Reflectography, just theHeliopan RG1000 is used.
LensesA Nikon Nikkor 50 mm f/1.8D AF lens was used for allthe MSI photos on the pigment swatches. Standard pho-tography lenses are generally fine for MSI. Indeed, theyare transparent from 350 nm to 1700 nm. Though, it is
ging devices which contribute to the flowchart described in

Figure 2 Madonna and Child, Ingels Collection, Sweden. Example of Multispectral Imaging documentation and the acronyms used inthis paper.
Cosentino Heritage Science 2014, 2:8 Page 3 of 12http://www.heritagesciencejournal.com/content/2/1/8
recommended to test the lenses for hot spots in the in-frared imaging. Hot spots can be caused by a number offactors, such as coatings and/or the interaction betweenelements within the lens and the image sensor. Lists ofother lenses tested for hot spots are available online[26]. It is also recommended to use fixed focal lensesand avoid complex lenses that are likely to give flares inthe infrared and ultraviolet photography. Also it is rec-ommended to avoid telephoto lenses over 200 mm forMSI photography, so that the lens will be fast enough towork with the low intensity emission produced in theUV Fluorescence and IR Fluorescence imaging.
LightingHalogen lamps are used for VIS and IR photography.For UV photography (UVF and UVR) high-Flux 365 nmLED lamps are recommended. The advantages of UVLED lighting are obvious: instant start up, no heatingup, very lightweight and sturdy. These LEDs are filteredto cut off any visible light with a UV-pass glass analo-gous to the B +W 403. This paper considers the UVFluorescence excited by a 254 nm UV lamp (UVF254) asan additional and separate imaging method. These lampsmust be used with extreme care since this UV range(UVC) is dangerous for the eyes and skin. Infrared fluor-escence (IRF) requires illumination in the visible rangeonly, which can be implemented with a white light LEDlamp filtered with the X-Nite CC1 filter to cut off emis-sion in the near-IR.
CalibrationFor the camera settings and image processing of visibleimages it is recommended to follow normal color man-agement procedures [2]. For the purpose of this workthe American Institute of Conservation Photo Docu-mentation (AIC PhD) target [27] was used for calibra-tion of visible photography. The camera has beencalibrated with the X-rite ColorChecker Passport and itsbundled software. Due to differences in technologies andvariables in manufacturing processes every camera cap-tures colors a bit differently. Even two identical camerasfrom the same company are a bit different. Even if theRaw processing software could have included a profilefor the specific model camera, it is possible to get evenbetter results by creating a profile specifically for theRAW output of the particular camera. ColorCheckerPassport Classic Target is the industry standard colorreference target for creating DNG profiles and for evalu-ating specific colors. It is important to point out that thecamera calibration is another step, in addition to thecommon white balance performed even on compactcameras. The first one corrects for different rendering ofcolors by different cameras, while the second one cor-rects for different lighting. The images were shot RAWand they were then color corrected using the cameraprofile above mentioned and white balanced using theN6.5 neutral grey patch in the AIC target. The greypatches are identified by the following designations(white to black): white; N8; N6.5; N5; N3.5; and black.They were also exposure corrected: N8 patch 150 +/− 5

Cosentino Heritage Science 2014, 2:8 Page 4 of 12http://www.heritagesciencejournal.com/content/2/1/8
for VIS. The same patch is also used for correcting theother images: 100 +/− 5 for IR and IRR, and 50 forUVR. On the other hand, calibration for ultravioletfluorescence is trickier as there is not yet an officiallyrecognized reference standard for UVF and UVF254photography. As an aid for color balancing and in orderto guarantee reproducibility of the UVF photos, the AICPhD target was accompanied with 3 emitters activatedby the LED UV and UV254 lamps: a section of a cardfor forensic UV photography (orange fluorescence), aswatch of zinc white (yellow fluorescence), and a fluores-cent paint (green fluorescence). These 3 UV emitters to-gether with the red fluorescence emission of the redsquare of the AIC PhD target itself are used for colorbalancing of UVF and UVF254 photos. This is per-formed on the RAW files editing them with AdobeCamera RaW 7.1 and assigning Temperature 15000Kelvin and Tint 70. The images are also exposure cor-rected using the red fluorescence of the red patch: Redchannel 70 +/− 5, Green 0, Blue 0. In order to check thecorrect exposure for IRF photography a swatch of cad-mium red was also added to the UV emitters, and theIRF images are exposure corrected with the red cad-mium swatch at RGB 30. Figure 3 shows the 8 MSIimages of the AIC target together with the UV and IRfluorescence emitters. The Infrared False Color image ismade by digitally editing the VIS and IR images. A copyof the VIS image is edited to become the IRFC image.The VIS green channel substitutes the blue channel and
Figure 3 The AIC PhD target (left) was accessorized with swatches ofIRF photography. Both targets are necessary for check the correct shootin
the red channel the green channel. Then, the IR imageconstitutes the red channel of the edited VIS.
PigmentsA collection of swatches of 56 historical pigments (Figure 4)have been applied using gum Arabic as a binder on a cellu-lose and cotton watercolor paper, acids and lignin free,commercialized by “Fabriano”, 270 gr/m2. This paper is nottreated with optical brighteners, it’s slightly UV Fluorescent,and it reflects IR. Two cross-hair lines, 0,2 mm (vertical)and 0.4 mm (horizontal), were printed on each swatch ofpaper before the application of paint, in order to have ameans to evaluate the pigment transparency in the IR andIRR imaging. Gum Arabic was chosen as a binder becauseit is the medium used in watercolor technique where pig-ments are more often used pure. Therefore, these are theartworks where the proposed method is likely to delivercorrect identification, rather than in other painting tech-nique, as linseed oil, were pigments are more expected tobe blended and layered. The pigments were mulled into thebinder which was added as needed for each pigment andapplied with brush. No other means to control and meas-ure thickness of the paint and ratio binder-pigment was im-plemented since this study wants to check the capabilitiesof this flowchart method on actual artworks where all thoseparameters are not likely to be easily determined. Some pig-ments that are not actually used with gum Arabic were in-cluded in this paper since it is planned to use the same setof pigments for future studies with other binders. Table 1
UV and IR fluorescent paints (right) to aid calibration of UVF andg and post-processing of all the 8 imaging methods.
Figure 4 Multispectral images of 56 historical pigments laid with gum Arabic on watercolor paper.
Cosentino Heritage Science 2014, 2:8 Page 5 of 12http://www.heritagesciencejournal.com/content/2/1/8
shows the list of pigments used in this study. Among all thepigments and their varieties ever used in art these 56-pigments collection is not exhaustive but it attempts, atleast, to be a selection of the most used ones from antiquityto early 1950’. A swatch of just gum Arabic is added as areference for the binder.
Table 1 List of pigments with the Kremer Pigments product c
BLACKS Cobalt violet, 45800
Ivory black, 12000 BROWNS
Vine black, 47000 Burnt Sienna, 40430
Bone black, 47100 Burnt umber, 47010
Lamp black, 47250 Van Dyke brown 41000
BLUES Raw Sienna, 17050
Azurite, 10200 Raw umber, 40610
Blue bice, 10184 GREENS
Cobalt blue, 45730 Cadmium green, 44510
Egyptian blue, 10060 Chrome green, 44200
Indigo, 36007 Cobalt green, 44200
Maya blue, 36007 Green earth, 11000
Prussian blue, 45202 Malachite, 10300
Smalt, 10000 Phthalo green, 23000
Ultramarine nat, 10510 Verdigris, 44450
Phthalo blue, 23050 Viridian, 44250
All the pigments are distributed by Kremer Pigments andtheir relative information about composition and manufac-turing can be found on the Kremer website [28] searchingfor the specified product code. The high resolution multi-spectral images of the pigment swatches can be accessedonline [29] and browsed on an IIPImage [30] server system
ode
REDS Chalk, 58000
Alizarin, 23600 YELLOWS
Cadmium red, 21120 Cadmium yellow, 21010
Red lead, 42500 Cobalt yellow, 43500
Read ochre, 11574 Lead Tin yellow I, 10100
Vermilion, 10610 Lead Tin yellow II, 10120
Madder lake, 372051 Massicot, 43010
Lac dye, 36020 Naples yellow, 10130
Carmine lake, 42100 Orpiment, 10700
Realgar, 10800 Saffron, 36300
WHITES Yellow ochre, 40010
Lead white, 46000 Yellow Lake reseda, 36262
Zinc white, 46300 Gamboge, 37050
Lithopone, 46100
Titanium white, 46200
Gypsum, 58300

Figure 5 Lithopone and titanium white swatches respectively reflect and absorb UV light. The dammar varnish coating doesn’t affect theUV reflected image of the two pigments.
Cosentino Heritage Science 2014, 2:8 Page 6 of 12http://www.heritagesciencejournal.com/content/2/1/8
that allows the user to blend between the multispectralimages for immediate comparison.
Flowchart1st step. VISThe logic of this flowchart is to start with the moststraightforward imaging methods and move toward theless specific ones. Rectangular shapes list the pigmentsshowing the same feature such as, for example, a redUV fluorescence. If the same group of pigments showsalso other properties in common, these are listed in thebottom of the same rectangular shape. The first step isto assign the pigment to one of these color categories:white, black, blue, green, yellow, brown, red. The flow-chart is likely to succeed for the identification of paintsmade of just one pure pigment. If the paint is a mixtureor a glaze, multispectral imaging loses its identificationcapacity. In that case, it’s recommended to first performan examination under magnification, with at least ahand-held USB microscope, to check if the paint is amixture. Particular attention should be directed towardsgreens and violets. Indeed, often they are a mix of blueand yellow for the green, and red and blue for the violet.
Figure 6 Prussian blue is IR absorbent. In the infrared image phthalo blappears bright because it is IR transparent. Indeed, when it is overlapped wthe indigo swatch looks not the ordinary bright red but as dark as Prussian
They could also be a layered glaze, yellow over blue forthe greens and red over blue for the violets.
2nd step. UVRUV light interacts just with the very surface layer ofpaint, so the UVR image is specific to the topmost pig-ment and layers of paint underneath do not influence it.Furthermore, a uniform varnish coating doesn’t interferewith the pigments’ appearance in the UVR but it willabsorbs some UV causing just a change in the overallbrightness. Strong differences in the brightness of UVreflected images such as that of lithopone and titaniumwhite are still observable, Figure 5. Two categories aredefined: bright, and dark. A pigment is defined as UVRbright if it reflects more UV than the AIC target N8patch, i.e. its RGB > 60.
3rd step. UVFAs described for the UVR imaging, UV fluorescencecomes just from the surface of the paint layer and it isn’tinfluenced by layers underneath. Though in this case,the varnish does play a major role since it generallyexhibits strong fluorescence and could overwhelm theactual fluorescence of the pigments. Consequently, MSI
ue appears bright because it is IR reflective. On the other hand, Indigoith Prussian blue it looks dark. Consequently, the infrared false color ofblue.

Figure 7 Cobalt-based pigments, such as cobalt blue, show an inverted behavior in the IRR. Differently than the other pigments, theybecome more “dark” (absorbing) in the IRR, with respect to the IR imaging.
Cosentino Heritage Science 2014, 2:8 Page 7 of 12http://www.heritagesciencejournal.com/content/2/1/8
documentation is recommended when the varnish isremoved from the artwork. These decision categories aredefined for the UV fluorescence: none (meaning nosizeable fluorescence is observed, i.e. RGB < 30), white,blue, red, orange, yellow.
4th step. UVF 254A 254 nm UV lamp allows the observation of fluorescenceotherwise not excited by the 365 nm UV lamp discussed inthe 3rd step, such as that which particularly occurs withmadder lake. The same decision steps as for UVF are de-fined: none (meaning no sizeable fluorescence is observed),red, orange, yellow, white. Again, as for the UVF, thesecolor categories are to be intended liberally since theperception of the color is not well defined.
5th step. IRFOnly a few pigments exhibit Infrared Fluorescence, namelycadmium based pigments and Egyptian blue, making it a
Figure 8 Flowchart for the identification of white pigments by multis
highly specific method. Just two decision steps: yes (RGB >10), or none.
6th step. IRWe can classify the behavior of each pigment in respectto the IR region as transparent, reflective or absorbent.When observing the IR image of the pigment swatches,if the pigment is IR transparent we can distinguish thecarbon ink line, if it is IR reflective, the pigment willlook bright and the ink line will be not visible. The pig-ment could also be IR absorbent and in this case the inkcould not be detected since the swatch will appear pitchblack. We can determine the IR behavior of a pigmentwith reasonable certainty only if it is applied on an IRreflective ground. Otherwise the under-paint will play amajor role in the IR appearance of the above layer ofpaint. Note the examples in Figure 6, Prussian blue ab-sorbs all the infrared so it is pitch dark in IR imaging.Phthalo blue and indigo both appear bright. Phthalo blue
pectral imaging.

Figure 9 Flowchart for the identification of blue pigments by multispectral imaging.
Cosentino Heritage Science 2014, 2:8 Page 8 of 12http://www.heritagesciencejournal.com/content/2/1/8
reflects IR, while indigo is transparent to the IR andtherefore the white ground appears beneath. So, whilephthalo blue would look bright on any ground, indigowould be bright or dark depending on the under paint.So, since we cannot know in advance if the pigment isinfrared transparent, there is no way to know if itsbrightness or darkness in the IR image is due to theunder layer. With the infrared imaging we are indeed onmore uncertain ground when it comes to the identifica-tion of layered paint. Consequently, two simple categor-ies are defined for the IR imaging: bright, dark. In orderto discriminate among more pigments it is necessary todefine two specific IR bright threshold values, one for
Figure 10 Flowchart for the identification of green pigments by mult
the yellows (RGB > 140) and one for all the other colors(RGB > 100).
7th step. IRRAt longer IR wavelengths, such as those captured with anInGaAs camera for infrared Reflectography (IRR) most ofthe pigments become a bit more transparent than in the IRimaging. Cobalt-based pigments exhibit the property mostuseful for pigment identification as they become less trans-parent in the IRR, Figure 7. Looking at the change ofbrightness in respect to the IR imaging, two categories aredefined: darker (Delta RGB > 50), and same (which encom-passes the normal added transparency in the IRR range).
ispectral imaging.

Figure 11 Flowchart for the identification of yellow pigments by multispectral imaging.
Cosentino Heritage Science 2014, 2:8 Page 9 of 12http://www.heritagesciencejournal.com/content/2/1/8
8th step. IRFCFor the last step comes Infrared false color. As we saw inFigure 6, the infrared false color appearance is stronglyinfluenced by the under layer, and as for the IR step thismethod is useful only for single layer paint examination.The categories are defined for the color produced as: red,pink, green, black, white, and purple.
WhitesFour white pigments have been tested and also twowhite minerals, gypsum and chalk, which are not prop-erly designated as pigments because of their low hidingpower, but are known to be used in art. These last onesturn grey when mixed with gum Arabic and requiremany applications to acquire enough opacity. Of thewhite pigments, only titanium white and zinc white
Figure 12 Flowchart for the identification of red pigments by multisp
show UV absorbance, and the latter can be identified forits yellow UV Fluorescence, Figure 8.
BlacksThe four most used carbon-based blacks were tested and,as expected, none of the imaging methods can distinguishamong them.
BluesEleven blue pigments, including Cobalt violet, were tested.It is notable that cobalt containing pigments reflect UV(cobalt violet, cobalt blue, smalt). Also, smalt and cobaltblue turn dark in the IRR imaging, spectra are available[31], Figure 9. Natural ultramarine exhibits a characteristicwhite UV254 fluorescence.
ectral imaging.

Figure 13 Kremer Pigments produces 9 varieties of madder lake. Only one product (372051) shows the characteristic orange UVF254 Fluorescence.
Cosentino Heritage Science 2014, 2:8 Page 10 of 12http://www.heritagesciencejournal.com/content/2/1/8
GreensEight green pigments were tested. Cadmium green is easilyidentified for its IR Fluorescence and cobalt green due toits darker IRR image, Figure 10.
YellowEleven yellow pigments were tested. UV Fluorescence isan intense red for Cadmium yellow, while it is yellow forSaffron and the yellow lake made of reseda. Gambogeexhibits an intense red with UV254, Figure 11.
RedsNine red pigments were tested, Figure 12. Cadmium redis identified for its exceptionally bright IRF, however formineral pigments the composition is likely to be rela-tively consistent, and with organic lakes there could bevariation in the composition; such as the case with thenine madder lakes varieties produced by Kremer (prod-uct codes 37202, 37203, 37217, 37218, 372051, 372052,372057, 372058, 372142). They were all tested and
Figure 14 The flowchart method helps to correlate the 7 multispectraIngels Collection, Sweden in attempt to arrive at pigment identificatio
372051 was chosen for this flowchart since the fluores-cence exhibited under UV254 illumination was the mostrepresentative when compared with the madder lakespreviously documented in literature [32-35], Figure 13.Consequently, while the presence of the UVF254 fluor-escence is a positive test for madder lake, its absencedoesn’t rule this lake out.
BrownsFive brown pigments were tested. As expected, none ofthe imaging methods can distinguish among them.
A case studyThe Ingels Collection, Sweden, owns a Madonna andChild (painting on panel), Figure 2, which is currentlybeing studied and has been documented with multispec-tral imaging by the author. The painting seems to dateback to the early 14th century Sienese school, as pro-posed by some scholars. The lips of the Madonna areinteresting to test the flowchart, see Figure 14. The lips
l imaging photos of the lips of the Madonna and Child panel,n in the case of a mixture.

Figure 15 MSI is useful to localize retouchings with two different blue pigments on the Madonna and Child panel, Ingels Collection, Sweden.
Cosentino Heritage Science 2014, 2:8 Page 11 of 12http://www.heritagesciencejournal.com/content/2/1/8
are retouched with a red pigment that reflects UV, has apink UV fluorescence, is IR and IRR transparent, and IRfluorescent. Not a single pigment from the selection ofreds tested here shows all these features, in particularthe UVF together with the IRF. So, it seems the lips havebeen retouched with a mix of cadmium red, whichaccounts for the IRF, and madder lake for the pinkishUVF. This hypothesis seems to be supported by the mi-cro image of an area on the lips where different red pig-ments are observed. Even if the pigment identificationcannot be accomplished in the majority of the cases,MSI is extremely valuable to differentiate pigments of thesame hue, which have been used in subsequent retouch-ings of an area. The mantle of the Madonna was restoredat least two times using two different pigments, Figure 15.The original blue and the two blue pigments can be local-ized because they behave differently in the MSI images.Retouching 2 is characterized by its intense UVF which isdue to its binder, while retouching 1 is differentiated fromthe original blue (likely azurite) because is bright in the IR.
ConclusionsThis paper represents the first attempt to correlate MSImethods to achieve a preliminary pigment identification.This study focused on pigments applied with gumArabic, which is the medium used most in watercolor, atechnique where pigments are less likely to be blendedand overlapped. Further work is necessary to take intoaccount the effects of other mediums, linseed oil, tem-pera and acrylic, and degree of aging.It was shown that some particularly useful features
such as UV Fluorescence, IR Fluorescence and thelosses of infrared reflectance in the IRR imaging allow
for rather reliable identification of certain pigments.On the other hand this MSI flowchart should be seenas complementary to analytical methods, in particular,elemental spectroscopies, such as X-ray Fluorescencespectroscopy. For example, on the blue pigmentsflowchart it is showed that Prussian blue and azuriteare just distinguishable by their IRFC, which is theless reliable discriminant. Though, XRF can easily dis-tinguish among them through the presence or ab-sence of significant copper content.Unfortunately, it is not always possible to perform all the
8 imaging methods to study an artwork. This is the case ofpaintings with the old varnish whose UVF can overwhelmthat of the pigments, and the case where it is not possibleto have total darkness to correctly execute IRF and UVF. Inthese cases, the flowchart can be still followed bypassingthe missing steps, but losing, of course, part of its identifica-tion capability.It would be valuable to compare this flowchart approach
with other spectral imaging technologies [36,37], methodswhich are currently investigated and which use estimationtechniques for visible spectrum imaging [38], and could be-come more powerful with the implementation of liquid-crystal tunable filters or interference filters. It would be alsoworth to apply the flowchart approach to other conserva-tion studies on which Hyperspectral Imaging has provensuccessful such as on inks [39,40] and parchment [41].
Competing interestsThe author declares that he has no competing interests.
AcknowledgementsThis work has been possible thanks to Kremer Pigments who has providedthe pigment samples. Thanks also to the Ingels Collection, Sweden forpermitting the use of the material on the Madonna and Child panel.

Cosentino Heritage Science 2014, 2:8 Page 12 of 12http://www.heritagesciencejournal.com/content/2/1/8
Received: 30 July 2013 Accepted: 6 March 2014Published: 17 March 2014
References1. Cosentino A: A practical guide to panoramic multispectral imaging.
e-Conservation Magazine 2013, 25:64–73.2. Frey FS, Warda J, American Institute for Conservation of Historic and Artistic
Works, Digital Photographic Documentation Task Force: The AIC guide todigital photography and conservation documentation. Washington, D.C:American Institute for Conservation of Historic and Artistic Works; 2008.
3. Zhao Y, Berns RS, Taplin LA, Coddington J: An investigation ofmultispectral imaging for the mapping of pigments in paintings. In Proc.SPIE 6810. San Jose, CA: Computer Image Analysis in the Study of Art; 2008.
4. Kubik M: Chapter 5 hyperspectral imaging: a new technique for thenon-invasive study of artworks. In Physical Techniques in the Study of Art,Archaeology and Cultural Heritage, volume 2. Oxford, UK: Elsevier;2007:199–259.
5. Padoan R, Steemers T, Klein M, Aalderink B, de Bruin G: Quantitativehyperspectral imaging of historic documents. In 9th InternationalConference on NDT of Art. Jerusalem, Israel; 2008.
6. Isacco E, Darrah J: The ultraviolet-infrared method of analysis, a scientificapproach to the study of Indian miniatures. Artibus Asiae 1993,53(3/4):470–491.
7. Melessanaki K, Papadakis V, Balas C, Anglos D: Laser induced breakdownspectroscopy and hyper-spectral imaging analysis of pigments on anilluminated manuscript. Spectrochim Acta B At Spectrosc 2001, 56:2337–2346.
8. Havermans J, Aziz HA, Scholten H: Non destructive detection of iron-gallinks by means of multispectral imaging. Restaurator 2003, 24:88–94.
9. Buzit Tragni C: The use of ultraviolet-induced visible fluorescence for examin-ation of photographs, Advanced residency program in photographconservation, Image Permanence Institute, Rochester Institute ofTechnology; 2005. http://notesonphotographs.org/images/d/df/Claire_Tragni_for_web.pdf.
10. René de la Rie E: Fluorescence of paint and varnish layers (part I).Stud Conserv 1982, 27(1):1–7.
11. René de la Rie E: Fluorescence of paint and varnish layers (part III).Stud Conserv 1982, 27(3):102–108.
12. Comelli D, Valentini G, Nevin A, Farina A, Toniolo L, Cubeddu R: A portableUV-fluorescence multispectral imaging system for the analysis of paintedsurfaces. Rev Sci Instrum 2008, 79:086112.
13. Aldrovandi A, Buzzegoli E, Keller A, Kunzelman D: Investigation of paintedsurfaces with a reflected UV false color technique. Italy: art’05, 8thInternational Conference on Non Destructive Investigations andMicronalysis for the Diagnostics and Conservation of the Cultural andEnvironmental Heritage Lecce; 2005.
14. Moon T, Schilling MR, Thirkettle S: A note on the use of false-color infraredphotography in conservation. Stud Conserv 1992, 37(1):42–52.
15. Hoeniger C: The identification of blue pigments in early Sienesepaintings by color infrared photography. J Am Inst Conserv 1991,30(2):115–124.
16. Bridgman CF, Gibson HL: Infrared luminescence in the photographicexamination of paintings and other art objects. Stud Conserv 1963,8(3):77–83.
17. Accorsi G, Verri G, Bolognesi M, Armaroli N, Clementi C, Miliani C, Romani A:The exceptional near-infrared luminescence properties of cuprorivaite(Egyptian blue). Chem Commun 2009, 23:3392–3394.
18. Thoury M, Delaney JK, De la Rie ER, Palmer M, Morales K, Krueger J:Near-infrared luminescence of cadmium pigments: in situ identificationand mapping in paintings. Appl Spectrosc 2011, 65(8):939–951.
19. Gargano M, Ludwig N, Poldi G: A new methodology for comparing IRreflectographic systems. Infrared Phys Technol 2007, 49:249–253.
20. Mairinger F: The infrared examination of paintings. In Radiation in Art andarcheometry. Edited by Creagh DC, Bradley DA. Elsevier; 2000:40–55.
21. Mayer JW: Infrared reflectography and hiding thickness. In The Science ofPaintings. New York: Springer-Verlag; 2000:125–127.
22. van Asperen JRJ, Boer d: Reflectography of paintings using an infraredvidicon television system. Stud Conserv 1969, 14(3):96–118.
23. Falco CM: High-resolution infrared imaging. San Diego: SPIE Optics+PhotonicsConference; 2010.
24. Savage G: Forgeries, fakes, and reproductions, a handbook for collectors,Volume 3. London: White Lion Publishers Ltd; 1976.
25. Rorimer JJ: Ultraviolet rays and their use in the examination of works of art.1st edition. New York: Metropolitan Museum of Art; 1931.
26. Hannemyr G, IR L: What lenses are suitable for IR photography. DPanswers.com http://dpanswers.com/content/irphoto_lenses.php.
27. AIC PhotoDocumentation Targets (AIC PhD Targets), conservation‐us.org.http://www.rmimaging.com/aic_phd.html.
28. Kremer Pigments Inc: Kremer Pigments Inc. http://kremerpigments.com/.29. Cultural Heritage Science Open Source”. Blog. References/Pigments page
http://chsopensource.org/multispectral-imaging-pigments/.30. IIPImage server system. http://iipimage.sourceforge.net/.31. Lawrence Berkeley National Laboratory Pigment Database. http://coolcolors.
lbl.gov/LBNL-Pigment-Database/database.html.32. Kirby J, Spring M, Higgit C: The technology of eighteenth and nineteenth
century Red lake pigments. National Gallery Tech Bull 2007, 28:69–95.33. Kirby J, Spring M, Higgit C: The technology of Red lake pigment
manufacture: study of the dyestuff substrate. National Gallery Tech Bull2005, 26:71–87.
34. FitzHugh EW: Artists’ Pigments: A Handbook of Their History andCharacteristics. Washington, DC: National Gallery of Art; 1997.
35. Art Institute Chicago: UV Image: Madder lake pigment revealed. http://www.artic.edu/aic/resources/resource/572.
36. Fischer C, Kakoulli I: Multispectral and hyperspectral imaging technologies inconservation: current research and potential applications. Stud Conserv2006, 14(Supplement 1):3–16(14).
37. Casini A, Lotti F, Baronti S, Castagna P, Stefani L: An image spectroscopysystem for the analysis and documentation of paintings. Sci Tech CultHerit 1992, 1:33–43.
38. Berns RS, Imai FH: The use of multi-channel visible spectrum imaging for pig-ment identification. Rio De Janeiro Preprints: ICOM Committee forConservation, 13th triennial meeting; 2002.
39. Tse S, Goltz D, Guild S, Orlandini V, Trojan-bedynski M, Richardson M: Effectof aqueous treatments on nineteenth-century iron-gall-Ink documents:assessment using hyperspectral imaging. Book Paper Group Ann 2009,28:75.
40. Havermans J, Aziz HA, Scholten H: Non destructive detection of iron-gallinks by means of multispectral imaging part 2: application on originalobjects affected with iron-gall-Ink corrosion. Restaurator 2008, 24(2):88–94.
41. Giacometti A, Campagnolo A, MacDonald L, Mahony S, Terras M, Robson S,Weyrich T, Gibson A: Cultural Heritage Destruction: Documenting ParchmentDegradation via Multispectral Imaging. London: Electronic Visualisation andthe Arts (EVA); 2012.
doi:10.1186/2050-7445-2-8Cite this article as: Cosentino: Identification of pigments bymultispectral imaging; a flowchart method. Heritage Science 2014 2:8.
Open access provides opportunities to our colleagues in other parts of the globe, by allowing
anyone to view the content free of charge.
Publish with ChemistryCentral and everyscientist can read your work free of charge
W. Jeffery Hurst, The Hershey Company.
available free of charge to the entire scientific communitypeer reviewed and published immediately upon acceptancecited in PubMed and archived on PubMed Centralyours you keep the copyright
Submit your manuscript here:http://www.chemistrycentral.com/manuscript/