Identification of Monopterus cuchia (Hamilton) and...
24
58 Chapter-VI Identification of Monopterus cuchia (Hamilton) and Monopterus albus (Zuiew) by mitochondrial DNA-based markers 6.1 INTRODUCTION The development of DNA-based genetic markers has a revolutionary impact on animal genetics. It is theoretically possible to observe and exploit genetic variation in the entire genome of organisms with DNA markers. In recent years, mtDNA, because of its fast evolution i.e. 5 to 10 times faster than single copy nuclear genes (Avise, 1994), has been widely applied in systematics, population genetics and conservation biology of animals (Wang et al., 2000). The present study has used mitochondrial Cytochrome c Oxidase subunit I (COI / cox1) gene and control region (CR or D–loop) as genetic marker for identification of Monopterus cuchia and Monopterus albus. A. Cytochrome C oxidase (COI) Cytochrome c Oxidase subunit I (COI / cox1) gene suppose to be evolving faster than 16S rDNA has widely been used in molecular taxonomy to resolve the phylogenetic relationships within the family and also to study intraspecific population genetic structure in several groups of eukaryotes including fishes. B. Mitochondrial control region marker (CR or D–loop) The D–loop segment exhibits a comparatively higher level of variation than protein– coding sequences due to reduced functional constraints and relaxed selection pressure (Saccone et al., 1987). An attempt has been made in the present investigation to study the molecular variation between two Synbranchid eel species- Monopterus cuchia and Monopterus albus. The study represents the first hand information generation, includes field data
Transcript of Identification of Monopterus cuchia (Hamilton) and...
58
Chapter-VI
Identification of Monopterus cuchia
(Hamilton) and Monopterus albus (Zuiew) by
mitochondrial DNA-based markers
6.1 INTRODUCTION
The development of DNA-based genetic markers has a revolutionary impact on animal
genetics. It is theoretically possible to observe and exploit genetic variation in the entire
genome of organisms with DNA markers. In recent years, mtDNA, because of its fast
evolution i.e. 5 to 10 times faster than single copy nuclear genes (Avise, 1994), has been
widely applied in systematics, population genetics and conservation biology of animals
(Wang et al., 2000). The present study has used mitochondrial Cytochrome c Oxidase
subunit I (COI / cox1) gene and control region (CR or D–loop) as genetic marker for
identification of Monopterus cuchia and Monopterus albus.
A. Cytochrome C oxidase (COI)
Cytochrome c Oxidase subunit I (COI / cox1) gene suppose to be evolving faster than
16S rDNA has widely been used in molecular taxonomy to resolve the phylogenetic
relationships within the family and also to study intraspecific population genetic structure
in several groups of eukaryotes including fishes.
B. Mitochondrial control region marker (CR or D–loop)
The D–loop segment exhibits a comparatively higher level of variation than protein–
coding sequences due to reduced functional constraints and relaxed selection pressure
(Saccone et al., 1987).
An attempt has been made in the present investigation to study the molecular
variation between two Synbranchid eel species- Monopterus cuchia and Monopterus
albus. The study represents the first hand information generation, includes field data

59
collection, sample collection and analyses including DNA isolation, PCR, sequencing of
selected genes of mtDNA (D-loop region and COI) followed by sequence-based
molecular genetic variation between Monopterus cuchia and Monopterus albus.
The existing nucleotide and protein sequence of COI (from GenBank and
UniProtKB) of five other eel shaped fishes belonging to the families Anguillidae
(Anguilla bengalensis) and Mastacembelidae (Mastacembelus armatus, Macrognathus
pancalus, Macrognathus aral, Macrognathus aculeatus) also included in the present
study, to establish the evolutionary relationships of Monopterus albus and Monopterus
cuchia with other eel species. The goal of the present study is to identify potential
molecular markers that is linked to different Monopterus species and thus could
specifically differentiate M. cuchia and M. albus, which are valuable in aqua agriculture.
6.2 MATERIALS AND METHODS
Materials and methods followed in this study are included in Chapter-III.
6.3 RESULTS
6.3.1 PCR amplification and sequencing
The DNA samples of purified PCR product gave ~650 bp COI gene fragment and ~ 600
bp D-loop regions, amplified in separate reaction set for each gene by using the specific
primer pairs. The representative gel images for the PCR amplification profile for
mitochondrial and nuclear genes are shown in Figure 6.1(A-B).
6.1(A). PCR amplification profile of COI (~650 bp)
[product size ~650 bp; Lane 1-6: M. cuchia, Lane 7-12: M. albus, 13. 100 base pair
ladder (1kb)]

60
6.1 (B). PCR amplification profile of D-loop region (~600 bp).
[product size ~600 bp; Lane 1-6: M. cuchia, Lane 7-12: M. albus, 13. 100 base pair
ladder (1kb)]
Figure 6.1 (A-B). Representative gel images for PCR amplicons of two genes.
6.3.2 Data mining and Sequence analysis
6.3.2.1 Comparative sequence analysis COI gene
The COI genes of the present study ranged from 605(COI of Anguilla bengalensis) to 655
(COI of Macrognathus pancalus and Macrognathus aral) nucleotide long with molecular
weight of 185.602 kDa (in A. bengalensis) to 200.758 kDa (in Macrognathus aral)
respectively. The melting temperature ranged from 83.40 (COI of A. bengalensis) to
84.49 (COI of M. albus) at 0.1M salt concentration (Table 6.1). The frequency of AT in
COI mRNA (cDNA) sequence in different fishes of the present study ranged between
0.522 (in COI of M. albus) to 0.615 (in COI of Monopterus cuchia). On the other hand
frequency of GC ranged from 0.385 (in COI gene of Monopterus cuchia) to 0.478 (in
COI gene of Monopterus albus) (Table 6.1). The COI gene sequences were found to be
A:T rich (Table 6.1; Figure 6.2). The transition/ transversion frequency for the
nucleotides of the COI gene are- A=>T = 0.05, A=>C = 0.04, A=>G= 0.1, T=>A = 0.04,
T=>C= 0.19, T=>G= 0.2, C=>A= 0.04, C=>T= 0.2, C=>G=0.02, G=>A= 0.19,
G=>T=0.05, G=>C=0.04. Multiple sequence alignment of COI gene in M. cuchia and M.
albus has been presented in Figure 6.3.

61
Table 6.1. Statistics of COI cDNA sequence in seven eel species.
Statistical parameter M. cuchia M. albus Anguilla
bengalensis
Mastacembelus
armatus
Macrognathus
pancalus
Macrognathus
aral
Macrognathus
aculeatus
Sequence
source/GenBank
Accession numbers
KR705867
(This study)
KR705873
(This study)
*JX887590
*JX983365
*FJ459512
*HQ219137
*JX260905
Length (bp) 652 655 605 652 655 655 651
MW in single
stranded condition
(kDa)
200.473 200.571 185.602 199.973 200.715 200.758 199.515
Melting temperature
(0C) [salt] = 0.1M
80.68 84.49 83.40 83.83 83.80 82.86 82.79
Frequency of A + T 0.615 0.522 0.549 0.538 0.539 0.562 0.564
Frequency of G + C 0.385 0.478 0.451 0.462 0.461 0.438 0.436
*Sequence sources: GenBank of NCBI
Figure 6.2. Nucleotide sequence composition in the COI cDNA sequence of M. cuchia
and M. albus.

62
Figure 6.3. Multiple sequence alignment of COI gene in M. cuchia and M. albus. The
sizes of the bar diagram represent the degree of conservation of respective amino acid in
each alignment position. ‘-’ represent no conserved sequence.
6.3.2.2 Comparative sequence analysis of D-loop region
The D-Loop region sequence of the present study ranged from 610 (in both the
Monopterus species) to 950 (in Danio rerio) nucleotide long with molecular weights of
195.84 kDa (in M. albus), 195.95 kDa (in M. cuchia) and 304.272 kDa (in Danio rerio)
respectively. The melting temperature was found to be 81.70 (in M. cuchia) and 82.04 (in
M. albus) at 0.1M salt concentration against Danio rerio (78.06) (Table 6.2). The

63
frequency of AT in D-loop region (cDNA) sequence ranged from 0.582 (in M. albus) to
0.679 (in Danio rerio). On the other hand frequency of GC ranged from 0.321 (in Danio
rerio) to 0.418 (in M. albus) (Table 6.2). The D-loop region was found to A: T rich (Table
6.2; Figure 6.4). The transition/ transversion frequency for the nucleotides of the D-loop
region are- A=>T = 0.06, A=>C = 0.04, A=>G= 0.11, T=>A = 0.06, T=>C= 0.11,
T=>G= 0.04, C=>A= 0.06, C=>T= 0.17, C=>G=0.04, G=>A= 0.17, G=>T=0.06,
G=>C=0.04. Multiple sequence alignment of D-loop region in M. cuchia and M. albus
has been depicted in Figure 6.5.
Table 6.2. Nucleotide sequence statistics of the D-loop region cDNA sequence in M.
cuchia and M. albus.
Statistical parameter M. cuchia M. albus
Sequence source/GenBank Accession numbers KR705891 (Present study) KR705897 (Present study)
Length (bp) 610 610
MW in single stranded condition (kDa) 195.95 195.84
Melting temperature (0C) [salt] = 0.1M 81.70 82.04
Frequency of A + T 0.590 0.582
Frequency of C + G 0.410 0.418
Figure 6.4. Nucleotide composition of mitochondrial D-loop region cDNA sequence of
M. cuchia and M. albus.

64
Figure 6.5. Multiple sequence alignment of D-loop region in M. cuchia and M. albus.
The sizes of the bar diagram represent the degree of conservation of respective amino
acid in each alignment position. ‘-’ represent no conserved sequence.

65
6.3.2.3 Comparative sequence analysis of COI protein
The sizes of protein sequences of COI enzyme in the present study ranged between 216
(COI of Anguilla bengalensis) to 518 (COI of M. albus) amino acids. The amino acids
Leucine (frequency=0.118 in M. albus to 0.157 in M. cuchia) followed by Alanine
(frequency=0.089 in M. albus to 0.111 in M. cuchia) have been found predominantly rich
in the COI of these two eel species (Figure 6.6). Sequence analysis of COI protein
revealed +ve hydropathy on average (0.722 in M. albus and 0.913 in M. cuchia) (Table
6.3; Figure 6.7). The molecular weight of COI in the present study ranged from 23.151
kDa (in COI of Monopterus cuchia) to 57.519 kDa (in COI of M. albus). The Isoelectric
point of the COI ranged between 4.94 to 6.23 (Table 6.3; Figure 6.8). The Instability
index of COI of the present study ranged from 23.92 to 27.49 (Table 6.3). The pair-wise
sequence alignment of amino acid sequence revealed following differences in M. albus
from M. cuchia - T=>M (at position 31), S=>C (at position 42), V=>I (at position 64) ,
S=>A and V=>I (at position 116 and 118 respectively), S=>G (at position 134), A=>S
and I=>V (at position 187 and 188 respectively) and V=>I (at position 193) (Figure 6.9).
Table 6.3. Physico-chemical analysis of COI protein
Statistical
parameter
M. cuchia M. albus Anguilla
bengalensis
Mastacembelus
armatus
Macrognathus
pancalus
Macrognathus
aral
Macrognathus
aculeatus
Sequence Source/
UniProtKB Accession number
This study This study *S4SNW0
*S4SMK7
*B1A2X4
*G3DQ16
*I1TM91
No. of amino acids (aa)
217 518
216 217 218 218 217
MW (kDa)
23.151 57.519 23.157 23.163 23.34 23.354 23.207
pI 4.94 6.23 6.02 4.94 4.94 4.94 4.94
-ve charged
residues
9
25
8
9
9
9
9
+ve charged residues
4
17
6
4
4
4
4
Formula C1084H1680N2
54O281S12 C2728H4056
N638O673S30 C1083H1654N256
O280S13 C1086H1684N254O28
2S1 C1096H1695N255O
284S11 C1097H1697N255O
284S11 C1088H1688N254O
283S11
II 24.45 26.78 27.49 23.92 24.74 24.25 24.31
AI 123.23 106.02 105.23 125.02 124.45 124.45 125.02
GRAVY 0.913 0.722 0.702 0.917 0.915 0.916 0.907
MW: Molecular weight; pI: Isoelectric point; II: Instability index; AI: Aliphatic index; GRAVY: Grand average of
hydropathicity. *Sequence Source: UniProtKB.

66
Figure 6.6. Amino acid distribution histogram of for COI protein of M. cuchia and M.
albus.
A. B.
Figure 6.7. Hydropathicity plot for COI (Kyte-Doolittle scale: Kyte and Doolittle, 1982).
A. M. cuchia, B. M. albus.

67
Figure 6.8. Electrical vs pH graph for COI between two eel species.
Figure 6.9. Multiple sequence alignment of COI protein in M. cuchia and M. albus. The
sizes of the bar diagram represent the degree of conservation of respective amino acid in
each alignment position. ‘-’ represent no conserved sequence.
6.3.3 Molecular evolution
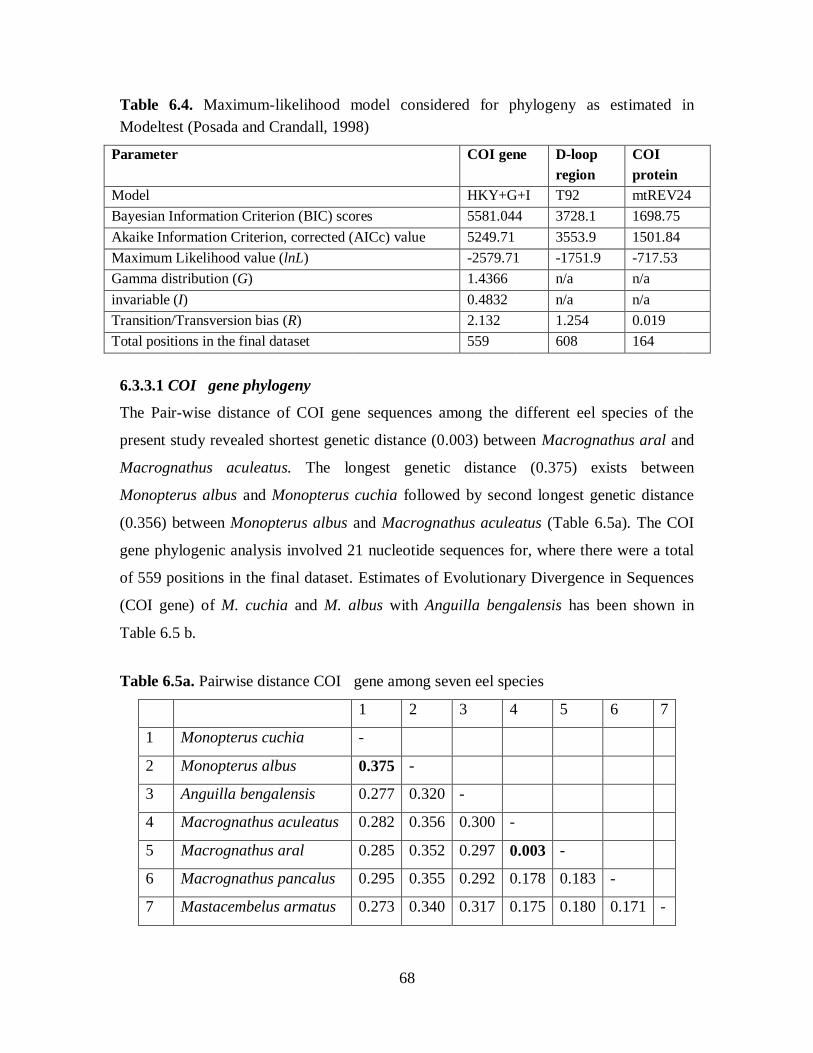
The Maximum-likelihood model parameters for data sets as estimated in Modeltest
(Posada and Crandall, 1998) are listed in Table 6.4. Pair-wise distances (P-distance) of
COI gene has been presented in Table 6.5a&b. P-distance of D-loop region gene and COI
protein have been depicted in the Tables 6.6 & 6.7 respectively. The bootstrap consensus
tree inferred from 1000 replicates was taken to represent the evolutionary history of the
taxa analyzed (Felsenstein, 1985).
68
Table 6.4. Maximum-likelihood model considered for phylogeny as estimated in
Modeltest (Posada and Crandall, 1998)
Parameter COI gene D-loop
region
COI
protein
Model HKY+G+I T92 mtREV24
Bayesian Information Criterion (BIC) scores 5581.044 3728.1 1698.75
Akaike Information Criterion, corrected (AICc) value 5249.71 3553.9 1501.84
Maximum Likelihood value (lnL) -2579.71 -1751.9 -717.53
Gamma distribution (G) 1.4366 n/a n/a
invariable (I) 0.4832 n/a n/a
Transition/Transversion bias (R) 2.132 1.254 0.019
Total positions in the final dataset 559 608 164
6.3.3.1 COI gene phylogeny
The Pair-wise distance of COI gene sequences among the different eel species of the
present study revealed shortest genetic distance (0.003) between Macrognathus aral and
Macrognathus aculeatus. The longest genetic distance (0.375) exists between
Monopterus albus and Monopterus cuchia followed by second longest genetic distance
(0.356) between Monopterus albus and Macrognathus aculeatus (Table 6.5a). The COI
gene phylogenic analysis involved 21 nucleotide sequences for, where there were a total
of 559 positions in the final dataset. Estimates of Evolutionary Divergence in Sequences
(COI gene) of M. cuchia and M. albus with Anguilla bengalensis has been shown in
Table 6.5 b.
Table 6.5a. Pairwise distance COI gene among seven eel species
1 2 3 4 5 6 7
1 Monopterus cuchia -
2 Monopterus albus 0.375 -
3 Anguilla bengalensis 0.277 0.320 -
4 Macrognathus aculeatus 0.282 0.356 0.300 -
5 Macrognathus aral 0.285 0.352 0.297 0.003 -
6 Macrognathus pancalus 0.295 0.355 0.292 0.178 0.183 -
7 Mastacembelus armatus 0.273 0.340 0.317 0.175 0.180 0.171 -

69
Table 6.5b. Evolutionary Divergence in COI gene sequences of M. cuchia and M. albus
with Anguilla bengalensis.
1 2 3 4 5 6 7 8 9 10 11 12 13
1 Monopterus cuchia 1
2 Monopterus cuchia 2 0.000
3 Monopterus cuchia 3 0.004 0.004
4 Monopterus cuchia 4 0.004 0.004 0.000
5 Monopterus cuchia 5 0.005 0.005 0.002 0.002
6 Monopterus cuchia 6 0.005 0.005 0.002 0.002 0.000
7 Monopterus albus 1 0.405 0.405 0.406 0.406 0.406 0.406
8 Monopterus albus 2 0.405 0.405 0.406 0.406 0.406 0.406 0.000
9 Monopterus albus 3 0.405 0.405 0.406 0.406 0.406 0.406 0.000 0.000
10 Monopterus albus 4 0.405 0.405 0.406 0.406 0.406 0.406 0.000 0.000 0.000
11 Monopterus albus 5 0.405 0.405 0.406 0.406 0.406 0.406 0.000 0.000 0.000 0.000
12 Monopterus albus 6 0.400 0.400 0.400 0.400 0.400 0.400 0.002 0.002 0.002 0.002 0.002
13 Anguilla bengalensis
JX887590
0.285 0.285 0.281 0.281 0.285 0.285 0.359 0.359 0.359 0.359 0.359 0.354 -
A. The evolutionary history of COI gene was inferred using the Maximum Parsimony
method. Tree-1 out of 9 most parsimonious trees (length = 419) is shown. The
consistency index is (0.702128), the retention index is (0.891892), and the composite
index is 0.653486 (0.626222) for all sites and parsimony-informative sites. The MP tree
was obtained using the Sub-tree-Pruning-Regrafting (SPR) algorithm (Nei and Kumar,
2000) (Figure 6.10-A).
B. The evolutionary history was inferred by using the Maximum Likelihood method
based on the Hasegawa-Kishino-Yano model (Hasegawa et al., 1985). The tree with the
highest log likelihood (-2588.6145) is shown. Initial tree(s) for the heuristic search were
obtained by applying the Neighbor-Joining method to a matrix of pairwise distances
estimated using the Maximum Composite Likelihood (MCL) approach. A discrete
Gamma distribution was used to model evolutionary rate differences among sites [5
categories (+G, parameter = 0.6077)]. The rate variation model allowed for some sites to
be evolutionarily invariable ([+I], 48.2788% sites) (Figure 6.10-B).

70
A.
B.
Figure 6.10. COI gene-based phylogenetic profile of M. cuchia and M. albus among seven eel
species. A. Maximum Parsimony tree, B. Maximum Likelihood tree. The percentage of replicate
trees in which the associated taxa clustered together in the bootstrap test (1000 replicates) is shown next to the branches (Felsenstein, 1985).
FJ459508 Monopterus cuchia
FJ459510 Monopterus cuchia
FJ459509 Monopterus cuchia
FJ459511 Monopterus cuchia
KF742427 Monopterus cuchia
AP002945 Monopterus albus
JX260828 Anguilla bengalensis bengalensis
JX887590 Anguilla bengalensis bengalensis
JX260829 Anguilla bengalensis bengalensis
EU417776 Macrognathus pancalus
FJ459512 Macrognathus pancalus
EU417778 Macrognathus pancalus
JX260905 Macrognathus aculeatus
JQ667548 Macrognathus aculeatus
HQ219137 Macrognathus aral
HQ219136 Macrognathus aral
JX260906 Macrognathus aculeatus
HQ219135 Macrognathus aral
JX983365 Mastacembelus armatus
JX983364 Mastacembelus armatus
JX260912 Mastacembelus armatus
99
93
86
100
100
94
100
79
76
78
93
100
100
99
100
78
100
100
HQ219136 Macrognathus aral
HQ219135 Macrognathus aral
JQ667548 Macrognathus aculeatus
JX260906 Macrognathus aculeatus
HQ219137 Macrognathus aral
JX260905 Macrognathus aculeatus
FJ459512 Macrognathus pancalus
EU417778 Macrognathus pancalus
EU417776 Macrognathus pancalus
JX260912 Mastacembelus armatus
JX983365 Mastacembelus armatus
JX983364 Mastacembelus armatus
KF742427 Monopterus cuchia
FJ459511 Monopterus cuchia
FJ459509 Monopterus cuchia
FJ459508 Monopterus cuchia
FJ459510 Monopterus cuchia
JX260828 Anguilla bengalensis bengalensis
JX887590 Anguilla bengalensis bengalensis
JX260829 Anguilla bengalensis bengalensis
AP002945 Monopterus albus
92
100
87
71
81
100
100
96
100
100
69
99
100
59

71
The COI gene MP tree formed two distinct clades and revealed that M. cuchia is a
sister taxa of A. bengalensis plus M. albus with 100% bootstrap support. Macrognatus
pancalus in their successive sister taxa for ming a distinct clade. The second clade is
formed by Magrognathus aculeatus and Macrognathus aral (boot strap support 100%)
plus Mastacembelus armatus as their successive sister taxa (100% bootstrap support)
(Figure 6.10-A).
The COI gene ML tree also formed two distinct clades with bootstrap support
99%. The first clade is formed by Macrognathus aral plus M. aculeatus followed by
Macrognathus pancalus plus Mastacembelus armatus (bootstrap support 100%) as their
successive sister taxa. The second calde is formed by Monopterus cuchia (bootstrap
support 100%) followed by A. bengalensis plus Monopterus albus as its successive sister
taxa. (Figure 6.10-B).
Figure 6.11 showed the evolutionary history based on COI gene of 12
Monopterus taxon sampled from Assam and Manipur, inferred using the Maximum
Parsimony method. Tree-1 out of 104 most parsimonious trees (length = 224) is shown.
The consistency index is (0.961905), the retention index is (0.989757), and the composite
index is 0.954408 (0.952052) for all sites and parsimony-informative sites (in
parentheses). The percentage of replicate trees in which the associated taxa clustered
together in the bootstrap test (1000 replicates) is shown next to the branches (Felsenstein,
1985). The analysis involved 15 nucleotide sequences. There were a total of 559
positions in the final dataset. The analysis included three Anguilla bengalensis sequences
of GenBank as outgroup.
The analysis COI gene phylogeny showed that Monopterus cuchia and
Monopterus albus are two evolutionarily distinct species having common ancestor. They
formed two distinct clades in the phylogenetic tree with bootstrap percentage 99 (Figure
6.11). This two species are having evolutionary distinctness with Anguilla bengalensis
(bootstrap value 96). Within the Monopterus cuchia populations, the samples of
population-4 (M. cuchia 1-3) formed distinct clades from population-2 (M. cuchia 4-6)
with bootstrap separation 84%, which indicates the possibility of existence of two
subspecies in Monopterus cuchia. Within the clades of the genus M. albus differences
exists in evolutionary distance (Figure 6.11).

72
Figure 6.11. Maximum Parsimony-based phylogenetic tree of COI gene in the
Monopterus taxa collected from Assam and Manipur.
6. 3.3.2 D-loop phylogeny
The Pair-wise distance of D-loop region sequences among the different eel species of the
present study revealed the presence of genetic distance (0.013) within the Monopterus
cuchia samples collected from population-4 and population-2 (Table 6.6). Between
Monopterus cuchia and Monopterus albus samples, highest genetic distance (0.062)
exists between M. cuchia 4, 5, 6 (population-2) and M. albus-10, 11, 12 (Manipur)
populations. The longest genetic distance (0.810) exists between the outgroup sequence
Danio rerio and M. cuchia 4, 5, 6 (population-2 and 3) (Table 6.6).

73
Table 6.6. Evolutionary Divergence in sequences of D-loop region
Sl.
No.
1 2 3 4 5 6 7 8 9 10 11 12 13
1 Monopterus cuchia 1 -
2 Monopterus cuchia 2 0.000
3 Monopterus cuchia 3 0.000 0.000
4 Monopterus cuchia 4 0.013 0.013 0.013
5 Monopterus cuchia 5 0.013 0.013 0.013 0.000
6 Monopterus cuchia 6 0.013 0.013 0.013 0.000 0.000
7 Monopterus albus 1 0.032 0.032 0.032 0.046 0.046 0.046
8 Monopterus albus 2 0.032 0.032 0.032 0.046 0.046 0.046 0.000
9 Monopterus albus 3 0.032 0.032 0.032 0.046 0.046 0.046 0.000 0.000
10 Monopterus albus 4 0.048 0.048 0.048 0.062 0.062 0.062 0.015 0.015 0.015
11 Monopterus albus 5 0.048 0.048 0.048 0.062 0.062 0.062 0.015 0.015 0.015 0.000
12 Monopterus albus 6 0.048 0.048 0.048 0.062 0.062 0.062 0.015 0.015 0.015 0.000 0.000
13 Danio rerio 0.789 0.789 0.789 0.810 0.810 0.810 0.790 0.790 0.790 0.804 0.804 0.804 -
The evolutionary history of Monopterus cuchia and Monopterus albus based on D-loop
region was inferred using the Maximum Parsimony method. Tree-1 out of 116 most
parsimonious trees (length = 321) is shown (Figure 6.12). The consistency index is
(0.980392), the retention index is (0.992308), and the composite index is 0.989216
(0.972851) for all sites and parsimony-informative sites (in parentheses). The percentage
of replicate trees in which the associated taxa clustered together in the bootstrap test
(1000 replicates) is shown next to the branches (Felsenstein, 1985). The MP tree was
obtained using the Close-Neighbor-Interchange algorithm (Nei and Kumar, 2000) with
search level 1 in which the initial trees were obtained with the random addition of
sequences (10 replicates). The analysis involved 13 nucleotide sequences. All positions
containing gaps and missing data were eliminated. There were a total of 608 positions in
the final dataset.

74
Figure 6.12. Maximum Parsimony tree of D-loop region in the Monopterus taxa
collected from Assam and Manipur.
The D-loop region based phylogenetic tree reveled that M. cuchia and M. albus are two
separate sister groups (bootstrap support 100%). Both in M. cuchia and M. albus taxon in
the tree showed sub-clades within the genus, indicating the possibility of existence of
sub-species in each of the species (Figure 6.12). Within the Monopterus cuchia
populations, the samples of population-4 (M. cuchia 1-3) formed a distinct clade
(bootstrap support 99%) from population-2 (M. cuchia 5-6) with bootstrap separation
100%, which indicates the possibility of existence of two subspecies in Monopterus
cuchia. Within the clade of the genus M. albus differences exists in evolutionary distance
and two distinct sub-clades are observed in bootstrap value 100% (Figure 6.12).
6.3.3.3 COI protein phylogeny
The Pairwise distance of COI protein sequences among the different eel species of the
present study revealed shortest genetic distance (0.001) between Macrognathus aral and
Macrognathus aculeatus. The longest genetic distance (0.177) exists between
Monopterus albus and Anguilla bengalensis (Table 6.7).

75
Table 6.7. Pairwise distance of COI protein among seven eel species
Sl. No. 1 2 3 4 5 6 7
1 Monopterus cuchia -
2 Monopterus albus 0.047 -
3 Anguilla bengalensis 0.150 0.177 -
4 Macrognathus aculeatus 0.028 0.072 0.166 -
5 Macrognathus aral 0.028 0.072 0.166 0.001 -
6 Macrognathus pancalus 0.038 0.082 0.166 0.014 0.014 -
7 Mastacembelus armatus 0.028 0.072 0.166 0.009 0.009 0.019 -
The phylogenetic analysis of COI protein involved 18 amino acid sequences. All
positions containing gaps and missing data were eliminated. There were a total of 164
positions in the final dataset.
A. The evolutionary history was inferred using the Maximum Parsimony method. Tree #1
out of 10 most parsimonious trees (length = 41) is shown. The consistency index is
(0.888889), the retention index is (0.965517), and the composite index is 0.918419
(0.858238) for all sites and parsimony-informative sites (in parentheses). The MP tree
was obtained using the Subtree-Pruning-Regrafting (SPR) algorithm (Nei and Kumar,
2000) with search level 1 in which the initial trees were obtained by the random addition
of sequences (10 replicates) (Figure 6.13-A).
B. The evolutionary history was inferred by using the Maximum Likelihood method
based on the General Reversible Mitochondrial + Freq. model (Adachi and Hasegawa,
1996). The tree with the highest log likelihood (-706.9901) is shown. The percentage of
trees in which the associated taxa clustered together is shown next to the branches. Initial
tree(s) for the heuristic search were obtained by applying the Neighbor-Joining method to
a matrix of pairwise distances estimated using a JTT (Jones-Taylor-Thornton) model
(Figure 6.13-B).

76
A.
B.
Figure 6.13. Molecular phylogenetic profile of M. cuchia and M. albus among different
bony fishes based on COI protein sequence. A. Maximum Parsimony tree, B. Maximum
Likelihood tree.
The COI protein MP tree formed two distinct clades and revaled that M. cuchia is
a successive sister taxa of A. bengalensis and M. albus. The second clade is formed by
Macrognathus aculeatus and Macrognathus aral plus Magrognathus aculeatus and
Q5N6D8 Anguilla bengalensis labiata
S4SNW0 Anguilla bengalensis bengalensis
U3LDB6 Anguilla bengalensis bengalensis
S4SMF3 Anguilla bengalensis bengalensis
Q94SG6 Monopterus albus
G8XSD9 Monopterus cuchia
W0I5X7 Monopterus cuchia
G8XSD6 Monopterus cuchia
S4SMK4 Macrognathus aculeatus
G3DQ16 Macrognathus aral
J7JZZ0 Macrognathus aral
I1TM91 Macrognathus aculeatus
B1A2X4 Macrognathus pancalus
G8XSE0 Macrognathus pancalus
G8XSE1 Macrognathus pancalus
S4SMK7 Mastacembelus armatus
M4QDG0 Mastacembelus armatus
B1A304 Mastacembelus armatus
100
91
84
93
87
I1TM91 Macrognathus aculeatus
G3DQ16 Macrognathus aral
J7JZZ0 Macrognathus aral
S4SMK4 Macrognathus aculeatus
B1A2X4 Macrognathus pancalus
G8XSE0 Macrognathus pancalus
G8XSE1 Macrognathus pancalus
S4SMK7 Mastacembelus armatus
B1A304 Mastacembelus armatus
M4QDG0 Mastacembelus armatus
G8XSD9 Monopterus cuchia
G8XSD6 Monopterus cuchia
W0I5X7 Monopterus cuchia
Q94SG6 Monopterus albus
U3LDB6 Anguilla bengalensis bengalensis
Q5N6D8 Anguilla bengalensis labiata
S4SMF3 Anguilla bengalensis bengalensis
S4SNW0 Anguilla bengalensis bengalensis66
100
79
98
57
87
82
91
51
65
50

77
Macrognathus aral (boot strap support 893%) followed by Mastacembalus armatus as
their successive sister taxa (87% bootstrap support) (Figure 6.13-A).
The COI protein ML tree also formed two major clades and revaled that
Macrognathus aculeatus and Macrognathus aral are having close evolutionary
relationship, Macrognathus puncalus is their sister taxa and these three taxa formed a
clade with their successive sister taxon Mastacembelus armatus (bootstap support 91%).
The second clade is formed by Monopterus cuchia followed by its successive sister taxa
of M. albus and A. bengalensis (Figure 6.13-B).
6.3.4 Tertiary structures of COI from M. albus and M. cuchia
The tertiary structure of COI for M. cuchia has 9 helices, 15 helix-helix interacs, 10 beta
turns, 1 gamma turns, whereas the tertiary structure of COI for M. albus has 22 helices,
60 helix-helix interacs, 28 beta turns, 2 gamma turns(Figure 6.14 A-B). The ERRAT
verification revealed that the overall quality factor for the predicted tertiary structures of
COI is around 95%. ProCheck verification revealed structural accuracy as more than
90% of the aminoacid residues in the predicted 3D structures of COI are in the range of
most favoured region, which confirms the validity of the predicted structures (Figure
6.15). The functions of COI protein with respective ProFunc score are listed in Table 6.8.
A. B.
Figure 6.14. The tertiary structure of COI proteins from (A) M. cuchia, (B) M. albus displayed in
UCSF Chimera (Pettersen et al., 2004).

78
Figure 6.15: Ramachandran plot for backbone dihedral angles PSI (y) and PHI (f) for the
final structure of COI from A. Monopterus cuchia, B. Monopterus albus. The red region
represents the most favored region, yellow = allowed region, light yellow = generously
allowed region, white = disallowed region [ProCheck].

79
.
Table 6.8. Predicted functions of COI with respective ProFunc score (shown within
parenthesis)
Name
of the
Protei
n
Taxon
Protein name terms Gene Ontology (GO) terms
Cellular
component Biological
process
Biochemical
function
COI
M. cuchia
Oxidase (21.70), cytochrome (21.22),
cytochrome oxidase
(20.56), fragment
(8.12), state (5.28), reduced (3.60),
oxidized (2.87),
reduced state (2.39)
cell (29.01), cell part
(29.01),
membrane
(25.76), integral to
membrane
(24.67)
metabolic process (33.78), cellular
process (31.04),
cellular metabolic
process (29.05), oxidation
reduction (17.96)
catalytic activity (25.61),
transporter
activity (25.55),
transmembrane transporter
activity (25.55),
binding (24.74)
M. albus
Cytochrome (55.49),
oxidase (53.93),
cytochrome oxidase
(31.76), reduced (6.40), recombinant
(5.25), binding (4.00),
carbon (3.52), state (3.17)
membrane
(55.13), cell
(55.13) cell
part (55.13), integral to
membrane
(51.51)
metabolic process
(63.52), cellular
process (62.47),
cellular metabolic process (61.70),
oxidation
reduction (51.92)
catalytic activity
(62.74),
oxidoreductase
activity (51.92), metal ion binding
(51.61), binding
(51.61)
The sequences of D-loop region and COI genes have been successfully deposited to
GenBank Database of NCBI and Accession number has been obtained for each submitted
sequence (Table 6.9 of Annexure-I). The protein structure of COI of M. cuchia and M.
albus have been deposited to the Protein Model Database (PMDB) and PMDB-ID has
been assigned to each submitted structures (Table 6.10 of Annexure-I).
6.4 DISCUSSION
Efficient identification of the two Synbranchid eel species of the present study is critical
for aquaculture management as well as for eel conservation (Dudu et al., 2010). Thus,
identification of M. cuchia and M. albus has been supported by molecular
characterization in the present study instead of conventional methods (Huang, et al.,
2001). The present study has revealed an interesting point of difference for identification
of the two Synbranchid species that the cDNA sequence COI-gene of M. cuchia is more
A: T rich than that of M. albus (Figure 6.1). Moreover the COI protein of M. cuchia has
more Lucine (L) and Alananine (A) residues frequency than that of M. albus (Figure 6.3).

80
The Instability index in COI is in the range of stable molecule. The hydropathicity plot
(Figure 6.7) revealed that the COI protein is hydrophobic in nature. The COI gene of
present study has showed higher transversion frequency than the transition frequency for
the nucleotides of the eel species (A=>G= 0.1, G=>A= 0.19). The graph of electrical
charge as a function of pH for COI (Figure 6.8) revealed significant differences in the
Isoelectric points of M. cuchia (pI =4.94) and M. albus (pI = 6.23). The pair-wise
sequence alignment of amino acid sequence revealed 10 specific positions where amino
acid sequence differences exist between M. albus from M. cuchia (Figure 6.10).
Both Monopterus albus and Monopterus cuchia are regarded as species complex
and demands taxonomic revision (Dahanukar, 2010; IUCN, 2013). However, in the
present study, the genetic distance of COI gene (0.375) revealed that the two Monopterus
albus and Monopterus cuchia are not within a species complex but they are two well
established distantly related species. The COI gene MP tree revealed that M. albus has
more close evolutionary relationship with A. bengalensis than that of M. cuchia and M.
albus (Figure 6.11-A).The COI gene ML tree also revealed more evolutionary close
relatedness between A. bengalensis and Monopterus albus than that of M. albus and M.
cuchia (Figure 6.11-B).
The analysis COI gene phylogeny showed that Monopterus cuchia and
Monopterus albus are two evolutionarily distinct species rather than a species complex.
The high bootstrap value (84%) separation of population-4 (M. cuchia 1-3) and
population-2 (M. cuchia 4-6) in the phylogenetic tree strongly indicates the possibility of
existence of two subspecies within Monopterus cuchia. (Figure 6.12).
The high bootstrap value in the D-loop region based phylogenetic tree also
supports that M. cuchia and M. albus are two separate species (bootstrap support 100%)
(Figure 6.13). Within the Monopterus cuchia populations, population-4 (M. cuchia 1-3)
and population-2 (M. cuchia 5-6) showed evolutionary distinctness by forming two
distinct sub-clades (bootstrap separation 100%. This clearly supports the finding of COI
gene based phylogeny that there is higher possibility of existence of two subspecies in
Monopterus cuchia (Figure 6.13).The M. albus also shows evolutionary distance by
forming two distinct sub-clades and the bootstrap value 100% indicates the possibility of
existence of two subspecies within this species (Figure 6.13).

81
The MP tree of COI protein revealed distinct evolutionary profile of M. cuchia
and M. albus and out of this two species M. albus has a very close evolutionary
relationship with Anguilla bengalensis) (Figure 6.14-A).The ML tree of COI protein
revealed that M. albus has a very close evolutionary relationship with Anguilla
bengalensis than that of M. cuchia of the same genus. All the phylogenetic trees revealed
an interesting point that Monopterus cuchia (family- Synbranchidae) is intermediate taxa
of the taxa belonging to family Mastacembelidae and ‘Anguillidae plus Synbranchidae’
(Figure 6.14B). The tertiary structures of COI are found to be structurally conserved and
revealed that COI is an alpha-domain protein.
6.5 CONCLUSION
Understanding of genetic relationships between the two species of eels under the genus
Monopterus is listed as high priority in the IUCN record (IUCN, 2013). The present study
based on mitochondrial D-loop and COI clearly revealed that M. cuchia and M. albus are
two distinct species. However the D-loop and COI gene based phylogenetic tree revealed
that both the species M. cuchia and M. albus might have two sub-species within each
species. Further, phylogeographic study based on sampling in large geographic area
along their distribution ranges will help to establish such sub-speciation. The present
study will certainly be helpful in understanding genetic variation between M. cuchia and
M. albus and will clarify taxonomic uncertainties (Dahanukar, 2010) mentioned by
earlier workers. Further, a microsatellite based studies on northeast Indian population of
Monopterus species complex by the present authors (unpublished data) also showed
genetic distinctness of M. cuchia and M. albus rather than a species complex.
------------