Identification of high-risk regions for schistosomiasis in the Guichi region of China: an adaptive...
8
Identification of high-risk regions for schistosomiasis in the Guichi region of China: an adaptive kernel density estimation-based approach ZHI-JIE ZHANG 1,2,3 *, TILMAN M. DAVIES 4 , JIE GAO 1,2,3 , ZENGLIANG WANG 1,2,3 and QING-WU JIANG 1,2 1 Department of Epidemiology, School of Public Health, Fudan University, Shanghai 200032, People’s Republic of China 2 Key Laboratory of Public Health Safety, Ministry of Education, Shanghai 200032, People’s Republic of China 3 Laboratory for Spatial Analysis and Modelling, School of Public Health, Fudan University, Shanghai 200032, People’s Republic of China 4 Department of Statistics, Institute of Fundamental Sciences, Massey University, Private Bag 11222, Palmerston North, New Zealand (Received 20 August 2012; revised 25 December 2012 and 4 January 2013; accepted 8 January 2013; first published online 7 March 2013) SUMMARY Identification of high-risk regions of schistosomiasis is important for rational resource allocation and effective control strategies. We conducted the first study to apply the newly developed method of adaptive kernel density estimation (KDE)- based spatial relative risk function (sRRF) to detect the high-risk regions of schistosomiasis in the Guichi region of China and compared it with the fixed KDE-based sRRF. We found that the adaptive KDE-based sRRF had a better ability to depict the heterogeneity of risk regions, but was more sensitive to altering the user-defined smoothing parameters. Specifically, the impact of bandwidths on the estimated risk value and risk significance (P value) was higher for the adaptive KDE-based sRRF, but lower on the estimated risk variation standard error (S.E.) compared with the fixed KDE-based sRRF. Based on this application the adaptive and fixed KDE-based sRRF have their respective advantages and disadvantages and the joint application of the two approaches can warrant the best possible identification of high-risk subregions of diseases. Key words: schistosomiasis, kernel density estimation, spatial analysis, spatial epidemiology. INTRODUCTION Schistosomiasis japonica is a snail-transmitted para- sitic disease that has existed in mainland China for over 2000 years (Zhang et al. 2009b; Zhou et al. 2010). It remains a major public health problem in China (Peng et al. 2010; Zhou et al. 2010) and the total number of infected people in 2004 was still around 726 000 (Zhou et al. 2007). The extensive habitat of Oncomelania hupensis (the sole intermediate host of Schistosoma japonicum), decreased compliance rate, and the unsustainable effects of chemotherapy, re- duced financial supports, frequent floods and climate change have resulted in the rebound of epidemics in many areas of China, even in the places where it met the criteria of transmission interruption (Zhang et al. 2008, 2009a). Hence, the importance of a sustainable control strategy for schistosomiasis has been fre- quently emphasized (Utzinger et al. 2003, 2009), which is a great challenge for China’s current schistosomiasis control. The identification of high- risk regions of schistosomiasis is always an important first step for an effective and sustainable strategy (Zhang et al. 2009a, b) and many spatial statistical methods have been explored with this objective in mind. Among others, the approach of kernel density estimation (KDE) has attracted much attention because of its minimal assumptions on the under- lying data structure and flexibility of application (Bithell, 1990, 1991; Kelsall and Diggle, 1995a, b). As an example, Galvao and coworkers used the tech- nique of KDE to compare the spatial pattern of Schistosoma mansoni before and after treatment with different doses of praziquantel (Galvao et al. 2010). However, understanding the spatial variation of disease risk per se requires the researcher(s) to not only examine the spatial distribution of disease ‘cases’, but also the distribution of the at-risk individuals (the ‘controls’) in order to adjust for any natural non-homogeneity in the underlying popu- lation (Zhang et al. 2009a; Davies and Hazelton, 2010). This motivated the development of the KDE- based spatial relative risk function (sRRF) for spatial case-control designed studies (Bithell, 1990, 1991). Many successful applications in spatial epidemiology * Corresponding author: Department of Epidemiology, School of Public Health, Fudan University, Shanghai 200032, People’s Republic of China. Tel: + 86 21 54237410. Fax: + 86 21 54237410. E-mail: epistat@gmail. com 868 Parasitology (2013), 140, 868–875. © Cambridge University Press 2013 doi:10.1017/S0031182013000048
Transcript of Identification of high-risk regions for schistosomiasis in the Guichi region of China: an adaptive...
Identification of high-risk regions for schistosomiasis in theGuichi region of China: an adaptive kernel densityestimation-based approach
ZHI-JIE ZHANG1,2,3*, TILMAN M. DAVIES4, JIE GAO1,2,3, ZENGLIANG WANG1,2,3
and QING-WU JIANG1,2
1Department of Epidemiology, School of Public Health, Fudan University, Shanghai 200032, People’s Republic of China2Key Laboratory of Public Health Safety, Ministry of Education, Shanghai 200032, People’s Republic of China3Laboratory for Spatial Analysis and Modelling, School of Public Health, Fudan University, Shanghai 200032,People’s Republic of China4Department of Statistics, Institute of Fundamental Sciences, Massey University, Private Bag 11222, Palmerston North,New Zealand
(Received 20 August 2012; revised 25 December 2012 and 4 January 2013; accepted 8 January 2013; first published online 7 March 2013)
SUMMARY
Identification of high-risk regions of schistosomiasis is important for rational resource allocation and effective controlstrategies. We conducted the first study to apply the newly developed method of adaptive kernel density estimation (KDE)-based spatial relative risk function (sRRF) to detect the high-risk regions of schistosomiasis in the Guichi region of Chinaand compared it with the fixed KDE-based sRRF. We found that the adaptive KDE-based sRRF had a better ability todepict the heterogeneity of risk regions, but was more sensitive to altering the user-defined smoothing parameters.Specifically, the impact of bandwidths on the estimated risk value and risk significance (P value) was higher for the adaptiveKDE-based sRRF, but lower on the estimated risk variation standard error (S.E.) compared with the fixed KDE-basedsRRF. Based on this application the adaptive and fixed KDE-based sRRF have their respective advantages anddisadvantages and the joint application of the two approaches can warrant the best possible identification of high-risksubregions of diseases.
Key words: schistosomiasis, kernel density estimation, spatial analysis, spatial epidemiology.
INTRODUCTION
Schistosomiasis japonica is a snail-transmitted para-sitic disease that has existed in mainland China forover 2000 years (Zhang et al. 2009b; Zhou et al. 2010).It remains a major public health problem in China(Peng et al. 2010; Zhou et al. 2010) and the totalnumber of infected people in 2004 was still around726000 (Zhou et al. 2007). The extensive habitat ofOncomelania hupensis (the sole intermediate host ofSchistosoma japonicum), decreased compliance rate,and the unsustainable effects of chemotherapy, re-duced financial supports, frequent floods and climatechange have resulted in the rebound of epidemics inmany areas of China, even in the places where it metthe criteria of transmission interruption (Zhang et al.2008, 2009a). Hence, the importance of a sustainablecontrol strategy for schistosomiasis has been fre-quently emphasized (Utzinger et al. 2003, 2009),which is a great challenge for China’s current
schistosomiasis control. The identification of high-risk regions of schistosomiasis is always an importantfirst step for an effective and sustainable strategy(Zhang et al. 2009a,b) and many spatial statisticalmethods have been explored with this objective inmind. Among others, the approach of kernel densityestimation (KDE) has attracted much attentionbecause of its minimal assumptions on the under-lying data structure and flexibility of application(Bithell, 1990, 1991;Kelsall andDiggle, 1995a,b). Asan example, Galvao and coworkers used the tech-nique of KDE to compare the spatial pattern ofSchistosoma mansoni before and after treatment withdifferent doses of praziquantel (Galvao et al. 2010).However, understanding the spatial variation ofdisease risk per se requires the researcher(s) to notonly examine the spatial distribution of disease‘cases’, but also the distribution of the at-riskindividuals (the ‘controls’) in order to adjust for anynatural non-homogeneity in the underlying popu-lation (Zhang et al. 2009a; Davies and Hazelton,2010). This motivated the development of the KDE-based spatial relative risk function (sRRF) for spatialcase-control designed studies (Bithell, 1990, 1991).Many successful applications in spatial epidemiology
* Corresponding author: Department of Epidemiology,School of Public Health, Fudan University, Shanghai200032, People’s Republic of China. Tel: +86 2154237410. Fax: +86 21 54237410. E-mail: [email protected]
868
Parasitology (2013), 140, 868–875. © Cambridge University Press 2013doi:10.1017/S0031182013000048
of KDE-based sRRF have been reported, e.g. motorneurone disease (Sabel et al. 2000), biliary cirrhosis(Prince et al. 2001), childhood leukaemia (Wheeler,2007) and Aujeszky’s disease (Berke and GrosseBeilage, 2003). In the field of schistosomiasis, Zhanget al. were the first to apply the KDE-based sRRF toassess the risk of S. japonica in the Guichi region ofAnhui province in China (Zhang et al. 2009a).Historically, most implementations of the sRRF
have made use of a fixed bandwidth or smoothingparameter in kernel estimation of the densities, wherethe amount of smoothing applied to the estimator isconstant, regardless of location. It is generally wellunderstood that spatial distributions of human popu-lations tend to be quite heterogeneous due to com-mon geographical features (towns, rivers, etc.). Thisspatial variation means that it is worth utilizing apotentially beneficial adaptive approach. One suchadaptive KDE approach, first discussed in depth byAbramson (1982), assigns less smoothing to denselyclustered observations in order to preserve spatialdetail where there is an abundance of data, andallocates more smoothing to isolated observations inan effort to avoid assigning undue density ‘height’ toareas wherewe do not have as much information. Theadaptive KDE-based sRRF was first investigated byDavies and Hazelton (2010), who found boththeoretical and practical advantages over the fixedKDE-based sRRF, and has found a successfulapplication in a study about subclinical Salmonellainfection in finisher pig herds (Benschop et al. 2008).The present study aims to apply this novel ap-
proach of adaptive KDE-based sRRF to detect high-risk regions of schistosomiasis in the Guichi regionof China, and compare it with the method of fixedKDE-based sRRF. Generally, the obtained resultscan shed lighton rational applications of adaptiveKDE-based sRRF to identify disease-risk regions.Specifically, the results can aid in the design of moreefficient schistosomiasis control strategies in the localregion.
MATERIALS AND METHODS
Data sources
The study site was the Guichi region of Anhuiprovince in eastern China and the study design wasspatial case-control. Acute schistosomiasis cases frompermanent residents between 1 January 2001 and31 December 2006 were retrospectively collectedfrom local schistosomiasis-specific hospitals andvillage-level clinics. The same number of controlswas randomly chosen to represent the background at-risk population pattern using the sampling approachof the probability proportion to size. All the spatialcoordinates of cases and controls were first obtainedin the field using the hand-held global positioningsystem (GPS) (MobileMapper, Thales Navigation,
Inc., USA) and then the spatial analysis databasefor schistosomiasis was created using the ArcGIS9.2software (Environmental Systems ResearchInstitute, Redlands, CA, USA). See our previousreports for detailed descriptions of the study area andthe database (Zhang et al. 2008, 2009a).
Statistical analysis
Let x1, x2,. . ., xn1 denote the coordinates of n1schistosomiasis cases in Guichi region. The (bivari-ate) kernel density estimate thereof is written as(Davies and Hazelton, 2010),
f (x) = 1n1
∑n1i=1
1
h(xi)2K
x− xixi
( )(1)
whereK is a radially symmetrical probability densityfunction (the kernel) and h(·) is the bandwidth orsmoothing parameter controlling the smoothness ofthe density estimator.The bivariate Gaussian kernel is implemented for
the current analysis, as the infinite tails of this func-tion are useful in areas with sparse data. For the fixed-bandwidth approach, h(·)=hfix (i.e. simply a scalarconstant). We defined the bandwidth function of theadaptive kernel estimator as (Terrell, 1990; Daviesand Hazelton, 2010),
h(u) = h0 f (u)1/2∏n1i=1
f (xi)−1/2
( )1/n1
−1
(2)
where h0 is the global bandwidth. In practice we mustreplace the unknown density function f in equation(2) with a pilot estimate f , which is itself a fixed-bandwidth kernel estimate of the observed data withsmoothing parameter hfix = h; referred to as the pilotbandwidth.Now let y1, y2,. . ., yn2 denote the coordinates of n2
sampled controls. Conditional on the sample sizes ofn1 cases and n2 controls, the sRRF is defined as thedensity ratio of cases and controls (Bithell, 1990),
r(x) = logf (x)g(x) (3)
where, f and g are the kernel estimates from equation(1) of the case and control data, respectively (eitherfixed or adaptive). The density ratio is transformed tothe log scale in order to make symmetrical thetreatment of the two estimates and stabilize numeri-cal results (Kelsall and Diggle, 1995a, b). Owing tothe fact that the data have been collected with respectto a finite geographical region, we also employ edge-correction techniques described by Diggle (1985)(fixed) and Marshall and Hazelton (2010) (adaptive)for f and g to reduce the boundary biases.In terms of assigning the bandwidths, we use a
common fixed bandwidth (i.e. hfix,(f ) = hfix,(g) = hfix)for the fixed KDE-based sRRF, and a common
869High-risk regions for schistosomiasis in the Guichi region of China
global bandwidth h0,(f ) = h0,(g) = h0 for the adaptiveKDE-based sRRF. This is due to a resulting first-order bias cancellation in areas where f%g (Kelsalland Diggle, 1995a). The pilot bandwidths in theadaptive KDE-based sRRF, however, are computedseparately for the case and control data in order toassist in preserving any specific detail of use for thepilot densities and variable bandwidth calculations.
In the examination of the adaptive KDE-basedsRRF, Davies and Hazelton (2010) made use of 2data-driven bandwidth selection methods for esti-mation of the fixed, global and pilot bandwidths. Thefirst, based on an ‘oversmoothing’ principle de-scribed by Terrell (1990), was elected due to itspotential to control excess variability in the estimateddensities. We refer to it as ‘OS’. The second is theleast-squares cross-validation (LSCV) approach asdescribed by Bowman and Azzalini (1997). Werepeated these calculation methods for analysis ofthe schistosomiasis data, with hfix/OS in the fixedKDE-based sRRF (based on the pooled case-controlcoordinates), and h0/OS (again based on the pooledcase-control data) and h(f ) � LSCV, h(g) � LSCV(based on the case and control data, separately) in theadaptive KDE-based sRRF.
The risk functions estimated by equation (3) aresimply point estimates of the observed (log-)risks. Naturally, it is of interest to be able to dis-tinguish any statistically significant risk regionsfrom non-significant risk regions. To avoid an over-interpretation of the results, tolerance contours basedon a pointwise p-value surface (and drawn at asignificance level of α=0·05) were applied from thestatistical test searching for elevated risk (i.e. withrespect to the hypotheses H0= r(x)=0; H1 : r(x)>0,where r denotes the ‘true’ log-risk surface).
Two different approaches were used to obtain thep values in each point. The first method is theMonte-Carlo (MC) randomization test based on permu-tations of the case-control labels in each point(Kelsall and Diggle, 1995a, b). First, the case andcontrol location data are pooled; then n1 points werere-sampled without replacement to represent thesimulated cases and the remaining n2 points wereused as the simulated controls. The fixed and adap-tive KDE-based sRRF was then repeatedly appliedon these simulated datasets. The whole process wasreplicated 999 times to obtain the simulated riskvalues (r*1(x), r*2(x),. . ., r*999(x)). For each point, we get1 observed r(x) and 999 simulated r*i (x), so thep-value at each point based on MC method wasobtained by the formula,
p = 1+∑999i=1
I(r(x) ≥ r∗i (x))( )
/1000 (4)
where, I( ) is the indicator function. The secondmethod is the z-test statistic-based asymptoticnormality test (ASYN) introduced by Hazelton and
Davies (2009) for the fixed KDE-based sRRF andDavies and Hazelton (2010) for the adaptive KDE-based sRRF. In this approach, the authors exploitedapproximations to the variances of the fixed andadaptive KDE-based sRRF in order to construct teststatistics z(x) at each location x. The p-value surface isthen computed easily with respect to the aforemen-tioned hypotheses, as under the asymptotic theory ofthe kernel estimator z(x)*N(0,1), where N(0,1) de-notes the standard normal distribution. The authorsfound this technique to be significantly computa-tionally cheaper than the MC method (especially forlarge datasets), and it also seemed to avoid someinstability in the resulting tolerance contours.
To further investigate the variation of estimatedrisks, the point-wise standard error (S.E.) surfaces wasgenerated for both MC and ASYN approaches,empirically over the iterated results for the formerand via the asymptotic variance for the latter.
For the sensitivity analysis, different bandwidths(based on halving and doubling the appropriate OSor LSCV bandwidths) for adaptive and fixed KDE-based sRRF were also used and are displayed in theSupplementary appendix (online version only) as laidout in Table 1. For each of the various bandwidthcombinations, MC and ASYN tests were applied toobtain the corresponding p-value and S.E. surfacesfor delineating the significant schistosomiasis risksubregions and associated variation.
All computations and images were produced in theR software (Davies et al. 2011).
RESULTS
In total, 83 acute schistosomiasis cases were collectedand 83 controls were sampled for the schistosomiasisdataset, which is described elsewhere (Zhang et al.2008, 2009a). Here, only the results from adaptiveKDE-based sRRF and its comparisons with fixedKDE-based sRRF are reported.
Figure 1 shows the estimated values of adaptiveand fixed KDE-based sRRF using the automaticallydetermined optimumbandwidths, and the significanttolerance contours from asymptotic normality andMC tests were superimposed upon the density maps.The adaptive KDE-based sRRF estimated higherrisks on the high-risk regions (e.g. significant riskregions) and lower risks on the low-risk regions(e.g. nonsignificant risk regions) than the fixedKDE-based sRRF.
For the fixed bandwidth contours, we observedlittle difference for the contours corresponding to theASYN and MC methods of computation. Two clearsubregions of interest were identified, one on thenorthern border where the QiupuRiver feeds into theYangtze River, and the other in the southeasterncorner. The ASYN andMC contour methods for theadaptive KDE-based sRRF, however, are moredistinct. The adaptive-surface ASYN contours
870Zhi-Jie Zhang and others
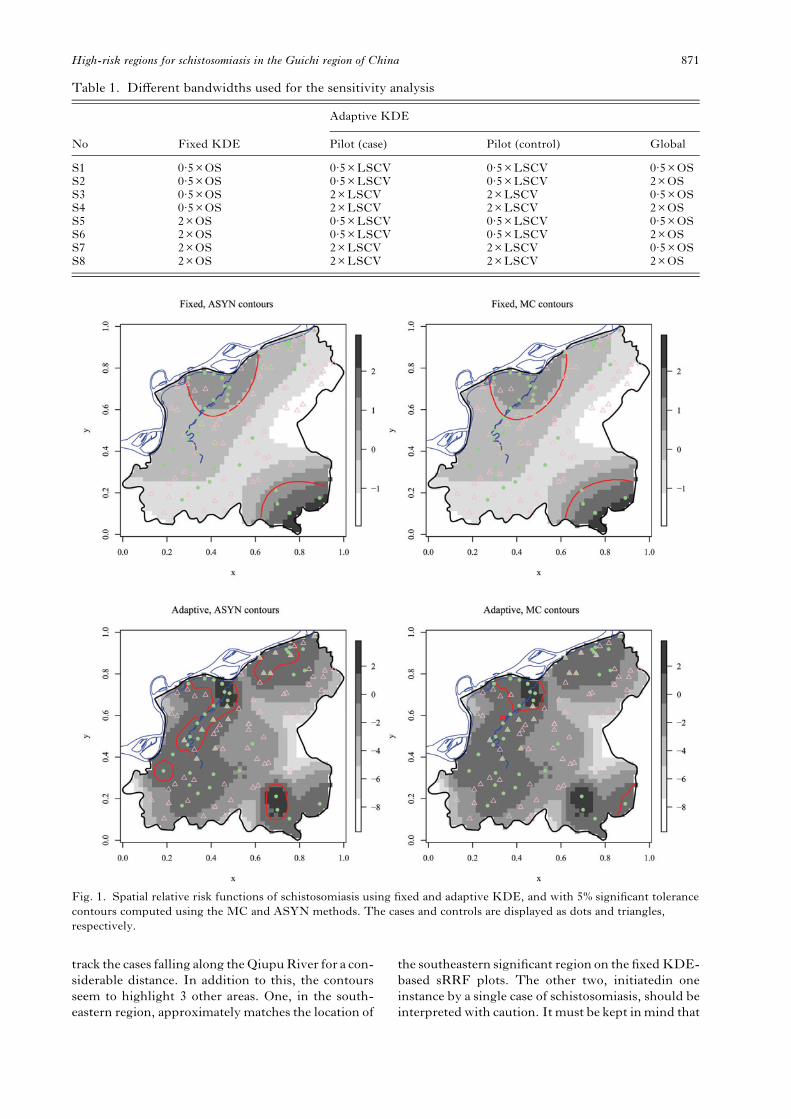
track the cases falling along theQiupuRiver for a con-siderable distance. In addition to this, the contoursseem to highlight 3 other areas. One, in the south-eastern region, approximately matches the location of
the southeastern significant region on the fixedKDE-based sRRF plots. The other two, initiatedin oneinstance by a single case of schistosomiasis, should beinterpreted with caution. It must be kept inmind that
Table 1. Different bandwidths used for the sensitivity analysis
No Fixed KDE
Adaptive KDE
Pilot (case) Pilot (control) Global
S1 0·5×OS 0·5×LSCV 0·5×LSCV 0·5×OSS2 0·5×OS 0·5×LSCV 0·5×LSCV 2×OSS3 0·5×OS 2×LSCV 2×LSCV 0·5×OSS4 0·5×OS 2×LSCV 2×LSCV 2×OSS5 2×OS 0·5×LSCV 0·5×LSCV 0·5×OSS6 2×OS 0·5×LSCV 0·5×LSCV 2×OSS7 2×OS 2×LSCV 2×LSCV 0·5×OSS8 2×OS 2×LSCV 2×LSCV 2×OS
Fig. 1. Spatial relative risk functions of schistosomiasis using fixed and adaptive KDE, and with 5% significant tolerancecontours computed using the MC and ASYN methods. The cases and controls are displayed as dots and triangles,respectively.
871High-risk regions for schistosomiasis in the Guichi region of China
the ASYN method relies on asymptotic properties,and the sample size in this application may need to beincreased in order to confirm the existence of theadditional ‘hotspots’. This view is supported by MCcontours for the adaptive KDE-based sRRF – theyare less sensitive to isolated case observations for therelatively small sample size.
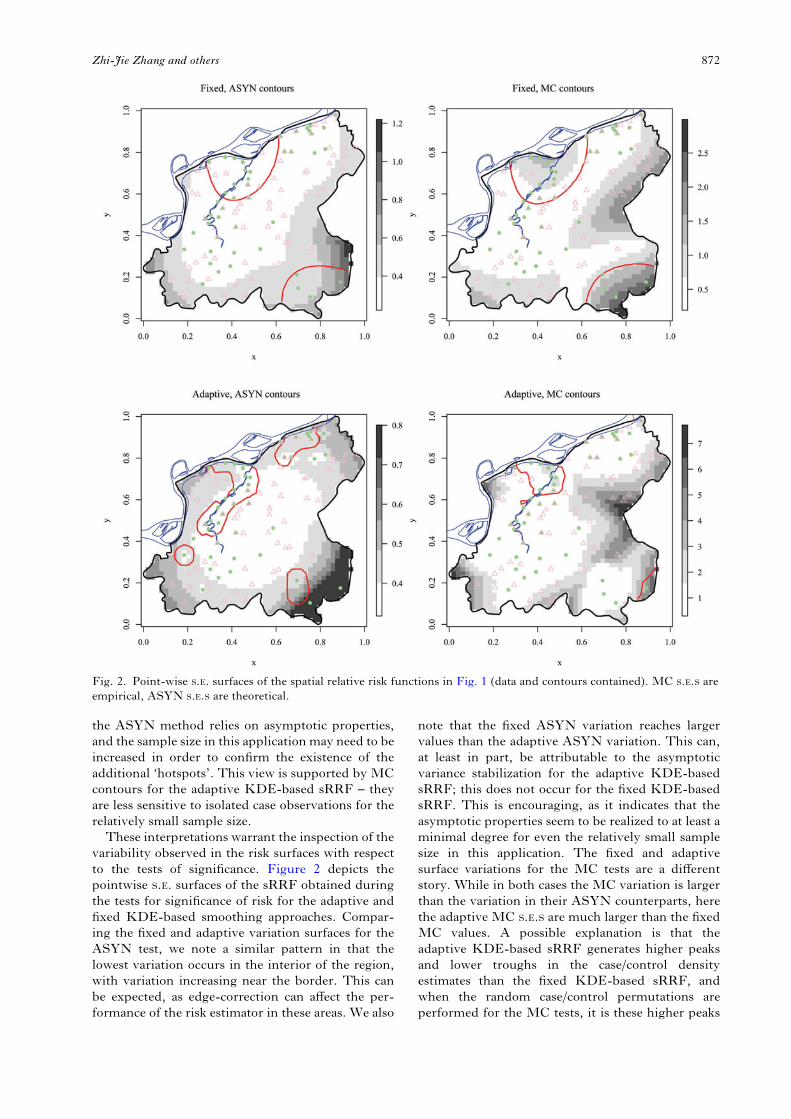
These interpretations warrant the inspection of thevariability observed in the risk surfaces with respectto the tests of significance. Figure 2 depicts thepointwise S.E. surfaces of the sRRF obtained duringthe tests for significance of risk for the adaptive andfixed KDE-based smoothing approaches. Compar-ing the fixed and adaptive variation surfaces for theASYN test, we note a similar pattern in that thelowest variation occurs in the interior of the region,with variation increasing near the border. This canbe expected, as edge-correction can affect the per-formance of the risk estimator in these areas. We also
note that the fixed ASYN variation reaches largervalues than the adaptive ASYN variation. This can,at least in part, be attributable to the asymptoticvariance stabilization for the adaptive KDE-basedsRRF; this does not occur for the fixed KDE-basedsRRF. This is encouraging, as it indicates that theasymptotic properties seem to be realized to at least aminimal degree for even the relatively small samplesize in this application. The fixed and adaptivesurface variations for the MC tests are a differentstory. While in both cases the MC variation is largerthan the variation in their ASYN counterparts, herethe adaptive MC S.E.S are much larger than the fixedMC values. A possible explanation is that theadaptive KDE-based sRRF generates higher peaksand lower troughs in the case/control densityestimates than the fixed KDE-based sRRF, andwhen the random case/control permutations areperformed for the MC tests, it is these higher peaks
Fig. 2. Point-wise S.E. surfaces of the spatial relative risk functions in Fig. 1 (data and contours contained). MC S.E.S areempirical, ASYN S.E.S are theoretical.
872Zhi-Jie Zhang and others
and lower troughs that drive the variation up in theadaptive KDE-based sRRF.The results of sensitivity analysis using different
bandwidths (as given in Table 1) (images given in theSupplementary appendix, Online version only) showthat the fixed and adaptive KDE-based sRRFsignificance tests were both affected by the band-widths. Examination of the differences in contourappearance between the bandwidths for the fixedKDE-based sRRF (Supplementary appendix FigsS1–S8 and Figs S9–S16, Online version only) showsthat even halving and doubling the OS bandwidthhad only a minimal impact on the identified signifi-cant regions. The impact of varying the pilot andglobal bandwidths for the adaptive KDE-basedsRRF is more pronounced, although this is to be ex-pected given the small sample size. Overall, the adap-tive MC contours were more resistant to bandwidthchange than the ASYN contours. Again, the smallsample sizes could well be affecting the validity of theasymptotics here. For both adaptive ASYN and MCcontours, altering the global bandwidth was moreimportant than changing the pilots (e.g. Supplemen-tary appendix Figs S1–S2 and Figs S3–S4, Onlineversion only). However, in the event of a small globalbandwidth for example, large pilots can help stabilizethe surface and contours (e.g. comparing the adaptivesurfaces in Supplementary appendix Figs S1–S2 andFigs S5–S6, Online version only). The variation ofthe tests was consistently higher for the MC testcompared with the ASYN test for both smoothingregimens. For the ASYN tests only, the S.E.S reachedmarkedly higher values for the fixed surfaces inSupplementary appendix Figs S1–S10 (Online ver-sion only); these maximums were only slightly lowerfor the fixed surfaces in Supplementary appendixFigs S11–S16 (Online version only). This means thateven with excessive over-smoothing in the fixedsurfaces to minimize variability, the adaptive surfaces(with less smoothing and hence less bias) still appearto provide competitive values of variability.
DISCUSSION
Kernel density estimation is a nonparametric andpopular approach to identify high-risk regions ofdisease (Zhang et al. 2009a; Davies and Hazelton,2010). This technique has been explored in the fieldof schistosomiasis (Zhang et al. 2009a; Galvao et al.2010). This study was the first to apply the newlydeveloped adaptive KDE-based sRRF to identifyand highlight areas of elevated schistosomiasis risk,which is helpful in guiding rational disease controlstrategies and in allocating resources effectively(Brooker et al. 2006; Zhang et al. 2009a). The resultsalso provide some useful guidance on using thisapproach effectively in a wider sense.It is generally accepted that the amount of
smoothing (for either fixed or adaptive KDE) is of
paramount importance in the ‘quality’ of our estimatein terms of its proximity to true (unknown) density.While it has been observed that benefits such asreduced bias and variance stabilization for theadaptive version of the relative risk estimator can berealized in practice (Davies and Hazelton, 2010),there are difficulties in terms of now needing tochoose multiple ‘initial’ values in the form ofpilot and global bandwidths. Also, as many of thetheoretical properties have been examined bylarge-sample approximations, small sample sizescan have the potential for an obviously detrimentaleffect on estimate and testing quality. While we notethat the adaptive KDE-based sRRF has a betterability than the fixed KDE-based sRRF to depict theheterogeneity of risk regions, due to the apparentinstability of the adaptive risk function for small‘case’ sample sizes observed in the sensitivityimagery, we do not recommend its use for numeratorsample sizes of less than, say, 100. It would beinteresting to investigate further, with the help ofpre-defined problem scenarios, how varying the pilotand global bandwidth impacts ‘performance’ stat-istics such as integrated square errors with respect tospatial relative risk surfaces.Two methods of testing were used to identify the
significant high-risk regions of schistosomiasis. TheASYN test was better than the MC test in terms ofgenerally lower variation for both adaptive and fixedKDE-based sRRF. The result of the ASYN test ofadaptive KDE-based sRRF seemed to be morerational considering the detected high-risk regionsof schistosomiasis. For example, schistosomiasis is awaterborne disease, so the shape for schistosomiasisrisk regions close to the Qiupu River should be alongthe direction of water flows, which is clearer for thedetected Northern risk region of schistosomiasis (seeFig. 1). However, the adaptive surfaces and corre-sponding tolerance contours appeared more sensitiveto varying the originally defined OS and LSCVbandwidths due to the relatively small samples (referto the imagery in the Supplementary appendix,Online version only). So, we suggested combiningthe results of the ASYN test from fixed and adaptiveKDE-based sRRF to draw a conclusion. The ideathat different spatial statistical methods should beused to identify disease-risk regions was previouslysuggested by Ward and Carpenter (2000) and Zhanget al. (2008) for the reason that the spatial pattern ofdisease risk may be very complicated in reality. Wemay conclude that 2 common risk regions in theNorthern and Southeast parts were ‘true’ risk regionsof Guichi region and effective measures should betaken immediately to control schistosomiasis there;while 2 different risk regions in the Northeast andWest could be regarded as ‘potential’ risk regions ofschistosomiasis that should be monitored closely,which is consistent with previous reports (Zhanget al. 2008, 2009a,b).
873High-risk regions for schistosomiasis in the Guichi region of China
Adaptive KDE-based sRRF is, in essence, anapproach of KDE, so kernel function is not soimportant based on previous studies (Kelsall andDiggle, 1998; Davies et al. 2010) and the conven-tional bivariate Gaussian kernel was used in thisstudy. But, bandwidth selection and edge effects aretwo critical issues thatwere always discussed. A largerbandwidth tends to result in a smoother surface, andthus certain features in the data may not be captured;while a smaller bandwidth will get more local peaksand troughs, which is also not helpful for detectingthe spatial variation in risk as a whole (Vieira et al.2002; Zhang et al. 2009a). Edge effects are caused bythe unrecorded cases outside the studied region, sobias is possible and sometimes serious for the placesclose to the boundaries. Interested readers areencouraged to see the discussions in our previousreports (Zhang et al. 2009a). Here, we just point outtwo future research questions related to the adaptiveKDE-based sRRF. One question concerns theimpact of bandwidths on the adaptive KDE-basedsRRF. It has three different bandwidths and is morecomplicated than the fixed KDE-based sRRF(1 bandwidth), so determining their relative impacton the adaptive KDE-based sRRF is useful for betterunderstanding its performance caused by band-widths and applying it more effectively. A series ofwell-designed simulations is needed to illuminate thisissue. Another question is about the method used tocorrect the edge effects of adaptive KDE-basedsRRF.This study used the newly developed edge cor-rection method, which is the only available approachthat can be used for the adaptive KDE-based sRRF.Some new methods to correct the edge effects for theadaptiveKDE-based sRRF need to be developed andan evaluation of the effectiveness of these edgecorrection methods should be conducted.
In summary, we have conducted the first studyapplying the adaptive KDE-based sRRF to identifyhigh-risk regions of schistosomiasis, and compari-sons of the results between it and the fixed KDE-based sRRF were performed. Our application ofadaptive kernel estimation of relative risk and associ-ated significance tests has shed new light not only onthe ‘hotspots’ for schistosomiasis in Guichi region,but also where we expect the novel statistical metho-dology to perform well and where it may struggle.While both fixed and adaptive KDE-based sRRFwere shown in this example to possess advantages anddisadvantages, we conclude that simultaneous appli-cation of the two approaches could warrant the bestpossible identification of high-risk regions of disease.
ACKNOWLEDGEMENTS
We sincerely thank the staff from Guichi Station ofSchistosomiasis Prevention and Control for their help ondata collection and field management, without whosecooperation this project would not have been possible.
FINANCIAL SUPPORT
Z.J.Z and Q.W.J. were supported by the ImportantNational Science and Technology Major Programme(grant numbers: 2012ZX10004-220 and 2008ZX10004-011), the National Natural Science Foundation of China(grant numbers: 81102167 and 81172609), SpecializedResearch Fund for the Doctoral Programme of HigherEducation, SRFDP (grant number: 20110071120040)and A Foundation for the Author of National ExcellentDoctoral Dissertation of PR China (FANEDD)(201186). T. M. D. was funded by a Top Achiever’sDoctoral Research Scholarship (New Zealand TertiaryEducation Commission).
REFERENCES
Abramson, I. S. (1982). On bandwidth estimation in kernel estimates –
a square root law. Annals of Statistics 10, 1217–1223.Benschop, J., Hazelton,M. L., Stevenson,M. A., Dahl, J.,Morris, R. S.and French, N. P. (2008). Descriptive spatial epidemiology of subclinicalSalmonella infection in finisher pig herds: application of a novel method ofspatially adaptive smoothing. Veterinary Research 39, 2.Berke, O. and Grosse Beilage, E. (2003). Spatial relative risk mapping ofpseudorabies-seropositive pig herds in an animal-dense region. Journal ofVeterinary Medicine Series B – Infectious Diseases and Veterinary PublicHealth 50, 322–325.Bithell, J. F. (1990). An application of density estimation to geographicalepidemiology. Statistics in Medicine 9, 691–701.Bithell, J. F. (1991). Estimation of relative risk functions. Statistics inMedicine 10, 1745–1751.Bowman, A. and Azzalini, A. (1997). Applied Smoothing Techniques forData Analysis-The Kernel Approach with S-Plus Illustrations. Oxford:Oxford University Press.Brooker, S., Leslie, T., Kolaczinski, K., Mohsen, E., Mehboob, N.,Saleheen, S., Khudonazarov, J., Freeman, T., Clements, A.,Rowland, M. and Kolaczinski, J. (2006). Spatial epidemiology ofPlasmodium vivax, Afghanistan.Emerging Infectious Diseases 12, 1600–1602.Davies, T.M. and Hazelton, M. L. (2010). Adaptive kernel estimation ofspatial relative risk. Statistics in Medicine 29, 2423–2437.Davies, T.M., Hazelton, M. L. and Marshall, J. C. (2011). Sparr:analyzing spatial relative risk using fixed and adaptive kernel densityestimation in R. Journal of Statistical Software 39, 1–14.Diggle, P. (1985). A kernel-method for smoothing point processdata. Applied Statistics – Journal of the Royal Statistical Society Series C34, 138–147.Galvao, A. F., Favre, T. C., Guimaraes, R. J., Pereira, A. P., Zani, L. C.,Felipe, K. T., Domingues, A. L., Carvalho, O. S., Barbosa, C. S.and Pieri, O. S. (2010). Spatial distribution of Schistosoma mansoniinfection before and after chemotherapy with two praziquantel doses in acommunity of Pernambuco, Brazil. Memórias do Instituto Oswaldo Cruz105, 555–562.Hazelton, M. L. and Davies, T.M. (2009). Inference based on kernelestimates of the relative risk function in geographical epidemiology.Biometrical Journal 51, 98–109.Kelsall, J. E. and Diggle, P. J. (1995a). Kernel estimation of relative risk.Bernoulli 1, 3–16.Kelsall, J. E. and Diggle, P. J. (1995b). Non-parametric estimation ofspatial variation in relative risk. Statistics in Medicine 14, 2335–2342.Kelsall, J. E. and Diggle, P. J. (1998). Spatial variation in risk of disease: anonparametric binary regression approach. Applied Statistics 47, 559–573.Marshall, J. C. and Hazelton, M. L. (2010). Boundary kernels foradaptive density estimators on regions with irregular boundaries. Journalof Multivariate Analysis 101, 949–963.Peng, W.X., Tao, B., Clements, A., Jiang, Q. L., Zhang, Z. J.,Zhou, Y. B. and Jiang, Q.W. (2010). Identifying high-risk areas ofschistosomiasis and associated risk factors in the Poyang Lake region, China.Parasitology 137, 1099–1107.Prince, M. I., Chetwynd, A., Diggle, P., Jarner, M., Metcalf, J. V. andJames, O. F. (2001). The geographical distribution of primary biliarycirrhosis in a well-defined cohort. Hepatology 34, 1083–1088.Sabel, C. E., Gatrell, A. C., Loytonen, M., Maasilta, P. andJokelainen, M. (2000). Modelling exposure opportunities: estimatingrelative risk for motor neurone disease in Finland. Social Science andMedicine, 50, 1121–1137.
874Zhi-Jie Zhang and others
Terrell, G. R. (1990). The maximal smoothing principle indensity-estimation. Journal of the American Statistical Association 85,470–477.Utzinger, J., Bergquist, R., Shu-Hua, X., Singer, B. H. and Tanner, M.(2003). Sustainable schistosomiasis control – the way forward. Lancet 362,1932–1934.Utzinger, J., Raso, G., Brooker, S., De Savigny, D., Tanner, M.,Ornbjerg, N., Singer, B. H. and N’Goran, E. K. (2009). Schistosomiasisand neglected tropical diseases: towards integrated and sustainable controland a word of caution. Parasitology 136, 1859–1874.Vieira, V., Webster, T., Aschengrau, A. and Ozonoff, D. (2002).A method for spatial analysis of risk in a population-based case-controlstudy. International Journal of Hygiene and Environmental Health 205,115–120.Ward, M. P. and Carpenter, T. E. (2000). Techniques for analysis ofdisease clustering in space and in time in veterinary epidemiology.Preventive Veterinary Medicine 45, 257–284.Wheeler, D. C. (2007). A comparison of spatial clustering and clusterdetection techniques for childhood leukemia incidence in Ohio, 1996–2003.International Journal of Health Geographics 6, 13.Zhang, Z., Carpenter, T. E., Chen, Y., Clark, A. B., Lynn, H. S.,Peng, W., Zhou, Y., Zhao, G. and Jiang, Q. (2008). Identifying high-risk
regions for schistosomiasis in Guichi, China: a spatial analysis.Acta Tropica107, 217–223.Zhang, Z., Clark, A. B., Bivand, R., Chen, Y., Carpenter, T. E.,Peng, W., Zhou, Y., Zhao, G. and Jiang, Q. (2009a). Nonparametricspatial analysis to detect high-risk regions for schistosomiasis in Guichi,China. Transactions of the Royal Society of Tropical Medicine and Hygiene103, 1045–1052.Zhang, Z. J., Carpenter, T. E., Lynn, H. S., Chen, Y., Bivand, R.,Clark, A. B., Hui, F.M., Peng, W. X., Zhou, Y. B., Zhao, G.M. andJiang, Q.W. (2009b). Location of active transmission sites of Schistosomajaponicum in lake and marshland regions in China. Parasitology 136,737–746.Zhou, X.N., Guo, J. G., Wu, X. H., Jiang, Q.W., Zheng, J., Dang, H.,Wang, X.H., Xu, J., Zhu, H. Q., Wu, G. L., Li, Y. S., Xu, X. J.,Chen, H. G., Wang, T. P., Zhu, Y. C., Qiu, D. C., Dong, X. Q.,Zhao, G.M., Zhang, S. J., Zhao, N. Q., Xia, G., Wang, L. Y.,Zhang, S. Q., Lin, D. D., Chen, M.G. and Hao, Y. (2007).Epidemiology of schistosomiasis in the People’s Republic of China, 2004.Emerging Infectious Diseases 13, 1470–1476.Zhou, X. N., Bergquist, R., Leonardo, L., Yang, G. J., Yang, K.,Sudomo, M. and Olveda, R. (2010). Schistosomiasis japonica control andresearch needs. Advances in Parasitology 72, 145–178.
875High-risk regions for schistosomiasis in the Guichi region of China