Identification of factors to stimulate in situ cartilage ... · Identification of factors to...
72
Identification of factors to stimulate in situ cartilage regeneration through endogenous stem cell recruitment Mariana Leandro Cruz Thesis to obtain the Master of Science Degree in Biomedical Engineering Supervisors: Prof. Cláudia Alexandra Martins Lobato da Silva Dr. Kavitha Sivasubramaniyan Examination committee Chairperson: Prof. João Pedro Estrela Rodrigues Conde Supervisor: Prof. Cláudia Alexandra Martins Lobato da Silva Member of the Committee: Prof. Frederico Castelo Alves Ferreira October 2016
Transcript of Identification of factors to stimulate in situ cartilage ... · Identification of factors to...
Identification of factors to stimulate in situ cartilage
regeneration through endogenous stem cell recruitment
Mariana Leandro Cruz
Thesis to obtain the Master of Science Degree in
Biomedical Engineering
Supervisors: Prof. Cláudia Alexandra Martins Lobato da Silva
Dr. Kavitha Sivasubramaniyan
Examination committee
Chairperson: Prof. João Pedro Estrela Rodrigues Conde
Supervisor: Prof. Cláudia Alexandra Martins Lobato da Silva
Member of the Committee: Prof. Frederico Castelo Alves Ferreira
October 2016


i
Acknowledgements
I am grateful to Prof. G. J. V. M. van Osch for the amazing opportunity to develop my Master thesis in
the orthopaedics department of Erasmus MC. I would like to thank Kavitha for the guidance and
shared knowledge during this period.
Robert, thank you very much for the essential help in the statistical analysis of my data. Thank you,
Wendy and Nicole for teaching me RNA isolation and sectioning, respectively.
Lisette, Andrea and Sohrab, I really enjoy your presence in the lab, thank you for the advises and
support in many steps of my project and also for making me enjoying the lab in a different perspective.
Sara, you also deserve a thank you for your hospitality and friendship during this six month.
Many thanks to my friends Claudia, Catarina, Constança, Ernestacia, Gijs, Mathew, Mithun and Tom
for your friendship and great moments.
Finally, I would like to express my greatest gratitude to my parents, Maria José and Fernando, my
grandmother, and my boyfriend, Francesco. “Mãe and pai”, thank you for letting me studying abroad
and for your support and encouragements during my student life and specially while being in the
Netherlands. “Avó”, thank you for all the prayers you did for me. Francesco, I have not enough words
to describe my thanks for your effort reading and correcting my writings. Also your presence, patience
and love made this achievement come true.

ii

iii
Abstract
Articular cartilage (AC) reconstitution remains a challenge for tissue engineering. Endogenous
mesenchymal stem cells (MSCs) has become a promising tool for AC healing, due to the location
nearby the joint, the migratory potential to injured sites and their chondrogenic differentiation. This
study evaluated not only the migration of MSCs derived from bone marrow (BM) and synovium (SYN)
but also the chondrogenesis of the recruited cells in response to different factors. The migration of
MSCs was carried out in 3D collagen gel, supplemented with medium containing thirteen different
factors and analysed under a confocal microscope after 48 hours. The chondrogenesis was performed
in 3D pellet culture in the presence of transforming growth factor (TGF)-β1 along with the factors
which stimulated cell migration, and measured through glycosaminoglycans presence stained with
thionin. The in vitro migration of BM- and SYN-MSCs was stimulated in the presence of platelet growth
factor (PDGF)-BB, bone morphogenetic protein (BMP)-2, nerve growth factor (NGF)-β, stromal cell
derived factor (SDF)-1α and regulated on activation, normal T cell expressed and secreted (RANTES).
In chondrogenesis, the combinatorial effect of TGF-β1/BMP-2 improved the chondrogenesis of
BM- and SYN-MSCs, TGF-β1/SDF-1α did not decrease chondrogenesis and different responses were
verified for TGF-β1/PDGF-BB and TGF-β1/NGF-β; chondrogenesis of BM-MSCs was slightly inhibited
in response to TGF-β1/PDGF-BB, but chodrogenesis of SYN-MSCs did not decrease, and on the
other hand TGF-β1/NGF-β inhibited chodrogenesis of SYN-MSCs, but did not reduce chodrogenesis
of BM-MSCs. These findings have great promise for in vivo cartilage treatment through endogenous
regeneration of cartilage.
Keywords: Chemokines, Chondrogenesis, Growth Factors, Mesenchymal Stem Cells, Migration

iv
Resumo
A reconstrução da cartilagem permanece um desafio para o ramo da engenharia de tecidos. As
células estaminais mesenquimais (MSCs) endógenas tornaram-se uma ferramenta promissora na
reparação da cartilagem, devido à sua localização próxima da articulação, do seu potencial migratório
para áreas danificadas e da sua diferenciação em condrócitos. Neste estudo não só se avaliou a
migração das MSCs extraídas da medula óssea (BM) e sinóvia (SYN), mas também a condrogénese
das células recrutadas em resposta a diferentes fatores. A migração das MSCs foi realizada num gel
de colagénio 3D suplementado por meios contendo treze factores diferentes, e analisada sob um
microscópio confocal após 48 horas. A condrogénese foi efectuada em cultura de pellet na presença
de Factor de transformação de crescimento (TGF)-β1 juntamente com os factores que estimularam
migração celular e medida através da presença de glicosaminoglicanos coradas com tionina. A
migração in vitro das BM- e SYN-MSCs foi estimulada na presença de Factor de crescimento
plaquetário (PDGF)-BB, Proteína morfogenética óssea (BMP)-2, Factor de crescimento neural
(NGF)-β, Factor derivado do estroma da medula óssea (SDF)-1α e Regulada sob activação
expressa e secretada por células T normais (RANTES). Na condrogénese, o efeito combinatório de
TGF-β1/BMP-2 melhorou a condrogénese das BM- e SYN-MSCs, TGF-β1/SDF-1α não diminuiu a
condrogénese e diferentes respostas foram verificadas perante TGF-β1/PDGF-BB e TGF-β1/NGF-β;
a condrogénese de BM-MSCs foi ligeiramente inibida em resposta a TGF-β1/PDGF-BB, mas a
condrogénese das SYN-MSCs não diminuiu, e por outro lado, TGF-β1/NGF-β não inibiu a
condrogénese das BM-MSCs, mas reduziu a condrogénese das SYN-MSCs. Estes resultados são
promissores para o tratamento in vivo da cartilagem através da regeneração endógena da cartilagem.
Palavras-chave: Células Estaminais Mesenquimais, Condrogénese, Fatores, Migração,
Quimiocinas

v

vi
Contents
List of Tables ....................................................................................................................................... viii
List of Figures ........................................................................................................................................ ix
Glossary ................................................................................................................................................. xi
1. Introduction .................................................................................................................................... 1
2. State-of-the-art ............................................................................................................................... 5
2.1 Chemokines and Growth Factors for Recruitment and Chondrogenic Differentiation of
Endogenous Stem or Progenitor Cells ........................................................................................... 6
2.1.1 Recruitment factors ....................................................................................................... 6
2.1.2 Chondrogenic differentiation factors ........................................................................ 11
2.2 Endogenous Cell Source for Cartilage Repair ................................................................. 15
2.2.1 Bone Marrow ................................................................................................................ 15
2.2.2 Articular Cartilage ....................................................................................................... 15
2.2.3 Synovium and synovial fluid ...................................................................................... 16
2.2.4 Infrapatellar fat pad ..................................................................................................... 16
3. Materials and Methods ................................................................................................................ 18
3.1 Cell isolation, culture and characterization ...................................................................... 19
3.1.1 Human MSCs derived from bone marrow ................................................................. 19
3.1.2 Human MSCs derived from synovium ....................................................................... 19
3.2 Migration assays ................................................................................................................. 20
3.2.1 Spheroids formation ................................................................................................... 20
3.2.2 Collagen matrix ............................................................................................................ 20
3.2.3 Confocal laser scanning microscopy ........................................................................ 21
3.2.4 ImageJ data analysis ................................................................................................... 21
3.2.5 Statistics ....................................................................................................................... 21
3.3 Chondrogenic differentiation ............................................................................................. 22
3.3.1 Pellet culture ................................................................................................................ 22
3.3.2 Immunostaining ........................................................................................................... 22
3.3.3 Reverse transcription-polymerase chain reaction (RT-PCR) .................................. 23

vii
4. Results .......................................................................................................................................... 24
4.1 Chemokines and Growth Factors that Induce Migration of Bone Marrow and Synovial
MSCs ............................................................................................................................................... 25
4.2 Chondrogenic Differentiation of Bone Marrow and Synovium MSCs............................ 33
4.3 Chondrogenesis of fibrous and non-fibrous synovium sample ..................................... 39
5. Discussion.................................................................................................................................... 40
6. Overall summary, conclusion and future work ........................................................................ 44
References ............................................................................................................................................ 47
Annex ....................................................................................................................................................... A

viii
List of Tables
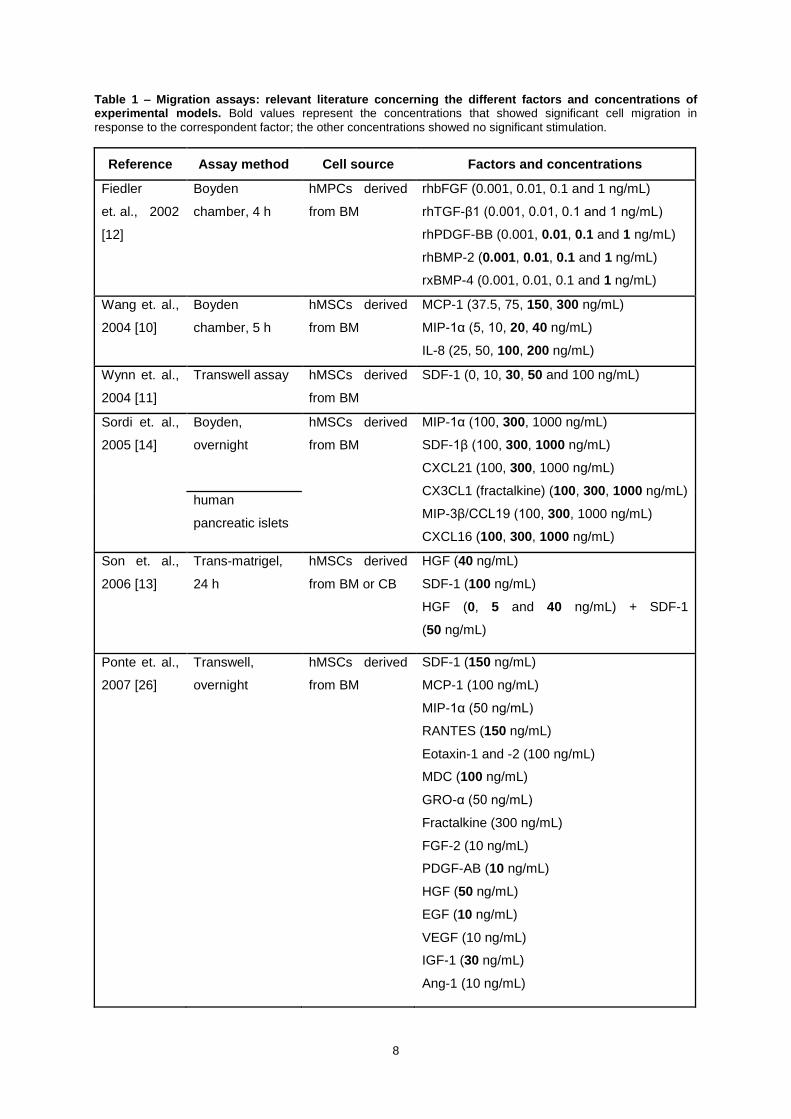
Table 1 – Migration assays: relevant literature concerning the different factors and
concentrations of experimental models. Bold values represent the concentrations that showed
significant cell migration in response to the correspondent factor; the other concentrations showed no
significant stimulation. ............................................................................................................................. 8
Table 2 – Relevant literature concerning the chondrogenic differentiation of mesenchymal stem
cells. Effects on gene expression and protein synthesis after chondrogenic differentiation culture of
MSCs. .................................................................................................................................................... 12
Table 3 – Qualitative scale of chondrogenic differentiation used to quantify pellets culture. .... 22
Table 4 – Factors and correspondent concentrations tested in the migration assay. ................ 25
Table 5 – Normalised migratory cell area and maximum migratory cell distance of BM-MSCs in
the presence of different factors with reference to the negative control. Values of significant
migratory cell area and maximum migratory cell distance are represented as * p<0.05; ** p<0.01;
*** p<0.001 where p is evaluated with reference to the negative control (n=4 independent
experiments). ......................................................................................................................................... 30
Table 6 – Normalised migratory cell area and maximum migratory cell distance of SYN-MSCs in
the presence of different factors with reference to the negative control. Values of significant
migratory cell area and maximum migratory cell distance are represented as * p<0.05; ** p<0.01;
*** p<0.001 where p is evaluated with reference to the negative control (n=4 independent
experiments). ......................................................................................................................................... 32
Table 7 – Qualitative quantification of chondrogenic differentiation of BM-MSCs after 28 or 32
days of pellet culture in the presence of TGF-β1 (positive control), NGF-β, BMP-2, SDF-1α,
PDGF-BB, the combination of TGF-β1 /NGF-β, TGF-β1/BMP-2, TGF-β1/SDF-1 and
TGF-β1/PDGF-BB. (n=3 independent experiments. 0, +, ++ and +++ represent none, low, moderate
and high chondrogenic differentiation, respectively). ............................................................................ 33
Table 8 - Qualitative quantification of chondrogenic differentiation of SYN-MSCs after 32 days
of pellets culture in the presence of TGF-β1 (positive control), and the combination of
TGF-β1/NGF-β, TGF-β1/BMP-2, TGF-β1/SDF-1, TGF-β1/PDGF-BB, and TGF-β1/RANTES. (n=1
independent experiment. 0, +, ++ and +++ represent none, low, moderate and high chondrogenic
differentiation, respectively). .................................................................................................................. 38
ix
List of Figures
Figure 1 – Bone marrow, articular cartilage and synovium as sources of MSCs adjacent to the
joint. (Adapted from [9]). ....................................................................................................................... 17
Figure 2 – Migration of a spheroid after 48 hours. A. Confocal microscope representation of a
spheroid in response to BMP-2 (A) and the correspondent image (B) and migration data (C) after
analysis (the red curve represents the core and sprouting cell; the green curve represents the
migrating cells). ..................................................................................................................................... 26
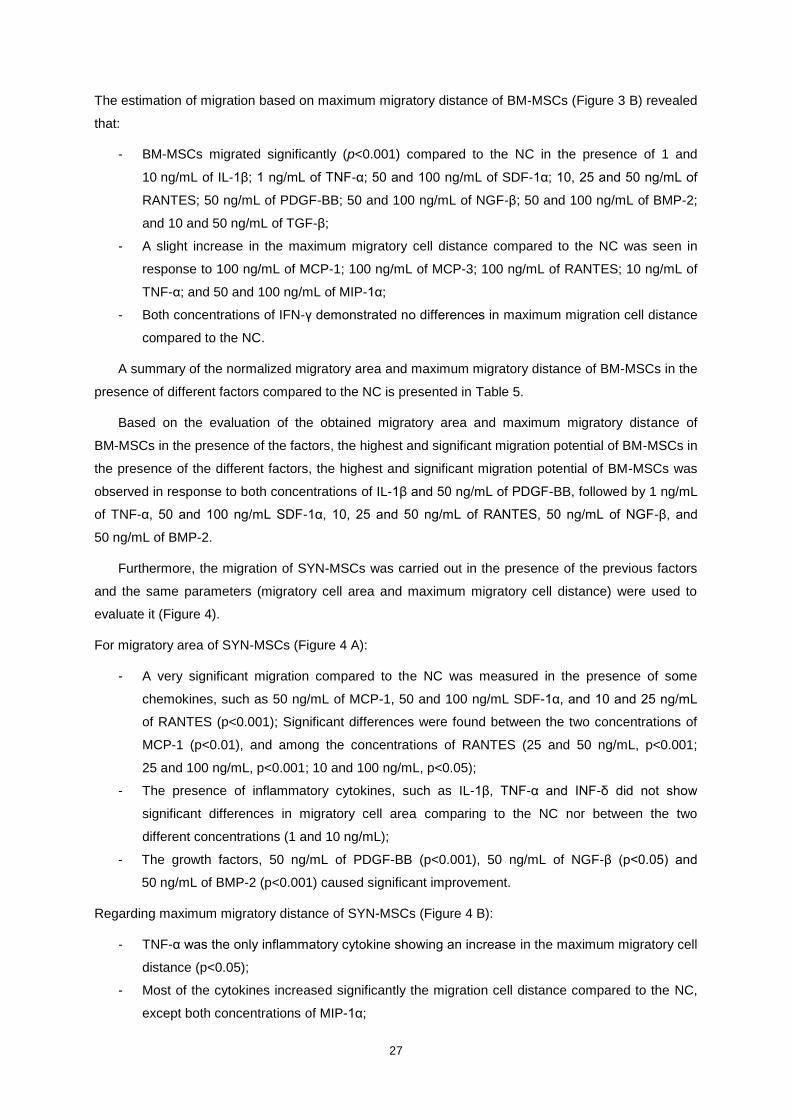
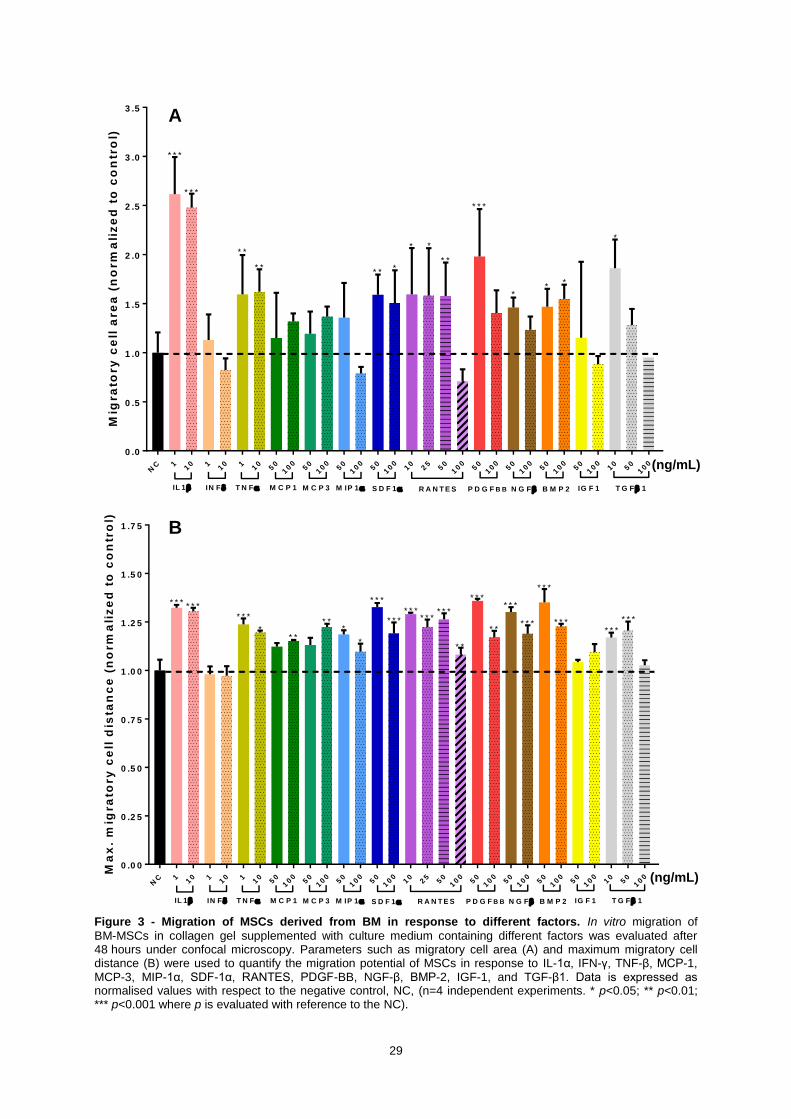
Figure 3 - Migration of MSCs derived from BM in response to different factors. In vitro migration
of BM-MSCs in collagen gel supplemented with culture medium containing different factors was
evaluated after 48 hours under confocal microscopy. Parameters such as migratory cell area (A) and
maximum migratory cell distance (B) were used to quantify the migration potential of MSCs in
response to IL-1α, IFN-γ, TNF-β, MCP-1, MCP-3, MIP-1α, SDF-1α, RANTES, PDGF-BB, NGF-β,
BMP-2, IGF-1, and TGF-β1. Data is expressed as normalised values with respect to the negative
control, NC, (n=4 independent experiments. * p<0.05; ** p<0.01; *** p<0.001 where p is evaluated with
reference to the NC). ............................................................................................................................. 29
Figure 4 - Migration of MSCs derived from SYN in response to different factors. In vitro migration
of SYN-MSCs in collagen gel supplemented with culture medium containing different factors was
evaluated after 48 hours under confocal microscopy. Parameters such as migratory cell area (A) and
maximum migratory cell distance (B) were used to quantify the migration potential of MSCs in
response to IL-1α, IFN-γ, TNF-β, MCP-1, MCP-3, MIP-1α, SDF-1α, RANTES, PDGF-BB, NGF-β,
BMP-2, IGF-1, and TGF-β1. Data is expressed as normalised values with respect to the negative
control, NC, (n=4 independent experiments. * p<0.05; ** p<0.01; *** p<0.001 where p is evaluated with
reference to the NC). ............................................................................................................................. 31
Figure 5 - GAGs analyses of BM-MSCs after 28 or 32 days of pellets culture treated in
chondrogenic medium supplemented with additional factors. Thionin staining was performed to
detect GAGs in the ECM of the pellets treated in chondrogenic medium supplemented with TGF-β1
(A1, A2, A3), NGF-β (B1), BMP-2 (C1), SDF-1α (D1) and PDGF-BB (E1, B2, B3), TGF-β1/NGF-β
(F1, C2, C3), TGF-β1/BMP-2 (G1, D2, D3), TGF-β1/SDF-1α (H1, E2, E3), TGF-β1/PDGF-BB
(I1, F2, F3) for 28 or 32 days. Images are representative of three pellets of three donors.
Magnification 100×. ............................................................................................................................... 36
Figure 6 - Gene expression of pellet culture obtained from BM-MSCs. Data is expressed as
mean ± SD of triplicates of bone marrow donor 2. ................................................................................ 37
Figure 7 – GAGs analyses of SYN-MSCs after 32 days of pellets culture treated in chondrogenic
medium supplemented with additional factors. Thionin staining was performed to detect GAGs in
the ECM of the pellets treated in chondrogenic medium supplemented with TGF-β1 (A),
TGF-β1/NGF-β (B), TGF-β1/BMP-2 (C), TGF-β1/SDF-1α (D), TGF-β1/PDGF-BB (E), and
TGF-β1/RANTES (F) for 32 days. Images are representative of three pellets. Magnification 100×. .... 38

x
Figure 8 – MSCs cultured in pellet culture system. Macro pictures of MSCs from pellet culture at
day 28 (BM-MSCs) and 32 (SYN-MSCs). Morphology ruler segments: 1 mm. .................................... 38
Figure 9 - MSCs derived from fibrous (left) and non-fibrous (right) synovium. Optical
microscope images of monolayer culture of MSCs (A and B) derived from a fibrous (C) and
non-fibrous (D) synovium pieces and the correspondent pellet after 28 days of culture (C and D).
Magnification 100×. ............................................................................................................................... 39
Figure 10 - Migration of MSCs derived from BM in response to different factors. A-C) Migratory
cell area and D-E) maximum migratory cell distance was calculated for IL-1α, IFN-γ, TNF-β, MCP-1,
MCP-3, MIP-1α, SDF-1α, RANTES, PDGF-BB, NGF-β, BMP-2, IGF-1, and TGF-β1. Data is
expressed as mean ± SD of 4 independent experiments. * p<0.05; ** p<0.01; *** p<0.001 where p is
evaluated with reference to the negative control. .................................................................................... D
Figure 11 - Migration of MSCs derived from SYN in response to different factors. A-C) Migratory
cell area and D-E) maximum migratory cell distance was calculated for IL-1α, IFN-γ, TNF-β, MCP-1,
MCP-3, MIP-1α, SDF-1α, RANTES, PDGF-BB, NGF-β, BMP-2, IGF-1, and TGF-β1. Data is
expressed as mean ± SD of 4 independent experiments. * p<0.05; ** p<0.01; *** p<0.001 where p is
evaluated with reference to the negative control. ....................................................................................G
xi
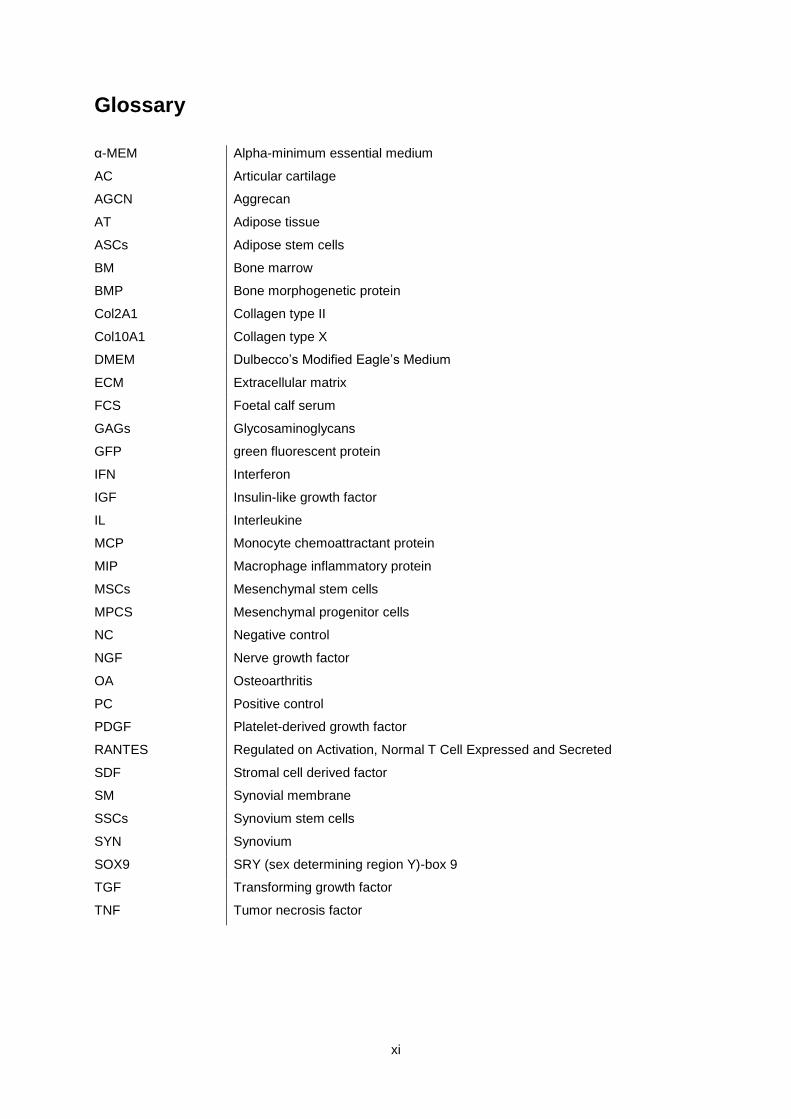
Glossary
α-MEM Alpha-minimum essential medium
AC Articular cartilage
AGCN Aggrecan
AT Adipose tissue
ASCs Adipose stem cells
BM Bone marrow
BMP Bone morphogenetic protein
Col2A1 Collagen type II
Col10A1 Collagen type X
DMEM Dulbecco’s Modified Eagle’s Medium
ECM Extracellular matrix
FCS Foetal calf serum
GAGs Glycosaminoglycans
GFP green fluorescent protein
IFN Interferon
IGF Insulin-like growth factor
IL Interleukine
MCP Monocyte chemoattractant protein
MIP Macrophage inflammatory protein
MSCs Mesenchymal stem cells
MPCS Mesenchymal progenitor cells
NC Negative control
NGF Nerve growth factor
OA Osteoarthritis
PC Positive control
PDGF Platelet-derived growth factor
RANTES Regulated on Activation, Normal T Cell Expressed and Secreted
SDF Stromal cell derived factor
SM Synovial membrane
SSCs Synovium stem cells
SYN Synovium
SOX9 SRY (sex determining region Y)-box 9
TGF Transforming growth factor
TNF Tumor necrosis factor

xii

1
1. Introduction

2
Hyaline cartilage or articular cartilage (AC) is a connective tissue present on the articulation of the
joints. AC is characterized by an extracellular matrix (ECM) which is rich in collagens type II, IX and
XI, proteoglycans, and water. This composition makes cartilage a viscoelastic tissue that absorbs
shocks and provides sliding areas in the joints thus allowing the bones to move. Additionally, AC is
composed by chondrocytes, cells that reside within the ECM, which play a role in tissue homeostasis
by synthetizing and degrading the extracellular matrix [1]. Unlike other tissues, AC has a limited
self-repair capacity, likely due to the absence of blood vessels and innervation [2, 3]. Therefore,
cartilage defects caused by degeneration, congenital malformation or trauma of cartilage tissue are
unable to repair.
Cartilages are often affected by osteoarthritis (OA), a degenerative joint disease which can be
described by a decrease in the thickness of articular cartilage, subchondral bone sclerosis,
osteophytes formation and synovium inflammation [2]; it causes joint pain, cartilage stiffness and
movement limitations, and consequently affects the patients daily life. Although the most predisposed
articulations are knees, hips and spine, owing to their weight bearing function, OA also affects
non-weigh bearing joints, such as fingers and toes. The National Health Interview Survey considered
OA the main cause of disability in United States between 2008 and 2013, affecting 52.5 million
(22.7%) adults (aged more than 18 years) [4]. Current clinical mid-stage OA treatments are oral
nonsteroidal anti-inflammatory drugs which act on symptom reduction. In advanced stages of OA,
arthroplasty (total joint replacement) is commonly used as final solution [2]. Furthermore, the repair of
joint function and structure has been relied on therapeutics such as microfracture technique,
mosaicplasty, and autologous chondrocyte implantation. However, these repair strategies are more
suitable to regenerate non-degenerative cartilage lesions and not degenerative lesions, such as in OA.
Mosaicplasty is a technique that harvest many small osteochondral plugs from non-weight bearing
areas of the femur and transplant them to injured articular cartilage sites [3, 5]. In microfracture
procedure, multiple millimetre size holes are produced in the subchondral bone, in order to induce
migration of marrow elements to the joint injured spaces [3, 6, 7]. After the application of these
techniques improvement in terms of pain relief and in function are shown in the patients for short
periods of time [3]; however insufficient results have been shown so far over long-term periods [8] due
to the formation of fibrous cartilage which affects the mechanical properties of the AC [9]. The third
prevailing technique, the autologous chondrocyte implantation procedure, requires the removal of
healthy chondrocytes from non-weight bearing areas of the joint, followed by in vitro expansion and
further implantation of culture-expanded chondrocytes in the injured cartilage areas of the same
individual. Autologous chondrocyte implantation has been developed as an alternative approach to
classical surgical techniques and enhances the function of AC for longer periods of time compared
with the previous surgical treatments; however the main drawback of this technique is the unstable
phenotype of chondrocytes that can lead to fibrocartilage formation in place of normal cartilage
development [3].
In recent years, the use of mesenchymal stem cells (MSCs) has been more and more extensively
applied as a therapeutic alternative to restore the cartilage tissue structure and function. MSCs are a
promising cell source for cartilage tissue engineering due to their in vivo and in vitro long term

3
self-renewal capacity, and their ability to migrate to damage tissues and to differentiate into
chondrocytes. One of the findings to date in the use of MSCs for cartilage repair is that a lower
number of cells remain in the joint or in the injured place after implantation. In addition, the
regenerated tissue is fibrous and therefore it has very poor mechanical properties compared to normal
cartilage. Although MSCs displayed low engraftment into the injured sites, it was evident that they
establish a microenvironment auspicious for recruitment and activation of endogenous stem/progenitor
cells for cartilage regeneration [3]. This raises the chance of using growth factors and chemokines that
may stimulate the recruitment of endogenous MSCs instead of the need to administrate exogenous
MSCs. However, strategies based on manipulating endogenous MSCs for cartilage tissue are very
limited. A few recent studies have used chemokines, for instance monocyte chemoattractant protein
(MCP)-1/chemokine C-C motif ligand (CCL)-2, macrophage inflammatory protein (MIP)-1α/CCL3,
regulated on activation, normal T cell expressed and secreted (RANTES)/CCL5, MIP-3α/CCL20,
CCL-19, CCL-22, stromal cell derived factor (SDF)-1/chemokine C-X-C motif (CXCL)-12 and
fractalkine/chemokine C-X3-C motif ligand (CX3CL)-1, to induced migration of human and rabbit
MSCs in transwell assays. Growth factors, such as platelet-derived growth factor (PDGF)-BB, -AB,
and -AA, epidermal growth factor (EGF), heparin-binding EGF-like growth factor (HB-EGF), insulin-like
growth factor (IGF)-1, hepatocyte growth factor (HGF), basic fibroblast growth factor (bFGF), thrombin,
transforming growth factor (TGF)-β3 and inflammatory cytokines, including interleukin (IL)-6, IL-8,
IL-1β, interferon (IFN)-γ, tumour necrosis factor (TNF)-α, also have played a role in MSCs recruitment
[10-27]. However, some disadvantages are involved within chemotaxis assay: it is a 2D assay, it
requires a complex set up for the transwells, it needs to determinate a migration optimal time for each
cell source, and it is a time consuming technique [28]. In order to overcome the main disadvantage of
the transwell assays, the 2D system, 3D cell migration systems that mimic better the real joint
environment were considered. Phipps et al. used a bone-mimetic scaffold coated with PDGF-BB to
recruit MSCs [25], and Ozaki et al. tested the chemotactic potential of PDGF-BB, PDGF-AA, HB-EGF,
TGF-α, EGF, bFGF, IGF-1, HGF, thrombin in a wound migration assay; PDGF-BB, PDGF-AA,
HB-EGF, and thrombin significant enhanced rabbit MSCs migration [17].
Although many factors have gained significant interest as chemoattractants, few studies tried to
combine the recruitment of MSCs and their chondrogenic differentiation potential. Mendelson et al.
has shown migration and chondrogenic differentiation of human MSCs in gelatin microspheres
supplemented with TGF-β3, and TGF-β3 along with SDF-1β [24] and Lee et al. has demonstrated
either the stimulation of human MSCs migration within the marrow cavity and the healing of athymic
nude rat osteochondral defects after implantation of heparin-conjugated fibrin loaded with PDGF-AA
and TGF-β1 [23]. Additionally, BMP-2, a member of the TGF superfamily, is a factor of great interest
which has shown a positive impact in chondrogenic differentiation when in presence of TGF-β1, -β2 or
-β3 [29-32]. However, it remains elusive the sources of endogenous cells for cartilage regeneration
and whether endogenous cell homing, without cell transplantation, can be reinvigorated by specific
bioactive conditions that might improve cartilage tissue healing.

4
Accordingly, this thesis aims primarily at evaluating whether chemotactic factors can only
stimulate the migration of MSCs derived from synovium and bone marrow or are also able to induce
chondrogenic differentiation of the migrated cells. The author hypothesises that cartilage regeneration
is achieved not only by the use of recruitment factors that induce migration of MSCs to injured places
but also by the presence of factors that induce chondrogenic differentiation of the recruited cells. This
hypothesis was investigated by testing the chemotactic migration capacity of human MSCs derived
from four donors of bone marrow and four donors of synovium tissue in response to five chemokines
(MCP-1/CCL2, MIP-1α/CCL3, RANTES/CCL5, MCP-3/CCL7 and SDF-α/CXCL12), five growth factors
(PDGF-BB, TGF-β1, IGF-1, BMP-2 and Nerve growth factor (NGF)-β), and three inflammatory
cytokines (IL-1α, TNF-β and IFN-γ) in a 3D collagen gel matrix. After having selected the factors that
stimulate significant migration of the MSCs, chondrogenic differentiation was analysed by
immunohistochemistry after 28-32 days of pellet culture formation, in the presence of chondrogenic
medium supplemented with TGF-β1 and the selected factors. Finally, through this process, the quality
of the formed cartilage was evaluated in the different conditions.

5
2. State-of-the-art

6
Tissue engineering is the research field that, combining cells, engineering and materials, aims at
developing a functional alternative to improve or substitute the damaged tissues. As stated in
section 1, cartilage is not able to self-repair after injury due to the absence of vasculature and
innervation. Therefore, techniques able to regenerate cartilage defects are of high interest in tissue
engineering field. For example, transplantation of exogenous MSCs alone or within a scaffold to
injured sites has been adopted as a strategy to repair AC defects. However, the results have
demonstrated that lower number of cells remain in the joint or in the damaged tissue after
transplantation [3]. Heterogeneity of MSCs population and the inhospitable inflammatory environment
of the injured cartilage are the probable reasons for this low cell engraftment in the recipient sites [33].
Even though MSCs did not show direct repair through cell replacement after transplantation, it is
suggested that MSCs create a microenvironment that stimulate the recruitment of endogenous
stem/progenitor cells for tissue repair [4]. From this fact, therapeutics that rely on activation and
mobilization of a large number of endogenous stem/progenitor cells to injured sites and promotes their
differentiation into chondrocytes without the need to administrate exogenous cells hold great promise
for cartilage tissue engineering and clinical practice [9]. Accordingly, recent research has been using
chemokines and growth factors, which can stimulate the mobilization of endogenous MSCs to injured
cartilage followed by in situ cartilage regeneration.
Hence, this chapter starts with an overview of the factors that induce the recruitment and the
chondrogenic differentiation of MSCs, followed by a summary of the endogenous cell sources for
regenerating cartilage.
2.1 Chemokines and Growth Factors for Recruitment and Chondrogenic
Differentiation of Endogenous Stem or Progenitor Cells
Growth factors, chemokines and cytokines are biologically active proteins produced endogenously
by various cell types. These proteins mediate proliferation, differentiation and survival of cells. In
addition, they attract cells to the injury site in order to maintain and repair the tissues [34].
2.1.1 Recruitment factors
Many chemokines and growth factors have the correspondent receptors expressed by MSCs.
Included in these receptors are CXC chemokine receptors 1 and 2 (CXCR1 and CXCR2) [35], CXCR4
[11], CC receptor 1 and 2 (CCR1 and CCR2) [15], vascular endothelial growth factor receptor
(VEGFR) and platelet-derived growth factor receptor (PDGFR)-a and -b [23]. The correspondent
ligands are IL-8, SDF-1, MIP-1α, MCP-1, placenta growth factor (PlGF) and PDGF [14, 19, 36].
Although the mechanisms regulating the circulation of MSCs to peripheral blood and their recruitment
to appropriate microenvironments are still unknown, the use of some of these growth factors and
chemokines has been shown to induce migration of MSCs [10-15, 17-27, 37, 38] (Table 1). Migration
is a process of cell movement, that can be characterized by a directional migration in response to a
gradient of soluble stimuli (chemotaxis) or by a random motility (chemokinesis) [28].

7
SDF-1, a chemokine protein of the CXC subfamily, also known as CXC motif chemokine 12
(CXCL12), is one of the chemokines that can stimulate cell migration. SDF-1 and its receptor CXCR4
can mediate the migration of MSCs to bone marrow [11]. Previous works [24, 37] showed that SDF-1
has also a chemotactic effect in adipose and synovium stem cells. Moreover, a dose dependent effect
of SDF-1 on the mobilization of human BM-MSCs was shown in Boyden chamber and transwell
assays [11, 14, 16, 19]. In addition, the chemokines of the CC subfamily that played a part in MSC
recruitment are MCP-1, MIP-1α and RANTES, respectively known as CCL2, CCL3 and CCL5. MCP-1
stimulates migration and infiltration of monocytes and macrophages in order to induce normal
response to inflammation and immunological survival of tissues [39]. MIP-1α is mainly expressed by
immune cells, fibroblasts and epithelial cells [40] and therefore its expression is increased in injury
areas. RANTES is expressed by a large number of cell types such as natural killer cells, memory
T cells, eosinophils and dendritic cells [41]. Some studies have tested the response of MSCs in the
presence of MCP-1, MIP-1α and RANTES in Boyden chamber or transwell assays; however, some
contradictory results were found: on the one hand, in vitro migration of BM-MSCs was demonstrated in
response to MCP-1, MIP-1α and RANTES [10, 14, 15, 18, 20, 23]; and on the other hand, no
significant recruitment of BM-MSCs was observed in the presence of these chemokines
[19, 21, 26, 27]. A few other chemokines, including CXCL21, CXCL1, CXCL16 and CXCL19, have
been shown induction of chemotaxis of BM-MSCs [14].
Besides chemokines, cell recruitment has been presented in response to some pro-inflammatory
cytokines. For instance, IL-8 or CXCL8, which belongs to the CXC chemokine subfamily, showed a
chemotactic response in human BM-MSCs in in vitro studies [10, 19, 23, 27]. Furthermore,
inflammatory chemokines, including TNF-α, IL-6, and IL-1β, chemotactically stimulated hMSCs
derived from BM, as demonstrated in transwell chamber [27].
Finally, several growth factors have also been playing a role in migration of stem cells. PDGF, as
a homodimer (PDGF-AA and PDGF-BB) or a heterodimer (PDGF-AB), demonstrated the greatest
effect on MSCs migration in in vitro and in vivo models [17, 23, 25, 26]. Several other growth factors
such as HB-EGF, EGF, HGF, IGF-1, FGF-2, and thrombin have been showing a chemotactic
response in BM-MSCs demonstrated by Boyden or transwell assays [13, 17, 23, 26, 27]. Moreover,
TGF-β3, a chondrogenic factor, proved to be an chemotactic factor to adipose stem cells (ASCs),
BM-MSCs, and synovium stem cells (SSCs) when codelivered with SDF-1 [24]. In addition, the
chemotactic response of BMP-2 demonstrated an improvement in chemotaxis chamber coated with
collagen IV and in transwell invasion assays [22], but on the other hand another study described that
green fluorescent protein (GFP)-expressing human MSCs in Boyden chamber did not respond to
BMP-2 [25]. Moreover, the response of MSCs in the presence of NGF-β, a growth factor that
accelerated wound healing [42], was tested in Boyden chamber assay, but no chemotactic response
was shown [17].
8
Table 1 – Migration assays: relevant literature concerning the different factors and concentrations of experimental models. Bold values represent the concentrations that showed significant cell migration in
response to the correspondent factor; the other concentrations showed no significant stimulation.
Reference Assay method Cell source Factors and concentrations
Fiedler
et. al., 2002
[12]
Boyden
chamber, 4 h
hMPCs derived
from BM
rhbFGF (0.001, 0.01, 0.1 and 1 ng/mL)
rhTGF-β1 (0.001, 0.01, 0.1 and 1 ng/mL)
rhPDGF-BB (0.001, 0.01, 0.1 and 1 ng/mL)
rhBMP-2 (0.001, 0.01, 0.1 and 1 ng/mL)
rxBMP-4 (0.001, 0.01, 0.1 and 1 ng/mL)
Wang et. al.,
2004 [10]
Boyden
chamber, 5 h
hMSCs derived
from BM
MCP-1 (37.5, 75, 150, 300 ng/mL)
MIP-1α (5, 10, 20, 40 ng/mL)
IL-8 (25, 50, 100, 200 ng/mL)
Wynn et. al.,
2004 [11]
Transwell assay hMSCs derived
from BM
SDF-1 (0, 10, 30, 50 and 100 ng/mL)
Sordi et. al.,
2005 [14]
Boyden,
overnight
hMSCs derived
from BM
MIP-1α (100, 300, 1000 ng/mL)
SDF-1β (100, 300, 1000 ng/mL)
CXCL21 (100, 300, 1000 ng/mL)
CX3CL1 (fractalkine) (100, 300, 1000 ng/mL)
MIP-3β/CCL19 (100, 300, 1000 ng/mL)
CXCL16 (100, 300, 1000 ng/mL)
human
pancreatic islets
Son et. al.,
2006 [13]
Trans-matrigel,
24 h
hMSCs derived
from BM or CB
HGF (40 ng/mL)
SDF-1 (100 ng/mL)
HGF (0, 5 and 40 ng/mL) + SDF-1
(50 ng/mL)
Ponte et. al.,
2007 [26]
Transwell,
overnight
hMSCs derived
from BM
SDF-1 (150 ng/mL)
MCP-1 (100 ng/mL)
MIP-1α (50 ng/mL)
RANTES (150 ng/mL)
Eotaxin-1 and -2 (100 ng/mL)
MDC (100 ng/mL)
GRO-α (50 ng/mL)
Fractalkine (300 ng/mL)
FGF-2 (10 ng/mL)
PDGF-AB (10 ng/mL)
HGF (50 ng/mL)
EGF (10 ng/mL)
VEGF (10 ng/mL)
IGF-1 (30 ng/mL)
Ang-1 (10 ng/mL)

9
Ringe et. al.,
2007 [19]
96-multiwell
format ChemoTx
plates, 20 h
hMSCs derived
from BM
SDF-1 (1, 10, 75, 100, 250, 500, 1000 nM)
IL8 (10, 75, 100, 500, 1000 nM)
MCP-1 (1, 10, 100, 500, 1000 nM)
Croitoru-
Lamoury
et. al., 2007
[21]
Transwell, 48 h hMSCs derived
from BM
SDF-1 (50 and 500 ng/mL)
CX3CL1/ fractalkine (20 and 100 ng/mL)
MCP-1 (100 and 1000 ng/mL)
CXCL10/IP-10 (100 and 1000 ng/ mL)
Dwyer et. al.,
2007 [15]
Transwell, 18 h hMSCs derived
from BM
MCP-1 (150, 300 and 600 pg/mL)
Ozaki et. al.,
2007 [17]
Boyden
chamber, 6 h
Rabbit and
human MSCs
PDGF-BB (0.01, 0.1, 1, 8, 10, 20, 50 ng/mL)
PDGF-AB (0.01, 0.1, 1, 8, 10, 50,
100 ng/mL)
HB-EGF (0.01, 0.1, 1, 8, 10, 20, 50 ng/mL)
PDGF-AA (0.1-100 ng/mL)
EGF (0.01, 0.1, 1, 8, 10, 50 ng/mL)
TGF-A (0.01, 0.1, 1, 8, 10, 20, 50 ng/mL)
IGF-1 (0.1, 1, 10, 50, 100, 200, 300 ng/mL)
HGF (1, 10, 20, 50, 100 ng/mL)
FGF-2 (0.01, 0.1, 1, 8, 10, 20, 50 ng/mL)
Thrombin (0.01, 0.1, 1, 8, 10, 25 unit/mL)
TGF-β1, TGF-β3 (0.01, 10, 50, 100 ng/mL)
VEGF, BMP-2, SDF-1A, NGF-β, MCP-1 (0.1,
1, 10, 50, 100 ng/mL)
IL-8 (0.01, 0.1, 1, 10, 50, 100, 200 ng/mL)
Leptin (0.001, 0.01, 0.1, 1, 10, 50 ng/mL)
Wound migration
assay
Rabbit MSCs PDGF-BB (20 ng/mL)
HB-EGF (5 ng/mL)
PDGF-AB (50 ng/mL)
TGF-A (5 ng/mL)
EGF (1 ng/mL)
FGF-2 (20 ng/mL)
IGF-I (100 ng/mL)
HGF (5 ng/mL)
Thrombin (10 unit/mL)
Rice et. al.,
2010 [18]
Agarose drop
model
SDF-1 (25, 50, 100, 250 ng/mL)
MCP-1 (25, 50, 100, 250, 500 ng/mL)
RANTES (25, 50, 100, 250, 500 ng/mL)
IP-10 (25, 50, 100, 250 ng/mL)
MIP-1α (25, 50, 100, 250, 500 ng/mL)
MIP-1β (25, 50, 100, 250 ng/mL)

10
Lee et. al.,
2010 [38]
Bioscaffold of
poly-ε-
caprolactone
and
hydroxyapatite
Rabbit
endogenous
cells
TGF-β3 (10 ng/mL)
Mendelson
et. al., 2011
[24]
Gelatin
microspheres
into a porous
collagen
Human
BM-MSCs,
ASCs and SSCs
TGF-β3 (100 ng)
SDF-1β (100 ng)
TGF-β3 (100 ng) + SDF-1β (100 ng)
Boomsma
et. al., 2012
[20]
Mesencult Mice MSCs VEGF (30 ng/mL)
MCP-1 (30 ng/mL)
MIP-1α (100 pg/mL)
Zhang et. al.,
2012 [37]
Transwell
system, 6 h
hAC-MSCs and
SM-MSCs
rhSDF-1α (120 ng/mL)
Col1 scaffold rhSDF-1α (120 ng/mL)
Lee et. al.,
2012 [23]
Boyden
chamber, 2 h
hMSCs derived
from BM
IL-8 (50 ng/mL)
CCL20 (50 ng/mL)
CXCL12 (50 ng/mL)
MCP-1 (50 ng/mL)
PDGF-AA (25, 50, 100, 200 ng/mL)
HGF (50 ng/mL)
IGF-1 (50 ng/mL)
Rat
osteochondral
defect
PDGF-AA (8.5 and 17 ng/μL)
TGF-β1 (8 ng/μL) + PDGF-AA (8.5 and
17 ng/μL)
Phipps
et. al., 2012
[25]
Boyden
chamber, 20 h
GFP-expressing
human MSCs
PDGF-AB (10 ng/mL)
PDGF-BB (1, 10 and 30 ng/mL)
BMP-2 (10 and 100 ng/mL)
Mixture of SDF1α, CXCL16, MIP-1α, MIP-1β
and RANTES (1, 10 and 100 ng/mL)
PCL/col/HA
scaffold coated
with PDGF-BB
(bone-mimetic
scaffold), 20 h
PDGF-BB (10 ng/mL)

11
Vertelov
et. al., 2013
[27]
48- and 96-well
Corning Costar
transwell
chamber, 4 h
hMSCs derived
from BM
HGF (40 ng/mL)
PDGF-AB (10 ng/mL)
EGF (10 ng/mL)
VEGF-121 (10 ng/mL)
FGF-2 (10 ng/mL)
IGF-1 (30 ng/mL)
MIP-3β (10 ng/mL)
MIP-1α (50 ng/mL)
BCA-1 (5 ng/mL)
RANTES (150 ng/mL)
GRO-α (50 ng/mL)
fractalkine (300 ng/mL)
SDF-1α (150 ng/mL)
IL-1β (10 ng/mL)
IL-6 (100 ng/mL)
IL-8 (50 ng/mL)
TNF-α (50 ng/mL)
Haasters
et. al., 2014
[22]
Chemotaxis
chamber coated
with collagen IV,
15 h
hMSCs BMP-2 (100 ng/mL) and BMP-7 (100 ng/mL)
Transwell
invasion assay
BMP-2 (30 ng/mL) and BMP-7 (30 ng/mL)
*AC, articular cartilage; ASCs, adipose stem cells; BM, bone marrow; CB, cord blood; hMPCs, human mesenchymal progenitor cells; hMSCs, human mesenchymal stem cells; SM, synovial membrane; SSCs, synovium stem cells.
2.1.2 Chondrogenic differentiation factors
Chondrogenesis is a process of condensation of MSCs, followed by chondroprogenitor cell
differentiation into chondrocytes. These stages are characterized by interactions between cell to cell
and cell to matrix, respectively. In the condensation phase, it is evident a dense packing of MSCs that
express N-cadherin and N-CAM. In the differentiation phase, chondroprogenitor cells interact with the
ECM and ECM remodelling occurs: at early stages of chondrogenesis collagen type II and hyaluronian
are synthesized, and at late stages collagen IX and XI, aggrecan, and COMP are produced. The final
stage of chondrogenesis is the hypertrophy of chondrocytes, characterized by the formation of
collagen type X, which leads to the remodelling of the cartilage into bone [36, 43, 44].
Growth factors play a significant role in chondrogenic differentiation of MSCs. In the field of
cartilage tissue engineering, the most investigated chondrogenic factors belong to the TGF-β
superfamily, such as TGF-(β1, β2, β3), BMP-(2, 4, 6, 7) and GDF-5. An overview of the used
chondrogenic differentiation conditions to culture MSCs available in the literature is listed in Table 2. In
these studies, the use of serum free culture, dexamethasone and ascorbic acid are common features.

12
Table 2 – Relevant literature concerning the chondrogenic differentiation of mesenchymal stem cells.
Effects on gene expression and protein synthesis after chondrogenic differentiation culture of MSCs.
Reference Method Cell
source Factors
Gene expression and
protein synthesis
Barry
et. al., 2001
[45]
Pellets of
2×10⁵ cells
for 35 days
hBM-
MSC
TGF-β1 (10 ng/mL)
TGF-β2 (10 ng/mL)
TGF-β3 (10 ng/mL)
Gene expression: Increase
COL2A1, COL10A1 and AGCN
Protein synthesis: Aggrecan,
collagen II and collagen X
Sekiya
et. al., 2005
[46]
Pellets of
2×10⁵ cells
for 21 days
hBM-
MSC
BMP-2 (500 ng/mL)
and TGF-β3
(10 ng/mL)
BMP-4 (500 ng/mL)
and TGF-β3
(10 ng/mL)
BMP-6 (500 ng/mL)
and TGF-β3
(10 ng/mL)
Gene expression: Increase
COL2A1, COL10A1 and SOX9
Protein synthesis: proteoglycan and
collagen II
The combination of TGF-β3 and
BMP-2 was more effective
promoter of chondrogenesis than
TGF-β3 with BMP-4 and -6.
Toh et. al.,
2005 [47]
Pellets of
3×10⁵ cells
for 20 days
rabbit
BM-
MSCs
BMP2 (100 ng/mL)
TGF-β1 (10 ng/mL)
BMP2 (100 ng/mL)
and TGF-β1
(10 ng/mL)
Gene expression: Increase
COL2A1
Protein synthesis: proteoglycan
The combination of TGF-β1 and
BMP-2 was more effective
promoter of chondrogenesis than
TGF-β1 and BMP-2 alone.
Pelttari
et. al., 2006
[48]
Pellets of 4-
5×10⁵ cells
for 14, 28
and 42 days
hBM-
MSCs
TGF-β3 (10 ng/mL) Gene expression: Increase
COL2A1, COL11A1, COL10A1 and
MMP13
Protein synthesis: Collagen II and X
Noth et. al.,
2007 [49]
Collagen
type I
hydrogel with
2.5×10⁵ cells
for 3 weeks
hBM-
MSCs
BMP-2 (100 ng/ml)
TGF-β1 (10 ng/ml)
Gene expression: High COL2A1
and AGCN and low COL10A1

13
Kim et. al.,
2009 [29]
Pellets of
2.5×10⁵ cells
for 4 weeks
hBM-
and AT-
MSCs
BMP-2 (100 ng/ml),
BMP-6 (100 ng/ml),
BMP-7 (100 ng/ml)
TGF-β2 (5 ng/ml)
BMP-2 (100 ng/ml)
+ TGF-β2 (5 ng/ml)
BMP-6 (100 ng/ml)
+ TGF-β2 (5 ng/ml)
BMP-7 (100 ng/ml)
+ TGF-β2 (5 ng/ml)
Gene expression: Increase
COL2A1 and stable COL10A1
Protein synthesis: proteoglycan
The best chondrogenic promoter
was the combination of TGF-β2 and
BMP-7
Ronzière
et. al., 2010
[50]
Pellets of
2.5×10⁵ cells,
24 days
hBM-
and AT-
MSCs
BMP-2 (50 ng/mL)
TGF-β3 (10 ng/mL)
The chondrogenic differentiation of
BM- and AT-MSCs was increased
in the presence of BMP-2 and
TGF-β3: Increase in COL2A1,
COL10A1 and MMP-13
Weiss
et. al., 2010
[32]
Pellets of 4-
5×10⁵ cells,
45 days
hBM-
MSCs
BMP-2, -4, -6, -7
(10 ng/mL)
aFGF (10 ng/mL)
IGF-1 (10 ng/mL)
TGF-β3 (10 ng/mL)
PTHrP (10 ng/mL)
TGF-β3 (10 ng/mL)
in combination with
the previous factors
No chondrogenic differentiation was
present when BMP-2, -4, -6, -7,
FGF-2, IGF-1 were alone
TGF-3 in combination with each
factor increase gene expression:
COL2A1 and COL10A1, and
protein synthesis: proteoglycan and
collagen II and X
Lee et. al.,
2010 [38]
Bioscaffold of
poly-ε-
caprolactone
and
hydroxyapatite
Host
endoge
nous
cells
TGF-β3 (10 ng/mL) In the TGF-β3 infused bioscaffold
there was an increase in collagen II
and AGCN and a higher matrix
density and articular cartilage
thickness
Yoon
et. al., 2011
[30]
Pellet and
HA scaffold
culture of
3×10⁵ cells
for 4, 7, 10,
and 14 days
hAT-
MSCs
TGF-β1 (10 ng/mL)
and BMP2
(50 ng/mL)
TGF-β1 (10 ng/mL)
and PDGF
(50 ng/mL)
Better chondrogenesis was verified
in HA scaffold culture than in pellet
culture;
Significant chondrogenesis of
hAT-MSCs in the presence of
TGF-β1 and BMP-2: increase in
collagen II, SOX9 and aggrecan,
and decrease in collagen I
Decrease in chondrogenesis of
hAT-MSCs in response to TGF-β1
and PDGF

14
Shintani
et. al., 2013
[51]
bovine
synovial
explants
BMP-2 (200 ng/mL) Gene expression: collagen II
Protein synthesis:
GAG expression
Murphy
et. al., 2015
[31]
Aggregate
culture, 7
days
hBM-
MSCs
and
hAC
BMP-2 (100 ng/mL)
GDF-5 (100 ng/mL)
TGF-β1 (10 ng/mL)
Combinations of
the previous factors
hBM-MSCs and hAC showed
significant chondrogenic
differentiation in the presence of
BMP-2 and TGF-β1 or BMP-2,
GDF-5 and TGF-β1: higher
expression of COL2A1,
COL2A1/COL10A1, SOX-9 and
AGCN, and GAG and collagen II
staining
Felicia
et. al., 2016
[52]
Aggregate
culture of
2.5×10⁵ cells
for 14 days
BM-
MSCs
Inhibit PDGF,
FGFR and TGF-β
signalling using
AG-370, SU5402
and SB431542,
respectively
Inhibition of PDGF signalling did not
change the chondrogenic
differentiation compared with no
inhibitor control. On the other hand,
inhibition of TGF-β and FGFR
signalling resulted in a complete
lack or reduced chondrogenic
differentiation, respectively.
Although some studies investigated the stimulation of migration and chondrogenic differentiation
of MSCs in response to certain factors, just a few tried to analyse the effect of those factors in both
properties. For instance, Mendelson et al. [24] demonstrated the stimulation of the migration and the
chondrogenic differentiation of hMSCs in gelatin microspheres supplemented with TGF-β3, and the
combination of TGF-β3 and SDF-1β. Lee et. al. [23] has shown an increment in hMSC migration within
the marrow cavity and the healing of cartilage in osteochondral defects of athymic nude rat after
implantation of heparin-conjugated fibrin (HCF) loaded with PDGF-AA and TGF-β1. In another study,
[38], a bioscaffold of poly-ε-caprolactone and hydroxyapatite supplemented with TGF-β3 was used to
replace a rabbit joint. After 4 months, endogenous cell migration was stimulated by TGF-β3 and
chondrocytes were uniformly distributed in a matrix with collagen II and aggrecan. In addition, the
formed cartilage tissue had higher matrix density and thickness, and the shear properties were similar
to those of the normal cartilage.

15
2.2 Endogenous Cell Source for Cartilage Repair
In this section, a summary of the sources of progenitor/stem cells within or nearby the joint, such
as articular cartilage, bone marrow, synovium and synovial fluid, and infrapatellar fat pad, which might
migrate to injured sites and to regenerate cartilage is presented (Figure 1).
2.2.1 Bone Marrow
Bone marrow (BM) is a tissue in the inner part of the long bones. In vitro and in vivo studies
showed that BM is the niche of hematopoietic and mesenchymal stem cells. For cartilage tissue
engineering, BM-MSCs are cells of great interest due to some characteristics, such as long term
self-renewal capacity while retaining stemness properties, easy and efficient isolation, migration
potential to injured/inflamed sites and ability to give origin to chondrocytes. Microfracture is a common
used procedure that creates multiple holes in the subchondral bone to allow migration of marrow
components to the joint defects [3, 6, 7]. However, this technique is mainly used to focal defects rather
than spread lesions like in osteoarthritis. The infusion of BM-MSCs to target sites, (for which, so far,
efficient homing has not yet been achieved) and more recently the recruitment of endogenous
BM-MSCs are promising applications in Orthopaedics for cartilage repair [3].
2.2.2 Articular Cartilage
Chondrocytes are the main cell type residing in articular cartilage (AC) and they are responsible
for tissue viability. Although chondrocytes are evolved in a dense matrix of collagens and
proteoglycans, chondrocyte migration has been demonstrated in in vitro and ex vivo systems. On the
other hand, in vivo studies still remain to be determined [53].
An additional population that can be found in equine [54] and human [55] AC is called AC
progenitor cells. This population have some properties in common with MSCs, such as the colony
forming ability, the high telomerase activity, and maintenance of telomere length [55] and of the
migration capacity to damaged cartilage [56]. Compared to BM-MSCs, which resulted in hypertrophic
cartilage phenotype after pellet culture, AC progenitor cells lacking the presence of collagen type X, an
hypertrophic marker, might be a potential source for cartilage regeneration under appropriate
conditions [54].

16
2.2.3 Synovium and synovial fluid
Synovium (SYN), also referred to synovial membrane, is a tissue that lines the inner surface of the
joint, except where cartilage is present. This tissue is constituted of two layers: the surface layer
(intima) and the underlying layer (subintima). The former is loose organized and avascular, whereas
the latter is a meshwork with cells and blood vessels interspersed. Two types of cells are present in
intimal layer, the macrophage-like (type A) and fibroblast-like (type B) synoviocytes. The
macrophage-like synoviocytes are involved in removing undesirable substances from the synovial
fluid, whereas fibroblast-like synoviocytes are responsible for the production of hyaluronan, collagen
and fibronectin which give origin to the intimal interstitium and the synovial fluid. Synovia, commonly
known as synovial fluid, is a viscous fluid present in the synovial cavity which lubricates and nourishes
the cartilage and the bone of the joints [57].
Synovium and synovial fluid are promising cell sources for cartilage regeneration due to the
presence of a reservoir of MSCs with higher chondrogenic potential compared to BM, adipose tissue,
muscle, periosteum and infrapatellar fat pad [58] and the migration potential of those cells [59].
2.2.4 Infrapatellar fat pad
The infrapatellar fat pad, also known as Hoffa's fat pad, is an adipose tissue very vascularized and
innervated which is located in the anterior knee compartment. Its function is still not clear, but some
studies support that the infrapatellar fat pad has a role in the biomechanics of the knee or as a cell
storage for joint regeneration after injury [60].
The current findings indicate that the infrapatellar fat pad is a source of MSCs that exhibit
chondrogenic, adipogenic, and osteogenic phenotypes in the presence of the appropriate media [61].
In addition, these cells demonstrated high proliferation and multipotent capacity even in late stages of
osteoarthritis. This characteristic, the accessibility of this source, and the large number of cells at
harvesting could make this source appropriate for cartilage therapy [62]. However, Wei et. al. have
shown that the release of inflammatory factors from infrapatellar fat pad inhibit chondrogenic
differentiation of MSCs and the production of hyaline cartilage matrix [63].
BM [3], AC [56] and SYN [59] progenitor/stem cells, due to their migratory potential to damage
cartilage tissue and chondrogenic differentiation ability, raise new possibilities for the future treatment
of cartilage defects.

17
Figure 1 – Bone marrow, articular cartilage and synovium as sources of MSCs adjacent to the joint.
(Adapted from [9]).

18
3. Materials and
Methods

19
3.1 Cell isolation, culture and characterization
3.1.1 Human MSCs derived from bone marrow
Bone marrow derived MSCs (BM-MSC) were acquired by ethical approval and informed consent
of four OA patients who underwent joint replacement surgery (Orthopaedics Department, Erasmus
MC, University Medical Centre Rotterdam, The Netherlands). Bone marrow was aspirated from the
iliac crest according to the local ethical committee of the Erasmus MC. Cells were counted in
3% acetic acid with methylene blue leave and platted at 30×106 nc/T175 to 30×10
6 nc/T175 in 20 mL
of alpha-minimum essential medium (α-MEM, 1:1, Invitrogen) supplemented with 10% (vol/vol)
screened foetal calf serum (FCS), gentamycine (1:1000, Invirtogen), fungizone (1:167, Invirtogen),
bFGF (1:5000, AbD Serotec) and 0.1 mM ascorbic-acid (1:500, Sigma), and incubated at 37°C,
5% CO2 and 90% humidity. This medium is designated culture medium hereafter. After 24h, all
nonadherent cells were washed off by changing the culture medium and BM-MSCs, the adherent
cells, were further expanded when sub-confluent (approximately 90% confluent). BM-MSCs were used
in passage 2 or 3 for the migration assays and chondrogenesis.
3.1.2 Human MSCs derived from synovium
Synovium was acquired by ethical approval and informed consent of four OA patients who
underwent joint replacement surgery (Orthopaedics Department, Erasmus MC, University Medical
Centre Rotterdam, the Netherlands). The tissue was chopped into small pieces and digested for
2-3 hours on a shaker at 37°C in medium containing HANKS BSS, collagenase IV (2 mg/ml) and
dispase II (0.2 mg/ml). The digested tissue was passed through a syringe of 16 G needle a few times,
neutralised with serum (to a 5% final concentration) and sieved through a 100 u and 40 u sieves. After
a PBS wash the cells were seeded in culture medium, and incubated at 37°C, 5% CO2 and
90% humidity. On day 3, all nonadherent cells were removed by changing the culture medium.
Synovium derived MSCs (SYN-MSCs), when sub-confluent, were trypsinized (0.25% trypsin/EDTA,
Life Technologies) and resuspended in culture medium for a late passage. SYN-MSCs were used in
passage 1 and 2 for the migration assays and chondrogenesis.

20
3.2 Migration assays
3.2.1 Spheroids formation
The first step of migration assays is the formation of spheroids from BM- or SYN-MSCs in a
3D Petri Dish (Sigma-Aldrich) of 400 µm in diameter and 800 µm in depth per micro-well. The mould of
the 3D Petri Dish was filled with 500 µL of melted sterile agarose (1g of agarose dissolved in 50 mL of
saline solution) and after its solidification, the agarose micro-wells were removed by squeezing the
mould into a 12 well plate. After 3 washes in α-MEM containing 10% FCS, fungizone (Invitrogen) and
gentamycin (Invitrogen), 190 µL mono-dispersed cells previously stained with CFDA were seeded per
agarose mould (500 cells per micro-well) and 1.5 mL of medium was added in each well after
10 minutes of cell settlement at 37°C. During the next 24 hours cells self-assembled and formed
spheroids. For collecting the spheroids, the micro-wells were inversed and placed into 1 mL of
medium and then centrifuged to dislodge the spheroids out from the micro-wells to the medium which
were collected for the next phase.
3.2.2 Collagen matrix
The migration of the spheroids was evaluated in a 3D collagen gel for five chemokines including
MCP1/CCL2 (50 and 100 ng/mL), MCP-3/CCL7 (50 and 100 ng/mL), MIP-1α/CCL3 (50 and
100 ng/mL), SDF-α/CXCL12 (50 and 100 ng/mL), and RANTES/CCL5 (10, 25, 35, 50 and 100 ng/mL),
five growth factors such as PDGF-BB (50 and 100 ng/mL), NGF-β (50 and 100 ng/mL), BMP-2
(50 and 100 ng/mL), IGF-1 (50 and 100 ng/mL), and TGF-β1 (10, 50 and 100 ng/mL), and three
inflammatory cytokines including IL-1β (1 and 10 ng/mL), IFN-γ (1 and 10 ng/mL), and TNF-α (1 and
10 ng/mL). A volume of 1 mL of gel was prepared by mixing 680 µL of H2O, 100 µL of PBS, 25 µL of
NaOH and 193 µL of collagen I. 100 µL gel was solidified at 37°C, 95% humidified air and 5% CO2 for
30 minutes in a 8 well chamber slide (Lab-Tek) of 0.7 cm2 growth area per well. After a 10 minute
wash with 200 µL of serum free medium containing ITS, fungizone and gentamycin, a volume of
200 µL containing the spheroids supplemented with each factor was added into each well and
incubated at 37°C and 5% CO2 for 48 hours. Two wells with spheroids in medium without factors were
seeded as a negative control. Duplicate wells of each condition were evaluated for BM donor 3 and 4,
and SYN donor 4 for more consistent results. The chemokines used were recombinant factors of
human origin and purchased from PeproTech. Concentrations of chemotactic factors were chosen
based on migratory activity described in literature.

21
3.2.3 Confocal laser scanning microscopy
The migration was analysed under a confocal laser scanning microscope (Leica TCS SP5,
imaging department of Erasmus MC, the Netherlands) 48 hours after the induction of migration. For
each condition three to six spheroids were scanned alive or after fixation in 4% paraformaldehyde
through their depth in XYZ-mode with a 10× dry objective and a Argon laser source (λ=488 nm).
Images of 512×512 pixels were obtained.
3.2.4 ImageJ data analysis
The migration of the spheroids in the collagen gel was measured using Fiji [64]. Fiji is a software
that includes ImageJ, an image processing program, with several plugins for biological functionalities.
The image processing starts with filtering the image to remove the noise and increase the contrast,
followed by binarisation, i.e. a value of 1 pixel is attributed to cells and a value of 0 pixel to the
background. The binary image was decomposed into two components, such as the main core of cells
and the cells that move from their initial position but stay attached to the core, and the single or group
of cells that detached from the main core. The former will be hereinafter named ´core and sprouting
cells´, whereas the latter will be named ´migrating cells´. The macro analyses a single spheroid at the
time and it gives the cell area of the core and sprouting cells, and of the migrating cells as a function of
the distance to the core centre in µm. Two parameters are extracted from the migrating cells
component: the migratory cell area and maximum migratory cell distance. A recruitment factor is
selected when significantly stimulate these two parameters, not just one. Image processing and
measurements were executed using Microsoft Excel 2010 and GraphPad Prism 5.
3.2.5 Statistics
Data were analysed with IBM SPSS Statistics 21. A linear mixed model was used for migratory
cell area and maximum migratory cell distance data. Multiple comparisons were analysed with Sidak
post hoc test. Conditions and donors were considered as fixed and random parameters, respectively.
Normal distribution of the data or the residuals of the data were confirmed by both
Kolmogorov-Smirnov and Shapiro-Wilk tests. Differences were considered significant when p value
was *<0.05, **<0.01 and ***<0.001.

22
3.3 Chondrogenic differentiation
3.3.1 Pellet culture
For testing chondrogenic differentiation, a three dimensional pellet culture system was used.
Pellets were formed by centrifugation of 0.2×10⁶ BM- and SYN-MSCs at 1100 rpm for 8 minutes in
15 mL conical polypropylene tubes (VWR). hMSCs were cultured in 0.5 mL of medium containing
Dulbecco’s Modified Eagle’s Medium, High (4.5 g/l) Glucose (DMEM-HG 1:1, Invirtogen), gentamycine
(1:1000, Invirtogen), fungizone (1:167, Invirtogen), sodium pyruvate 1mM (1:100, Invirtogen),
40 µg/mL proline (1:500, Sigma), ITS (1:100, B&D systems), 0.1 mM ascorbic-acid (1:500, Sigma) and
100 nM dexamethasone (1:10000, Sigma). Hereafter, this medium is named chondrogenic medium.
The chondrogenic medium was supplemented with 50 ng/mL of NGF-, SDF-1α, BMP-2, and
PDGF-BB or the combination of those factors with 10 ng/mL of TGF-β1. An addition condition:
25 ng/mL of RANTES along with 10 ng/mL of TGF-β1, was introduced later on for the SYN donor. The
tubes were incubated at 37°C with a humidified atmosphere of 5% CO2. The 0.5 mL chondrogenic
medium was carefully refreshed twice a week for 28-32 days.
3.3.2 Immunostaining
After 28-32 days, the cells were fixed in 4% formalin overnight at 4°C and then infiltrated in
paraffin. For sectioning, the pellets were embedded in paraffin blocks. Sections of 6 µm were done
using a microtome. For staining, slides were deparaffinised and stained with thionin for 5 minutes, and
subsequently hydrated. Images were taken under an optical microscope. To quantify the
chondrogenic differentiation a qualitative scale was used (Table 3).
Table 3 – Qualitative scale of chondrogenic differentiation used to quantify pellets culture.
Score Chondrogenic
differentiation
Intensity of thionin
staining Cell morphology
0 None None Fibroblast-like morphology
+ Low Low Fibroblast-like morphology
++ Moderate Moderate Small chondrocyte-like
morphology
+++ High High Chondrocyte-like morphology

23
3.3.3 Reverse transcription-polymerase chain reaction (RT-PCR)
Total RNA was extracted from the pellets using mechanical pressure and stored in 350 µL of
RNAbee (Bioconnect) at -80°C until use. RNA isolation was performed using the RNeasy micro kit
(Qiagen) and its quantification was determined using NanoDrop ND-1000 spectrophotometer (Thermo
Fisher Scientific Inc.) at 260/280 nm. Then, total RNA was converted to cDNA using Thermo Scientific
RevertAid First Strand cDNA Synthesis kit (Thermoscientific). Finally, RT-PCR was performed with a
Bio-Rad CFX96 RT-PCR Detection System using Taqman Universal PCR mastermix (Applied
Biosystems) and Q-PCR mastermix Plus for SYBR green (Eurogentec). The expression of genes,
such as collagen type II (Col2A1), collagen type X (Col10A1), aggrecan (AGCN) and SRY (sex
determining region Y)-box 9 (SOX9), were examined. Col2A1 and AGCN are markers of chondrogenic
phenotype. Col10A1 is a marker of hypertrophic phenotype. SOX9 is a transcription factor modulating
chondrogenic differentiation and matrix synthesis. Glyceraldehyde-3-phosphate dehydrogenase
(GAPDH), hypoxanthine phosphoribosyltransferase (HPRT)-1 and ribosomal protein (RP)-S27a were
used as a housekeeping genes. The relative gene expression was determined by the
2−∆𝐶𝑇 method [65].

24
4. Results

25
4.1 Chemokines and Growth Factors that Induce Migration of Bone Marrow
and Synovial MSCs
The migration potential of BM (passage 2 and 3) and SYN (passage 1 and 2) MSCs was
evaluated in a 3D collagen gel (0.58 ng/mL), supplemented with different factors, after 48 hours. A
panel of thirteen molecules: three inflammatory cytokines (IL-1α, IFN-γ, and TNF-β), five chemokines
(MCP-1/CCL2, MCP-3/CCL7, MIP-1α/CCL3, SDF-1α/CXCL12, and RANTES/CCL5), and five growth
factors (PDGF-BB, NGF-β, BMP-2, IGF-1, and TGF-β1), were tested (Table 4). Concentrations of
factors were selected according to literature, which showed that these factors at certain concentrations
induce chemotactic activity of stem cells [10-27].
Table 4 – Factors and correspondent concentrations tested in the migration assay.
Factors Concentration (ng/mL)
Inflammatory
cytokines
IL-1β Interleukine-1β 1 and 10
IFN-γ Interferon-γ 1 and 10
TNF-α Tumour necrosis factor-α 1 and 10
Chemokines
MCP-1 Monocyte chemoattractant protein-1 50 and 100
MCP-3 Monocyte chemoattractant protein-3 50 and 100
MIP-1α Macrophage inflammatory protein-1α 50 and 100
SDF-1α Stromal cell derived factor-1α 50 and 100
RANTES Regulated on Activation, Normal T Cell
Expressed and Secreted 10, 25, 35, 50 and 100
Growth
factors
PDGF-BB Platelet growth factor-BB 50 and 100
NGF-β Nerve growth factor-β 50 and 100
BMP2 Bone morphogenetic protein-2 50 and 100
IGF-1 Insulin-like growth factor-1 50 and 100
TGF-β1 Transforming growth factor-β1 10, 50 and 100
After 48 hour of migration in the collagen gel, the spheroids were imaged under the confocal
microscope (Figure 2 A). Both sprouting cells (cells that migrated from their initial position but
remained attached to the main core, Figure 2 B, red) and migrating cells (individual or group of cells
detached from the main core, Figure 2 B, green) were observed. Based on the image, the migrating
cell area and the core and sprouting cell area were computed for each spheroid as functions of the
distance reached by the migrating and sprouting cells, respectively (Figure 2 C); it is worth to point out
that it could not be possible to decompose the measurement of the core cell area and of the sprouting
cell area. Only migrating cells were quantified to evaluate the migratory potential of MSCs derived
from BM (Figure 3) and SYN (Figure 4) in response to different factors. Two parameters were
quantified: the migratory cell area (sum of the values of migrating cell area) and the maximum
migratory cell distance (last distance reached by the migrating cells). It was considered a recruitment
factor, those which significantly stimulate the migratory cell area and maximum migratory cell distance.

26
Figure 2 – Migration of a spheroid after 48 hours. A. Confocal microscope representation of a spheroid in
response to BMP-2 (A) and the correspondent image (B) and migration data (C) after analysis (the red curve represents the core and sprouting cell; the green curve represents the migrating cells).
The results of the migratiory area of BM-MSCs (Figure 3 A) demonstrated that:
- The use of 50 and 100 ng/mL of SDF-1α (p<0.01 and p<0.05, respectively), and of 10, 25 and
50 ng/mL RANTES (p<0.05, p<0.05 and p<0.01, respectively) caused significant improvement
of BM-MSCs migratory area compared to the condition without factors (negative control, NC).
No significant differences were found between the two concentrations of SDF-1α (p>0.05),
whereas among the concentrations of RANTES significant differences were evident between
50 and 100 ng/mL (p=0.1), and 10 and 100 ng/mL (p=0.05);
- Both concentrations (1 and 10 ng/mL) of IL-1β and TNF-α caused significant increase of
migratory cell area compared to the NC (p<0.001 and p<0.01, respectively). No significant
differences were evident in between the two concentrations for each factor (p>0.05);
- Among the growth factors, there was significant migration based on migratory cell area in the
presence of 50 ng/mL of PDGF-BB (p<0.001), 50 and 100 ng/mL of BMP-2 (p<0.05),
50 ng/mL of NGF-β (p<0.05), and 10 ng/mL of TGF-β1 (p<0.05) compared to the NC.
0
1000
2000
3000
4000
5000
6000
7000
0 200 400 600 800
Are
a (
μm
2)
Distance (μm)
Migrating cells
Core and sproutingcells
A B
C C
27
The estimation of migration based on maximum migratory distance of BM-MSCs (Figure 3 B) revealed
that:
- BM-MSCs migrated significantly (p<0.001) compared to the NC in the presence of 1 and
10 ng/mL of IL-1β; 1 ng/mL of TNF-α; 50 and 100 ng/mL of SDF-1α; 10, 25 and 50 ng/mL of
RANTES; 50 ng/mL of PDGF-BB; 50 and 100 ng/mL of NGF-β; 50 and 100 ng/mL of BMP-2;
and 10 and 50 ng/mL of TGF-β;
- A slight increase in the maximum migratory cell distance compared to the NC was seen in
response to 100 ng/mL of MCP-1; 100 ng/mL of MCP-3; 100 ng/mL of RANTES; 10 ng/mL of
TNF-α; and 50 and 100 ng/mL of MIP-1α;
- Both concentrations of IFN-γ demonstrated no differences in maximum migration cell distance
compared to the NC.
A summary of the normalized migratory area and maximum migratory distance of BM-MSCs in the
presence of different factors compared to the NC is presented in Table 5.
Based on the evaluation of the obtained migratory area and maximum migratory distance of
BM-MSCs in the presence of the factors, the highest and significant migration potential of BM-MSCs in
the presence of the different factors, the highest and significant migration potential of BM-MSCs was
observed in response to both concentrations of IL-1β and 50 ng/mL of PDGF-BB, followed by 1 ng/mL
of TNF-α, 50 and 100 ng/mL SDF-1α, 10, 25 and 50 ng/mL of RANTES, 50 ng/mL of NGF-β, and
50 ng/mL of BMP-2.
Furthermore, the migration of SYN-MSCs was carried out in the presence of the previous factors
and the same parameters (migratory cell area and maximum migratory cell distance) were used to
evaluate it (Figure 4).
For migratory area of SYN-MSCs (Figure 4 A):
- A very significant migration compared to the NC was measured in the presence of some
chemokines, such as 50 ng/mL of MCP-1, 50 and 100 ng/mL SDF-1α, and 10 and 25 ng/mL
of RANTES (p<0.001); Significant differences were found between the two concentrations of
MCP-1 (p<0.01), and among the concentrations of RANTES (25 and 50 ng/mL, p<0.001;
25 and 100 ng/mL, p<0.001; 10 and 100 ng/mL, p<0.05);
- The presence of inflammatory cytokines, such as IL-1β, TNF-α and INF-δ did not show
significant differences in migratory cell area comparing to the NC nor between the two
different concentrations (1 and 10 ng/mL);
- The growth factors, 50 ng/mL of PDGF-BB (p<0.001), 50 ng/mL of NGF-β (p<0.05) and
50 ng/mL of BMP-2 (p<0.001) caused significant improvement.
Regarding maximum migratory distance of SYN-MSCs (Figure 4 B):
- TNF-α was the only inflammatory cytokine showing an increase in the maximum migratory cell
distance (p<0.05);
- Most of the cytokines increased significantly the migration cell distance compared to the NC,
except both concentrations of MIP-1α;

28
- The growth factors showed very significant increased (p<0.001) in the presence of both
concentrations of PDGF-BB, NGF-β and BMP-2, and 10 and 50 ng/mL of TGF-β1.
A summary of the normalized migratory area and maximum migratory distance of SYN-MSCs in
the presence of different factors with the reference to the NC is presented in Table 6.
For SYN-MSCs the factors that stimulated the highest and significant migration were 50 and
100 ng/mL of SDF-1α, 10 and 25 ng/mL of RANTES, 50 ng/mL of NGF-β, 50 ng/mL of BMP-2, and
50 ng/mL of PDGF-BB.
The comparison of migration of BM- and SYN-MSCs showed that IL-1β and TNF-α were
recruitment factors for BM-MSCs, but not for SYN-MSCs. MCP-1 showed a significant increase in
migratory area and distance of SYN-MSCs, however this behaviour was not evident for BM-MSCs. In
addition, BM-MSCs migrated more in the presence of 50 ng/mL of RANTES, but SYN-MSCs
responded better for lower concentrations of RANTES (10 and 25 ng/mL). On the other hand, both cell
types showed significant migration in response to 50 ng/mL of PDGF-BB, NGF-β, SDF-1α and BMP-2.
29
Figure 3 - Migration of MSCs derived from BM in response to different factors. In vitro migration of
BM-MSCs in collagen gel supplemented with culture medium containing different factors was evaluated after 48 hours under confocal microscopy. Parameters such as migratory cell area (A) and maximum migratory cell distance (B) were used to quantify the migration potential of MSCs in response to IL-1α, IFN-γ, TNF-β, MCP-1, MCP-3, MIP-1α, SDF-1α, RANTES, PDGF-BB, NGF-β, BMP-2, IGF-1, and TGF-β1. Data is expressed as normalised values with respect to the negative control, NC, (n=4 independent experiments. * p<0.05; ** p<0.01; *** p<0.001 where p is evaluated with reference to the NC).
NC 1
10 1
10 1
10
50
100
50
100
50
100
50
100
10
25
50
100
50
100
50
100
50
100
50
100
10
50
100
0 .0
0 .5
1 .0
1 .5
2 .0
2 .5
3 .0
3 .5M
igra
tory
ce
ll a
re
a (
no
rm
ali
ze
d t
o c
on
tro
l)
* * *
* * *
* *
* *
* * *
*
* *
* * *
*
**
*
*
IL 1 IN F T N F M C P 1 M C P 3 M IP 1 S D F 1 R A N T E S P D G F B B N G F B M P 2 IG F 1 T G F 1
NC 1
10 1
10 1
10
50
100
50
100
50
100
50
100
10
25
50
100
50
100
50
100
50
100
50
100
10
50
100
0 .0 0
0 .2 5
0 .5 0
0 .7 5
1 .0 0
1 .2 5
1 .5 0
1 .7 5
Ma
x.
mig
ra
tory
ce
ll d
ista
nc
e (
no
rm
ali
ze
d t
o c
on
tro
l)
* * * * * *
* * *
*
* * *
* *
* * *
* *
*
IL 1 IN F T N F M C P 1 M C P 3 M IP 1 S D F 1 R A N T E S P D G F B B N G F B M P 2 IG F 1 T G F 1
* *
* **
* * ** * *
* * ** * *
* * *
* * *
* * *
* * * * * *
* * *
A
B
(ng/mL)
(ng/mL)

30
Table 5 – Normalised migratory cell area and maximum migratory cell distance of BM-MSCs in the presence of different factors with reference to the negative control. Values of significant migratory cell area and maximum migratory cell distance are represented as * p<0.05; ** p<0.01; *** p<0.001 where p is evaluated
with reference to the negative control (n=4 independent experiments).
Factor and concentration Migratory cell area Max. migratory cell distance
Negative control 1±0.15 1±0.04
IL-1β 1 ng/mL 2.62±0.27 *** 1.32±0.01 ***
10 ng/mL 2.48±0.10 *** 1.30±0.01 ***
INF-δ 1 ng/mL 1.13±0.18 0.98±0.03
10 ng/mL 0.82±0.08 0.97±0.04
TNF-α 1 ng/mL 1.59±0.28 ** 1.24±0.02 ***
10 ng/mL 1.62±0.16 ** 1.20±0.01 *
MCP-1 50 ng/mL 1.15±0.33 1.12±0.01
100 ng/mL 1.32±0.06 1.15±0.00 **
MCP-3 50 ng/mL 1.19±0.16 1.13±0.03
100 ng/mL 1.37±0.07 1.22±0.01 **
MIP-1α 50 ng/mL 1.36±0.24 1.19±0.01 *
100 ng/mL 0.78±0.05 1.10±0.03 *
SDF-1α 50 ng/mL 1.59±0.15 ** 1.33±0.01 ***
100 ng/mL 1.51±0.24 * 1.19±0.04 ***
RANTES
10 ng/mL 1.59±0.33 * 1.29±0.01 ***
25 ng/mL 1.58±0.34 * 1.22±0.03 ***
50 ng/mL 1.58±0.24 ** 1.26±0.02 ***
100 ng/mL 0.71±0.09 1.08±0.02 **
PDGF-BB 50 ng/mL 1.98±0.34 *** 1.36± 0.01 ***
100 ng/mL 1.4±0.16 1.17± 0.02**
NGF-β 50 ng/mL 1.46±0.07 * 1.30±0.02 ***
100 ng/mL 1.23±0.10 1.19±0.03 ***
BMP-2 50 ng/mL 1.47±0.13 * 1.35±0.05 ***
100 ng/mL 1.55±0.10 * 1.23±0.01 ***
IGF-1 50 ng/mL 1.15±0.55 1.04±0.01
100 ng/mL 0.88±0.06 1.09±0.03
TGF-β1
10 ng/mL 1.86±0.7 * 1.17±0.02 ***
50 ng/mL 1.28±0.20 1.21±0.03 ***
100 ng/mL 0.95±0.12 1.03±0.02

31
Figure 4 - Migration of MSCs derived from SYN in response to different factors. In vitro migration of
SYN-MSCs in collagen gel supplemented with culture medium containing different factors was evaluated after 48 hours under confocal microscopy. Parameters such as migratory cell area (A) and maximum migratory cell distance (B) were used to quantify the migration potential of MSCs in response to IL-1α, IFN-γ, TNF-β, MCP-1, MCP-3, MIP-1α, SDF-1α, RANTES, PDGF-BB, NGF-β, BMP-2, IGF-1, and TGF-β1. Data is expressed as normalised values with respect to the negative control, NC, (n=4 independent experiments. * p<0.05; ** p<0.01; *** p<0.001 where p is evaluated with reference to the NC).
NC 1
10 1
10 1
10
50
100
50
100
50
100
50
100
10
25
35
50
100
50
100
50
100
50
100
50
100
10
50
100
0 .0
0 .5
1 .0
1 .5
2 .0
2 .5
3 .0
3 .5M
igra
tory
ce
ll a
re
a (
no
rm
ali
ze
d t
o c
on
tro
l)
* * *
* * *
* * *
* * *
* * * * * *
* * *
*
IL 1 IN F T N F M C P 1 M C P 3 M IP 1 S D F 1 R A N T E S P D G F B B N G F B M P 2 IG F 1 T G F 1
* *
NC 1
10 1
10 1
10
50
100
50
100
50
100
50
100
10
25
35
50
100
50
100
50
100
50
100
50
100
10
50
100
0 .0 0
0 .2 5
0 .5 0
0 .7 5
1 .0 0
1 .2 5
1 .5 0
1 .7 5
Ma
x.
mig
ra
tory
ce
ll d
ista
nc
e (
no
rm
ali
ze
d t
o c
on
tro
l)
* * *
* * *
* * *
* * *
* * *
* * ** * *
*
IL 1 IN F T N F M C P 1 M C P 3 M IP 1 S D F 1 R A N T E S P D G F B B N G F B M P 2 IG F 1 T G F 1
* * *
* * *
* * *
* * *
* * *
* * *
* * *
* * ** * * ** *
* * *
* *
* * ** * *
A
B
(ng/mL)
(ng/mL)
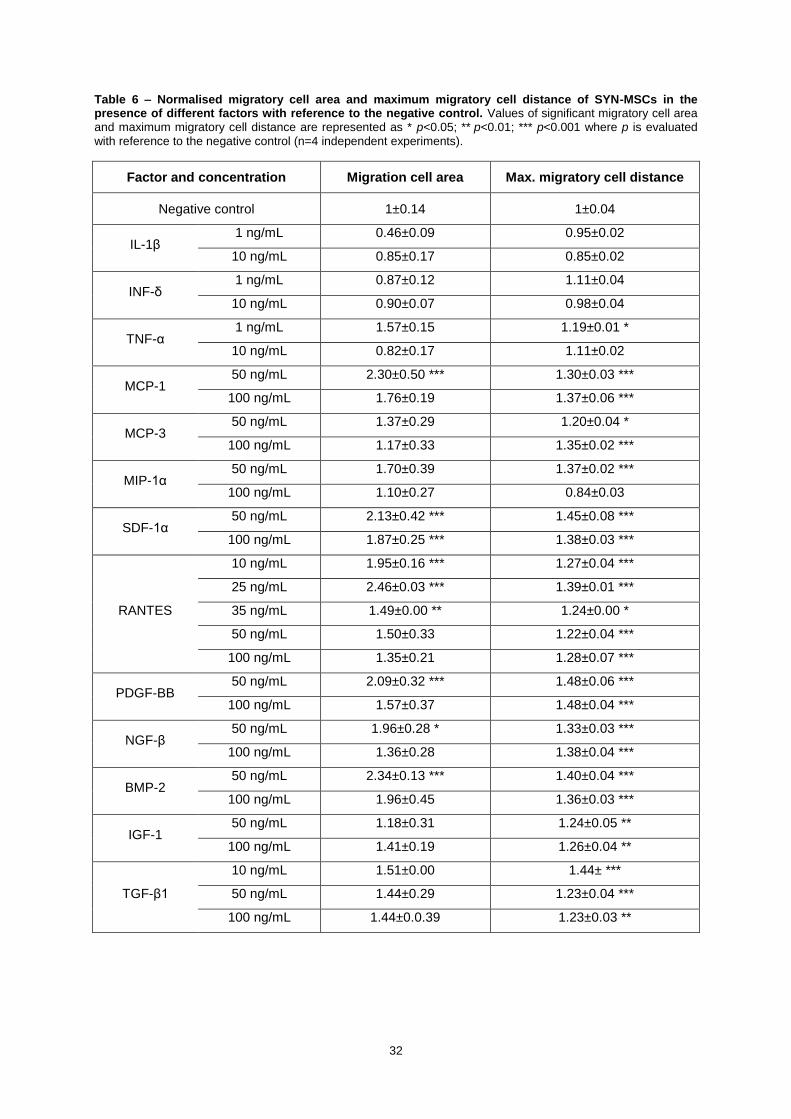
32
Table 6 – Normalised migratory cell area and maximum migratory cell distance of SYN-MSCs in the presence of different factors with reference to the negative control. Values of significant migratory cell area and maximum migratory cell distance are represented as * p<0.05; ** p<0.01; *** p<0.001 where p is evaluated
with reference to the negative control (n=4 independent experiments).
Factor and concentration Migration cell area Max. migratory cell distance
Negative control 1±0.14 1±0.04
IL-1β 1 ng/mL 0.46±0.09 0.95±0.02
10 ng/mL 0.85±0.17 0.85±0.02
INF-δ 1 ng/mL 0.87±0.12 1.11±0.04
10 ng/mL 0.90±0.07 0.98±0.04
TNF-α 1 ng/mL 1.57±0.15 1.19±0.01 *
10 ng/mL 0.82±0.17 1.11±0.02
MCP-1 50 ng/mL 2.30±0.50 *** 1.30±0.03 ***
100 ng/mL 1.76±0.19 1.37±0.06 ***
MCP-3 50 ng/mL 1.37±0.29 1.20±0.04 *
100 ng/mL 1.17±0.33 1.35±0.02 ***
MIP-1α 50 ng/mL 1.70±0.39 1.37±0.02 ***
100 ng/mL 1.10±0.27 0.84±0.03
SDF-1α 50 ng/mL 2.13±0.42 *** 1.45±0.08 ***
100 ng/mL 1.87±0.25 *** 1.38±0.03 ***
RANTES
10 ng/mL 1.95±0.16 *** 1.27±0.04 ***
25 ng/mL 2.46±0.03 *** 1.39±0.01 ***
35 ng/mL 1.49±0.00 ** 1.24±0.00 *
50 ng/mL 1.50±0.33 1.22±0.04 ***
100 ng/mL 1.35±0.21 1.28±0.07 ***
PDGF-BB 50 ng/mL 2.09±0.32 *** 1.48±0.06 ***
100 ng/mL 1.57±0.37 1.48±0.04 ***
NGF-β 50 ng/mL 1.96±0.28 * 1.33±0.03 ***
100 ng/mL 1.36±0.28 1.38±0.04 ***
BMP-2 50 ng/mL 2.34±0.13 *** 1.40±0.04 ***
100 ng/mL 1.96±0.45 1.36±0.03 ***
IGF-1 50 ng/mL 1.18±0.31 1.24±0.05 **
100 ng/mL 1.41±0.19 1.26±0.04 **
TGF-β1
10 ng/mL 1.51±0.00 1.44± ***
50 ng/mL 1.44±0.29 1.23±0.04 ***
100 ng/mL 1.44±0.0.39 1.23±0.03 **

33
4.2 Chondrogenic Differentiation of Bone Marrow and Synovium MSCs
Cartilage regeneration not only requires the migration of mesenchymal stem cells to the defects
but also the chondrogenic differentiation of the recruited cells. Therefore, it is of interest to determine
whether the factors which induce significant migration of MSCs evaluated in the previous assays have
an effect on chondrogenic differentiation. To achieve this, a 3D pellet culture was induced for 3 BM
donors and 1 SYN donor for 28 or 32 days. The BM-MSCs of the first donor were cultured 32 days in
chondrogenic medium supplemented with 10 ng/mL TGF-β1 (positive control, PC), 50 ng/mL NGF-β,
50 ng/mL PDGF-BB, 50 ng/mL BMP-2, and 50 ng/mL SDF-1α, or the combination of TGF-β1 with
NGF-β (TGF-β1/NGF-β), PDGF-BB (TGF-β1/PDGF-BB), BMP-2 (TGF-β1/BMP-2), or SDF-1α
(TGF-β1/SDF-1α); same concentration of factors as above. TGF-β1 has been proved in several works
to be able to improve chondrogenic differentiation; specifically, 10 ng/mL was identified as the best
concentration [30, 31, 45, 47, 49], and after it has been commonly adopted. Despite inducing
significant migration of BM-MSCs, IL-1β and TNF-α were not considered in this assay as they are
known to inhibit chondrogenesis [66].
Based on thionin staining, a qualitative scale as described in section 3.3.2 was used to quantify
chondrogenic differentiation of the pellets of each donor (Table 7). Thionin binds to carbohydrates
which are a main component of glycosaminoglycan (GAGs). Since GAGs are part of the cartilage
matrix, they are used to measure the quality of the cartilage tissue.
Table 7 – Qualitative quantification of chondrogenic differentiation of BM-MSCs after 28 or 32 days of pellet culture in the presence of TGF-β1 (positive control), NGF-β, BMP-2, SDF-1α, PDGF-BB, the combination of TGF-β1 /NGF-β, TGF-β1/BMP-2, TGF-β1/SDF-1 and TGF-β1/PDGF-BB. (n=3 independent
experiments. 0, +, ++ and +++ represent none, low, moderate and high chondrogenic differentiation, respectively).
Factor
Donor TGF-β1 NGF-β BMP-2 SDF-1α PDGF-BB TGF-β1/
NGF-β
TGF-β1/
BMP-2
TGF-β1/
SDF-1α
TGF-β1/
PDGF-BB
1 ++ 0 0 0 0 ++ +++ ++ +
2 + - - - 0 ++ +++ + +
3 ++ - - - 0 ++/+++ +++ ++ +
After 32 days of pellet culture, donor 1 revealed:
- No thionin staining in the presence of NGF-β, BMP-2, SDF-1α and PDGF-BB (Figure 5 B1,
C1, D1 and E1, respectively);
- Very similar intensity of the thionin staining and chondrogenic-like morphology in response to
TGF-β1/NGF-β and TGF-β1/SDF-1α compared to TGF-β1 (Figure 5 G1, I1 and A1
respectively);
- An increment in the proliferation of the cells with a fibroblast-like morphology in response to
PDGF-BB and the combinatorial effect of TGF-β1/PDGF-BB (Figure 5 E1 and H1);
- The best thionin staining and highest chondrocyte-like morphology in the presence of
TGF-β1/BMP-2 (Figure 5 H1).

34
As mentioned previously, chondrogenic differentiation was tested for two more BM donors. In
these cases, pellet culture was carried out for 28 days in the presence of PDGF-BB and the
combination of TGF-β1/NGF-β, TGF-β1/PDGF-BB, TGF-β1/BMP-2 or TGF-β1/SDF-1α. Conditions
such as NGF-β, BMP-2, and SDF-1α were excluded because they did not show chondrogenic
differentiation in donor 1. The condition of PDGF-BB alone, despite having not demonstrated
chondrogenesis, was still tested to check if this condition would show the same increase in the
number of cells with a fibrosblast-like morphology for the next two donors.
The main outcomes of the pellet culture performed on donor 2 are the following:
- A slight chondrogenic potential in the presence of TGF-β1 was shown by the low thionin
staining (Figure 5 A2);
- No chondrogenic differentiation was seen in response to PDGF-BB; on the other
hand an increase in the proliferation of cells with a fibroblastic-like morphology was
present (Figure 5 B2). This latter result was also shown in the presence of TGF-β1/PDGF-BB
(Figure 5 F2);
- No inhibition nor improvement in chondrogenesis was observed in the presence of
TGF-β1/SDF-1α (Figure 5 E2);
- An increase in GAGs expresion compared to TGF-β1 was seen for the following combinations:
TGF-β1/NGF-β, as well as TGF-β1/BMP-2 (Figure 5 C2 and D2, respectively).
Furthermore, thionin staining of donor 3 after 28 days of pellet culture demonstrated:
- Pellets in response to PDGF-BB showed no thionin staining (Figure 5 B3);
- A small number of chondrocyte-like morphology was seen in the structure of the pellets
treated with TGF-β1/NGF-β; however no significant staining was observed with reference to
TGF-β1 (Figure 5 C3 and A3, respectively);
- The highest accumulation of GAGs and chondrocyte-like morphology in the presence of
TGF-β1/BMP-2 compared to TGF-β1 (Figure 5 D3 and A3, respectively);
- No notable differences in thionin staining in the pellets which were treated with
TGF-β1/SDF-1α, and TGF-β1/PDGF-BB compared to TGF-β1 (Figure 5 E3 and F3,
respectively); however, on the one hand TGF-β1/SDF-1α showed a small chondrocyte-like
morphology and on the other hand TGF-β1/PDGF-BB demonstrated a fibroblast-like
morphology.
Altogether, pellets supplemented with TGF-β1/BMP-2 demonstrated for the three donors the
highest thionin staining among the tested factors; beyond that, the existence of the chondrocyte
morphology indicated close proximity to cartilage tissue. One more condition, TGF-β1/NGF-β, verified
the same trend in the three donors: high expression of GAGs, however not higher than in the pellets
from TGF-β1 (PC), and a small number of chondrocytes, which was also seen in the TGF-β1
treatment.

35
A1) TGF-β1 B1) NGF-β C1) BMP-2
D1) SDF-1α E1) PDGF-BB G1) TGF-β1/NGF-β
1
H1) TGF-β1/BMP-2 I1) TGF-β1/SDF-1α
H1) TGF-β1/PDGF-BB
B2) PDGF-BB
2
A2) TGF-β1 C2) TGF-β1/NGF-β
D2) TGF-β1/BMP-2
2
E2) TGF-β1/SDF-1α
2
F2) TGF-β1/PDGF-BB
2
Donor 2
Donor 1

36
Figure 5 - GAGs analyses of BM-MSCs after 28 or 32 days of pellets culture treated in chondrogenic medium supplemented with additional factors. Thionin staining was performed to detect GAGs in the ECM of
the pellets treated in chondrogenic medium supplemented with TGF-β1 (A1, A2, A3), NGF-β (B1), BMP-2 (C1), SDF-1α (D1) and PDGF-BB (E1, B2, B3), TGF-β1/NGF-β (F1, C2, C3), TGF-β1/BMP-2 (G1, D2, D3), TGF-β1/SDF-1α (H1, E2, E3), TGF-β1/PDGF-BB (I1, F2, F3) for 28 or 32 days. Images are representative of three pellets of three donors. Magnification 100×.
Later on, the gene expression of the pellets obtained from BM-hMSCs (donor 2) treated in six
conditions, including TGF-β1 (PC), PDGF-BB and the combinations of TGF-β1/NGF-β,
TGF-β1/BMP-2, TGF-β1/SDF-1α and TGF-β1/PDGF-BB, was examined for collagen type II (Col2A1)
and X (Col10A1), aggrecan (AGCN) and SOX9 (Figure 6). Col2A1, a chondrogenic marker, was
increased for TGF-β1/BMP-2 compared to the TGF-β1 (Figure 6 A). From the other chondrogenic
genes (ACGN and SOX9), since very scattered results were found, a larger number of pellets should
have been analysed in order to obtain reliable results (Figure 6 B and C). Moreover, Col10A1, the
hypertrophic marker, was increased for TGF-β1/NGF-β, TGF-β1/BMP-2 and TGF-β1/SDF-1α
compared to TGF-β1 (Figure 6 C). Based upon chondrogenic gene expression and GAG staining,
TGF-β1/BMP-2 treatment induced the best chondrogenic differentiation on BM-MSCs. However more
donors should be analysed for all conditions to take reasonable conclusions.
Additional studies of chondrogenic differentiation were carried out with MSCs derived from
synovium in order to assess the response of the considered factors on these cells compared to the
obtained outcomes on BM-MSCs, above presented. According to the migration analysis of SYN-MSCs
described in the previous section, the pellet culture was performed with chondrogenic medium
supplemented with 10 ng/mL TGF-β1 (PC) or the combination of TGF-β1 with 50 ng/mL NGF-β
(TGF-β1/NGF-β), 50 ng/mL PDGF-BB (TGF-β1/PDGF-BB), 50 ng/mL BMP-2 (TGF-β1/BMP-2),
50 ng/mL SDF-1α (TGF-β1/SDF-1α) or 25 ng/mL of RANTES (TGF-β1/RANTES). The use of the
factors alone was not considered, due to the absence of GAG expression in the previous
experiments with BM donors. The thionin staining was qualitatively quantified after 32 days of pellets
A3) TGF-
β1
B3) PDGF-BB
3
C3) TGF-β1/NGF-β
F3) TGF-β1/PDGF-BB
3
E3) TGF-β1/SDF-1α D3) TGF-β1/BMP-2
3
Donor 3
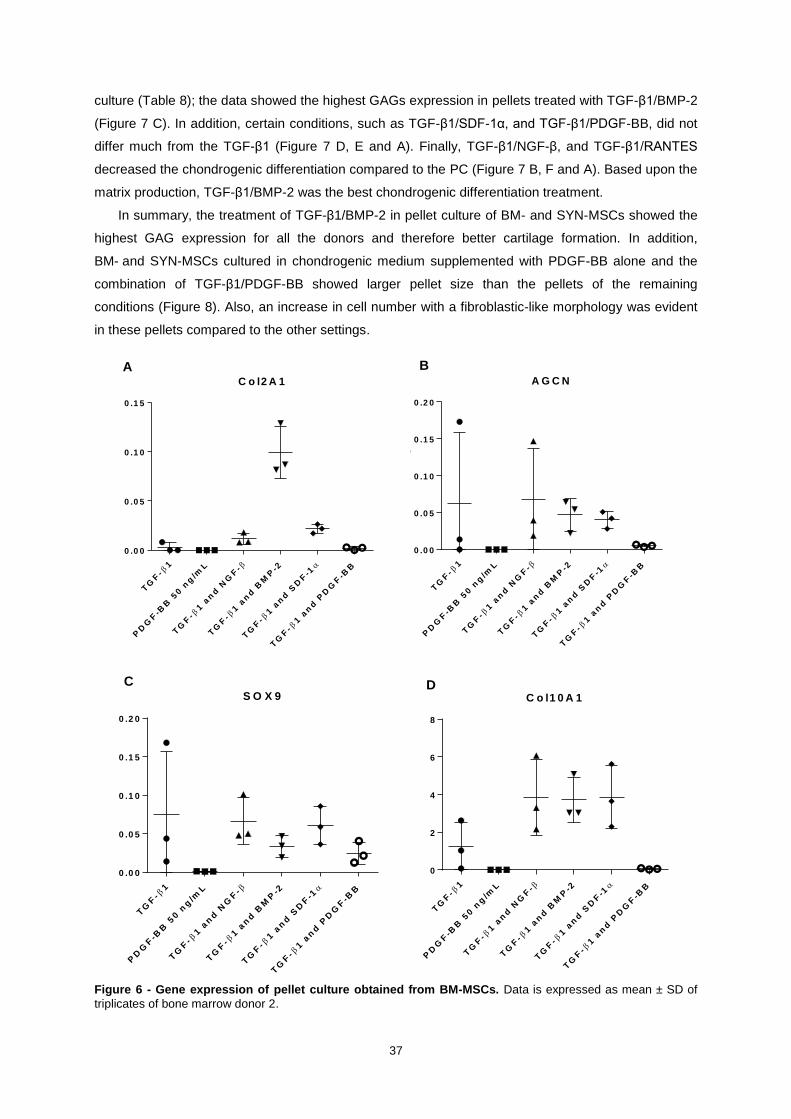
37
culture (Table 8); the data showed the highest GAGs expression in pellets treated with TGF-β1/BMP-2
(Figure 7 C). In addition, certain conditions, such as TGF-β1/SDF-1α, and TGF-β1/PDGF-BB, did not
differ much from the TGF-β1 (Figure 7 D, E and A). Finally, TGF-β1/NGF-β, and TGF-β1/RANTES
decreased the chondrogenic differentiation compared to the PC (Figure 7 B, F and A). Based upon the
matrix production, TGF-β1/BMP-2 was the best chondrogenic differentiation treatment.
In summary, the treatment of TGF-β1/BMP-2 in pellet culture of BM- and SYN-MSCs showed the
highest GAG expression for all the donors and therefore better cartilage formation. In addition,
BM- and SYN-MSCs cultured in chondrogenic medium supplemented with PDGF-BB alone and the
combination of TGF-β1/PDGF-BB showed larger pellet size than the pellets of the remaining
conditions (Figure 8). Also, an increase in cell number with a fibroblastic-like morphology was evident
in these pellets compared to the other settings.
Figure 6 - Gene expression of pellet culture obtained from BM-MSCs. Data is expressed as mean ± SD of
triplicates of bone marrow donor 2.
C o l2 A 1
TG
F-
1
PD
GF
-BB
50 n
g/m
L
TG
F-
1 a
nd
NG
F-
TG
F-
1 a
nd
BM
P-2
TG
F-
1 a
nd
SD
F-1
TG
F-
1 a
nd
PD
GF
-BB
0 .0 0
0 .0 5
0 .1 0
0 .1 5
Fo
ld c
ha
ng
e
A G C N
TG
F-
1
PD
GF
-BB
50 n
g/m
L
TG
F-
1 a
nd
NG
F-
TG
F-
1 a
nd
BM
P-2
TG
F-
1 a
nd
SD
F-1
TG
F-
1 a
nd
PD
GF
-BB
0 .0 0
0 .0 5
0 .1 0
0 .1 5
0 .2 0F
old
ch
an
ge
S O X 9
TG
F-
1
PD
GF
-BB
50 n
g/m
L
TG
F-
1 a
nd
NG
F-
TG
F-
1 a
nd
BM
P-2
TG
F-
1 a
nd
SD
F-1
TG
F-
1 a
nd
PD
GF
-BB
0 .0 0
0 .0 5
0 .1 0
0 .1 5
0 .2 0
Fo
ld c
ha
ng
e
C o l1 0 A 1
TG
F-
1
PD
GF
-BB
50 n
g/m
L
TG
F-
1 a
nd
NG
F-
TG
F-
1 a
nd
BM
P-2
TG
F-
1 a
nd
SD
F-1
TG
F-
1 a
nd
PD
GF
-BB
0
2
4
6
8
A B
C D
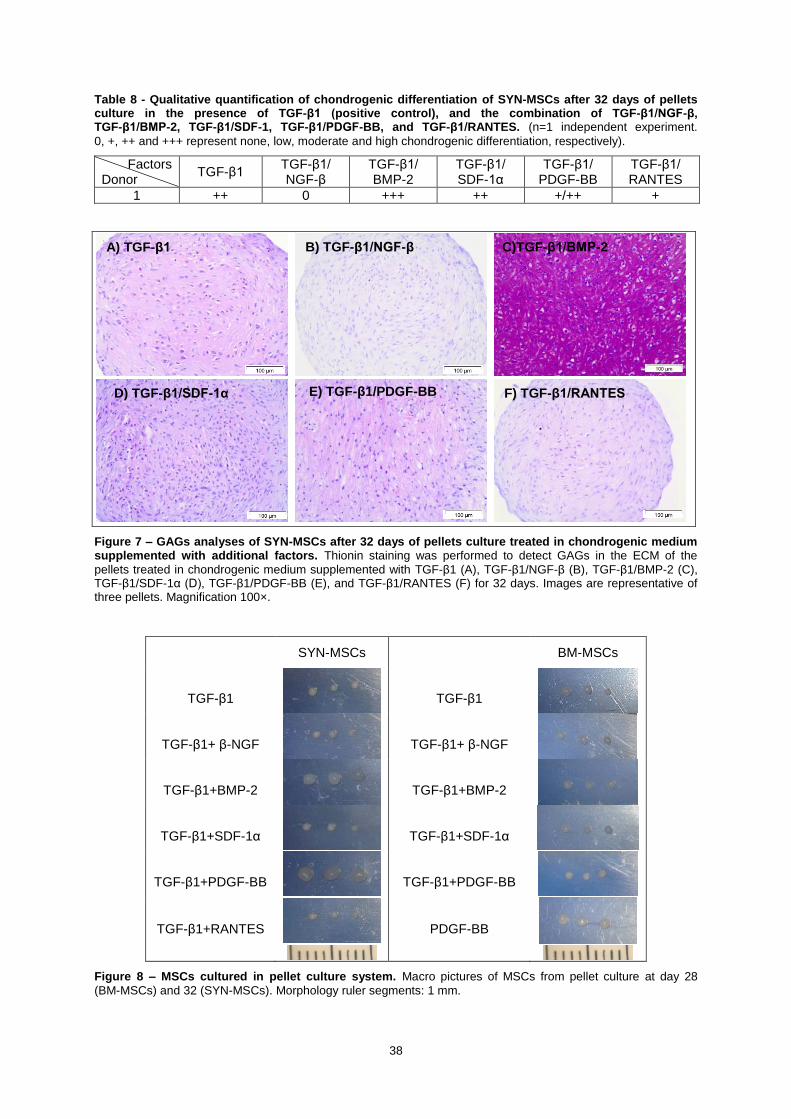
38
Table 8 - Qualitative quantification of chondrogenic differentiation of SYN-MSCs after 32 days of pellets culture in the presence of TGF-β1 (positive control), and the combination of TGF-β1/NGF-β, TGF-β1/BMP-2, TGF-β1/SDF-1, TGF-β1/PDGF-BB, and TGF-β1/RANTES. (n=1 independent experiment.
0, +, ++ and +++ represent none, low, moderate and high chondrogenic differentiation, respectively).
Factors Donor
TGF-β1 TGF-β1/ NGF-β
TGF-β1/ BMP-2
TGF-β1/ SDF-1α
TGF-β1/ PDGF-BB
TGF-β1/ RANTES
1 ++ 0 +++ ++ +/++ +
Figure 7 – GAGs analyses of SYN-MSCs after 32 days of pellets culture treated in chondrogenic medium supplemented with additional factors. Thionin staining was performed to detect GAGs in the ECM of the
pellets treated in chondrogenic medium supplemented with TGF-β1 (A), TGF-β1/NGF-β (B), TGF-β1/BMP-2 (C), TGF-β1/SDF-1α (D), TGF-β1/PDGF-BB (E), and TGF-β1/RANTES (F) for 32 days. Images are representative of three pellets. Magnification 100×.
SYN-MSCs
BM-MSCs
TGF-β1
TGF-β1
TGF-β1+ β-NGF
TGF-β1+ β-NGF
TGF-β1+BMP-2
TGF-β1+BMP-2
TGF-β1+SDF-1α
TGF-β1+SDF-1α
TGF-β1+PDGF-BB
TGF-β1+PDGF-BB
TGF-β1+RANTES
PDGF-BB
Figure 8 – MSCs cultured in pellet culture system. Macro pictures of MSCs from pellet culture at day 28
(BM-MSCs) and 32 (SYN-MSCs). Morphology ruler segments: 1 mm.
A) TGF-β1
B) TGF-β1/NGF-β
D) TGF-β1/SDF-1α
C)TGF-β1/BMP-2
E) TGF-β1/PDGF-BB
F) TGF-β1/RANTES

39
4.3 Chondrogenesis of fibrous and non-fibrous synovium sample
In this section, the chondrogenic differentiation for a sample of synovium with a fibrous and
non-fibrous tissue is described. The sample was tested in order to understand whether the fibrous
nature of synovium influences the chondrogenic differentiation of the MSCs. The MSCs were isolated
separately from the fibrous and non-fibrous regions of the same synovium donor as described in
section 3.1.2 and seeded as monolayer culture (Figure 9 A and B). The images of fibrous and
non-fibrous regions are shown in Figure 9 C and D, respectively. The chondrogenesis of the fibrous
and non-fibrous tissue (passage 1) was assessed in a 3D pellet culture for 28 days in chondrogenic
medium supplemented with 10 ng/mL TGF-β1 (Figure 9 E and F). Thionin staining was present in the
non-fibrous tissue and not in the fibrous tissue (Figure 9 E and F), showing that chondrogenic
differentiation was influenced negatively in the fibrous tissue. However more donors have to be tested
to take reliable conclusions whether chondrogenesis is affected by fibrous nature of synovium.
Figure 9 - MSCs derived from fibrous (left) and non-fibrous (right) synovium. Optical microscope images of
monolayer culture of MSCs (A and B) derived from a fibrous (C) and non-fibrous (D) synovium pieces and the correspondent pellet after 28 days of culture (E and F). Magnification 100×.
A B
C D
E
D
F

40
5. Discussion
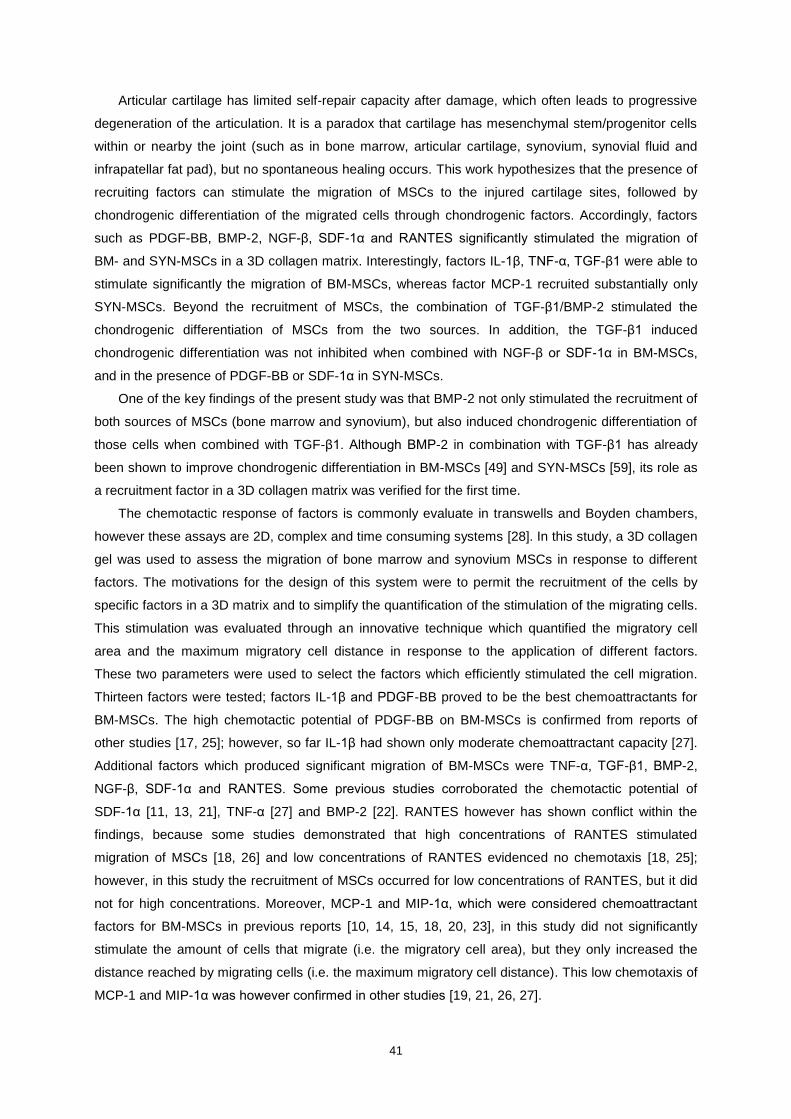
41
Articular cartilage has limited self-repair capacity after damage, which often leads to progressive
degeneration of the articulation. It is a paradox that cartilage has mesenchymal stem/progenitor cells
within or nearby the joint (such as in bone marrow, articular cartilage, synovium, synovial fluid and
infrapatellar fat pad), but no spontaneous healing occurs. This work hypothesizes that the presence of
recruiting factors can stimulate the migration of MSCs to the injured cartilage sites, followed by
chondrogenic differentiation of the migrated cells through chondrogenic factors. Accordingly, factors
such as PDGF-BB, BMP-2, NGF-β, SDF-1α and RANTES significantly stimulated the migration of
BM- and SYN-MSCs in a 3D collagen matrix. Interestingly, factors IL-1β, TNF-α, TGF-β1 were able to
stimulate significantly the migration of BM-MSCs, whereas factor MCP-1 recruited substantially only
SYN-MSCs. Beyond the recruitment of MSCs, the combination of TGF-β1/BMP-2 stimulated the
chondrogenic differentiation of MSCs from the two sources. In addition, the TGF-β1 induced
chondrogenic differentiation was not inhibited when combined with NGF-β or SDF-1α in BM-MSCs,
and in the presence of PDGF-BB or SDF-1α in SYN-MSCs.
One of the key findings of the present study was that BMP-2 not only stimulated the recruitment of
both sources of MSCs (bone marrow and synovium), but also induced chondrogenic differentiation of
those cells when combined with TGF-β1. Although BMP-2 in combination with TGF-β1 has already
been shown to improve chondrogenic differentiation in BM-MSCs [49] and SYN-MSCs [59], its role as
a recruitment factor in a 3D collagen matrix was verified for the first time.
The chemotactic response of factors is commonly evaluate in transwells and Boyden chambers,
however these assays are 2D, complex and time consuming systems [28]. In this study, a 3D collagen
gel was used to assess the migration of bone marrow and synovium MSCs in response to different
factors. The motivations for the design of this system were to permit the recruitment of the cells by
specific factors in a 3D matrix and to simplify the quantification of the stimulation of the migrating cells.
This stimulation was evaluated through an innovative technique which quantified the migratory cell
area and the maximum migratory cell distance in response to the application of different factors.
These two parameters were used to select the factors which efficiently stimulated the cell migration.
Thirteen factors were tested; factors IL-1β and PDGF-BB proved to be the best chemoattractants for
BM-MSCs. The high chemotactic potential of PDGF-BB on BM-MSCs is confirmed from reports of
other studies [17, 25]; however, so far IL-1β had shown only moderate chemoattractant capacity [27].
Additional factors which produced significant migration of BM-MSCs were TNF-α, TGF-β1, BMP-2,
NGF-β, SDF-1α and RANTES. Some previous studies corroborated the chemotactic potential of
SDF-1α [11, 13, 21], TNF-α [27] and BMP-2 [22]. RANTES however has shown conflict within the
findings, because some studies demonstrated that high concentrations of RANTES stimulated
migration of MSCs [18, 26] and low concentrations of RANTES evidenced no chemotaxis [18, 25];
however, in this study the recruitment of MSCs occurred for low concentrations of RANTES, but it did
not for high concentrations. Moreover, MCP-1 and MIP-1α, which were considered chemoattractant
factors for BM-MSCs in previous reports [10, 14, 15, 18, 20, 23], in this study did not significantly
stimulate the amount of cells that migrate (i.e. the migratory cell area), but they only increased the
distance reached by migrating cells (i.e. the maximum migratory cell distance). This low chemotaxis of
MCP-1 and MIP-1α was however confirmed in other studies [19, 21, 26, 27].

42
An additional reservoir of MSCs is synovium. Its higher chondrogenic potential compared to BM,
AT, muscle, periosteum and infrapatellar fat pad [58] makes synovium a promising cell source for
cartilage regeneration; however, very few studies tried to evaluate the migration of SYN-MSCs in
response to different stimuli. This study assessed the capacity of different factors to stimulate
migration of SYN-MSCs in a 3D collagen matrix. The findings showed for the first time significant
migration of SYN-MSCs in the presence of PDGF-BB, BMP-2, NGF-β, MCP-1 and RANTES. SDF-1α
showed also an increase in the recruitment of SYN-MSCs, confirming results already reported in the
literature [24, 37].
Although many factors have gained significant interest as chemoattractants, few studies tried to
combine the recruitment and chondrogenic differentiation potential of MSCs. In this study, not only the
recruitment of MSCs, but also the chondrogenesis of MSCs from two available sources adjacent to
articular cartilage, such as bone marrow and synovium, was assessed in the 3D pellet culture. Both
cell types responded superiorly to combinatorial TGF-β1/BMP-2 stimulation, as evidenced by the
upregulation of GAG expression, a cartilage-specific matrix component, and the presence of
chondrocyte-like morphology cells. Previous studies corroborated this finding for specific cell sources,
such as BM [31, 47, 49], AT [30] and AC [31]. Moreover, the obtained findings demonstrated that
chondrogenic differentiation of BM-MSCs appears to be decreased in response to TGF-β1/PDGF-BB;
the same behaviour was reported in a previous study where MSCs derived from AT were tested in the
presence of TGF-β1/PDGF-BB [30]. On the other hand, the chondrogenesis of MSCs derived from
synovium under the same condition showed no inhibition in this study. An additional condition which
also demonstrated different behaviours in MSCs derived from BM and SYN was TGF-β1/NGF-β; in
BM-MSCs the chondrogenesis was not improved nor inhibited, but in SYN-MSCs it was inhibited. It is
important to mention that only one synovium donor was evaluated, so more donors should be
analysed for all conditions to confirm the results. Furthermore, two other combinations were studied
for the first time, such as TGF-β1/SDF-1α and TGF-β1/RANTES; TGF-β1/SDF-1α showed no
inhibition of chondrogenic differentiation of both sources of MSCs and TGF-β1/RANTES, just
assessed for SYN-MSCs, demonstrated inhibition of chondrogenesis. These findings indicate that
distinctive cell sources respond differently to diverse stimuli.
The study of recruitment and chondrogenic differentiation factors is crucial for orienting MSCs fate
through cartilage regeneration, nonetheless the administration and retention of these factors remains
a challenge, because of factors short life and limitations crossing the biological barriers. Therefore,
some technologies based on the controlled release of factors are now available [67] or under
investigation [68] for cartilage repair. However, the development of a scaffold that combines a fast
release of recruitment factors with a controlled and sustained release of chondrogenic differentiation
factors would benefit a fast migration of MSCs to cartilage defected areas followed by chondrogenic
differentiation of the recruited cells, thus leading to successful cartilage repair.

43
In this study two different systems were used to evaluate cell migration and chondrogenic
differentiation: the 3D collagen matrix and the 3D pellet culture, respectively. In the former system,
recruitment factors, including BMP-2, PDGF-BB, NGF-β, SDF-1α and RANTES, stimulated migration
of MSCs, and in the latter system, differentiation factors, such as TGF-β1 and BMP-2, promoted the
chondrogenesis of MSCs. Then, BMP-2 not only recruits MSCs but also induce their chondrogenic
differentiation.

44
6. Overall
summary,
conclusion and
future work

45
The inability of cartilage self-repair after injury requires techniques that induce cartilage
regeneration. MSCs are considered promising candidates for cartilage repair due to their ability to
migrate to damaged tissues and to differentiate into chondrocytes. Transplantation of exogenous
MSCs alone or within a scaffold to injured sites has been adopted as a strategy to repair articular
cartilage defects. However, the results have demonstrated that lower number of cells remain in the
joint or in the damaged tissue after transplantation. More recently, a new approach that tries to
overcome the above problem is the recruitment of a large number of MSCs existent within or nearby
the joint (i.e. endogenous MSCs) to damaged areas and the differentiation of those migrated cells into
chondrocytes. The use of endogenous MSCs avoids then the need of administration of exogenous
MSCs. For the migration and the chondrogenic differentiation of endogenous MSCs, several
chemokines and growth factors were studied commonly in 2D assays. In the present study, the in vitro
migration of bone marrow and synovium MSCs, two promising cell sources in cartilage repair due to
their location adjacent to the joint, were evaluated in a 3D collagen matrix supplemented with different
factors. Furthermore, the chondrogenic differentiation of BM- and SYN-MSCs was tested in a 3D pellet
culture.
The findings demonstrated that PDGF-BB, BMP-2, NGF-β, SDF-1α, and RANTES stimulated
migration of BM- and SYN-MSCs and the combination of TGF-β1/BMP-2 induced their
chondrogenesis. These results can significantly contribute to improve the recruitment of BM and
SYN-MSCs to injured cartilage sites and to induce the differentiation into chondrocytes; thereby, they
are of great interest for understanding how to regenerate cartilage by recruitment of endogenous
MSCs without cell transplantation. However, more prolonged experiments, first in osteochondral
models and later on in animal models, are needed to validate the recruitment of MSCs into cartilage
defects in response to BMP-2, PDGF-BB, NGF-β, SDF-1α and RANTES, and the effect on
chondrogenic differentiation of MSCs in the presence of recruitment and chondrogenic factors such as
BMP-2 and TGF-β1. Moreover, further investigation on factors controlled release and biosafety must
be conducted to allow their utilization in the human medicine.

46

47
References
1. Freyria, A.M. and F. Mallein-Gerin, Chondrocytes or adult stem cells for cartilage repair: the
indisputable role of growth factors. Injury, 2012. 43(3): p. 259-65.
2. Clouet, J., et al., From osteoarthritis treatments to future regenerative therapies for cartilage.
Drug Discov Today, 2009. 14(19-20): p. 913-25.
3. Roelofs, A.J., J.P. Rocke, and C. De Bari, Cell-based approaches to joint surface repair: a
research perspective. Osteoarthritis Cartilage, 2013. 21(7): p. 892-900.
4. Ma, V.Y., L. Chan, and K.J. Carruthers, Incidence, prevalence, costs, and impact on disability
of common conditions requiring rehabilitation in the United States: stroke, spinal cord injury,
traumatic brain injury, multiple sclerosis, osteoarthritis, rheumatoid arthritis, limb loss, and
back pain. Arch Phys Med Rehabil, 2014. 95(5): p. 986-995 e1.
5. Magnussen, R.A., et al., Treatment of focal articular cartilage defects in the knee: a systematic
review. Clin Orthop Relat Res, 2008. 466(4): p. 952-62.
6. Steadman, J.R., W.G. Rodkey, and J.J. Rodrigo, Microfracture: surgical technique and
rehabilitation to treat chondral defects. Clin Orthop Relat Res, 2001(391 Suppl): p. S362-9.
7. Richter, D.L., et al., Knee Articular Cartilage Repair and Restoration Techniques: A Review of
the Literature. Sports Health, 2016. 8(2): p. 153-60.
8. Goyal, D., et al., Evidence-based status of osteochondral cylinder transfer techniques: a
systematic review of level I and II studies. Arthroscopy, 2014. 30(4): p. 497-505.
9. Im, G.I., Endogenous Cartilage Repair by Recruitment of Stem Cells. Tissue Eng Part B Rev,
2016. 22(2): p. 160-71.
10. Wang, L., et al., MCP-1, MIP-1, IL-8 and ischemic cerebral tissue enhance human bone
marrow stromal cell migration in interface culture. Hematology, 2002. 7(2): p. 113-7.
11. Wynn, R.F., et al., A small proportion of mesenchymal stem cells strongly expresses
functionally active CXCR4 receptor capable of promoting migration to bone marrow. Blood,
2004. 104(9): p. 2643-5.
12. Fiedler, J., et al., BMP-2, BMP-4, and PDGF-bb stimulate chemotactic migration of primary
human mesenchymal progenitor cells. J Cell Biochem, 2002. 87(3): p. 305-12.
13. Son, B.R., et al., Migration of bone marrow and cord blood mesenchymal stem cells in vitro is
regulated by stromal-derived factor-1-CXCR4 and hepatocyte growth factor-c-met axes and
involves matrix metalloproteinases. Stem Cells, 2006. 24(5): p. 1254-64.
14. Sordi, V., et al., Bone marrow mesenchymal stem cells express a restricted set of functionally
active chemokine receptors capable of promoting migration to pancreatic islets. Blood, 2005.
106(2): p. 419-27.
15. Dwyer, R.M., et al., Monocyte chemotactic protein-1 secreted by primary breast tumors
stimulates migration of mesenchymal stem cells. Clin Cancer Res, 2007. 13(17): p. 5020-7.
16. Honczarenko, M., et al., Human bone marrow stromal cells express a distinct set of
biologically functional chemokine receptors. Stem Cells, 2006. 24(4): p. 1030-41.
48
17. Ozaki, Y., et al., Comprehensive analysis of chemotactic factors for bone marrow
mesenchymal stem cells. Stem Cells Dev, 2007. 16(1): p. 119-29.
18. Rice, C.M. and N.J. Scolding, Adult human mesenchymal cells proliferate and migrate in
response to chemokines expressed in demyelination. Cell Adh Migr, 2010. 4(2): p. 235-40.
19. Ringe, J., et al., Towards in situ tissue repair: human mesenchymal stem cells express
chemokine receptors CXCR1, CXCR2 and CCR2, and migrate upon stimulation with CXCL8
but not CCL2. J Cell Biochem, 2007. 101(1): p. 135-46.
20. Boomsma, R.A. and D.L. Geenen, Mesenchymal stem cells secrete multiple cytokines that
promote angiogenesis and have contrasting effects on chemotaxis and apoptosis. PLoS One,
2012. 7(4): p. e35685.
21. Croitoru-Lamoury, J., et al., Human mesenchymal stem cells constitutively express
chemokines and chemokine receptors that can be upregulated by cytokines, IFN-beta, and
Copaxone. J Interferon Cytokine Res, 2007. 27(1): p. 53-64.
22. Haasters, F., et al., Mesenchymal stem cells from osteoporotic patients reveal reduced
migration and invasion upon stimulation with BMP-2 or BMP-7. Biochem Biophys Res
Commun, 2014. 452(1): p. 118-23.
23. Lee, J.M., et al., In vivo tracking of mesechymal stem cells using fluorescent nanoparticles in
an osteochondral repair model. Mol Ther, 2012. 20(7): p. 1434-42.
24. Mendelson, A., et al., Chondrogenesis by chemotactic homing of synovium, bone marrow, and
adipose stem cells in vitro. Faseb J, 2011. 25(10): p. 3496-504.
25. Phipps, M.C., Y. Xu, and S.L. Bellis, Delivery of platelet-derived growth factor as a
chemotactic factor for mesenchymal stem cells by bone-mimetic electrospun scaffolds. PLoS
One, 2012. 7(7): p. e40831.
26. Ponte, A.L., et al., The in vitro migration capacity of human bone marrow mesenchymal stem
cells: comparison of chemokine and growth factor chemotactic activities. Stem Cells, 2007.
25(7): p. 1737-45.
27. Vertelov, G., et al., High targeted migration of human mesenchymal stem cells grown in
hypoxia is associated with enhanced activation of RhoA. Stem Cell Res Ther, 2013. 4(1): p. 5.
28. Kramer, N., et al., In vitro cell migration and invasion assays. Mutat Res, 2013. 752(1):
p. 10-24.
29. Kim, H.J. and G.I. Im, Combination of transforming growth factor-beta2 and bone
morphogenetic protein 7 enhances chondrogenesis from adipose tissue-derived mesenchymal
stem cells. Tissue Eng Part A, 2009. 15(7): p. 1543-51.
30. Yoon, I.S., et al., Proliferation and chondrogenic differentiation of human adipose-derived
mesenchymal stem cells in porous hyaluronic acid scaffold. J Biosci Bioeng, 2011. 112(4): p.
402-8.
31. Murphy, M.K., et al., TGF-beta1, GDF-5, and BMP-2 stimulation induces chondrogenesis in
expanded human articular chondrocytes and marrow-derived stromal cells. Stem Cells, 2015.
33(3): p. 762-73.
49
32. Weiss, S., et al., Impact of growth factors and PTHrP on early and late chondrogenic
differentiation of human mesenchymal stem cells. J Cell Physiol, 2010. 223(1): p. 84-93.
33. Hart, D.A., Perspectives on endogenous and exogenous tissue engineering following injury to
tissues of the knee. Biomedical Science and Engineering, 2014. 7: p. 58-66.
34. Taub, D.D., Cytokine, growth factor, and chemokine ligand database. Curr Protoc Immunol,
2004. Chapter 6: p. Unit 6 29.
35. Mazzetti, I., et al., A role for chemokines in the induction of chondrocyte phenotype
modulation. Arthritis Rheum, 2004. 50(1): p. 112-22.
36. Mazor, M., et al., Mesenchymal stem-cell potential in cartilage repair: an update. J Cell Mol
Med, 2014. 18(12): p. 2340-50.
37. Zhang, W., et al., The use of type 1 collagen scaffold containing stromal cell-derived factor-1
to create a matrix environment conducive to partial-thickness cartilage defects repair.
Biomaterials, 2013. 34(3): p. 713-23.
38. Lee, C.H., et al., Regeneration of the articular surface of the rabbit synovial joint by cell
homing: a proof of concept study. Lancet, 2010. 376(9739): p. 440-8.
39. Deshmane, S.L., et al., Monocyte chemoattractant protein-1 (MCP-1): an overview. J
Interferon Cytokine Res, 2009. 29(6): p. 313-26.
40. Maurer, M. and E. von Stebut, Macrophage inflammatory protein-1. Int J Biochem Cell Biol,
2004. 36(10): p. 1882-6.
41. Crawford, A., et al., A role for the chemokine RANTES in regulating CD8 T cell responses
during chronic viral infection. PLoS Pathog, 2011. 7(7): p. e1002098.
42. Ackermann, P.W., P.T. Salo, and D.A. Hart, Neuronal pathways in tendon healing. Front
Biosci (Landmark Ed), 2009. 14: p. 5165-87.
43. Lefebvre, V. and P. Smits, Transcriptional control of chondrocyte fate and differentiation. Birth
Defects Res C Embryo Today, 2005. 75(3): p. 200-12.
44. Augustyniak, E., et al., The role of growth factors in stem cell-directed chondrogenesis: a real
hope for damaged cartilage regeneration. Int Orthop, 2015. 39(5): p. 995-1003.
45. Barry, F., et al., Chondrogenic differentiation of mesenchymal stem cells from bone marrow:
differentiation-dependent gene expression of matrix components. Exp Cell Res, 2001. 268(2):
p. 189-200.
46. Sekiya, I., et al., Comparison of effect of BMP-2, -4, and -6 on in vitro cartilage formation of
human adult stem cells from bone marrow stroma. Cell Tissue Res, 2005. 320(2): p. 269-76.
47. Toh, W.S., et al., Combined effects of TGFbeta1 and BMP2 in serum-free chondrogenic
differentiation of mesenchymal stem cells induced hyaline-like cartilage formation. Growth
Factors, 2005. 23(4): p. 313-21.
48. Pelttari, K., et al., Premature induction of hypertrophy during in vitro chondrogenesis of human
mesenchymal stem cells correlates with calcification and vascular invasion after ectopic
transplantation in SCID mice. Arthritis Rheum, 2006. 54(10): p. 3254-66.
49. Noth, U., et al., Chondrogenic differentiation of human mesenchymal stem cells in collagen
type I hydrogels. J Biomed Mater Res A, 2007. 83(3): p. 626-35.

50
50. Ronziere, M.C., et al., Chondrogenic potential of bone marrow- and adipose tissue-derived
adult human mesenchymal stem cells. Biomed Mater Eng, 2010. 20(3): p. 145-58.
51. Shintani, N., E.B. Siebenrock Ka Fau - Hunziker, and E.B. Hunziker, TGF-ss1 enhances the
BMP-2-induced chondrogenesis of bovine synovial explants and arrests downstream
differentiation at an early stage of hypertrophy. PLoS One, 2013. 8(1): p. e53086.
52. Ng, F., et al., PDGF, TGF-beta, and FGF signaling is important for differentiation and growth
of mesenchymal stem cells (MSCs): transcriptional profiling can identify markers and signaling
pathways important in differentiation of MSCs into adipogenic, chondrogenic, and osteogenic
lineages. Blood, 2008. 112(2): p. 295-307.
53. Morales, T.I., Chondrocyte moves: clever strategies? Osteoarthritis Cartilage, 2007. 15(8):
p. 861-71.
54. McCarthy, H.E., et al., The comparison of equine articular cartilage progenitor cells and bone
marrow-derived stromal cells as potential cell sources for cartilage repair in the horse. Vet J,
2012. 192(3): p. 345-51.
55. Williams, R., et al., Identification and clonal characterisation of a progenitor cell sub-population
in normal human articular cartilage. PLoS One, 2010. 5(10): p. e13246.
56. Koelling, S., et al., Migratory chondrogenic progenitor cells from repair tissue during the later
stages of human osteoarthritis. Cell Stem Cell, 2009. 4(4):324-35.
57. Harvanova, D., et al., Isolation and characterization of synovial mesenchymal stem cells. Folia
Biol (Praha), 2011. 57(3): p. 119-24.
58. Sakaguchi, Y., et al., Comparison of human stem cells derived from various mesenchymal
tissues: superiority of synovium as a cell source. Arthritis Rheum, 2005. 52(8): p. 2521-9.
59. Hunziker, E.B. and L.C. Rosenberg, Repair of partial-thickness defects in articular cartilage:
cell recruitment from the synovial membrane. J Bone Joint Surg Am, 1996. 78(5): p. 721-33.
60. Dragoo, J.L., J. Johnson C Fau - McConnell, and J. McConnell, Evaluation and treatment of
disorders of the infrapatellar fat pad. Sports Med, 2012. 42(1): p. 51-67.
61. Wickham, M.Q., et al., Multipotent stromal cells derived from the infrapatellar fat pad of the
knee. Clin Orthop Relat Res, 2003. 412: p. 196-212.
62. English, A., et al., A comparative assessment of cartilage and joint fat pad as a potential
source of cells for autologous therapy development in knee osteoarthritis. Rheumatology
(Oxford), 2007. 46(11): p. 1676-83.
63. Wei, W., et al., The infrapatellar fat pad from diseased joints inhibits chondrogenesis of
mesenchymal stem cells. Eur Cell Mater, 2015. 30: p. 303-14.
64. Schindelin, J., et al., Fiji: an open-source platform for biological-image analysis. Nat Methods,
2012. 9(7): p. 676-82.
65. Livak, K.J. and T.D. Schmittgen, Analysis of relative gene expression data using real-time
quantitative PCR and the 2(-Delta Delta C(T)) Method. Methods, 2001. 25(4): p. 402-8.
66. Wehling, N., et al., Interleukin-1beta and tumor necrosis factor alpha inhibit chondrogenesis by
human mesenchymal stem cells through NF-kappaB-dependent pathways. Arthritis
Rheum, 2009. 60(3): p. 801-12.

51
67. Censi, R., et al., Bioactive hydrogel scaffolds - advances in cartilage regeneration through
controlled drug delivery. Curr Pharm Des, 2015. 21(12): p. 1545-55.
68. Morille, M., et al., Scaffolds for Controlled Release of Cartilage Growth Factors. PLos One,
2013. 8: p. e53086.

A
Annex
In this section additional plots of the migratory cell area and maximum migratory cell distance of
four BM donors (Figure 10) and four SYN donors in the presence of chemokines (MCP-1, MCP-3,
MIP-1α, SDF-1α, and RANTES), inflammatory cytokines (IL-1α, IFN-γ, and TNF-β) and growth factors
(PDGF-BB, NGF-β, BMP-2, IGF-1, and TGF-β1) are present. The data is expressed as mean of 3 to 6
spheroids per condition per donor and the correspondent standard deviation. Differences were
analysed as described in 3.2.5 and they were considered significant when p value was *<0.05, **<0.01
and ***<0.001.
C h e m o k in e s
Co
ntr
ol
MC
P-1
50 n
g/m
L
MC
P-1
100 n
g/m
L
MC
P-3
50 n
g/m
L
MC
P-3
100 n
g/m
L
MIP
-1
50 n
g/m
L
MIP
-1
100 n
g/m
L
SD
F-1
50 n
g/m
L
SD
F-1
100 n
g/m
L
RA
NT
ES
10 n
g/m
L
RA
NT
ES
25 n
g/m
L
RA
NT
ES
50 n
g/m
L
RA
NT
ES
100 n
g/m
L
0
1 0 0 0 0
2 0 0 0 0
3 0 0 0 0
4 0 0 0 0
5 0 0 0 0
6 0 0 0 0
7 0 0 0 0
8 0 0 0 0
9 0 0 0 0
* * *
* *
*
AR
EA
(
m2)
*
A

B
Inflammatory cytokines
Contr
ol
1 n
g/mL
IL-1
10
ng/mL
IL-1
1 n
g/mL
IFN- 1
0 ng/m
L
IFN-
1 n
g/mL
TNF- 1
0 ng/m
L
TNF-
0
10000
20000
30000
40000
50000
60000
70000
80000
90000
*** ***
** **
AR
EA
(
m2)
G ro w th fa c to r s
Co
ntr
ol
PD
GF
-BB
50 n
g/m
L
PD
GF
-BB
100 n
g/m
L
NG
F-
50 n
g/m
L
NG
F-
100 n
g/m
L
BM
P-2
50 n
g/m
L
BM
P-2
100 n
g/m
L
IGF
-1 5
0 n
g/m
L
IGF
-1 1
00 n
g/m
L
TG
F-
1 1
0 n
g/m
L
TG
F-
1 5
0 n
g/m
L
TG
F-
1 1
00 n
g/m
L
0
1 0 0 0 0
2 0 0 0 0
3 0 0 0 0
4 0 0 0 0
5 0 0 0 0
6 0 0 0 0
7 0 0 0 0
8 0 0 0 0
9 0 0 0 0
* * *
*
*
*
*
AR
EA
(
m2)
B
C

C
Chemokines
Contr
ol
MCP-1
50
ng/mL
MCP-1
100
ng/m
L
MCP-3
50
ng/mL
MCP-3
100
ng/m
L
50
ng/mL
MIP
-1 1
00 n
g/mL
MIP
-1
50
ng/mL
SDF-1
100
ng/m
L
SDF-1
RANTES 1
0 ng/m
L
RANTES 2
5 ng/m
L
RANTES 5
0 ng/m
L
RANTES 1
00 n
g/mL
0
100
200
300
400
500
600
700
800
900
1000
*** ***********
* * *** ****
DIS
TA
NC
E (
m)
Inflammatory cytokines
Contr
ol
1 n
g/mL
IL-1
10
ng/mL
IL-1
1 n
g/mL
IFN- 1
0 ng/m
L
IFN-
1 n
g/mL
TNF- 1
0 ng/m
L
TNF-
0
100
200
300
400
500
600
700
800
900
1000
*** *** *** *
DIS
TA
NC
E (
m)
D
E
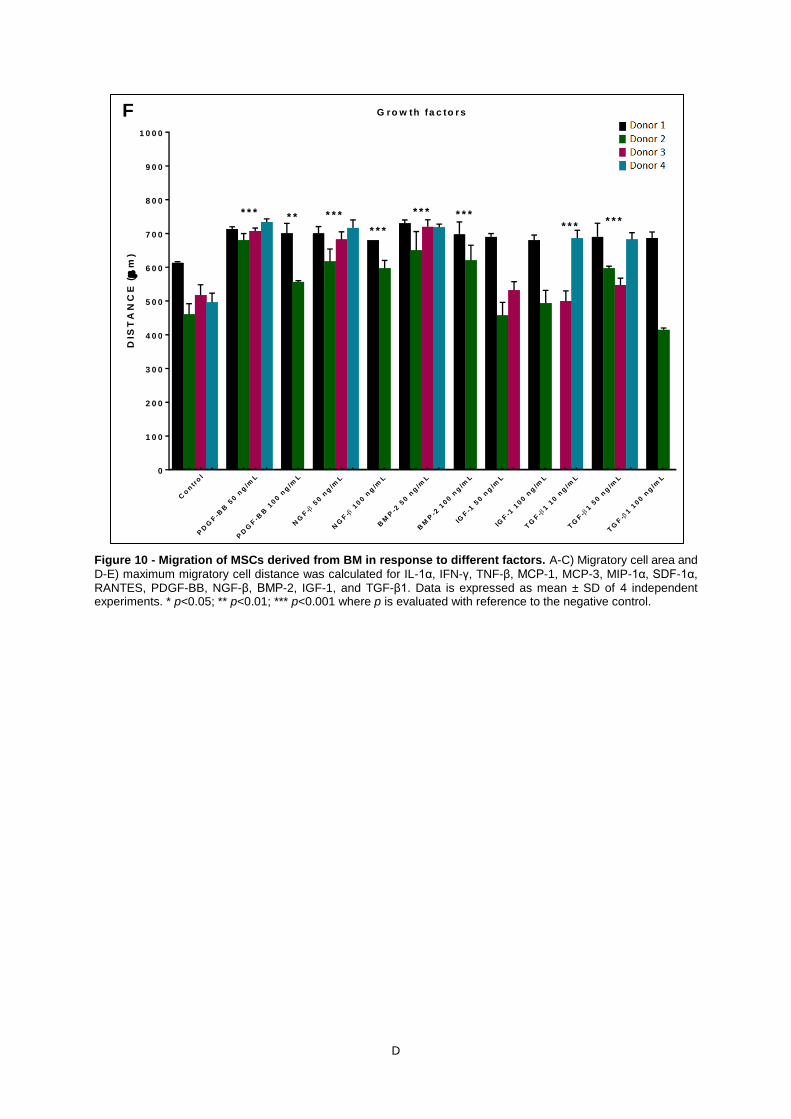
D
Figure 10 - Migration of MSCs derived from BM in response to different factors. A-C) Migratory cell area and
D-E) maximum migratory cell distance was calculated for IL-1α, IFN-γ, TNF-β, MCP-1, MCP-3, MIP-1α, SDF-1α, RANTES, PDGF-BB, NGF-β, BMP-2, IGF-1, and TGF-β1. Data is expressed as mean ± SD of 4 independent experiments. * p<0.05; ** p<0.01; *** p<0.001 where p is evaluated with reference to the negative control.
G ro w th fa c to r s
Co
ntr
ol
PD
GF
-BB
50 n
g/m
L
PD
GF
-BB
100 n
g/m
L
NG
F-
50 n
g/m
L
NG
F-
100 n
g/m
L
BM
P-2
50 n
g/m
L
BM
P-2
100 n
g/m
L
IGF
-1 5
0 n
g/m
L
IGF
-1 1
00 n
g/m
L
TG
F-
1 1
0 n
g/m
L
TG
F-
1 5
0 n
g/m
L
TG
F-
1 1
00 n
g/m
L0
1 0 0
2 0 0
3 0 0
4 0 0
5 0 0
6 0 0
7 0 0
8 0 0
9 0 0
1 0 0 0
* * ** * *
*
* * ** * * * *
* * *
* * * * * *
DIS
TA
NC
E (
m)
F
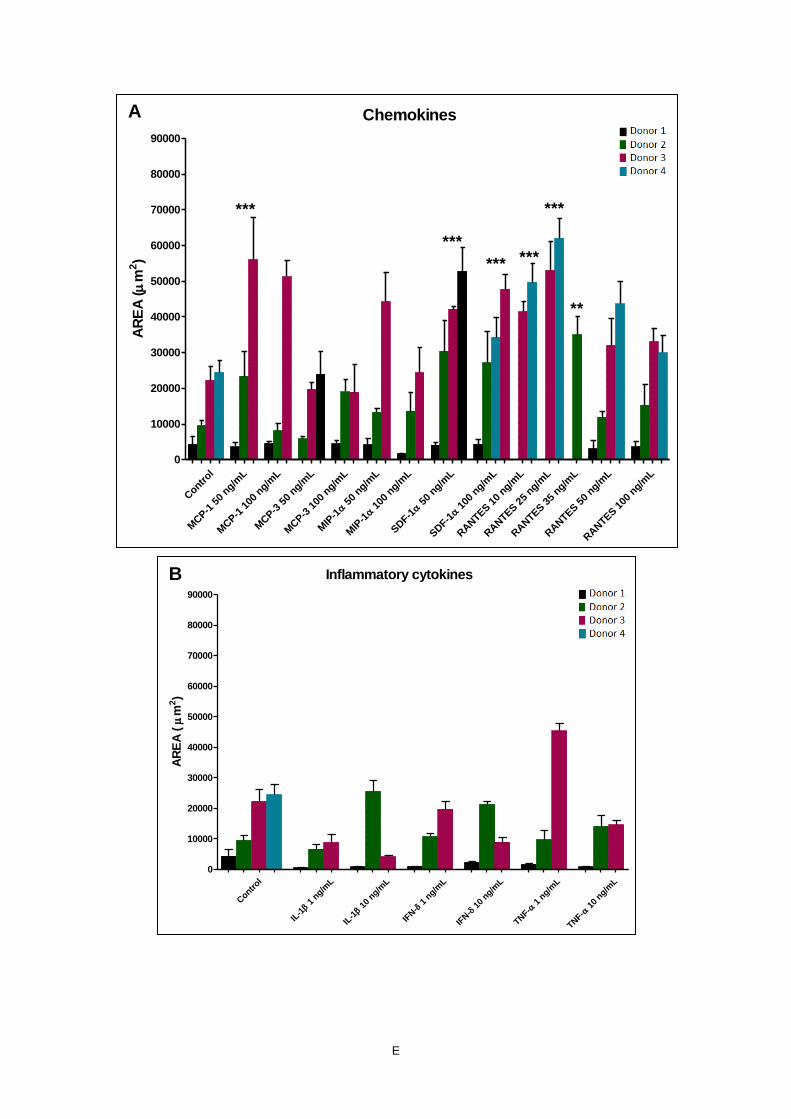
E
Chemokines
Contr
ol
MCP-1
50
ng/mL
MCP-1
100
ng/m
L
MCP-3
50
ng/mL
MCP-3
100
ng/m
L
50
ng/mL
MIP
-1 1
00 n
g/mL
MIP
-1
50
ng/mL
SDF-1
100
ng/m
L
SDF-1
RANTES 1
0 ng/m
L
RANTES 2
5 ng/m
L
RANTES 3
5 ng/m
L
RANTES 5
0 ng/m
L
RANTES 1
00 n
g/mL
0
10000
20000
30000
40000
50000
60000
70000
80000
90000
***
***
***
***
***
**
AR
EA
(
m2)
Inflammatory cytokines
Contr
ol
1 n
g/mL
IL-1
10
ng/mL
IL-1
1 n
g/mL
IFN- 1
0 ng/m
L
IFN-
1 n
g/mL
TNF- 1
0 ng/m
L
TNF-
0
10000
20000
30000
40000
50000
60000
70000
80000
90000
AR
EA
(
m2)
A
B
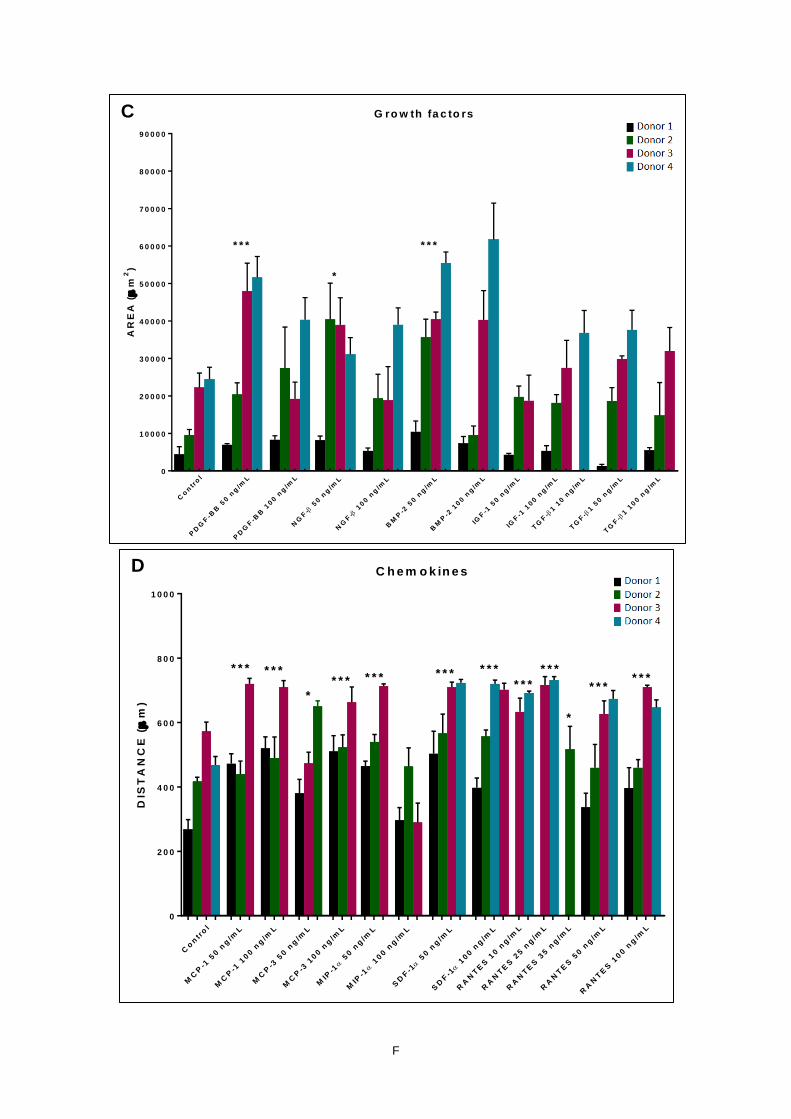
F
G ro w th fa c to rs
Co
ntr
ol
PD
GF
-BB
50 n
g/m
L
PD
GF
-BB
100 n
g/m
L
NG
F-
50 n
g/m
L
NG
F-
100 n
g/m
L
BM
P-2
50 n
g/m
L
BM
P-2
100 n
g/m
L
IGF
-1 5
0 n
g/m
L
IGF
-1 1
00 n
g/m
L
TG
F-
1 1
0 n
g/m
L
TG
F-
1 5
0 n
g/m
L
TG
F-
1 1
00 n
g/m
L
0
1 0 0 0 0
2 0 0 0 0
3 0 0 0 0
4 0 0 0 0
5 0 0 0 0
6 0 0 0 0
7 0 0 0 0
8 0 0 0 0
9 0 0 0 0
* * * * * *
*
AR
EA
(
m2)
C h e m o k in e s
Co
ntr
ol
MC
P-1
50 n
g/m
L
MC
P-1
100 n
g/m
L
MC
P-3
50 n
g/m
L
MC
P-3
100 n
g/m
L
MIP
-1
50 n
g/m
L
MIP
-1
100 n
g/m
L
SD
F-1
50 n
g/m
L
SD
F-1
100 n
g/m
L
RA
NT
ES
10 n
g/m
L
RA
NT
ES
25 n
g/m
L
RA
NT
ES
35 n
g/m
L
RA
NT
ES
50 n
g/m
L
RA
NT
ES
100 n
g/m
L
0
2 0 0
4 0 0
6 0 0
8 0 0
1 0 0 0
* * * * * ** * * * * ** * * * * *
* * *
*
DIS
TA
NC
E (
m)
* * ** * *
*
* * *
C
D
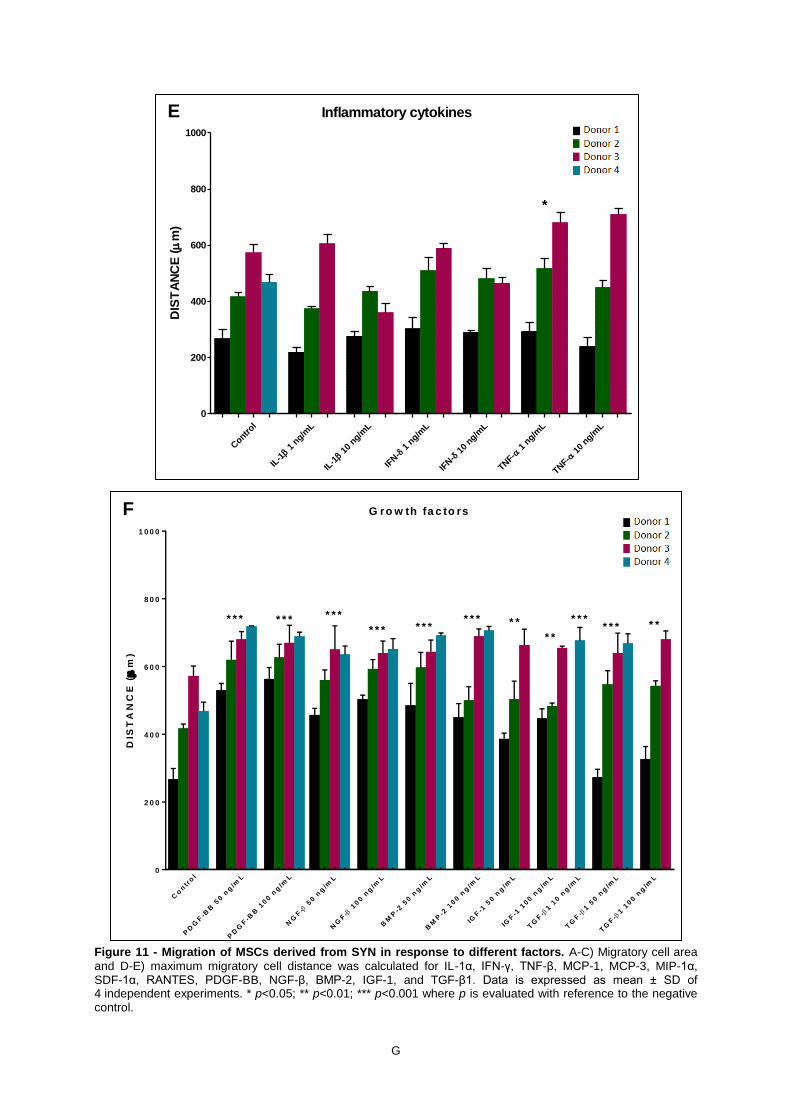
G
Figure 11 - Migration of MSCs derived from SYN in response to different factors. A-C) Migratory cell area
and D-E) maximum migratory cell distance was calculated for IL-1α, IFN-γ, TNF-β, MCP-1, MCP-3, MIP-1α, SDF-1α, RANTES, PDGF-BB, NGF-β, BMP-2, IGF-1, and TGF-β1. Data is expressed as mean ± SD of 4 independent experiments. * p<0.05; ** p<0.01; *** p<0.001 where p is evaluated with reference to the negative control.
Inflammatory cytokines
Contr
ol
1 n
g/mL
IL-1
10
ng/mL
IL-1
1 n
g/mL
IFN- 1
0 ng/m
L
IFN-
1 n
g/mL
TNF- 1
0 ng/m
L
TNF-
0
200
400
600
800
1000
*
DIS
TA
NC
E (
m)
G ro w th fa c to rs
Co
ntr
ol
PD
GF
-BB
50 n
g/m
L
PD
GF
-BB
100 n
g/m
L
NG
F-
50 n
g/m
L
NG
F-
100 n
g/m
L
BM
P-2
50 n
g/m
L
BM
P-2
100 n
g/m
L
IGF
-1 5
0 n
g/m
L
IGF
-1 1
00 n
g/m
L
TG
F-
1 1
0 n
g/m
L
TG
F-
1 5
0 n
g/m
L
TG
F-
1 1
00 n
g/m
L
0
2 0 0
4 0 0
6 0 0
8 0 0
1 0 0 0
* * ** * *
* * * * * *
DIS
TA
NC
E (
m)
* *
* ** * * * *
* * ** * *
* * *
E
F