Brittle-to-ductile transition temperature in indium phosphide

Mechanics & Industry 19, 107 (2018)© AFM, EDP Sciences 2018https://doi.org/10.1051/meca/2017034
Mechanics&IndustryAvailable online at:
www.mechanics-industry.org
RESEARCH ARTICLE
Identification of ductile to brittle transition temperature by usingplane strain specimen in tensile test and correlation withinstrumented Charpy impact test: experimental and numericalstudyFrank Tioguem1,2,*, Matthieu Maziere1, Franck Tankoua2, André Galtier2, and Anne-Françoise Gourgues-Lorenzon1
1 MINES ParisTech, PSL Research University, MAT - Centre des matériaux, CNRS UMR7633, BP 87, 91003 Evry cedex, France2 ASCO Industries � Centre de Recherche CREAS, BP 70045, Avenue de France, 57301 Hagondange cedex, France
* e-mail: f
Received: 12 May 2017 / Accepted: 13 October 2017
Abstract.This study addresses the correlation between the ductile-to-brittle transition temperature ranges of highstrength 4140 steel obtained respectively from tensile tests under plane strain (PS) conditions and from conventionalCharpy impact tests. Specimens were taken respectively at 25mm (P) and at 55mm (M) from skin of a cylindrical90-mm-radius hot rolled bar water quenched from 875 °C, tempered at 600 °C and air cooled. P and M samplesrespectively showed a fully martensitic and a martensite-bainite microstructure. Fracture surface observationsshowed good agreement for physical fracturemechanisms (cleavage facet size, mixed ductile+brittle fracture in thetransition region, ductile fracture at higher temperatures) betweenPS andCharpy, in particular sensitivity of upperbainite to cleavage fracture that reduces fracture energy in the lower self-energy on Charpy tests.
Keywords: Martensite-bainite / carbides / Charpy test / notched plane-strain specimen / experimental andnumerical study
1 Introduction
High strength, quenched and tempered steels have beenlargely used since decades for manufacturing of off-shoredrilling parts and many components of automotivegearboxes. High yield strength and good impact toughnessare required as design criteria for such applications. Yet, asreviewed by e.g. Beranger et al. [1], improving strength ofthese steels generally implies decreasing their impacttoughness. The mechanical properties of this steel can betuned by improving their final heat treatment [2]. Incertain cases, an increase in tempering temperature isshown to increase impact toughness in the upper self-energy range (USE), yet at the expense of yield strength.Improving the trade-off between these two mechanicalproperties is therefore required to optimize in-serviceproperties of components. The two microstructuralcomponents that have to be optimized in this way are(i) the martensitic matrix and (ii) the population ofcarbides that are formed during tempering.
The present study focuses on a 1% Cr-Mo AISI 4140steel. After final normalizing, quenching and tempering, itis known to present a mixed structure of tempered
martensite and lower bainite that is also known to improveyield stress and tensile strength up to about 30% in spite ofonly martensite matrix. Tomita [3] shows that a previoushigh temperature thermomechanical treatment (HTMT)improves USE with respect to deformation-free heattreatment on 4340 steel. The improved mechanicalproperties are attributed to the sub-cell structure intro-duced in austenite by processing HTMT and inheritedmartensite. In a tempered martensitic steel (0.3C–0.5Si–2Mn–0.001P–0.001S), Takebayashi et al. [4] showed thatrefining microstructural parameters such as the prioraustenite grain size improved the USE going up to 30 J, butno significant effect of carbide size distribution wasmentioned in this study. Im et al. [5] showed thatincreasing molybdenum and reducing the carbon contentcan improve the USE, by enhancing precipitation of M2C-type alloy carbides instead of cementite, whose size is muchlower than the critical carbide size to initiate fracture. Inthe current study, observations of polished fracture surfacefrom tensile tests at ductile fracture region using round-notched cylindrical specimens revealed that the vicinity ofM3C are major initiated site of cracks.
Charpy impact testing is a powerful tool to study theductile-to-brittle transition (DBT) of body-centered cubic(bcc) materials as a function of temperature but mechani-

Table 1. Chemical composition of AISI 4140 steel (wt.%)
C Mn Si Ni Mo Cu P S Al
0.401 1.143 0.274 0.20 0.32 0.11 0.011 0.005 0.018
2 F. Tioguem et al.: Mechanics & Industry 19, 107 (2018)
cal analysis of the test is difficult due to self-heating, strainrate sensitivity and contact issues. Moreover, the linkbetween impact toughness and fracture toughness is notobvious in many cases, in particular, for bainitic andmartensitic steel microstructures. The local approach tofracture has been introduced to solve this issue as reviewedby Pineau et al. [6]. In this approach, identification of theresistance of the material to fracture requires taking theheterogeneity of the microstructure into account. The localapproach to fracture is classically based on tensile tests onnotched cylindrical specimens. However, in high strengthalloys reinforced by precipitation ductile fracture might besensitive not only to the stress triaxiality ratio, h (ratio ofthe hydrostatic stress to the von Mises equivalent stress)but also to the third invariant of the stress tensor, ascommonly represented by the Lode angle, u [7]. In fact,changing the geometry of specimens from round notchedbars (cos(3u)= 1) to plane strain specimens (cos(3u)= 0)[8] can lead to applying a stress state closer to thatexperienced in Charpy three-point-bending specimens,both in terms of triaxiality and Lode parameter. To thisaim, a new experimental approach making use of doubleside notched plane strain specimens is proposed in thisstudy. The numerical analysis of tests on these specimens isexpected to be much easier than that of Charpy tests.
The purpose of the present study is to investigatecorrelations between the DBT behavior of a high strength4140 steel obtained respectively from tensile tests underplane strain conditions and from conventional Charpyimpact tests. The effect of microstructure (both of matrixand carbides) on the ductile fracture behavior in the USEdomain, the fracture mechanisms and the state stress arealso addressed.
2 Experimental procedures
2.1 Material and metallographic procedures
The chemical composition of the steel is given in Table 1.Two samples of the same cylindrical bar were takenrespectively at 25mm (P) and at 55mm (M) from the skinof a cylindrical 90mm radius hot rolled bar waterquenched from 875 °C, tempered at 600 °C and air cooled.P and M microstructures respectively showed fullymartensitic and amartensite-bainite matrix, with carbidesparticles. The average Vickers micro-hardness (weight300 g, dwell time 10 s) of the two microstructures wasHV0.3=344± 15 for microstructure P and HV0.3= 316±30 for microstructure M.
For metallographic analysis, samples were polished tofinal 1mm diamond paste then etched in a 4% nitalsolution. In order to investigate the size distribution ofcarbides in detail, the plane perpendicular to the bar axiswas chosen. Carbon extractive replicas was prepared by thesame polishing and etching procedure, then coating thesample surface with a 50-nm-thick carbon film by using aQUORUM Q150T evaporator. The film was released fromthe sample by immersion in a 10% nital solution. Theexpected nature of carbides in such Cr-Mo quenched+tempered steels is composed of larger, rod-like or spherical
M3C [5] together with smaller, needle-like M2C if thetempering temperature and time are respectively largerthan 600 °C and 100 h.
Microstructural observations, including carbide distri-bution on extracted replicas and fracture surface observa-tions were conducted using a Sigma300 and a FEI NovaNanoSEM 450 field-emission gun scanning electronmicroscope (SEMs). From SEM images of the replicas,distributions of particle size and of the nearest-neighbordistance between carbides were estimated. Carbide sizedistributions were determined using common thresholdingprocedures of the ImageJ
®
software. Two parameters wereconsidered during particle analysis for discrimination, thesize and the cylindricity. The nearest-neighbor distancebetween carbides were calculated by the SKIZ geodesicmethod which is based on mathematical morphologyconsiderations, with Matlab
®
software; this method takesthe shape and the border of each particles in addition withthe center of mass for estimation of the neighbor distance.Several thousands of particles were analyzed for eachmicrostructure.
2.2 Mechanical tests
To characterize the DBT behavior of bothmicrostructures,instrumented Charpy impact tests (ICITs) were performedfirst using 2mm-deep V-notched specimens (10� 10�55mm3). Three specimens were broken at each testtemperature ranging from �60 °C to +60 °C. An instru-mented impact pendulum device, with a nominal impactvelocity of 5ms�1 was used.
Two kinds of quasistatic tensile tests were performedalong longitudinal direction of the bar by using a 250 kNservohydraulic Instron8500 machine. First, tests at roomtemperature were performed at prescribed elongation rateof 10�3 s�1 on smooth cylindrical (SC, Fig. 1a) and smoothplane strain (SPS, Fig. 1b) specimens. To identify the DBTbehavior in plain strain conditions by the local approach offracture, tensile tests were performed on double-sidenotched plane-strain (NPS) specimens (Fig. 1c) in aclimatic chamber at �60 °C, �20 °C, +20, +60 °C. Thespecimen temperature was controlled to±1 °C by using athermocouple spot welded on the specimen end. A MTSextensometer of 10mm gauge length was attached to oneside of NPS specimens in order to monitor notch opening.
3 Results
3.1 Microstructure and carbide distributions
As shown in Figure 2, P and M microstructures showmartensite laths and mixed martensite and bainite,respectively. Considering the tempering temperature(600 °C), it seems to be upper bainite. Several types of

(a) (b) (c)
Fig. 1. Dimensions (inmm) of (a) SC. (b) SPS and (c) NPS specimens. All dimensions in mm.
a
1 μm
dc
1 μm 1 μm
b
1 μm
Fig. 2. Typical SEM images of etched samples of (a) P and (b) Mmicrostructures. Typical SEM images of extractive replicas of (c) Pand (d) M microstructures.
F. Tioguem et al.: Mechanics & Industry 19, 107 (2018) 3
carbides were identified within the matrix. Detailedanalysis of carbon replicas showed coarser, elongatedrod-like particles that could be M3C carbides; there werealso needle-like M3C type carbides.
The results of statistical analysis on images fromextraction replicas are presented in Figure 3. About 2,000particles were analyzed for the size distribution of M3C,15,000 nearest-neighbor distances betweenM3C carbides foreach of the P and M microstructures. SKIZ method allows
the determination of nearest-neighbor distances betweenM3C carbides while taking the shape of the carbides intoaccount. All the results are presented in Table 2.
Except for some coarser M3C particles found in the Pmicrostructure, the carbide size distribution was rathersimilar in the two microstructures. The distance betweenM3C carbides did not strongly depend on microstructure,even if there was a slight difference between P and Mmicrostructures.

Table 2. Result of carbide size and nearest-neighbordistribution distance analysis.
Microstructure M3C (meandiameter, mm)
M3C (meannearest-neighbordistance, mm)
P 0.20 0.15M 0.17 0.20
0
600
1200
1800
2400
3000
freq
uenc
y
nearest-neigbhor distance (μm)
P M
0
100
200
300
400
500
600
0.1
0.14
0.18
0.22
0.26 0.
3
0.34
0.38
0.42
0.46 0.
5
0.54
freq
uenc
y
equivalent diameter (μm)
P M
a b
Fig. 3. Results of statistical analysis on M3C carbides, (a) carbide size distribution, (b) distribution of nearest-neighbor distancesbetween carbides for P and M specimens, respectively
4 F. Tioguem et al.: Mechanics & Industry 19, 107 (2018)
3.2 Tensile properties of smooth specimens
Figure 4 shows the tensile curves of P and M micro-structures at room temperature. Based on conventionaltensile tests on SC specimens (Fig. 4a), the general tensileproperties of materials are respectively for P and Mmicrostructures: yield strength 900 and 720MPa, tensilestrength 1050 and 950MPa, maximum uniform elongation0.058 for both, fracture elongation close to 0.16 for both.Thus, microstructure P was stronger than microstructureM, but they displayed similar ductility. Tensile tests onSPS specimens, Figure 4b were performed to facilitateidentification of constitutive parameters. Plane straintensile results confirmed that microstructure P wasstronger than microstructure M. Anyway, there was aslight difference in maximum uniform axial elongation inSPS specimens between the two microstructures (4.3% at1130MPa for microstructure P and 4% at 1000MPa formicrostructure M).
3.3 Charpy impact properties3.3.1 General behavior and associated fracture mechanisms
Typical load vs. hammer displacement curves from ICITsare reported in Figure 5. These curves were divided intotwo parts [9]. In the first part, the load increase up to themaximum value, Fmax, this point being attributed tofracture initiation. In the second part of the curve, the loaddecreases steadily or abruptly up to the end of the test, dueto crack propagation and final fracture. As reviewed in [4],
the shape of this curve strongly depend on the testtemperature. Abrupt load drops were attributed to brittle,unstable crack propagation, whereas ductile fracturegenerally induces a stable decrease in the load vs.displacement curve. This was actually the case for theconsidered steel; Charpy specimens associated to signifi-cant load drops in the curve exhibited a significant areafraction of flat brittle fracture (see general views of Fig. 5).Screenivasan et al. [9] investigated martensitic stainlesssteel and categorized the ICIT waveform of a martensiticstainless steel into 3 types: type I, II and III, whichcorrespond to brittle, mixed (brittle+ductile) and fullyductile fracture, respectively. The fracture surfaces,illustrated in Figure 5a and b for specimens broken at�60 °C, �20 °C and +20 °C, clearly agreed with thisinterpretation. The DBT curves of P and M micro-structures, both in absorbed energy and area fraction ofbrittle fracture, are reported in Figure 6.
For both P and M microstructures, the load vs.displacement curves obtained at �60 °C corresponded totype I. Fracture surface were globally brittle, althoughthere were also many ductile regions close to the sides of thefractured specimens. Type II curves were obtained at�20 °C; yet, the waveform of steel M at this testtemperature presented a larger load drop than that ofmicrostructure P. On the corresponding fracture surface,the larger load drop was correlated to the presence of awider brittle region than on the fracture surface ofmicrostructure P at the same test temperature. Specimenscorresponding to type III curves underwent fully ductilefracture, and were mainly obtained at room temperature.Moreover, for all these ductile specimens, a macroscopicwave-like shape of the fracture surface was noticed, fromthe notch tip up to the opposite side of the specimen. Thiscould possibly be associated to strong strain localization inthe plastic zones of the propagating crack but this pointneeds to be investigated in more detail before drawing anyfurther conclusion.
The impact energy deduced from ICITs was obtainedby calculation of the area under the load vs. displacementcurves and corresponded to the total fracture energy. As

0
300
600
900
1200
0.00 0.04 0.08 0.12 0.16 0.20
engi
neer
ing
stre
ss (M
Pa)
engineering strain ( )
PMSimulations results
0
300
600
900
1200
0.00 0.04 0.08 0.12
relat
ive
stre
ss (M
Pa)
relative elongation ( )
PMSimulations results
a
ductile fracture
b
Fig. 4. Axial stress vs. axial elongation curves for tensile tests on: (a) SC and (b) SPS specimens. Symbols: experiments; lines: modelpredictions
Fmax
D
C
S
0
10
20
30
0 2 4 6 8 10 12
load
(kN
)
displacement (mm)
- 60°C- 20°C+ 20°C
0
10
20
30
0 2 4 6 8 10 12
load
(kN
)
displacement (mm)
- 60°C
- 20°C
+ 20°C
P MFmax
Ei
Ep
V-notch
I
II
III
Fig. 5. Typical ICIT curves of (a) P and (b) M microstructures, together with global view of fractured specimens. The crackpropagated from the bottom to the top of the images. D: flat ductile, C: cleavage, S: slant fracture
F. Tioguem et al.: Mechanics & Industry 19, 107 (2018) 5
shown in Figure 6, both P andMmicrostructures tended tohave the same transition temperature of about �20 °C. Asmentioned by e.g. Hau�sild et al. [10], experimental data inthe transition region generally show scatter. Microstruc-ture M showed a higher upper shelf energy (116 J) thanmicrostructure P (100 J). On the contrary, the fractureenergy in the lower temperature range was about 38 J and
50 J for M and P specimens respectively. Nevertheless, thelower shelf energy did not seem to have been reached for thetested temperatures.
Figure 7 illustrates the corresponding fracture mecha-nisms at the micrometer scale. After fracture at �60 °C(Fig. 7a and d), cleavage facets connected by tearingridges were found together with many secondary cracks.

0
30
60
90
30
60
90
120
-60 -40 -20 0 20 40 60 80
area
frac
tion
of b
rittle
frac
ture
(%)
abso
rbed
ene
rgy
(J)
temperature (°C)
PMPMbrittle fracture Pbrittle fracture M
Fig. 6. Charpy impact properties of the tested steels and areafraction of brittle fracture.
6 F. Tioguem et al.: Mechanics & Industry 19, 107 (2018)
Hau�sild et al. [10] explained that secondary cracks werecreated after the passage of the main crack and cut theriver ridges of the main crack. Increasing the testtemperature up to �20 °C increases the fraction of ductileligaments (Fig. 7b and e). At room temperature (Fig. 7cand f), ductile fracture occurred with about 90% areafraction of fine dimples (∼0.3mm) and of coarser dimples(∼1mm). Inclusions (probably sulfide or oxide particles)were found in the coarser dimples; this was confirmedusing cross-section observations. Rod-like particles wereobserved in the fine dimples. Their size and morphology,compared with the distributions of carbides determinedfrom extractive replicas, suggested that fine dimplesactually nucleated from M3C carbides. Due to their smallsize (∼200 nm), EDS analysis was not made for identifi-cation of the nature of these particles on the fracturesurfaces.
3.3.2 Fracture initiation and fracture propagation energy
Following the analysis of fracture energy in terms ofinitiation and propagation parts for martensitic steelsproposed by Takebayashi et al. [4], the amount of energyabsorbed during initiation and propagation stages areplotted against test temperature in Figure 8a and b,respectively. The main tendencies were as follows: (i) thereiwas no dependence of the initiation energy with tempera-ture, even if initiation energy of M specimens tend to besuperior to that of P specimens at a given test temperature;(ii) for both microstructures, the change in fracturemechanism from brittle to ductile was correlated to atransition in propagation energy, the higher USE of Mspecimen being attributed to the propagation part of theICIT curve. Figure 9 illustrates this result with load vs.displacement curves of specimens tested at +60 °C, i.e., inthe fully ductile domain. The main difference between thetwo specimens was on the yielding behavior and amount ofstrain before crack propagation.
3.4 Ductile-to-brittle transition behavior investigatedby the local approach to fracture3.4.1 Experimental results
Load vs. notch opening curves of tests on NPS specimensare plotted in Figure 10. They confirmed that microstruc-ture P was stronger than microstructure M at every testtemperature. As already well-known for steels having a bcccrystal structure, increasing strength and reduction ofnotch opening with decreasing the test temperature werenoticed for the two steels, this phenomenon being clearerfor microstructure P. At �60 °C, the load drop suddenlyoccurred after 0.2mm of notch opening for steel P. Fortemperatures higher than �60 °C, fracture occurred oncethe maximum load had been reached.
Fracture surfaces are illustrated in Figure 11. At�60 °C, fracture was globally brittle. They are identifiedby bright facets. Salemi et al. [11] attributed bright facetson broken surfaces to the effect of inter phase boundarieson the cleavage fracture. There were also some appar-ently planar, but rather rough facets at lower tempera-ture, resembling local intergranular cracking. NPSspecimens tended to reveal them more frequently thanCharpy specimens. One of these facets is surrounded inFigure 11 (microstructure P at �60 °C) by a dotted whiteline. It is known [2] that intergranular cracks can besometimes attributed to reverse temper embrittlementbetween 450 and 600 °C and linked to segregation ofimpurities during tempering (P, Sn, As, Sb) at grainboundaries during tempering. Nevertheless, the temper-ing temperatures used in the present study were higher.In the ductile regions, large and fine dimples wereinitiated respectively from MnS particles and M3Ccarbides, as in Charpy specimens. Up to rather hightemperatures (about +40 °C), fracture surfaces ofmicrostructure M showed many coarse cleavage facetscorresponding to upper bainite; in fact, cleavage facets ofmartensite, which dominated the lower temperaturefracture surfaces (see fractographs at �60 °C) appearedmuch finer due to the intricate microtexture of martensitevariants.
3.4.2 Mechanical analysis
Identification and optimization of constitutive equations ofthe two steels were performed on Zset
®
in-house finiteelement software. The numerical procedures are identicalto that reported in [12]. First, a coupled-optimization wasmade based on the experimental results obtained on SCand SPS specimens at room temperature. For uniaxialtension of SC specimens, only the part of the curve beforenecking was considered. The entire load-displacementcurve for SPS specimens was simulated. Subsequently,optimized parameters were used for the numericalcalculation of tests on SPS specimens.
The plastic flow behavior of the two microstructurescould be well described by a Hosford yield locus, f (Eq. (1)),the usual normality rule for plastic strain together withnonlinear isotropic hardening (Eq. (2), p being thecumulative plastic strain), the loading path being approxi-mately radial in the stress space:

2 μm
P +20 °C
10 μm
P -60 °C
10 μm
P -20 °C
10 μm
M -20 °C
2 μm
M +20 °C
10 μm
M -60 °C
(a) (b)
(d) (e)
(c)
(f)
Tearing ridges
Fig. 7. Fracture surfaces of (a,b,c) P and (d,e,f) M Charpy specimens tested at �60 °C, �20 °C and at room temperature
0
25
50
75
100
-60 -40 -20 0 20 40 60
ener
gie
de p
ropa
gatio
n (J)
temparature d'essai (°C)
P M
0
25
50
75
100
-60 -40 -20 0 20 40 60
initi
atio
n en
ergy
(J)
test temperature (°C)
P
M
a b
Fig. 8. Fracture initiation energy (a) and fracture propagation energy (b), plotted against test temperature
F. Tioguem et al.: Mechanics & Industry 19, 107 (2018) 7
fðs; pÞ ¼ sH �RðpÞ with sH
¼ffiffiffiffiffiffiffiffiffiffiffiffiffiffiffiffiffiffiffiffiffiffiffiffiffiffiffiffiffiffiffiffiffiffiffiffiffiffiffiffiffiffiffiffiffiffiffiffiffiffiffiffiffiffiffiffiffiffiffiffiffiffiffiffiffiffiffiffiffiffiffiffiffiffiffiðs1 � s2Þn þ ðs2 � s3Þn þ ðs1 � s3Þn
2
n
r; ð1Þ
RðpÞ ¼ Ro þXi
Qið1� e�bipÞ; i ¼ 1; 2; 3: ð2Þ
In equation (1), s1> s2> s3 are the eigenvalues of theusual deviator part of the stress tensor, s. In equations(1–2), Qi, n and bi are material parameters. Ro is theinitial yield strength. In the optimization predure, the
Young modulus and Poisson’s ratio were set to200GPa and 0.3, respectively, for both microstruc-tures. To guide the optimization of material param-eters, the maximum uniform elongation for SC testswas forced to fit with experimental data through anadditional relationship between material parameters.To this aim, the Considère criterion (Eq. (3)) wasapplied as follows:
dR
dp¼ R; ð3Þ

0
5
10
15
20
25
0 4 8 12
load
(kN
)
displacement (mm)
P
M
Fig. 9. ICIT waveforms of specimens tested at +60 °C.
8 F. Tioguem et al.: Mechanics & Industry 19, 107 (2018)
at the onset of load decrease, from which one obtains
Ro �Xi
Qi½ð1þ biÞe�bipcrit � 1� ¼ 0; i ¼ 1; 2; 3; ð4Þ
where pcrit∼ 0.058Optimized parameters for the behavior of tensile test on
PS specimens at room temperature are presented inTable 3. From Figure 4, good agreement with experimentalresults was obtained. This allowed the stress state in thevarious specimens to be estimated at the onset of fracture(see Sect. 4.2).
4 Discussion: comparison between fracturebehavior in Charpy tests and in quasistatictests on notched plane strain specimens
4.1 Fracture mechanisms
Impact toughness results showed that in the USE range,microstructure M was tougher than microstructure P. Onthe one hand, only M3C carbides were observed in the finedimples. On the other hand, the nearest-neighbor distancebetween M3C carbides is nearly the same for micro-structures P and M. So the only difference was on theaverage size of these carbides. The lower USE ofmicrostructure P could be due to the fact that carbideswere by 0.03mm larger than those of microstructure M,ductile crack initiation being possibly easier than onmicrostructure M. Nevertheless, the only effect of carbidescould probably not explain the difference in USE. Thehigher impact toughness of microstructure M in the USErange could also be attributed to bainite. The lowerstrength of bainite-containing microstructure M wasprobably overwhelmed by its higher resistance to ductilecrack initiation, leading to higher fracture initiationenergy.
As soon as brittle fracture appeared, the detrimentaleffect of bainite drastically reduced the fracture energy ofmicrostructure M. Figure 12 shows that in contrast with
the fracturemechanisms of Charpy impact specimens, NPSspecimens tended to enhance differences between transi-tion regions of the two microstructures. From the coarsesize (20mm) of cleavage facets observed on NPS specimensof microstructure M up to warm temperatures, this brittlebehavior could be attributed to a higher cleavage-to-ductile transition temperature of bainite in NPS specimensthan in Charpy specimens. On the contrary, microstruc-ture P showed good agreement between fracture mecha-nism transition temperatures obtained with NPSspecimens and with Charpy specimens, respectively. Thiscould indicate that quasistatic tests on NPS specimenscould be more sensitive than conventional Charpy impacttests to microstructural features that exhibit a lowerresistance to brittle cleavage (micro) cracking.
4.2 Comparison of stress states between Charpy andNPS specimens
Stress states between Charpy quasi-static and NPSspecimens were compared by considering the evolutionof the three principal stresses, stress triaxiality h and Lodeparameter L ahead of the notch tip. All the distributionswere calculated along the ligament at the center of CharpyV-notch and NPS specimens. The position x along theligament was normalized by v, the distance from the tip ofthe notch to the center of the NPS geometry, and the initiallength of the ligament for Charpy specimens. Thisnormalizing distance is respectively v=1.5mm andv=8mm for NPS and Charpy geometry. As presentedin Figure 13a, the principal stresses (S1, S2 and S3) for thetwo geometries increase, then decrease steadily withincreasing the distance to notch tip. For the twogeometries, S1 keeps significantly higher values while S2and S3 tend to keep similar values farther from the notchtip. Figure 13b plots evolution of h and L close to the tip ofthe notch. They have same tendency for the twogeometries, at least close to the crack initiation locus(i.e. close to the mid-thickness of the NPS specimens andabout 0.25mm from the nocth tip of the Charpy specimen).
5 Conclusion
In the present work, two microstructures P and M takenfrom the same bar of a high strength quenched+ temperedmartensitic steel were study by instrumented Charpy testsand tensile tests on double-side notched plane strainspecimens. The main conclusions are as follows:
– In both tests, ductile fracture initiated from coarser voidsnucleated from inclusions, then from finer voids nucleat-ed from coarse cementite particles; finer carbides seem tobe too small to initiate fracture during plastic deforma-tion.–
From Charpy tests, the ductile-to-brittle transition inimpact energy was mainly attributed to a transition inpropagation energy; nevertheless, the initiation energysteadily increased with temperature, being higher formicrostructure M at higher temperatures, and lower atlower temperatures. This difference dominated thedifference in USE between the two microstructures.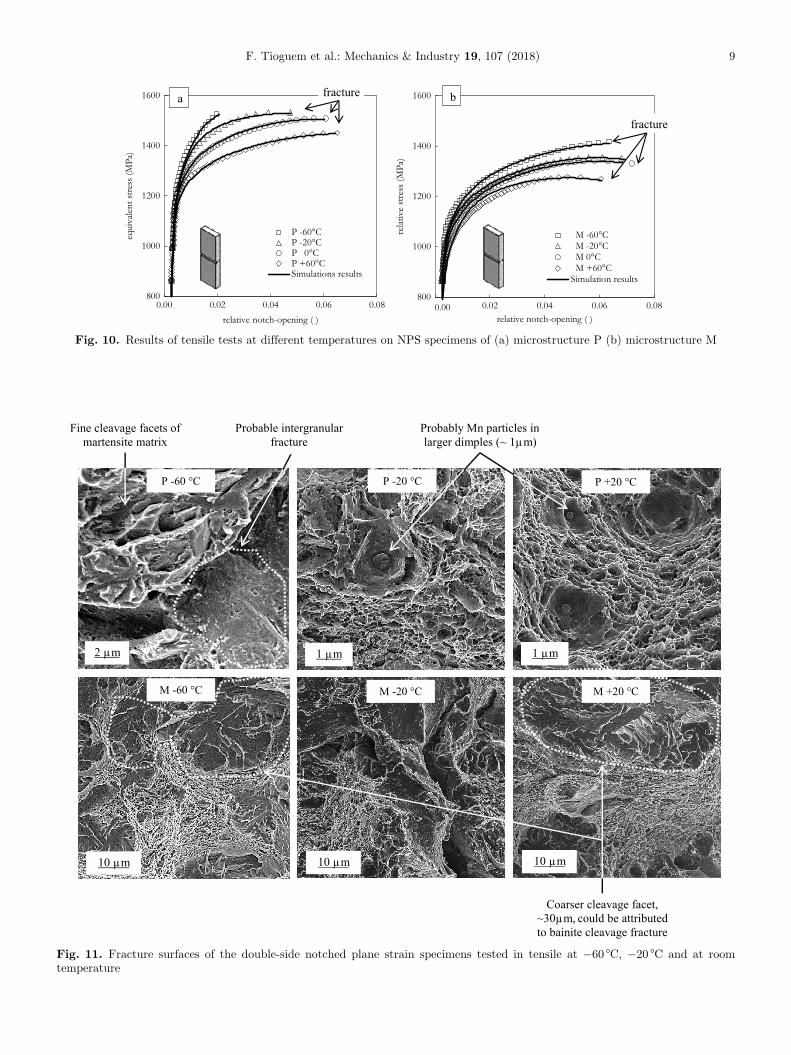
1 μm 1 μm
P +20 °CP -20 °C
2 μm
P -60 °C
M -60 °C
10 μm
M -20 °C M +20 °C
10 μm10 μm
Coarser cleavage facet, ~30μm, could be attributed to bainite cleavage fracture
Probable intergranular fracture
Fine cleavage facets of martensite matrix
Probably Mn particles in larger dimples (~ 1μm)
Fig. 11. Fracture surfaces of the double-side notched plane strain specimens tested in tensile at �60 °C, �20 °C and at roomtemperature
800
1000
1200
1400
1600
0.00 0.02 0.04 0.06 0.08
equi
valen
t stre
ss (M
Pa)
relative notch-opening ( )
P -60°CP -20°CP 0°CP +60°CSimulations results
800
1000
1200
1400
1600
0.00 0.02 0.04 0.06 0.08
relat
ive
stre
ss (M
Pa)
relative notch-opening ( )
M -60°C M -20°C M 0°C M +60°CSimulation results
a fracture
fracture
b
Fig. 10. Results of tensile tests at different temperatures on NPS specimens of (a) microstructure P (b) microstructure M
F. Tioguem et al.: Mechanics & Industry 19, 107 (2018) 9

Test temperature -60 -20-40 0 +20 +40 +60
Notched, plane strain, P microstructure
Notched, plane strain, M microstructure
Ductile fracture
Transition region
Brittle fracture
Charpy test for P and M microstructures
Fig. 12. Comparison of fracture appearance transition behaviors betweenCharpy impact tests specimens and quasi-static tensile testson NPS specimens.
Fig. 13. Comparison of estimated evolutions of (a) principal stresses ahead of the notch tip and (b) estimated stress triaxiality andLode parameter along the ligament between (static) Charpy and NPS specimens.
Table 3. Optimized parameters of the constitutive equations at room temperature
Hardening rule ParametersSpecimens n Ro (MPa) Q1(MPa) b1 Q2(MPa) b2 Q3(MPa) b3
P 7 874 241 81 312 4 106 0.1M 7 800 216 62 214 4 102 0.1
10 F. Tioguem et al.: Mechanics & Industry 19, 107 (2018)
–
In addition to the slight effect of the M3C carbides, thepresence of bainite within the microstructure of steel Mtends to contribute significantly to the USE. On the otherhand, upper bainite was responsible for the lowerresistance of microstructure M to brittle fracture, leadingto lower fracture energy in the low-temperature range.–
Tensile tests on notched plane strain specimens were inqualitative agreement with Charpy results, yet beingmore sensitive to the cleavage fracture of bainite.–
Analysis of stress state show qualitatively similar loadingconditions, in particular concerning the Lode parameter,between NPS and Charpy geometriez analyzed in quasi-static conditions.The development of a ductile fracture criterion for Pand M specimen is in progress, were are also developing apredictive fracture energy tools by using test in quasi-staticconditions.
Acknowledgments. The authors would like to express theirgratitude to FranckN’guyen for the development of the numericalSKIZ analysis tool, to Gerard Brabant, Antoine Debray andKevin Barriere for having performed some of the scanningelectron microscopy analysis. This work is supported by ANRT(French innovation supporting agency) under Grant CIFRE2016/0670.

F. Tioguem et al.: Mechanics & Industry 19, 107 (2018) 11
References
[1] G. Béranger, G. Henry, G. Labbe, P Soulignac, Les aciersspéciaux, Lavoisier, Paris, 1997
[2] M. Saby, T. Sourmail, Rapport d’avancement sur laconnaissance de la trempe-revenu des nuances oil&gas,Ascometal CREAS, CREAS R 2014-15 2014
[3] Y. Tomita, Low-Temperature improvement of mechanicalproperties of AISI 4340 steel through high-temperature thermo-mechanical treatment,Metall. Trans. A. 22 5 (1991) 1093–1102
[4] S. Takebayashi, K. Ushioda, N. Yoshinaga, S. Ogata, Effectof carbide size distribution on the impact toughness oftempered martensitic steels with two different prior austen-ite grain sizes evaluated by instrumented charpy test, Mater.Trans. 54 7 (2013) 1110–1119
[5] Y.-R. Im, Y. Jun Oh, B.-J. Lee, J. Hwa Hong, H.-C. Lee,Effects of carbide precipitation on the strength and charpyimpact properties of low carbonMn–Ni–Mo bainitic steels, J.Nucl. Mater. 297 2 (2001) 138–148
[6] A. Pineau, Development of the local approach to fractureover the past 25 years: theory and applications, Int. J. Fract.138 1–4 (2006) 139–166
[7] L. Xue, T. Wierzbicki, Ductile fracture initiation andpropagation modeling using damage plasticity theory,Eng. Fract. Mech. 75 11 (2008) 3276–3293
[8] T. Wierzbicki, Y. Bao, Y.-W. Lee, Y. Bai, Calibration andevaluation of seven fracture models, Int. J. Mech. Sci. 47 4–5(2005) 719–743
[9] P.R. Sreenivasan, S.K. Ray, S.L. Mannan, P. Rodriguez,Dynamic fracture toughness and charpy impact properties ofan AISI 403 martensitic stainless steel, J. Nucl. Mater. 228 3(1996) 338–345
[10] P. Hau�sild, I. Nedbal, C. Berdin, C. Prioul, The influence ofductile tearing on fracture energy in the ductile-to-brittletransition temperature range, Mater. Sci. Eng. A, 335 1–2(2002) 164–174
[11] A. Salemi, A. Abdollah-Zadeh, M. Mirzaei, H. Assadi, Astudy on fracture properties of multiphase microstruc-tures of a CrMo steel, Mater. Sci. Eng. A 492 1–2 (2008)45–48
[12] J. Lorthios, M. Mazière, X. Lemoine, P. Cugy, J. Besson, A.-F. Gourgues-Lorenzon, Fracture behaviour of a Fe–22Mn–0.6C–0.2V austenitic TWIP steel, Int. J. Mech. Sci. 101(2015) 99–113
Cite this article as: F. Tioguem,M.Maziere, F. Tankoua, A. Galtier, A.-F. Gourgues-Lorenzon, Identification of ductile to brittletransition temperature by using plane strain specimen in tensile test and correlation with instrumented Charpy impact test:experimental and numerical study, Mechanics & Industry 19, 107 (2018)