Identification of Asthma Phenotypes using Cluster...
38
Identification of Asthma Phenotypes using Cluster Analysis in the Severe Asthma Research Program Wendy C. Moore, MD 1,2 , Deborah A. Meyers, PhD 1,2 , Sally E. Wenzel, MD 2 , W. Gerald Teague, MD 2 , Huashi Li, MS 1 , Xingnan Li, PhD, MS 1 , Ralph D’Agostino, Jr., PhD 3 , Mario Castro, MD 2 , Douglas Curran-Everett, PhD 2 , Anne M. Fitzpatrick, PhD 2 , Benjamin Gaston, MD 2 , Nizar N. Jarjour, MD 2 , Ronald Sorkness, PhD 2 , William J. Calhoun, MD 2 , Kian Fan Chung, MD 2 , Suzy A.A. Comhair, PhD 2 , Raed A. Dweik, MD 2 , Elliot Israel, MD 2 , Stephen P. Peters, MD, PhD 1,2 , William W. Busse, MD 2 , Serpil C. Erzurum, MD 2 , Eugene R. Bleecker, MD 1,2 for the National Heart Lung Blood Institute’s Severe Asthma Research Program 2 . 1 Wake Forest University School of Medicine, Center for Human Genomics, Winston Salem, NC 2 The Severe Asthma Research Program (SARP) 3 Wake Forest University School of Medicine, Public Health Sciences, Winston-Salem, NC The Severe Asthma Research Program (SARP) is a multicenter asthma research group funded by the NHLBI and consisting of the following contributors (Principal Investigators are marked with an asterisk): Brigham & Women's Hospital - Elliot Israel*, Bruce D. Levy, Gautham Marigowda; Cleveland Clinic - Serpil C. Erzurum*, Raed A. Dweik, Suzy A.A. Comhair, Emmea Cleggett-Mattox, Deepa George, Marcelle Baaklini, Daniel Laskowski; Emory University - Anne M. Fitzpatrick, Eric Hunter, Denise Whitlock; Imperial College School of Medicine - Kian F. Chung*, Mark Hew, Patricia Macedo, Sally Meah, Florence Chow; University of Pittsburgh - Sally E. Wenzel*, Erin Aiken; University of Texas-Medical Branch - William J. Calhoun*, Bill T. Ameredes, Dori Smith; University of Virginia - Benjamin Gaston*, W. Gerald Teague*, Mike Davis; University of Wisconsin - William W. Busse*, Nizar Jarjour, Ronald Sorkness, Sean Fain, Erin Billmeyer, Cheri Swenson, Gina Crisafi, Laura Frisque, Dan Kolk; Wake Forest University - Eugene R. Bleecker*, Deborah Meyers, Wendy Moore, Stephen Peters, Annette Hastie, Gregory Hawkins, Jeffrey Krings, Regina Smith; Washington University in St Louis - Mario Castro*, Leonard Bacharier, Iftikhar Hussain, Jaime Tarsi; Data Coordinating Center - Douglas Curran-Everett*, Maura Robinson, Lori Silveira; NHLBI - Patricia Noel* Page 1 of 38 AJRCCM Articles in Press. Published on November 5, 2009 as doi:10.1164/rccm.200906-0896OC Copyright (C) 2009 by the American Thoracic Society.
Transcript of Identification of Asthma Phenotypes using Cluster...
Identification of Asthma Phenotypes using Cluster Analysis in the Severe
Asthma Research Program
Wendy C. Moore, MD1,2
, Deborah A. Meyers, PhD1,2
, Sally E. Wenzel, MD2, W. Gerald Teague,
MD2, Huashi Li, MS
1, Xingnan Li, PhD, MS
1, Ralph D’Agostino, Jr., PhD
3, Mario Castro, MD
2,
Douglas Curran-Everett, PhD2, Anne M. Fitzpatrick, PhD
2, Benjamin Gaston, MD
2, Nizar N.
Jarjour, MD2, Ronald Sorkness, PhD
2, William J. Calhoun, MD
2, Kian Fan Chung, MD
2, Suzy
A.A. Comhair, PhD2, Raed A. Dweik, MD
2, Elliot Israel, MD
2, Stephen P. Peters, MD, PhD
1,2,
William W. Busse, MD2, Serpil C. Erzurum, MD
2, Eugene R. Bleecker, MD
1,2 for the National
Heart Lung Blood Institute’s Severe Asthma Research Program2.
1 Wake Forest University School of Medicine, Center for Human Genomics, Winston Salem, NC
2 The Severe Asthma Research Program (SARP)
3 Wake Forest University School of Medicine, Public Health Sciences, Winston-Salem, NC
The Severe Asthma Research Program (SARP) is a multicenter asthma research group funded by
the NHLBI and consisting of the following contributors (Principal Investigators are marked with
an asterisk):
Brigham & Women's Hospital - Elliot Israel*, Bruce D. Levy, Gautham Marigowda; Cleveland
Clinic - Serpil C. Erzurum*, Raed A. Dweik, Suzy A.A. Comhair, Emmea Cleggett-Mattox, Deepa
George, Marcelle Baaklini, Daniel Laskowski; Emory University - Anne M. Fitzpatrick, Eric
Hunter, Denise Whitlock; Imperial College School of Medicine - Kian F. Chung*, Mark Hew,
Patricia Macedo, Sally Meah, Florence Chow; University of Pittsburgh - Sally E. Wenzel*, Erin
Aiken; University of Texas-Medical Branch - William J. Calhoun*, Bill T. Ameredes, Dori Smith;
University of Virginia - Benjamin Gaston*, W. Gerald Teague*, Mike Davis; University of
Wisconsin - William W. Busse*, Nizar Jarjour, Ronald Sorkness, Sean Fain, Erin Billmeyer, Cheri
Swenson, Gina Crisafi, Laura Frisque, Dan Kolk; Wake Forest University - Eugene R. Bleecker*,
Deborah Meyers, Wendy Moore, Stephen Peters, Annette Hastie, Gregory Hawkins, Jeffrey
Krings, Regina Smith; Washington University in St Louis - Mario Castro*, Leonard Bacharier,
Iftikhar Hussain, Jaime Tarsi; Data Coordinating Center - Douglas Curran-Everett*, Maura
Robinson, Lori Silveira; NHLBI - Patricia Noel*
Page 1 of 38 AJRCCM Articles in Press. Published on November 5, 2009 as doi:10.1164/rccm.200906-0896OC
Copyright (C) 2009 by the American Thoracic Society.
Correspondence and reprint requests:
Wendy C. Moore, M.D.
Center for Human Genomics
Wake Forest University School of Medicine
Medical Center Boulevard
Winston-Salem, NC 27157
Tel: (336) 713-7500 Fax: (336) 713-7566
E-mail: [email protected]
Grant support: HL69116, HL69130, HL69149, HL69155, HL69167, HL69170, HL69174,
HL69349, M01 RR018390, M01RR07122, M01 RR03186. HL087665
Running Head: Severe Asthma Phenotypes
Descriptor Number: Asthma pathophysiology 60
Word Count (body of manuscript): 4,504
“At a Glance Commentary”
Scientific Knowledge on Subject: Current classification and management approaches in
asthma do not reflect the heterogeneous characteristics of this disease.
What This Study Adds to the Field: Using modeling approaches, this paper describes
five distinct clinical phenotypes of asthma that suggest differences in pathophysiologic
mechanisms.
Page 2 of 38

This article has an online data supplement, which is accessible from this issue's table of content
online at www.atsjournals.org
Page 3 of 38
Moore 1
Abstract
Rationale: The Severe Asthma Research Program cohort includes subjects with persistent asthma who
have undergone detailed phenotypic characterization. Previous univariate methods compared features of
mild, moderate and severe asthma.
Objective: Identify novel asthma phenotypes using an unsupervised hierarchical cluster analysis.
Methods: Reduction of the initial 628 variables to 34 core variables was achieved by elimination of
redundant data and transformation of categorical variables into ranked ordinal composite variables.
Cluster analysis was performed on 726 subjects.
Measurements and Main Results: Five groups were identified. Subjects in Cluster 1 (n=110) have
early onset atopic asthma with normal lung function treated with ≤ 2 controller medications (82%) and
minimal health care utilization. Cluster 2 (n=321) consists of subjects with early onset atopic asthma and
preserved lung function, but increased medication requirements (29% on ≥ 3) and health care utilization.
Cluster 3 (n=59) is a unique group of mostly older obese women with late onset nonatopic asthma,
moderate reductions in FEV1 and frequent oral corticosteroid use to manage exacerbations. Subjects in
Clusters 4 (n=120) and 5 (n=116) have severe airflow obstruction with bronchodilator responsiveness,
but differ with regards to their ability to attain normal lung function, age of asthma onset, atopic status,
and use of oral corticosteroids.
Conclusions: Five distinct clinical phenotypes of asthma have been identified using unsupervised
hierarchical cluster analysis. All clusters contain subjects who meet the ATS definition of severe asthma,
which supports clinical heterogeneity in asthma and the need for new approaches for the classification of
disease severity in asthma.
Abstract word Count: 249
Key Words (list up to 5): asthma phenotype, definition, cluster analysis, severe asthma
Page 4 of 38
Moore 2
Introduction
Asthma is defined as a clinical syndrome of intermittent respiratory symptoms triggered by viral upper
respiratory infections, environmental allergens or other stimuli, and is characterized by nonspecific
bronchial hyperresponsiveness and airways inflammation (1, 2). An accurate assessment of asthma
severity is essential to predict future risk and impairment and to guide asthma management. The
National Asthma Education and Prevention Program (NAEPP) and Global Initiative for Asthma
(GINA) Guidelines divide asthma severity based on lung function (FEV1), daytime and nocturnal
symptoms and frequency of rescue bronchodilator use (1, 2). There is increasing evidence, however, that
this approach does not reflect the heterogeneous characteristics of this disease that are observed in
asthma populations (3-5). Identification of heterogeneity and classification of asthma by phenotypes
provides a foundation from which to understand disease causality and ultimately to develop
management approaches that lead to improved asthma control while avoiding adverse effects and
decreasing the risk of serious asthma outcomes (exacerbations and loss of pulmonary function) (6, 7).
Asthma heterogeneity and complex therapeutic management strategies are more easily recognized in
severe asthma, where patients have diverse symptom profiles and altered responses to medications (7-
11). The goal of the National Heart Lung and Blood Institute sponsored Severe Asthma Research
Program (SARP) is to identify and characterize not only a large number of subjects with severe asthma
but also to compare these subjects with mild to moderate asthma. Initial data from SARP demonstrated
persistent symptoms and high health care utilization (HCU) in severe asthma despite complex
medication regimens including high doses of inhaled or oral corticosteroids (11). These results
suggested differences in the severe asthma phenotype stratified by age of onset with a group of later
onset, less atopic subjects that reported frequent sinopulmonary infections.
To expand on the previous report, an unsupervised modeling method was applied to the SARP dataset in
order to identify unique groups or clusters of individuals with asthma and evaluate the range of
phenotypic heterogeneity. Five distinct clusters of asthma phenotypes were identified that differ in lung
function, age of asthma onset and duration, atopy, gender, symptoms, medication use and health care
utilization. Some of the results of these studies have been previously reported in the form of an abstract
(12).
Page 5 of 38
Moore 3
Methods
The Severe Asthma Research Program (SARP). Study participants underwent a detailed phenotypic
characterization using established standard operating procedures as previously described (11). Briefly,
investigators recruited nonsmoking asthma subjects (< 5 pack years of tobacco use) who met the ATS
definition of severe asthma and an additional group of subjects with asthma that did not meet these
criteria (10). After informed consent, clinical staff administered questionnaires that assessed
demographic information, asthma symptoms and medication use, medical history and health care
utilization (HCU). Physiologic testing of lung function included “Baseline” pre-bronchodilator
spirometry with withholding of appropriate medications, responsiveness to 2-8 puffs of short-acting
beta-agonists (“Maximal” lung function) and bronchial hyperresponsiveness to methacholine in subjects
with a Baseline FEV1>55%. Atopy was assessed by skin prick testing, measurement of serum total IgE
and blood eosinophils. Exhaled nitric oxide was measured using ATS-approved on-line devices at a
constant flow rate and induced sputum was collected in a subset of subjects for evaluation of
inflammatory cells. Some of the characteristics of a subset of these subjects have been reported in
previous publications (11-20).
Variable Reduction/Data Transformation. The entire dataset provided 628 variables that required
reduction in number prior to performance of a cluster analysis (see Figure E1 in the online supplement).
Variables with missing data were excluded immediately. Variables that were clinically redundant
(multiple pulmonary function assessments) were reduced by selection of variables chosen to reflect
certain physiologic parameters (such as pre- and post-bronchodilator FEV1). Categorical data from the
questionnaires were excluded if the data were presented in text format (such as name of nasal steroid),
had been added later in the study (resulting in incomplete data) or if the information would be irrelevant
for the current analysis (such as parental race).
Other questionnaire data were binary (yes/no questions) or a spectrum of responses (frequency of
albuterol use) and these data were transformed into “composite variables” to capture multiple questions
into a ranked ordinal scale. For example, health care utilization in the past year was queried in five
Page 6 of 38
Moore 4
separate yes/no questions on several forms. These questions were consolidated into one variable by
generating a ranked “severity” scale ranging from no HCU to ED visit to hospitalization and ICU care
(see Table E1 in the online supplement). Subjects were assigned a rank based on the most severe HCU
reported by that individual. All composite variables were assigned a range of 0 to 10 so that they were
equally weighted in the analysis. Similar transformation of data allowed reduction of 63 separate binary
questions into 17 composite variables that reflect the information obtained from these individual
questions.
Half of the 34 variables that were included in the cluster analysis were numeric variables and the
remaining half were transformed composite variables (see Table E2 in the online data supplement).
These variables were selected to cover a broad spectrum of routine assessments of asthma patients
including demographic data (sex, race, age), additional variables previously reported to have an effect
on disease severity (age of onset, asthma duration), elements of current classification schemes including
those indicative of impairment (symptoms, medication use) or risk (HCU) and those that confound
current asthma control (smoke exposure, sinopulmonary infections), as well as, important physiologic
measures (lung function, atopy). Subjects were required to have all 34 variables to be included in the
cluster analysis.
Statistical analysis. SAS version 9.1 (SAS Institute Inc. Cary, NC) was used for the cluster and
discriminant analyses. Ward’s minimum-variance hierarchical clustering method was performed
utilizing an agglomerative (bottom-up) approach and Ward’s linkage (see dendrogram in Figure E2 in
the online supplement). At each generation of clusters, samples were merged into larger clusters to
minimize the within-cluster sum of squares or maximize between-cluster sum of squares. To compare
differences between clusters, ANOVA, Kruskal-Wallis, and chi square tests were used for parametric
continuous, non-parametric continuous and categorical variables respectively. Stepwise discriminant
analysis was performed on the 34 variables to identify a subset of variables for the Tree analysis.
Recursive partitioning and regression tree were used to generate binary trees (Rpart package (version
3.1-36) incorporated in R package (version 2.5.1) and based on CART (Classification and Regression
Trees) using the methods of Breiman and colleagues (21). The binary tree was pruned to minimize the
cross-validation error.
Page 7 of 38
Moore 5
Results
Subject Demographics. The initial dataset included 856 subjects ranging in age from 6 to 80 years.
Preliminary review of the results of this initial analysis by the SARP Steering Committee, however,
determined that participants under 12 years of age (n=39) should not be included in this analysis based
on previous reports suggesting important differences in phenotype in young children (14, 22, 23). The
final analysis includes 726 subjects ≥ 12 years of age who had complete data for the 34 phenotypic
variables; 304 of these subjects met the ATS workshop criteria for severe asthma. The demographics for
the entire cohort are reported in the first column in Tables 1 and 2. In addition, the clinical
characteristics for the cohort are presented with the sample divided into mild, moderate and severe
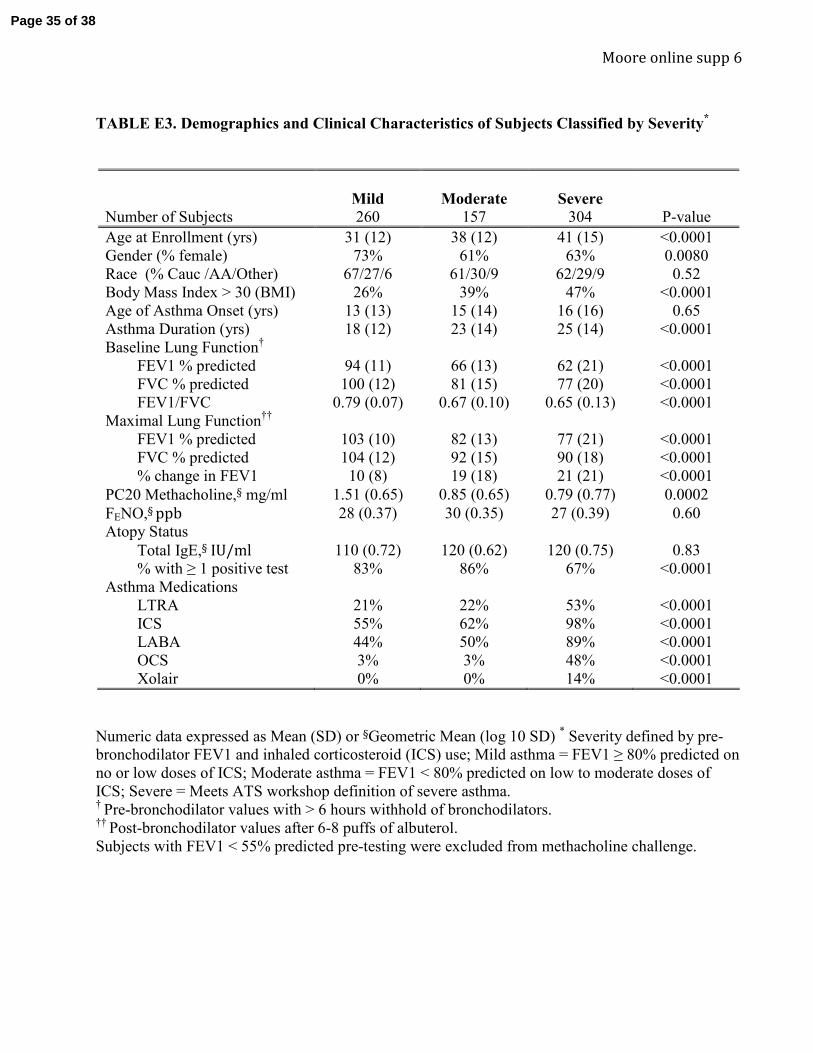
asthma in Table E3 (in the online supplement), similar to the univariate analysis of the first 450 subjects
in SARP (11). Clinical characteristics of the SARP cohort have remained consistent over the 7-year
period of patient recruitment.
Cluster Analysis. Using the agglomerative cluster approach outlined in the methods, a dendrogram was
generated (see Figure E2 in the online supplement). Six clusters were identified, but the sixth cluster was
a small subgroup of Cluster 5 (n=31) and the sample size of this group reduced the value of additional
subdivision. The resulting five clusters differ significantly by age and gender, but not by self-reported
race, although clusters 3 and 5 contain a greater percentage of non-Hispanic whites as compared to the
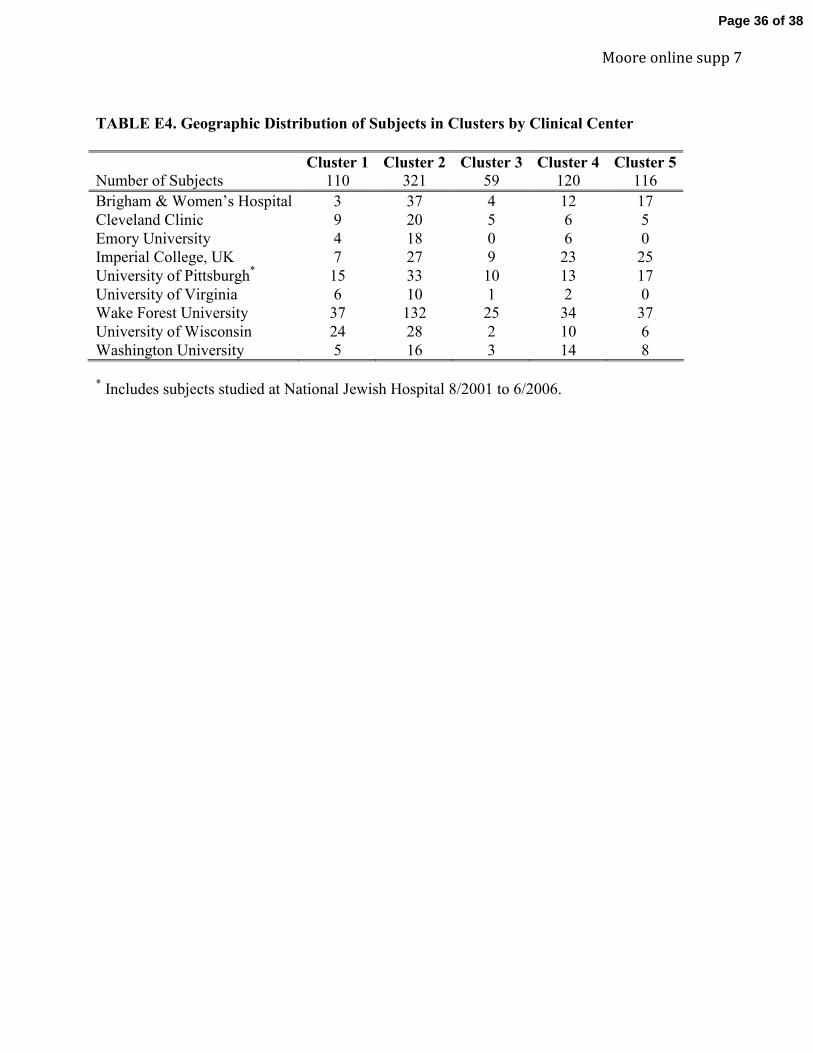
other clusters (Table 1). While some clinical sites enrolled a larger number of subjects, there was no
significant difference in the distribution of the clusters at any given site (see Table E4 in the online data
supplement). Demographic and lung function results for each cluster are shown in Table 1, while
medication use and health care utilization (HCU) are reported in Table 2.
Cluster 1. Fifteen percent of subjects (n = 110) are grouped into Cluster 1. This cluster is characterized
by younger, predominantly female subjects with childhood onset/atopic asthma and normal lung
function. Forty percent of these subjects were receiving no controller medications, and those on asthma
medications were most often on two or less controller therapies with an ICS/LABA combination most
frequently reported. HCU was infrequent in this group with nearly 70% reporting no need for any urgent
Page 8 of 38
Moore 6
physician or emergency department (ED) visits, oral corticosteroid (OCS) bursts or hospitalizations in
the past year. Despite a lack of exacerbations requiring urgent evaluation, 30-40% of Cluster 1 subjects
reported daily symptoms and rescue bronchodilator use (see Figures E3 A and B in the online data
supplement). This group contains the youngest and potentially most active subjects suggesting that
symptoms may be primarily due to exercise related symptoms.
Cluster 2. Cluster 2 is the largest group (n = 321; 44% of subjects). It consists of slightly older subjects,
two thirds female, with primarily childhood onset/atopic asthma. This group is distinguished by baseline
pre-bronchodilator lung function that is relatively normal (65% with an FEV1 > 80% predicted), or can
be reversed to normal (> 80% predicted) in nearly all of the subjects (94%). Medication use is more
prevalent in this group with fewer subjects not receiving controller medications (26%), a shift toward
increased numbers of controllers (29% on ≥ 3 drugs) and higher doses of ICS (28% on high dose ICS).
HCU, asthma symptoms and reported albuterol use, however, were similar to those observed in Cluster
1, although Cluster 2 was treated with a greater number of asthma medications.
Cluster 3. Cluster 3 is the smallest cluster (n=59, 8% of subjects). It is markedly different from the other
clusters and consists mainly of older women (mean=50 yrs, range 34-68 years) with the highest BMI
(58% with BMI > 30) and late onset asthma (all > 23 years old), who are less likely to be atopic (64%).
Despite a shorter reported duration of asthma, subjects in this cluster have decreased baseline pulmonary
function (71% with a FEV1 < 80% predicted) and only 64% are able to attain this benchmark after
bronchodilators. These subjects report complicated medical regimens with more than half describing
treatment with ≥ 3 asthma drugs (one of which is frequently high dose ICS) and 17% receiving regular
systemic corticosteroids (CS). Despite this increased reliance on medications they report more HCU
(especially need for OCS bursts) and daily asthma symptoms that approach levels reported by subjects
in Clusters 4 and 5. Subjects in Cluster 3 report symptoms and HCU that appear to be out of proportion
to their degree of airflow obstruction. This result suggests an important relationship between obesity,
level of symptoms and HCU in this group of subjects.
Clusters 4 and 5. The remaining 33% of subjects are grouped in Clusters 4 and 5. Nearly 70% of
subjects in Cluster 4 (n= 120) and 80% of subjects in Cluster 5 (n=116) fulfill the ATS workshop
criteria for severe asthma. Subjects are equally divided between these two clusters, but Cluster 4 is
Page 9 of 38
Moore 7
characterized by equal representation of both genders and many subjects with childhood onset (72%)
and atopic disease (83%), while Cluster 5 consists of more women (63%) with mainly later onset disease
(69% late onset) and less atopy (66%). Both Clusters 4 and 5 are characterized by a long duration of
disease, with those in Cluster 5 having the longest duration. Clusters 4 and 5 differ in the level of
baseline lung function and the magnitude of response to bronchodilators. Subjects in Cluster 4 have
severe reductions in pulmonary function at baseline (mean FEV1 57% predicted) but 40% of subjects
are able to reverse to the near normal range (> 80% predicted) following 6-8 puffs of albuterol. In
contrast, subjects in Cluster 5 have the most severe airflow limitation at baseline (mean FEV1 43%
predicted) and, despite some response to maximum bronchodilator testing, 94% of subjects remain with
a FEV1 < 80% predicted. In both clusters, lung function is abnormal despite the use of multiple asthma
medications, 55-70% are receiving ≥ 3 asthma drugs and 60-80% on high dose ICS with subjects in
Cluster 5 treated more frequently with systemic CS (47%) than were subjects in Cluster 4 (39%). HCU
was similar in both Clusters 4 and 5 with nearly half of subjects reporting ≥ 3 oral CS bursts and an
additional 25% reporting inpatient hospitalization in the past year for a severe exacerbation. Nearly 40%
of subjects in Clusters 4 and 5 report a history of a prior ICU admission for asthma in their lifetime
(p<0.0001, data not shown). Not unexpectedly, 70% of subjects in these groups report daily symptoms
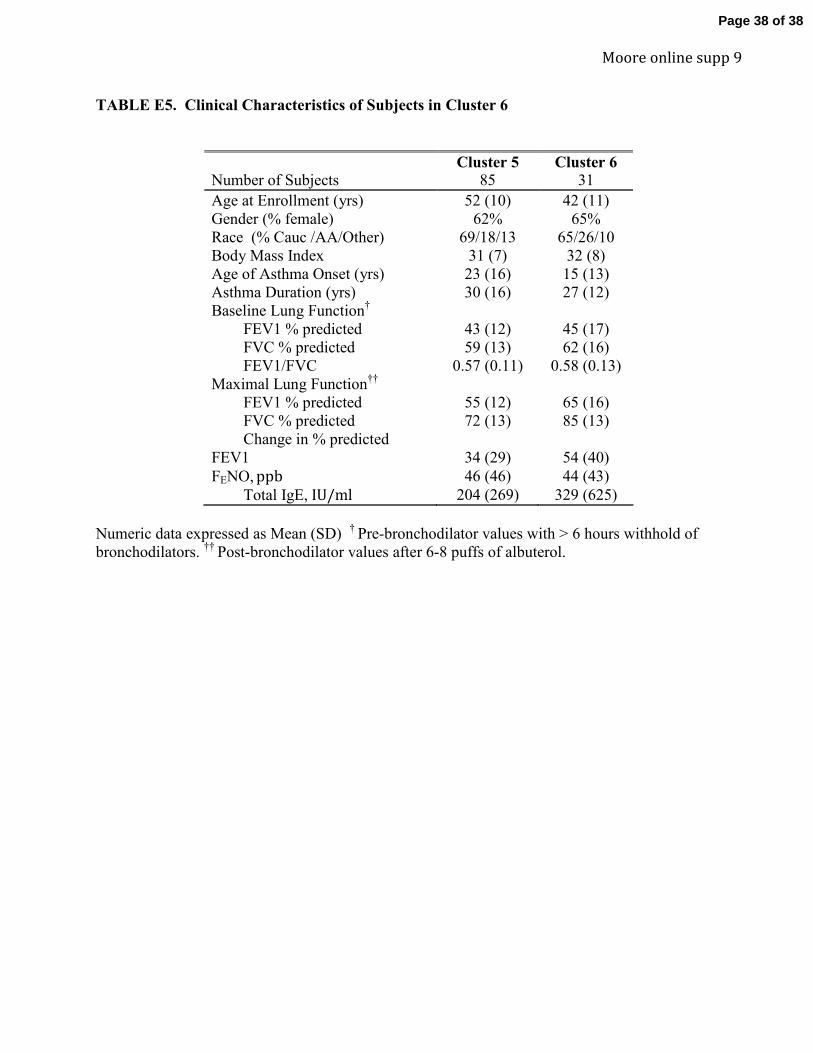
and poor quality of life. A potential sixth cluster was a subset of Cluster 5 consisting of 31 subjects who
showed a phenotype that was intermediate between Clusters 4 and 5. These individuals were somewhat
younger, more atopic and showed more bronchodilator reversibility that the remaining 85 subjects in
Cluster 5 (see Table E5 in the online data supplement).
Co-morbidities. In general, co-morbidities tracked with increasing severity and age of the clusters (Table
2). The oldest subjects (Clusters 3 and 5) reported the highest prevalence of sinus disease with nearly
half of those in Cluster 5 reporting prior sinus surgery. Clusters 3 and 5 also have the highest frequency
of hypertension when compared to the younger patients in other clusters. Pneumonia is reported more
frequently in Clusters 4 and 5, the subjects with the lowest lung function and highest exposure to
corticosteroid treatment. Subjects in Clusters 3, 4 and 5 reported more symptoms of GERD suggesting
that this co-morbidity may be associated with both asthma severity (Clusters 4 and 5) and increasing age
with or without obesity (Clusters 3 and 5).
Page 10 of 38
Moore 8
Discriminant Analysis and Tree Diagram. A discriminant analysis using the same 34 variables shows
that the eleven strongest discriminatory variables for cluster assignment are pulmonary function
measures, both baseline (FEV1, FVC and FEV1/FVC ratio) and following maximal bronchodilation
with 6-8 puffs of albuterol (Maximal FEV1 and FVC, % change in FEV1), age of asthma onset and
asthma duration, gender, frequency of beta-agonist use and dose of corticosteroids. A tree analysis was
performed using subsets of these variables to assess classification of subjects (Figure 1). Utilizing just
pre- and post-bronchodilator FEV1 % predicted and age of onset, 80% of subjects in the current sample
were assigned to the appropriate cluster (Figure 2). This suggests that a simple method for phenotyping
of asthma subclasses can be based on these clinical variables.
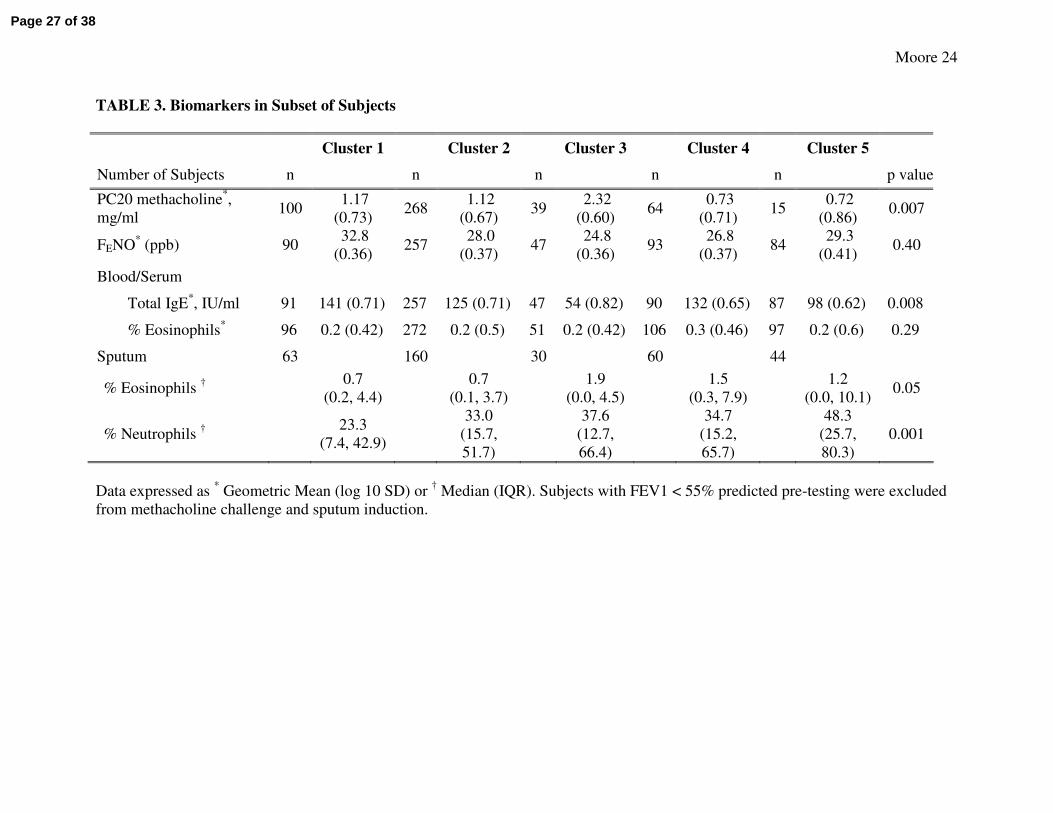
Biomarkers. Noninvasive measures of airway inflammation are only available on a subset of subjects
and thus these variables could not be used in the cluster analysis. In this subset, blood eosinophils and
FENO levels are similar in all clusters, but other biomarkers differ among clusters (Table 3). Serum total
IgE levels are highest in the atopic Clusters 1, 2 and 4 and lowest in Clusters 3 and 5. Clusters 4 and 5
are more hyperresponsive to methacholine, but less than half of these groups underwent testing, because
an FEV1 < 55% precluded subjects from undergoing bronchial challenge. Cluster 3 has the lowest levels
of bronchial hyperresponsiveness. Half of the subjects (n=357) provided a sputum specimen for analysis
with similar numbers of subjects sampled in Clusters 1, 2, 3 and 4 , but fewer subjects in Cluster 5 due
to poor lung function in the latter group. Sputum inflammatory cell counts are greatest in Clusters 3, 4,
and 5, but the cellular pattern differs among these clusters; eosinophils are elevated in Clusters 3, 4 and
5 while neutrophils are highest in Cluster 5.
Discussion
Asthma is a clinical syndrome that is characterized by variability in disease expression and severity (4,
5, 11). Asthma severity classification in current and previous guidelines is based on four to six “steps”
that range from intermittent to severe persistent asthma (1, 2). These classifications of asthma severity
are based on clinical characteristics that include frequency of symptoms, short-acting bronchodilator
use, pulmonary function and medication requirements (1, 2). If an individual with asthma meets any one
criterion in that “step” he is then assigned to that severity despite potential disease heterogeneity within
Page 11 of 38
Moore 9
the level. The major assumption in these classification schemes is that all patients within a specific
asthma severity level have similar disease characteristics and risk of future asthma exacerbations that
should be managed with the same therapeutic regimen. This traditional approach ignores asthma
subtypes within and across these levels of asthma severity. Furthermore, this classification approach
assumes that asthma patients who are classified as intermittent, mild, moderate and severe respond
similarly to specific therapies, although it is clear that optimal management strategies may not always be
achieved, specifically in the more severe or “difficult to treat” asthma patients (3, 7, 24). Thus, the
purpose of this study is to improve our understanding of the basis for severity classification and to
develop an asthma classification algorithm using comprehensive phenotyping approaches that reflect
pathophysiologic processes and disease heterogeneity. To accomplish this goal, data from the SARP
cohort, which includes all levels of asthma severity was analyzed using an unsupervised cluster
approach to determine asthma subphenotypes.
Identification of asthma subphenotypes has generally been accomplished in two ways; through a priori
definitions of a phenotype based on clinical characteristics of subjects or pathobiologic differences in
sputum or bronchoscopy specimens. The most studied clinical phenotypes have been related to age and
atopy. Studies that have compared childhood to adult asthma have reported more atopy and preserved
lung function in the former group (14, 25, 26). Other studies have described subsets of patient with adult
asthma characterized by age of onset that differ clinically suggesting different underlying
pathophysiologic mechanisms of disease (11, 26-28).
Several studies have demonstrated eosinophilic or noneosinophilic inflammation in asthma (28, 29), and
have led to clinical approaches that use these cellular biomarkers to guide asthma management (30).
Sputum eosinophilia is a biomarker that appears to be useful in guiding corticosteroid therapy (30), but
analysis of induced sputum may not be available in most clinical settings because of the complexity of
this technique and difficulty with accurate performance of this analysis. FENO has been used clinically
as a noninvasive biomarker to diagnose asthma and evaluate therapeutic responsiveness (31), but more
recent studies suggest limitations of its predictive value (32). A recent study has shown better diagnostic
and prognostic utility using a panel of several noninvasive inflammatory biomarkers (including FENO)
suggesting that a multidimensional approach may be more effective than single biomarker monitoring
(33). As investigators continue to explore biomarkers that directly reflect airways inflammation and
Page 12 of 38
Moore 10
disease severity or guide therapy, however, more clinically available phenotyping approaches should
also be evaluated to assess their ability to characterize severity and provide insight into pathobiologic
mechanisms in asthma.
The cluster analysis described in this paper is an unsupervised modeling approach to identify asthma
phenotypes within the SARP cohort. This paper describes five different groups of subjects with asthma
who differ in clinical, physiologic and inflammatory parameters. Of the eleven most important variables
that determine assignment to individual clusters, six are pulmonary function tests, two are related to age
(age of onset and duration of asthma), two are composite variables that reflect medication use
(corticosteroids, beta-agonists) and the last is gender.
Pulmonary function is an important determinant of disease severity (17, 34). In the current cluster
analysis the combination of both pre-bronchodilator and post-bronchodilator measurements (Baseline
and Best FEV1) best differentiates the mildest clusters (Cluster 1 from 2) and the most severe groups
(Cluster 4 from 5). It is important to identify the mildest asthma patients with the lowest risk and a pre-
bronchodilator FEV1 ≥ 80% predicted identifies all subjects in Cluster 1. The milder patients that do not
meet that benchmark (Cluster 2) would appear to be at higher risk. The most severe asthma patients have
a low pre-bronchodilator FEV1 (< 68% predicted), but it is the post-bronchodilator FEV1 that
determines assignment to Clusters 4 and 5. Unfortunately, pulmonary function testing is usually
performed without reference to recent bronchodilator use and in that setting the reported values may
represent the spectrum of pre-bronchodilator to post-bronchodilator FEV1. The difference between those
measurements determines phenotype in this cluster analysis and the importance of having a true baseline
FEV1 and a maximal post-bronchodilator (4 puffs albuterol) FEV1 will require further evaluation.
Several clusters (1, 2 and 4) consist of more atopic subjects with early or childhood onset of disease
consistent with the presence of an allergic phenotype in 76% of patients. Late onset asthma (after the age
of 12) and less atopy are more characteristic of the older subjects in Clusters 3 and 5 suggesting
additional non-allergic disease mechanisms. Regardless of age of onset, however, the subjects with the
longest duration of disease have the most severe asthma and lowest lung function (Clusters 4 and 5).
These results suggest that patients with long standing asthma are at risk for developing chronic airflow
obstruction, whether they have an allergic or non-allergic phenotype. Previous studies support this
Page 13 of 38
Moore 11
observation with some groups reporting severe chronic airflow obstruction in both patients with
persistent airway eosinophilia and subjects with less atopy and late onset asthma (27-29, 36).
Understanding the basis for persistent symptoms and reduced quality of life in Clusters 3 and 5 is
confounded by a higher frequency of obesity in these older subjects, suggesting that impairment may be
caused both by asthma and obesity. The interaction of asthma and obesity is complex since obesity may
worsen asthma or represent a coexistent condition that increases respiratory symptoms (37-39). Obesity
can be associated with reductions in FEV1 and FVC with a relatively preserved FEV1/FVC ratio and
recent studies have suggested dynamic hyperinflation as a possible etiology for dyspnea in these patients
(40). Subjects in Cluster 3 show evidence of mild airways obstruction with symptoms somewhat out of
proportion to their pulmonary impairment. It is important to note that all subjects in Cluster 3 had
bronchial hyperresponsiveness to methacholine consistent with their asthma diagnosis. Thus, Cluster 3
represents a difficult to manage late onset group of mostly older obese women with frequent
exacerbations requiring oral corticosteroid therapies.
The frequency and intensity of health care utilization is greatest in the clusters with the lowest lung
function (Clusters 4 and 5) despite therapy with high doses of inhaled and oral corticosteroids. It is
possible that reduced lung function may predispose to severe exacerbations and frequent
hospitalizations. The increased frequency of pneumonia in these groups, especially Cluster 5, may be
related to higher exposure to corticosteroids and is similar to the more frequent history of pneumonia
observed in COPD patients treated with high doses of inhaled corticosteroids (41).
Biomarkers are not included in the cluster analysis because only a subset of subjects had these
assessments. A post hoc analysis of this subset of subjects within the clusters provides potential insight
into pathobiologic mechanisms that may be related to the different phenotypes observed, especially in
Clusters 3, 4 and 5. While eosinophils are present in the sputum of subjects in all three of these clusters,
Cluster 4 subjects are characterized by elevated clinical measures of atopy (skin testing, serum IgE)
suggesting allergic, IgE-mediated eosinophilic airways inflammation is important in this group. In
contrast, sputum neutrophils are also elevated in Cluster 5 that contains subjects who are clinically less
atopic with frequent sinopulmonary infections suggesting complex mechanisms that may reflect allergic
inflammation and other pathobiologic factors including the systemic effects of obesity (38, 42).
Page 14 of 38
Moore 12
Persistent airway eosinophilia while receiving high doses of inhaled or oral corticosteroids in Clusters 3,
4 and 5 suggests the possibility of relative steroid insensitivity.
Other groups have reported statistical modeling approaches to investigate novel asthma phenotypes (5,
43-45). The overall purpose and methodology (factor or cluster), the size and demographics of the
cohorts and the number and type of variables used in these analyses differ. The cluster analysis reported
by Haldar and colleagues has similarities to the current study, but was performed in three smaller asthma
cohorts (the largest n = 187) and utilized fewer clinical variables to generate the disease clusters (5).
While some variables are the same as those utilized in this paper (age of onset, BMI, gender, atopy,
symptom scores), variables related to pulmonary function and bronchodilator reversibility were limited
(only peak flow variability). Sputum eosinophil counts were utilized, however, which was not possible
in the larger SARP multicenter network.
While the clusters described by Haldar show overlap with the clusters described in this paper, there are
important differences. Both cluster analyses identify a group of older obese patients (mostly women)
with adult onset asthma and less atopy (Cluster 3) that comprise approximately 10% of severe asthma
patients. Both analyses report a group of severe asthma subjects with late onset asthma, less atopy and
decreased lung function, but the patients in Cluster 5 in this paper are characterized by elevated sputum
neutrophils and significant pulmonary function impairments. The Haldar analysis also describes two
severe asthma atopic clusters that are differentiated by level of sputum eosinophilia and symptoms. The
current analysis, however, reveals three atopic clusters (Clusters 1, 2, 4) that differ in baseline lung
function, response to bronchodilators, medication requirements, health care utilization and asthma
symptoms. Clusters 1, 2 and 4 represent a continuum of allergic phenotype across three levels of disease
severity with the most severe patients assigned to Cluster 4. The ability to identify this severe subset of
atopic asthma without assessment of sputum eosinophilia is a significant finding in the current analysis.
In conclusion, the five asthma clusters support the importance of disease heterogeneity in asthma and
suggest differences in pathophysiologic mechanisms that determine cluster assignments. In retrospective
and prospective population samples, the tree or algorithm can be used to evaluate the therapeutic
implications of these clusters. The apparent divergent phenotypic characteristics observed, especially in
Page 15 of 38
Moore 13
Clusters 3, 4 and 5, suggest different pathophysiologic processes that may determine therapeutic
responses and thus, affect asthma control.
An important question is how well this cluster approach can be applied to clinical settings. Algorithms
have been used successfully for the differential diagnoses of asthma in research studies (46, 47), but
have not been applied to different levels of asthma severity. In the current study, we developed an
algorithm to assign subjects to asthma severity clusters using readily available clinical testing; the pre-
and post-bronchodilator FEV1 and an assessment of age of onset. This algorithm was successful in 80%
of subjects. Future studies are needed to evaluate our ability to use this cluster analysis in a prospective
manner to classify disease severity and improve asthma control by personalizing asthma management
and identifying individuals at risk for adverse outcomes.
Page 16 of 38

Moore 14
Acknowledgements
The investigators would like to thank Patricia Noel, PhD at the National, Heart, Lung and Blood
Institute who has guided the Severe Asthma Research Program from the very beginning.
Page 17 of 38
Moore 15
References
1. National Asthma Education and Prevention Program. Expert Panel Report 3: Guidelines for the
diagnosis and management of asthma. Bethesda, MD: National Institutes of Health; National Heart,
Lung, and Blood Institute; 2007:No. 07-4051. Available at
http://www.nhlbi.nih.gov/guidelines/asthma, accessed on June 8, 2009.
2. Global Initiative for Asthma: Global Strategy for Asthma Management and Prevention (GINA).
National Institutes of Health; National Heart, Lung, and Blood Institute; Updated 2008. Available at
http://www.ginasthma.org, accessed on June 8, 2009.
3. Miller MK, Johnson C, Miller DP, Deniz Y, Bleecker ER, Wenzel SE for the TENOR Study Group.
Severity assessment in asthma: An evolving concept. J Allergy Clin Immunol 2005;116:990-995.
4. Wenzel SE. Asthma: defining of the persistent adult phenotypes. Lancet 2006;368:804-813.
5. Haldar P, Pavord ID, Shaw DE, Berry MA, Thomas M, Brightling CE, Wardlaw AJ, Green RH.
Cluster analysis and clinical asthma phenotypes. Am J Respir Crit Care Med 2008;178:218-224.
6. Kiley J, Smith R, Noel P. Asthma phenotypes. Current Opinion in Pulmonary Medicine
2007:13:19–23
7. Wenzel SE. Severe asthma in adults. Am J Respir Crit Care Med 2005; 172:149-160.
8. Busse WW, Banks-Schlegel S, Wenzel SE. Pathophysiology of severe asthma. J Allergy Clin
Immunol 2000;106:1033-1042.
9. Moore WC, Peters SP. Severe asthma: An Overview. J Allergy Clin Immunol 2006;117:487-94.
Page 18 of 38
Moore 16
10. Proceedings of the ATS workshop on refractory asthma: current understanding, recommendations,
and unanswered questions. American Thoracic Society. Am J Respir Crit Care Med 2000;162:2341-
2351.
11. Moore, WC, Bleecker ER, MD, Curran-Everett D, Erzurum SC, Ameredes BT, Bacharier L,
Calhoun WJ, Castro M, Chung KF, Clark MP, Dweik RA, Fitzpatrick AM, Gaston B, Hew M,
Hussain I, Jarjour NN, Israel E, Levy BD, Murphy JR, Peters SP, Teague WG, Meyers DA, Busse
WW, Wenzel SE for the National Heart, Lung, and Blood Institute’s Severe Asthma Research
Program. J Allergy Clin Immunol 2007;119:405-13.
12. Moore WC, Meyers DA, Li H, D’Agostino R, Peters SP, Bleecker ER for the NHLBI Severe
Asthma Research Program (SARP). Identification of asthma phenotypes using cluster analysis in
the Severe Asthma Research Program. Am J Resp Crit Care Med 2009;179:A2522.
13. Comhair SA, Ricci KS, Arroliga M, Lara AR, Dweik RA, Song W, Hazen SL, Bleecker ER, Busse
WW, Chung KF, Gaston B, Hastie A, Hew M, Jarjour N, Moore W, Peters S, Teague WG, Wenzel
SE, Erzurum SC. Correlation of systemic superoxide dismutase deficiency to airflow obstruction in
asthma. Am J Respir Crit Care Med. 2005; 172:306-13
14. Fitzpatrick AM, Gaston BM, Erzurum SC, Teague WG for the National Institutes of Health/National
Heart, Lung, and Blood Institute Severe Asthma Research Program. Features of severe asthma in
school age children: atopy and increased exhaled nitric oxide. J Allergy Clin Immunol
2006;118:1218-25.
15. Wenzel SE, Balzar S, Ampleford EJ, Hawkins GA, Busse WW, Calhoun WJ, Castro M, Chung KF,
Erzurum S, Gaston B, Israel E, Teague EG, Meyers DA, Bleecker ER. Il-4Rα Mutations are
associated with Asthma Exacerbations, Airway Obstruction, Tissue Mast Cells/IgE Expression and
Racial Background. Amer J Resp Crit Care Med 2007;175:570-576.
16. Lara AR, Khatri SB, Wang Z, Comhair SA, Xu W, Dweik RA, Bodine M, Levison BS, Hammel J,
Bleecker ER, Busse WW, Calhoun WJ, Castro M, Chung KF, Curran-Everett D, Gaston B, Israel E,
Page 19 of 38
Moore 17
Jarjour N, Moore WC, Peters S, Teague WG, Wenzel SE, Hazen SL, Erzurum SC for the the
National Heart, Lung, and Blood Institute’s Severe Asthma Research Program. Alterations of the
arginine metabolome in asthma. Am J Respir Crit Care Med 2008;178:673-681.
17. Sorkness RL, Bleecker ER, Busse W, Calhoun WJ, Castor M, Chung KF, Curran-Everett D,
Erzurum SC, Gaston BM, Israel E, Jarjour NN, Moore WC, Peters SP, Teague WG, Wenzel SE for
the National Heart, Lung, Blood Institute Severe Asthma Research Program. Lung function in
adults with stable but severe asthma: air trapping and incomplete reversal of obstruction with
bronchodilation. J Appl Physiol 2008;104:394-403.
18. Brasier AR, Victor S, Boetticher GD, Ju H, Lee C, Bleecker ER, Castro M, Busse WW, Calhoun
WJ. Molecular phenotyping of severe asthma suing pattern recognition of bronchoalveolar lavage-
derived cytokines. J Allergy Clin Immunol 2008;121:30-37.
19. Aysola RS, Hoffman EA, Gierada D, Wenzel S, Cook-Granroth J, Tarsi J, Zheng J, Schechtman KB,
Ramkumar TP, Cochran R, Xueping E, Christie C, Newell J, Fain S, Altes TA, Castro M. Airway
remodeling measured by multidetector CT is increased in severe asthma and correlates with
pathology. Chest. 2008; 134(6):1183-91.
20. Busacker A, Newell JD Jr, Keefe T, Hoffman EA, Granroth JC, Castro M, Fain S, Wenzel S. A
multivariate analysis of risk factors for the air-trapping asthmatic phenotype as measured by
quantitative CT analysis. Chest. 2009;135(1):48-56.
21. Breiman L, Friedman J, Stone C, Olshen RA. Classification and Regression Trees; Chapman & Hall,
New York; 1984.
22. Bacharier LB, Strunk RC, Mauger D, White D, Lemanske RF, Sorkness CA. Classifying asthma
severity in children: mismatch between symptoms, medication use and lung function. Am J Respir
Crit Care Med 2004;170(4):426-432.
23. Gelfand EW. Pediatric asthma: a different disease. Proc Am Thorac Soc 2009; 6:278–282.
Page 20 of 38
Moore 18
24. Bateman ED, Boushey HA, Bousquet J, Busse WW, Clark TJ, Pauwels RA, Pedersen SE; GOAL
Investigators Group. Can guideline-defined asthma control be achieved? The Gaining Optimal
Asthma ControL study. Am J Respir Crit Care Med. 2004; 170:836-44.
25. Panhuysen CIM, Vonk JM, Koeter GH, Schouten JP, Bleecker ER, Postma DS. Adult patients may
outgrow their asthma. A 25 year follow-up study. Am J Respir Crit Care Med 1997; 155:1267-72.
26. Jenkins HA, Cherniack R, Szefler SJ, Covar R, Gelfand EW, Spahn JD. A comparison of the
clinical characteristics of children and adults with severe asthma. Chest 2003;124:1318-1324.
27. ten Brinke A, Zwinderman AH, Sterk PJ, Rabe KF, Bel EH. Factors associated with persistent
airflow limitation in severe asthma. Am J Respir Crit Care Med 2001;164:744-748.
28. Miranda C, Busacker A, Balzar S, Trudeau J, Wenzel SE. Distinguishing severe asthma phenotypes:
Role of age of onset and eosinophilic inflammation. J Allergy Clin Immunol 2004;113:101-108.
29. Wenzel SE, Schwartz LB, Langmack EL, Halliday JL, Trudeau J, Gibbs RL, Chu HW. Evidence
that severe asthma can be divided pathologically into two inflammatory subtypes with distinct
physiologic and clinical characteristics. Am J Respir Crit Care Med 1999;160:1001-1008.
30. Green RH, Brightling CE, McKenna S, Hargadon B, Parker D, Bradding P, Wardlaw AJ, Pavord ID.
Asthma exacerbations and sputum eosinophil counts: a randomized controlled trial. Lancet
2002;360:1715-1721.
31. Smith AD, Cowan JO, Brassett KP, Herbison GP, Taylor DR. Use of exhaled nitric oxide
measurements to guide treatment in chronic asthma. N Engl J Med. 2005; 352(21):2163-73.
32. Shaw DE, Berry MA, Thomas M, Green RH, Brightling CE, Wardlaw AJ, Pavord ID. The use of
exhaled nitric oxide to guide asthma management: a randomized controlled trial. Am J Respir Crit
Care Med 2007;176:231-237.
Page 21 of 38
Moore 19
33. Wedes S, Khatri S, Zhang R, W W, Comhair SAA, Wenzel SE, Teague WG, Israel E, Erzurum SC,
Hazen SL. Noninvasive markers of airway inflammation in asthma. Clinical Translational Science
2009;2:112-117.
34. Fuhlbrigge AL, Kitch BT, Paltiel AD, Kuntz KM, Neumann PJ, Dockery DW, Weiss ST. FEV(1) is
associated with risk of asthma attacks in a pediatric population. J Allergy Clin Immunol. 2001;
107(1):61-7.
35. Green RH, Brightling CE, Woltmann G, Parker D, Wardlaw AJ, Pavord ID. Analysis of induced
sputum in adults with asthma: identification of a subgroup with isolated sputum neutrophilia and
poor response to inhaled corticosteroids. Thorax 2002; 57:875-9.
36. Bumbacea D, Campbell D, Nguyen L, Carr D, Barnes PJ, Robinson D, Chung KF. Parameters
associated with persistent airflow obstruction in chronic severe asthma. Eur Respir J 2004;24:122-
128.
37. Beuther DA, Sutherland ER. Overweight, obesity and incident asthma: a meta-analysis of
prospective epidemiologic studies. Am J Resp Crit Care Med 2007;175:661-6.
38. Shore SA. Obesity and asthma: possible mechanisms. J Allergy Clin Immunol. 2008;121:1087-93.
39. Mosen DM, Schatz M, Magid DJ, Camargo CA. The relationship between obesity and asthma
severity and control in adults. J Allergy Clin Immunol. 2008;122:507-511.
40. Sutherland TJT, Cowan JO, Taylor DR. Dynamic Hyperinflation with bronchoconstriction:
differences between obese and nonobese women with asthma. Am J Respir Crit Care Med
2008;177:970-975.
Page 22 of 38
Moore 20
41. Calverley P, Anderson JA, Celli B, Ferguson GT, Jenkins C, Jones PW, Yates JC, Vestbo J for the
TORCH investigators. Salmeterol and fluticasone propionate and survival in Chronic Obstructive
Pulmonary Disease. N Engl J Med 2007;356:775-789.
42. Sutherland TJT, Cowan JO, Young S, Goulding A, Grant AM, Williamson A, Brassett K, Herbison
GP, Taylor DR. The association between obesity and asthma: interactions between systemic and
airway inflammation. Am J Respir Crit Care Med 2008;178:469-475.
43. Rosi E, Ronchi MC, Grazzini M, Duranti R, Scano G. Sputum analysis, bronchial
hyperresponsiveness, and airway function in asthma: results of a factor analysis. J Allergy Clin
Ummunol 1999;103:232-237
44. Pillai SG, Tang Y, van den Oord E, Klotsman M, Barnes K, Carlsen K, Gerritsen J, Lenney W,
Silverman M, Sly P, Sundy J, Tsanakas J, von Berg A, Whyte M, Ortega HG, Anderson WH, Helms
PJ. Factor analysis in the Genetics of Asthma International Network family study identifies five
major quantitative asthma phenotypes. Clin Exp Allergy. 2008 Mar;38(3):421-9.
45. Weatherall M, Travers J, Shirtcliffe PM, Marsh SE, Williams MV, Nowitz MR, Aldington S,
Beasley R. Distinct clinical phenotypes of airways disease defined by cluster analysis. Eur Respir J
ERJ Express. Published on April 8, 2009 as doi: 10.1183/09031936.00174408
46. Panhuysen CIM, Bleecker ER, Koeter GH, Meyers DA, Postma DS. Characterization of obstructive
airways disease in family members of probands with asthma: An algorithm for the diagnosis of
asthma. Am J Respir Crit Care Med 1998; 157:1734-1742.
47. Celedon JC, Silverman EK, Weiss ST, Wand B, Fang Z, Xu X. Application of an algorithm for the
diagnosis of asthma in Chinese families. Am J Respir Crit Care Med 2000;162:1679-1684.
Page 23 of 38
Moore 21
Figure legends
FIGURE 1. Tree Analysis. Using three variables (1) Baseline FEV1 (with a bronchodilator withhold),
(2) Maximal “Max” FEV1 (after 6-8 puffs of albuterol) and (3) age of onset of asthma, subjects can be
assigned to the five clusters that range from milder asthma (Cluster 1) to more severe disease (Clusters 4
and 5)
FIGURE 2. Tree Performance. Using the algorithm generated by the tree analysis, 80% of subjects are
assigned to the correct cluster of asthma severity. Colors are maintained from the tree diagram with blue
= mild atopic asthma, green = mild-moderate atopic asthma, yellow = late onset nonatopic asthma,
orange = severe atopic asthma, red = severe asthma with fixed airflow. Individual figure size is
proportional to the frequency of a specific cluster. The % of subjects from that cluster that are correctly
assigned is indicated numerically within the shape.
Page 24 of 38
Moore 22
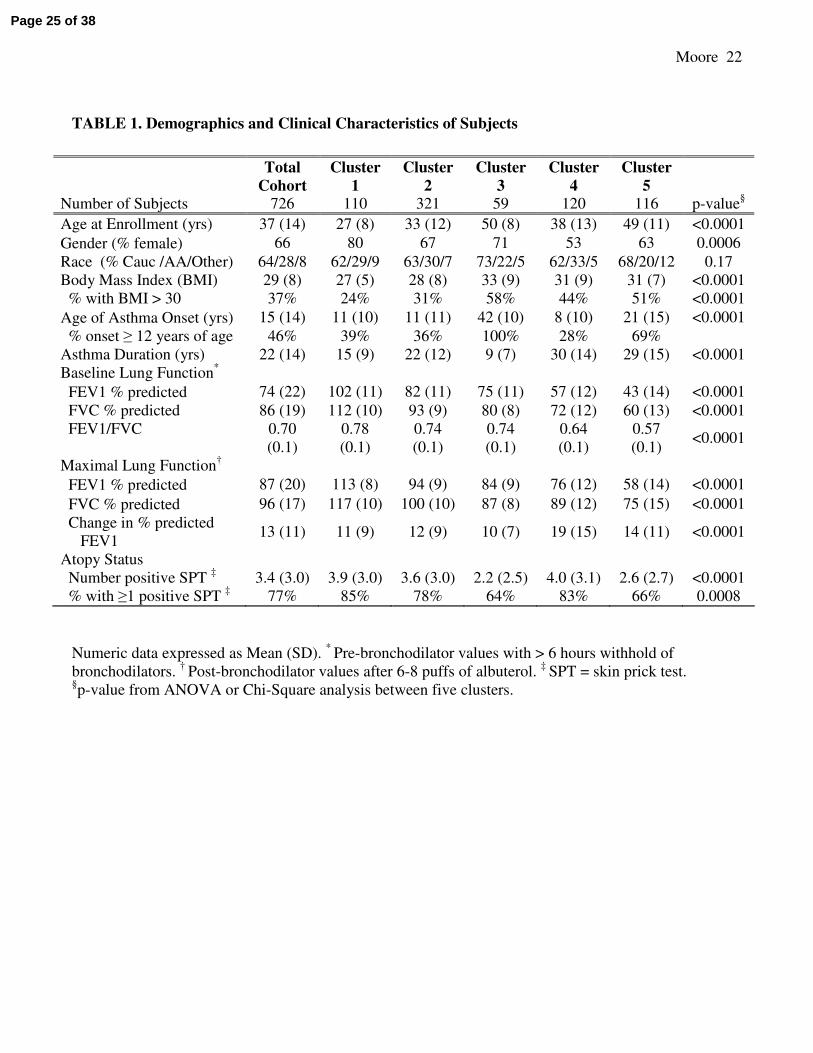
TABLE 1. Demographics and Clinical Characteristics of Subjects
Numeric data expressed as Mean (SD). * Pre-bronchodilator values with > 6 hours withhold of
bronchodilators. †
Post-bronchodilator values after 6-8 puffs of albuterol. ‡
SPT = skin prick test. §p-value from ANOVA or Chi-Square analysis between five clusters.
Total
Cohort
Cluster
1
Cluster
2
Cluster
3
Cluster
4
Cluster
5
Number of Subjects 726 110 321 59 120 116 p-value§
Age at Enrollment (yrs) 37 (14) 27 (8) 33 (12) 50 (8) 38 (13) 49 (11) <0.0001
Gender (% female) 66 80 67 71 53 63 0.0006
Race (% Cauc /AA/Other) 64/28/8 62/29/9 63/30/7 73/22/5 62/33/5 68/20/12 0.17
Body Mass Index (BMI) 29 (8) 27 (5) 28 (8) 33 (9) 31 (9) 31 (7) <0.0001
% with BMI > 30 37% 24% 31% 58% 44% 51% <0.0001
Age of Asthma Onset (yrs) 15 (14) 11 (10) 11 (11) 42 (10) 8 (10) 21 (15) <0.0001
% onset ≥ 12 years of age 46% 39% 36% 100% 28% 69%
Asthma Duration (yrs) 22 (14) 15 (9) 22 (12) 9 (7) 30 (14) 29 (15) <0.0001
Baseline Lung Function*
FEV1 % predicted 74 (22) 102 (11) 82 (11) 75 (11) 57 (12) 43 (14) <0.0001
FVC % predicted 86 (19) 112 (10) 93 (9) 80 (8) 72 (12) 60 (13) <0.0001
FEV1/FVC 0.70
(0.1)
0.78
(0.1)
0.74
(0.1)
0.74
(0.1)
0.64
(0.1)
0.57
(0.1) <0.0001
Maximal Lung Function†
FEV1 % predicted 87 (20) 113 (8) 94 (9) 84 (9) 76 (12) 58 (14) <0.0001
FVC % predicted 96 (17) 117 (10) 100 (10) 87 (8) 89 (12) 75 (15) <0.0001
Change in % predicted
FEV1 13 (11) 11 (9) 12 (9) 10 (7) 19 (15) 14 (11) <0.0001
Atopy Status
Number positive SPT ‡ 3.4 (3.0) 3.9 (3.0) 3.6 (3.0) 2.2 (2.5) 4.0 (3.1) 2.6 (2.7) <0.0001
% with ≥1 positive SPT ‡ 77% 85% 78% 64% 83% 66% 0.0008
Page 25 of 38
Moore 23
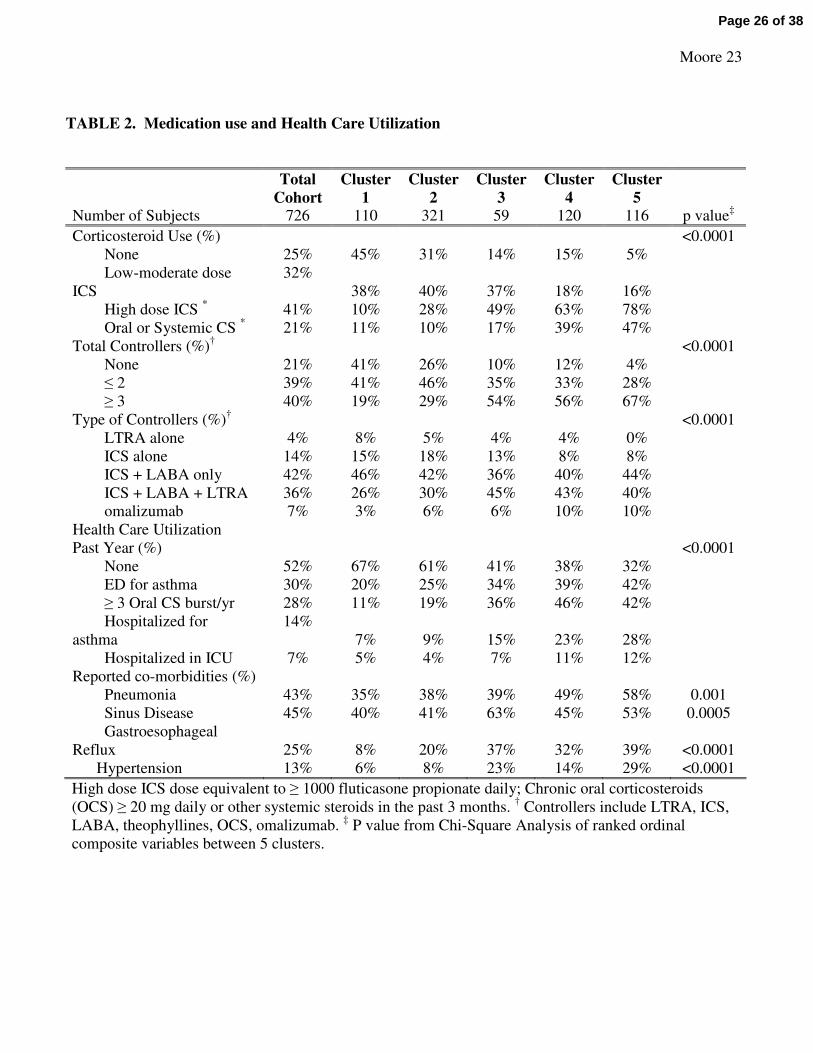
TABLE 2. Medication use and Health Care Utilization
High dose ICS dose equivalent to ≥ 1000 fluticasone propionate daily; Chronic oral corticosteroids
(OCS) ≥ 20 mg daily or other systemic steroids in the past 3 months. † Controllers include LTRA, ICS,
LABA, theophyllines, OCS, omalizumab. ‡ P value from Chi-Square Analysis of ranked ordinal
composite variables between 5 clusters.
Total
Cohort
Cluster
1
Cluster
2
Cluster
3
Cluster
4
Cluster
5
Number of Subjects 726 110 321 59 120 116 p value‡
Corticosteroid Use (%) <0.0001
None 25% 45% 31% 14% 15% 5%
Low-moderate dose
ICS
32%
38% 40% 37% 18% 16%
High dose ICS * 41% 10% 28% 49% 63% 78%
Oral or Systemic CS * 21% 11% 10% 17% 39% 47%
Total Controllers (%)† <0.0001
None 21% 41% 26% 10% 12% 4%
≤ 2 39% 41% 46% 35% 33% 28%
≥ 3 40% 19% 29% 54% 56% 67%
Type of Controllers (%)† <0.0001
LTRA alone 4% 8% 5% 4% 4% 0%
ICS alone 14% 15% 18% 13% 8% 8%
ICS + LABA only 42% 46% 42% 36% 40% 44%
ICS + LABA + LTRA 36% 26% 30% 45% 43% 40%
omalizumab 7% 3% 6% 6% 10% 10%
Health Care Utilization
Past Year (%)
<0.0001
None 52% 67% 61% 41% 38% 32%
ED for asthma 30% 20% 25% 34% 39% 42%
≥ 3 Oral CS burst/yr 28% 11% 19% 36% 46% 42%
Hospitalized for
asthma
14%
7% 9% 15% 23% 28%
Hospitalized in ICU 7% 5% 4% 7% 11% 12%
Reported co-morbidities (%)
Pneumonia 43% 35% 38% 39% 49% 58% 0.001
Sinus Disease 45% 40% 41% 63% 45% 53% 0.0005
Gastroesophageal
Reflux 25% 8% 20% 37% 32% 39% <0.0001
Hypertension 13% 6% 8% 23% 14% 29% <0.0001
Page 26 of 38
Moore 24
TABLE 3. Biomarkers in Subset of Subjects
Cluster 1 Cluster 2 Cluster 3 Cluster 4 Cluster 5
Number of Subjects n n n n n p value
PC20 methacholine*,
mg/ml 100
1.17
(0.73) 268
1.12
(0.67) 39
2.32
(0.60) 64
0.73
(0.71) 15
0.72
(0.86) 0.007
FENO* (ppb)
90
32.8
(0.36) 257
28.0
(0.37) 47
24.8
(0.36) 93
26.8
(0.37) 84
29.3
(0.41) 0.40
Blood/Serum
Total IgE*, IU/ml 91 141 (0.71) 257 125 (0.71) 47 54 (0.82) 90 132 (0.65) 87 98 (0.62) 0.008
% Eosinophils* 96 0.2 (0.42) 272 0.2 (0.5) 51 0.2 (0.42) 106 0.3 (0.46) 97 0.2 (0.6) 0.29
Sputum 63 160 30 60 44
% Eosinophils †
0.7
(0.2, 4.4)
0.7
(0.1, 3.7)
1.9
(0.0, 4.5)
1.5
(0.3, 7.9)
1.2
(0.0, 10.1) 0.05
% Neutrophils †
23.3
(7.4, 42.9)
33.0
(15.7,
51.7)
37.6
(12.7,
66.4)
34.7
(15.2,
65.7)
48.3
(25.7,
80.3)
0.001
Data expressed as * Geometric Mean (log 10 SD) or
† Median (IQR). Subjects with FEV1 < 55% predicted pre-testing were excluded
from methacholine challenge and sputum induction.
Page 27 of 38
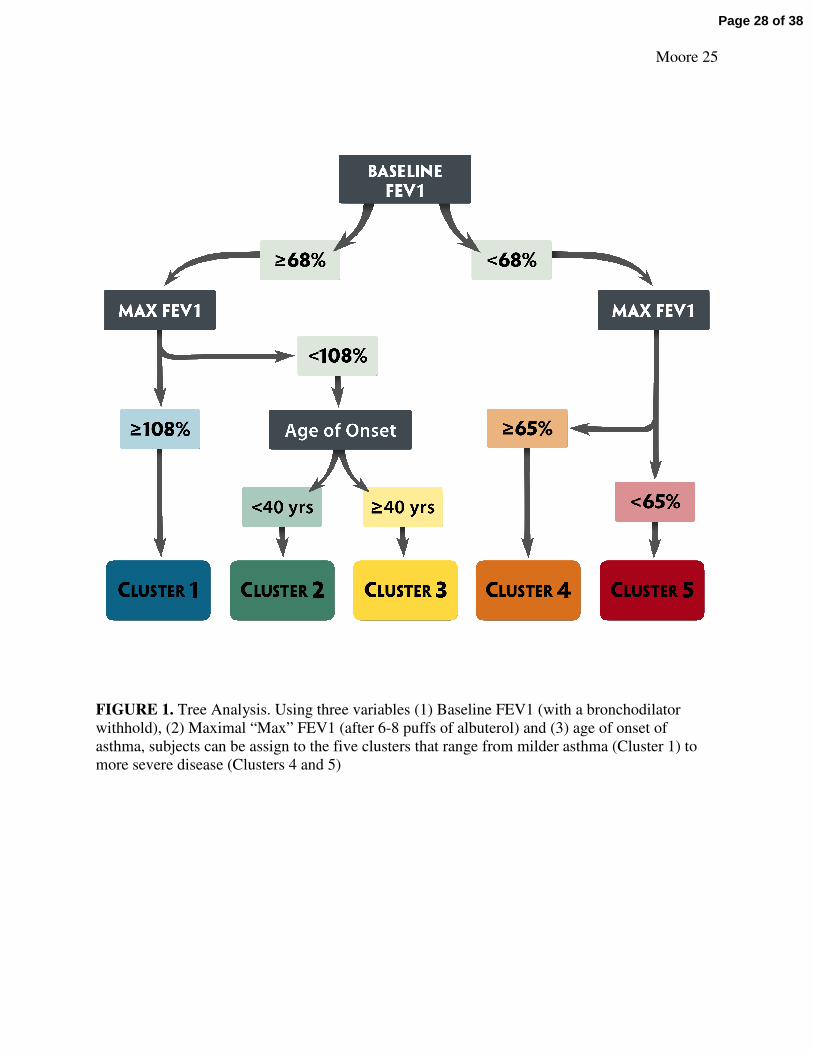
Moore 25
FIGURE 1. Tree Analysis. Using three variables (1) Baseline FEV1 (with a bronchodilator
withhold), (2) Maximal “Max” FEV1 (after 6-8 puffs of albuterol) and (3) age of onset of
asthma, subjects can be assign to the five clusters that range from milder asthma (Cluster 1) to
more severe disease (Clusters 4 and 5)
Page 28 of 38
Moore 26
FIGURE 2. Tree Performance. Using the algorithm generated by the tree analysis, 80% of
subjects are assigned to the correct cluster of asthma severity. Colors are maintained from the
tree diagram with blue = mild atopic asthma, green = mild-moderate atopic asthma, yellow = late
onset nonatopic asthma, orange = severe atopic asthma, red = severe asthma with fixed airflow.
Individual figure size is proportional to the frequency of a specific cluster. The % of subjects
from that cluster that are correctly assigned is indicated within the shape.
Page 29 of 38
Moore online supp 1
Online Data Supplement
Identification of Asthma Phenotypes using Cluster Analysis in the Severe
Asthma Research Program
Wendy C. Moore, MD, Deborah A. Meyers, PhD, Sally E. Wenzel, MD, W. Gerald Teague, MD,
Huashi Li, MS, Xingnan Li, PhD, MS, Ralph D’Agostino, Jr., PhD, Mario Castro, MD, Douglas
Curran-Everett, PhD, Anne M. Fitzpatrick, PhD, Benjamin Gaston, MD, Nizar N. Jarjour, MD,
Ronald Sorkness, PhD, William J. Calhoun, MD, Kian Fan Chung, MD, Suzy A.A. Comhair, PhD,
Raed A. Dweik, MD, Elliot Israel, MD, Stephen P. Peters, MD, PhD, William W. Busse, MD, Serpil
C. Erzurum, MD, Eugene R. Bleecker, MD for the National Heart Lung Blood Institute’s Severe
Asthma Research Program.
Page 30 of 38
Moore online supp 2
FIGURE E1.
FIGURE E1. Reduction of the original 628 variables in the SARP database. *Numbers correspond
to variable numbers in Table E2. The 17 composite variables from the questionnaire data incorporate
answers from 63 individual questions. The 34 final variables in the cluster analysis include 23
variables from the questionnaire data, 6 related to lung function and 5 markers of atopy. Following
the cluster analysis, stepwise discriminant analysis identified 11 significant predictors of cluster
assignment. Three of these variables (Baseline and Maximal FEV1 % predicted, age of disease
onset) were used in the Tree analysis.
Page 31 of 38
Moore online supp 3
TABLE E1. Generation of a Composite Variable: “Frequency/Severity of HCU in Past year”.
Rank†
Weight‡
of Rank Questions
* n
Severe
Asthma§
Chronic
Oral
Steroids
FEV1%
pred
Maximum
FEV%
0 0 None reported 431 22% 2% 81% 92%
1 2 ≥ 1 urgent visit/yr 70 40% 4% 78% 89%
2 4 ED past year 83 42% 5% 77% 88%
3 6 ≥ 3 OCS burst/yr 132 73% 32% 67% 80%
4 8 Hospitalization past year 81 88% 36% 65% 81%
5 10 ICU past year 59 93% 42% 66% 84%
n=856 for this table (composites were developed prior to excluding children < 12 years of age from
the analysis). *Questions used to generate the composite variable are from two separate forms. †Subjects receive the highest rank based on their answers (i.e. each subject appears only once).
‡Weight of ranks within a composite variable are on a scale of 0-10 (each subject gets the weight
assigned to their rank). Five variables are now one variable “Frequency/Severity of HCU in Past
year” and each subject has a score.
The four columns on the right verify that the composite variable effectively discriminates severity of
health care utilization based on disease severity§, need for oral corticosteroids and lung function.
§Severe asthma as defined by the ATS workshop on severe asthma (11).
Page 32 of 38
Moore online supp 4
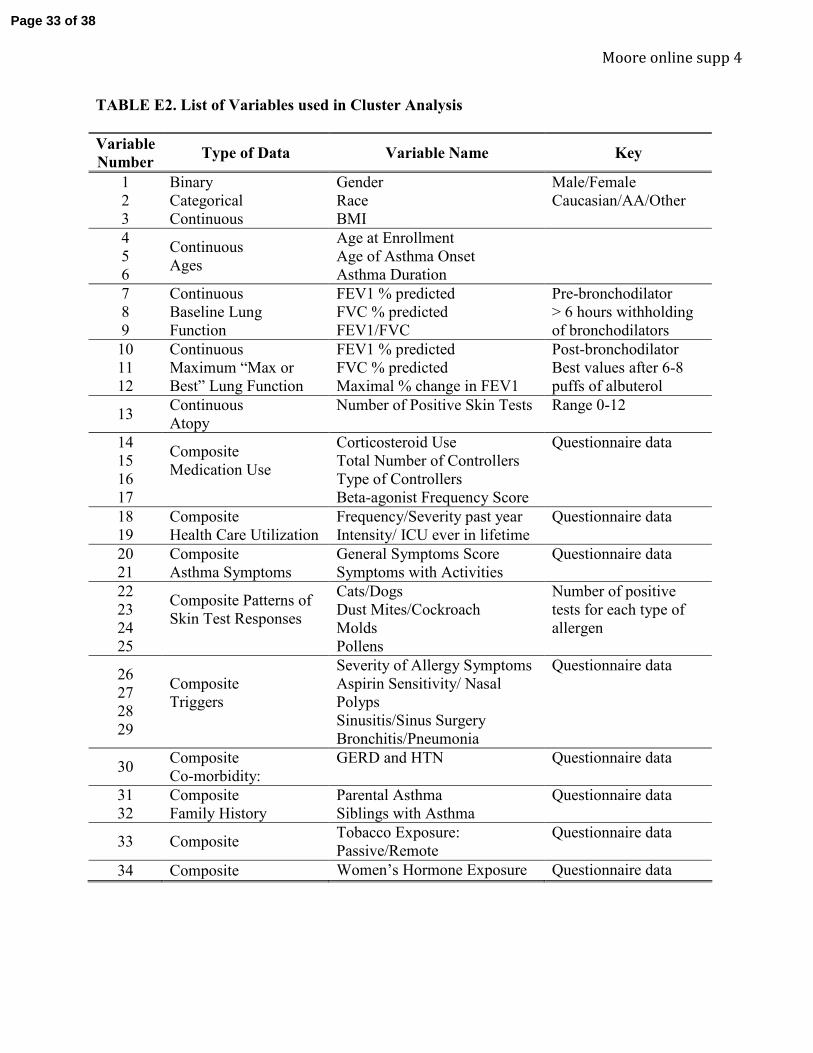
TABLE E2. List of Variables used in Cluster Analysis
Variable
Number Type of Data Variable Name Key
1 Binary Gender Male/Female
2 Categorical Race Caucasian/AA/Other
3 Continuous BMI
4
5
6
Continuous
Ages
Age at Enrollment
Age of Asthma Onset
Asthma Duration
7
8
9
Continuous
Baseline Lung
Function
FEV1 % predicted
FVC % predicted
FEV1/FVC
Pre-bronchodilator
> 6 hours withholding
of bronchodilators
10
11
12
Continuous
Maximum “Max or
Best” Lung Function
FEV1 % predicted
FVC % predicted
Maximal % change in FEV1
Post-bronchodilator
Best values after 6-8
puffs of albuterol
13 Continuous
Atopy
Number of Positive Skin Tests Range 0-12
14
15
16
17
Composite
Medication Use
Corticosteroid Use
Total Number of Controllers
Type of Controllers
Beta-agonist Frequency Score
Questionnaire data
18
19
Composite
Health Care Utilization
Frequency/Severity past year
Intensity/ ICU ever in lifetime
Questionnaire data
20
21
Composite
Asthma Symptoms
General Symptoms Score
Symptoms with Activities
Questionnaire data
22
23
24
25
Composite Patterns of
Skin Test Responses
Cats/Dogs
Dust Mites/Cockroach
Molds
Pollens
Number of positive
tests for each type of
allergen
26
27
28
29
Composite
Triggers
Severity of Allergy Symptoms
Aspirin Sensitivity/ Nasal
Polyps
Sinusitis/Sinus Surgery
Bronchitis/Pneumonia
Questionnaire data
30 Composite
Co-morbidity:
GERD and HTN Questionnaire data
31
32
Composite
Family History
Parental Asthma
Siblings with Asthma
Questionnaire data
33 Composite Tobacco Exposure:
Passive/Remote
Questionnaire data
34 Composite Women’s Hormone Exposure Questionnaire data
Page 33 of 38
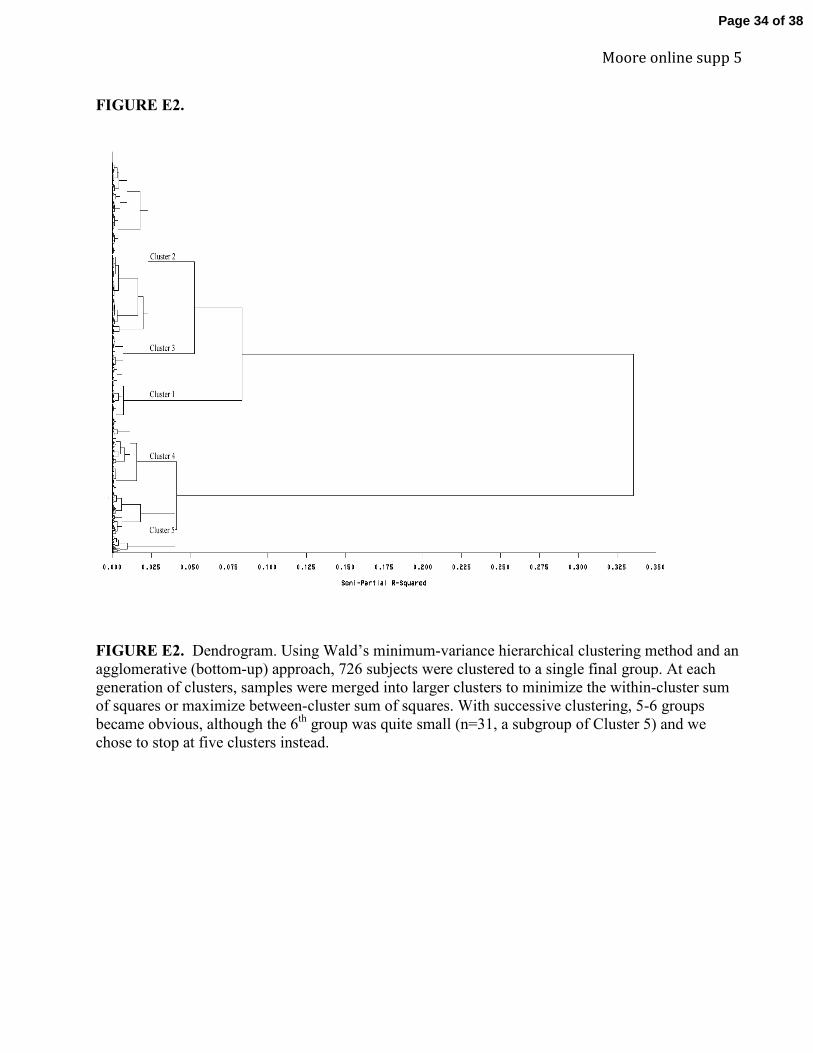
Moore online supp 5
FIGURE E2.
FIGURE E2. Dendrogram. Using Wald’s minimum-variance hierarchical clustering method and an
agglomerative (bottom-up) approach, 726 subjects were clustered to a single final group. At each
generation of clusters, samples were merged into larger clusters to minimize the within-cluster sum
of squares or maximize between-cluster sum of squares. With successive clustering, 5-6 groups
became obvious, although the 6th
group was quite small (n=31, a subgroup of Cluster 5) and we
chose to stop at five clusters instead.
Page 34 of 38
Moore online supp 6
TABLE E3. Demographics and Clinical Characteristics of Subjects Classified by Severity*
Mild Moderate Severe
Number of Subjects 260 157 304 P-value
Age at Enrollment (yrs) 31 (12) 38 (12) 41 (15) <0.0001
Gender (% female) 73% 61% 63% 0.0080
Race (% Cauc /AA/Other) 67/27/6 61/30/9 62/29/9 0.52
Body Mass Index > 30 (BMI) 26% 39% 47% <0.0001
Age of Asthma Onset (yrs) 13 (13) 15 (14) 16 (16) 0.65
Asthma Duration (yrs) 18 (12) 23 (14) 25 (14) <0.0001
Baseline Lung Function†
FEV1 % predicted 94 (11) 66 (13) 62 (21) <0.0001
FVC % predicted 100 (12) 81 (15) 77 (20) <0.0001
FEV1/FVC 0.79 (0.07) 0.67 (0.10) 0.65 (0.13) <0.0001
Maximal Lung Function††
FEV1 % predicted 103 (10) 82 (13) 77 (21) <0.0001
FVC % predicted 104 (12) 92 (15) 90 (18) <0.0001
% change in FEV1 10 (8) 19 (18) 21 (21) <0.0001
PC20 Methacholine,§ mg/ml 1.51 (0.65) 0.85 (0.65) 0.79 (0.77) 0.0002
FENO,§ ppb 28 (0.37) 30 (0.35) 27 (0.39) 0.60
Atopy Status
Total IgE,§ IU/ml 110 (0.72) 120 (0.62) 120 (0.75) 0.83
% with ≥ 1 positive test 83% 86% 67% <0.0001
Asthma Medications
LTRA 21% 22% 53% <0.0001
ICS 55% 62% 98% <0.0001
LABA 44% 50% 89% <0.0001
OCS 3% 3% 48% <0.0001
Xolair 0% 0% 14% <0.0001
Numeric data expressed as Mean (SD) or §Geometric Mean (log 10 SD) * Severity defined by pre-
bronchodilator FEV1 and inhaled corticosteroid (ICS) use; Mild asthma = FEV1 ≥ 80% predicted on
no or low doses of ICS; Moderate asthma = FEV1 < 80% predicted on low to moderate doses of
ICS; Severe = Meets ATS workshop definition of severe asthma. †
Pre-bronchodilator values with > 6 hours withhold of bronchodilators. ††
Post-bronchodilator values after 6-8 puffs of albuterol.
Subjects with FEV1 < 55% predicted pre-testing were excluded from methacholine challenge.
Page 35 of 38
Moore online supp 7
TABLE E4. Geographic Distribution of Subjects in Clusters by Clinical Center
Cluster 1 Cluster 2 Cluster 3 Cluster 4 Cluster 5
Number of Subjects 110 321 59 120 116
Brigham & Women’s Hospital 3 37 4 12 17
Cleveland Clinic 9 20 5 6 5
Emory University 4 18 0 6 0
Imperial College, UK 7 27 9 23 25
University of Pittsburgh* 15 33 10 13 17
University of Virginia 6 10 1 2 0
Wake Forest University 37 132 25 34 37
University of Wisconsin 24 28 2 10 6
Washington University 5 16 3 14 8
* Includes subjects studied at National Jewish Hospital 8/2001 to 6/2006.
Page 36 of 38
Moore online supp 8
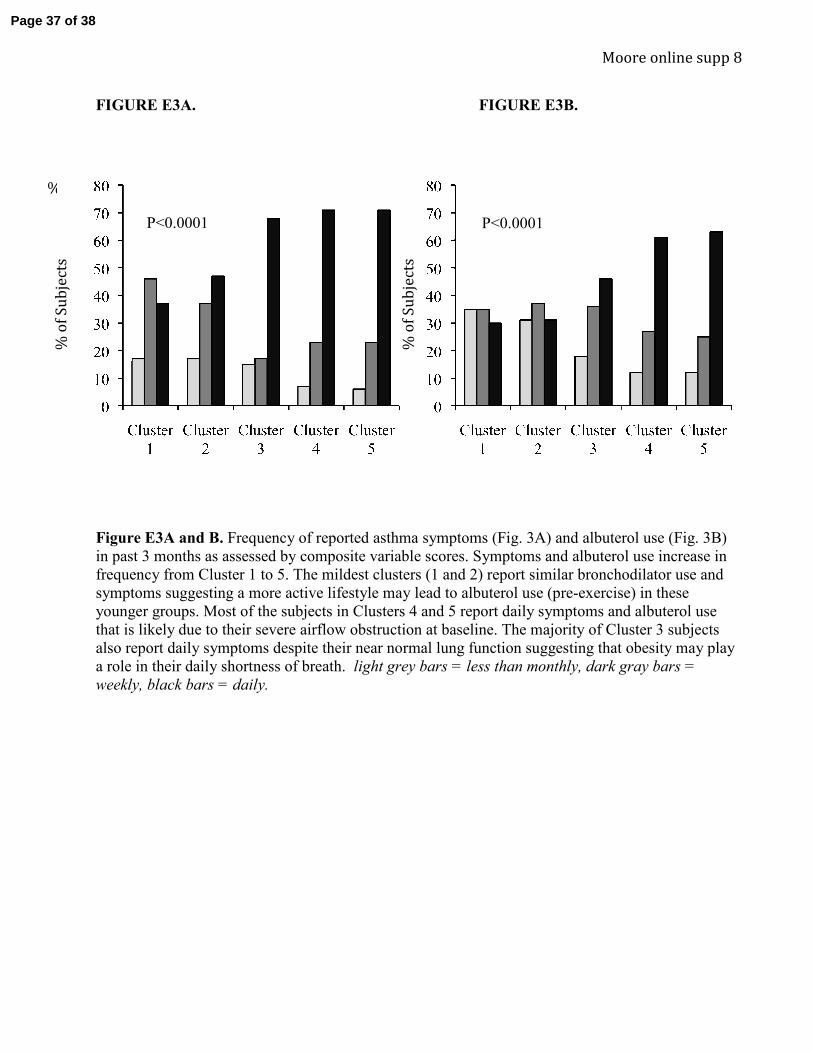
FIGURE E3A. FIGURE E3B.
Figure E3A and B. Frequency of reported asthma symptoms (Fig. 3A) and albuterol use (Fig. 3B)
in past 3 months as assessed by composite variable scores. Symptoms and albuterol use increase in
frequency from Cluster 1 to 5. The mildest clusters (1 and 2) report similar bronchodilator use and
symptoms suggesting a more active lifestyle may lead to albuterol use (pre-exercise) in these
younger groups. Most of the subjects in Clusters 4 and 5 report daily symptoms and albuterol use
that is likely due to their severe airflow obstruction at baseline. The majority of Cluster 3 subjects
also report daily symptoms despite their near normal lung function suggesting that obesity may play
a role in their daily shortness of breath. light grey bars = less than monthly, dark gray bars =
weekly, black bars = daily.
P<0.0001
%
% o
f S
ub
ject
s
% o
f S
ub
ject
s
P<0.0001
Page 37 of 38
Moore online supp 9
TABLE E5. Clinical Characteristics of Subjects in Cluster 6
Cluster 5 Cluster 6
Number of Subjects 85 31
Age at Enrollment (yrs) 52 (10) 42 (11)
Gender (% female) 62% 65%
Race (% Cauc /AA/Other) 69/18/13 65/26/10
Body Mass Index 31 (7) 32 (8)
Age of Asthma Onset (yrs) 23 (16) 15 (13)
Asthma Duration (yrs) 30 (16) 27 (12)
Baseline Lung Function†
FEV1 % predicted 43 (12) 45 (17)
FVC % predicted 59 (13) 62 (16)
FEV1/FVC 0.57 (0.11) 0.58 (0.13)
Maximal Lung Function††
FEV1 % predicted 55 (12) 65 (16)
FVC % predicted 72 (13) 85 (13)
Change in % predicted
FEV1 34 (29) 54 (40)
FENO, ppb 46 (46) 44 (43)
Total IgE, IU/ml 204 (269) 329 (625)
Numeric data expressed as Mean (SD) †
Pre-bronchodilator values with > 6 hours withhold of
bronchodilators. ††
Post-bronchodilator values after 6-8 puffs of albuterol.
Page 38 of 38