
Matthew Service Anthropogenic Pressures Anthropogenic Pressures.
Identification of anthropogenic and natural dust sources using
Moderate Resolution Imaging Spectroradiometer (MODIS)
Deep Blue level 2 data
Paul Ginoux,1 Dmitri Garbuzov,2 and N. Christina Hsu3
Received 1 May 2009; revised 21 October 2009; accepted 27 October 2009; published 9 March 2010.
[1] Mineral dust interacts with radiation and impacts both the regional and global climate.The relative contribution of natural and anthropogenic dust sources, however, remainslargely uncertain. Although human activities disturb soils and therefore enhance winderosion, their contribution to global dust emission has never been directly evaluated becauseof a lack of data. The retrieval of aerosol properties over land, including deserts, using theModerate Resolution Imaging Spectroradiometer Deep Blue algorithmmakes the first directcharacterization of the origin of individual sources possible. In order to separate freshlyemitted dust from other aerosol types and aged dust particles, the spectral dependence of thesingle scattering albedo and the Angstrom wavelength exponent are used. Four years of datafrom the eastern part of West Africa, which includes one of the most active natural dustsources and the highest population density on the continent, are processed. Sources areidentified on the basis of the persistence of significant aerosol optical depth from freshlyemitted dust, and the origin is characterized as natural or anthropogenic on the basis of a landuse data set. Our results indicate that although anthropogenic dust is observed less frequentlyand with lower optical depth than dust from natural sources in this particular region, itoccupies a large area covering most of northern Nigeria and southern Chad, around LakeChad. In addition, smaller anthropogenic sources are found as far south as 5� of latitudenorth, well outside the domain of most dust source inventories.
Citation: Ginoux, P., D. Garbuzov, and N. C. Hsu (2010), Identification of anthropogenic and natural dust sources using
Moderate Resolution Imaging Spectroradiometer (MODIS) Deep Blue level 2 data, J. Geophys. Res., 115, D05204,
doi:10.1029/2009JD012398.
1. Introduction
[2] Mineral dust affects the climate by absorbing andscattering solar and terrestrial radiation as well as bymodifying cloud properties [Forster et al., 2007]. Its longrange transport and deposition over open oceans alsoprovides a nutrient for phytoplankton blooming [Martin etal., 1991], which modulates carbon sequestration. It has alsobeen suggested that African dust is an essential nutrient forthe Amazon forest [Swap et al., 1992], which is a majorsink of CO2. The evaluation of these effects with climatemodels contains many uncertainties including characteriz-ing sources as natural or anthropogenic, which is vital asonly the anthropogenic component contributes to radiativeforcing on the climate [Forster et al., 2007]. Humanactivities that contribute to anthropogenic sources includeherding livestock, agriculture, mining, construction, off-road vehicles, and war [Zender et al., 2004].
[3] Most studies infer indirectly anthropogenic contribu-tion to dust loading by suggesting that it provides the bestexplanation for an observed increase of dust loading ordeposition or to reconcile discrepancy between models andobservations. Moulin and Chiapello [2006] have suggestedthat the observed increase of a factor of 2 of backgrounddust loads over the Atlantic since the mid-1960s can beattributed to human-induced soil degradation in Sahel,independent of any climatic phenomenon. Neff et al.[2008] have linked an increase of dust deposition in thewestern United States to expansion of livestock grazing inthe early twentieth century. In West Africa, comparingsimulated and observed aerosol indices (AIs) in the near-ultraviolet, Yoshioka et al. [2005] found that the bestcomparison at the Sahara-Sahel border is obtained by add-ing 20%–25% of dust from disturbed soils. Similar magni-tude was inferred by Mahowald et al. [2007] using visibilitydata from meteorological stations. Another difficulty toattribute dust from anthropogenic sources is that dustemission from roads, factories, or construction sites maybe fugitive and of relatively small scale. On the other hand,natural sources are relatively well characterized and havebeen inferred to be located preferentially in topographicdepression with bare and dry soils by Prospero et al. [2002]using satellite data. The use of preferential locations for
JOURNAL OF GEOPHYSICAL RESEARCH, VOL. 115, D05204, doi:10.1029/2009JD012398, 2010ClickHere
for
FullArticle
1Geophysical Fluid Dynamics Laboratory, NOAA, Princeton, NewJersey, USA.
2Department of Computer Sciences, Princeton University, Princeton,New Jersey, USA.
3NASA Goddard Space Flight Center, Greenbelt, Maryland, USA.
This paper is not subject to U.S. copyright.Published in 2010 by the American Geophysical Union.
D05204 1 of 10

modeling dust has yielded satisfactory simulations of dustdistribution when compared with observations [Ginoux etal., 2001; Tegen et al., 2002; Zender et al., 2003]. However,Mahowald and Luo [2003] have shown that due to thedistance between dust sources and observation as well asmodel uncertainties an anthropogenic contribution approach-ing 50% is within the range of uncertainty.[4] Satellite instruments provide near-daily global data
with retrieved information on aerosol properties which havebeen used to locate natural sources over arid and semiaridregions. Different methods have been proposed on the basisof the characteristics of the sensor bands (e.g., Legrand etal. [2001] or Schepanski et al. [2007] in the infrared orProspero et al. [2002] in the near-ultraviolet). However,these methods were not applied in temperate or tropicalareas with more obvious human activity because of thecomplexity of aerosol composition in those areas. In aridregions, extinction can be attributed primarily to mineraldust, but elsewhere sulfate, sea-salt, or carbonaceous aero-sols, which are not emitted from soils, absorb and scatterlight more efficiently. Detecting dust among other aerosols,however, relies on the retrieval of spectral optical properties.Another drawback of using a single wavelength aerosolproperty is the difficulty to distinguish freshly emitted dustfrom aged dust. This may be particularly true for slowmoving dust plumes observed [Bou Karam et al., 2008].Unfortunately, no satellite algorithm provided near-globaldaily distribution of aerosol properties at multiple wave-lengths at a spatial resolution sufficient to detect small scaleanthropogenic dust sources until recently.[5] Hsu et al. [2004] have developed an algorithm using
multiple radiances, including the 412 nm channel, measuredby the Moderate Resolution Imaging Spectroradiometer(MODIS). Their products include near-global daily opticaldepth (t), single scattering albedo (w), and Angstromwavelength exponent (a) at about 10 km resolution. Theseproducts are provided operationally at about 10 km and1� resolution for level 2 and 3 data sets, respectively.Knowing the typical spectral variation of dust optical prop-erties, it is finally possible with these satellite products toidentify dust sources. However, anthropogenic activities donot change the optical properties of dust, and additionalinformation is needed to distinguish between anthropogenicand natural sources.[6] In this paper, we combine land use data set and direct
satellite measurements to identify natural and anthropogenicdust sources. We select a domain to include a very intensenatural source and a country with high population density.In sections 3 and 4, we briefly describe the gridded level2 MODIS Deep Blue (MODIS DB) products and thedomain selection before presenting our methodology tolocate natural and anthropogenic dust sources and compar-ing with other studies. Then we attempt to quantify theimportance of anthropogenic sources relative to naturalsources, followed by a short evaluation of our method usingplots on GoogleEarthTM. Finally, we present our conclusions.
2. Level 2 MODIS DB Data
[7] The Deep Blue algorithm employs radiances from theblue channels of satellite instruments, at which wavelengthsthe surface reflectance is low enough that the presence of
dust brightens the total reflectance and enhances the spectralcontrast [Hsu et al., 2004]. The Deep Blue algorithm hasbeen applied operationally since April 2007 to the MODISinstrument on the Aqua platform. A detailed description ofthe algorithm is given by Hsu et al. [2004], and we presentonly a brief overview. After screening for clouds, thesurface reflectance for a given pixel is determined from aclear-scene database on the basis of its geolocation. Thereflectance at 412, 470, and 670 nm is compared with pre-calculated radiances at different viewing angles, surfacereflectance, t, and w [Hsu et al., 2006]. Then, a minimiza-tion procedure is applied to determine the mixing ratio ofvarious dust to smoke models that best fits the calculatedand observed spectral reflectance. For the particular mixingratio that produces the best match, the values of t and w at412, 550, and 670 nm, and a are reported. The pixel valuesare then averaged over 10 km cells and aggregate intogranules of approximately 1500 � 2000 cells, formingMODIS-Aqua collection 5.0 level 2 data. These data areavailable daily over bright surface (reflectance at 550 nmgreater than 0.15) and from August 2002 (with furtherbackward processing still continuing) to present. The 1�resolution gridded version constitutes MODIS-Aqua collec-tion 5.0 level 3. Since November 2008, the algorithmincludes updated characterization of surface bidirectionalreflectance distribution function (BRDF) and cloud screen-ing techniques. Although the reprocessed data are availablein collection 5.1, which provides better quality assurance forthe retrieved products, our study uses collection 5.0. As ourmethod does not depend on absolute values, the improve-ments introduced in collection 5.1 should not affect ourresults. Our scheme for the detection of dust sources isfacilitated by working with data on a regular latitude andlongitude grid (level 3 data) rather than on irregularlyspaced pixels along the orbit track (level 2 data). Adrawback of the existing level 3 data is that the 1� resolutionis too coarse to accurately detect small scale anthropogenicsources. Therefore, we have interpolated the level 2 data ona regular latitude � longitude grid with a 0.1� spacing. First,all pixels covering part of the domain are concatenated intoone daily file. Then, a linear interpolation is performed atevery fixed grid point by weighting the level 2 valuessurrounding a fixed grid point by the fraction of overlappingarea between the two grids. This method conserves thespatially integrated data. The algorithm is repeated for everyday from 1 January 2003 to 31 December 2006.
3. Domain Selection
[8] The domain is chosen to cover one of the most activeand well studied natural source, the Bodele depression inChad [Prospero et al., 2002; Washington et al., 2006; Toddet al., 2007], and the country with the highest populationdensity (�140 hab.km�2) in Africa, Nigeria, where inten-sive overgrazing by large cattle herds has been well docu-mented in the northern part of the country [Mortimore andAdams, 1999]. The domain extends from 0� to 20� longi-tude east and 5� to 20� latitude north and corresponds to theeastern part of West Africa. In West Africa, the activity ofdust sources depends on their position relative to theIntertropical Convergence Zone (ITCZ), which occupiesits southernmost position (about 5�N) in December and
D05204 GINOUX ET AL.: ANTHROPOGENIC AND NATURAL DUST SOURCES
2 of 10
D05204

northern most position (about 15�N) in July [Ginoux et al.,2001]. During the dry season in the Sahel (arid region ofWest Africa south of 20�N), from December to February,dust sources are very active while at the same time largeamount of carbonaceous aerosols are emitted by biomassburning. In summer, the area south of the ITCZ receivesabundant precipitation, which shuts down biomass burningand dust emission. During this season, there is no aerosolretrieval from MODIS data due to clouds. Therefore, thebest period to detect dust sources is in early spring, as thebiomass burning activities weaken and before the moist airfrom the Gulf of Guinea has penetrated north of 6�N[Hastenrath, 1991]. Figure 1 shows the yearly distributionof monthly mean t(550 nm) distribution for March, fromyear 2003 to 2006. The highest values of t at 550 nm,between 2 and 3, are observed along two plumes originatingfrom ephemeral lakes in the Bodele depression (blackcontours on the northwest side of the red shading). Thesouthwest orientation is typical of the trade winds in WestAfrica, called the Harmattan. Another large maximum, withvalues greater than 1, occupies the northern part of Nigeria.There are also many localized maxima from the Gulf ofGuinea to 10� latitude north.
4. Dust Source Detection
[9] Prospero et al. [2002] have shown that persistent dustsources can be identified from the frequency-of-occurrence(FOO) of the Total Ozone Mapping Spectrometer (TOMS)absorbing aerosol index, used as a proxy for atmosphericdust. A limitation of their approach is the dependency of theabsorbing aerosol index on all UV absorbing aerosols,which include not only dust but also carbonaceous aerosol.Aware of this dependency, they limit their study to arid and
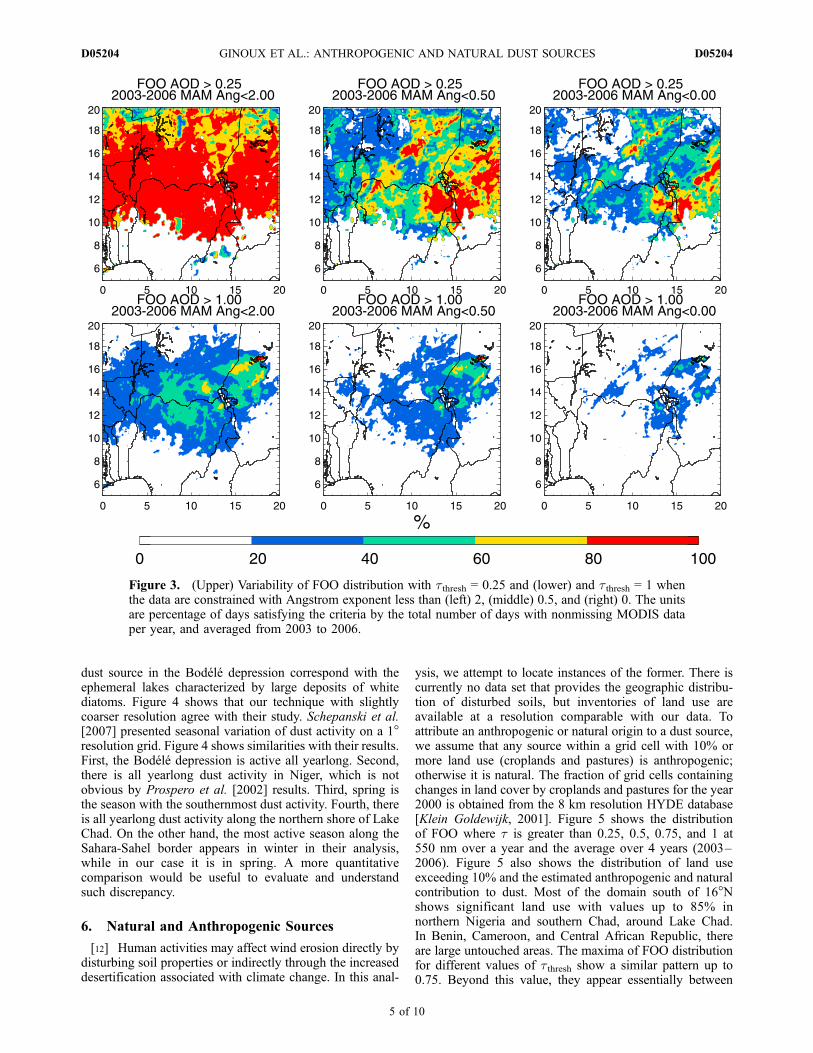
semiarid regions where there are no significant biomassburning activities. Here, we also use FOO to localize dustsources, but by taking advantage of the spectral aerosolproperties retrieved from MODIS Deep Blue we extend ourstudy beyond arid regions. FOO is calculated as the numberof days t(550 nm) is greater than a threshold value (tthresh),and a and w satisfy criteria of freshly emitted dust particles.Freshly emitted dust is characterized by large particleswhich have not yet been removed by gravitational settling.Maring et al. [2003] have observed that particles greaterthan 7.3 mm are efficiently removed during transport, butonce the largest particles are removed the normalized sizedistribution does not change over days. The rapid shift ofsize distribution from coarse freshly emitted dust towardstable fine aged dust provides a powerful method to isolatesources from lingering dust. Also, there is a strong contrastbetween coarse mode dust particles and accumulation mode(particle radius less than 0.5 mm) of biomass burning andurban aerosols. Therefore, a parameter sensitive to the sizedistribution should allow the separation of not only dustfrom other aerosol types, but also freshly emitted dust fromaged dust. Eck et al. [1999] have shown that the dominanceof one mode over the other on t can be measured with theAngstrom wavelength exponent a. The a values range from�0.5 to 1 in dusty environment and higher in pollutedregions [Dubovik et al., 2002]. As the largest particles areremoved from the atmosphere by gravitational settling, ageddust will contain smaller particles characterized by a highera value. In case of other coarse particles, such as sea saltaerosol, we use only cases of increasing w with wavelength,or w670 � w412 > 0. This is similar to imposing increasingabsorption from red to blue wavelengths, which is a typicaloptical property of dust but not for sea salt which does notabsorb in the visible [Dubovik et al., 2002]. Figure 2 showsthe distribution of t, a and w670 � w412 for 3 March 2005.In the upper part, t distribution has two distinct maxima,one over Bodele depression and one in northern Nigeria.The plumes in the Bodele depression originate from ephem-eral lakes, as was observed on many occasions [e.g.,Prospero et al., 2002; Koren and Kaufman, 2004]. Thereare also some dispersed localized maxima extending to theGulf of Guinea. The a values are roughly negative in thenorthern part corresponding to deserts and greater than 1 inthe southern part associated with savannah and forests.Some spots in the southern region have negative values,indicating the presence of dust. The w spectral contrast isessentially positive except in northern Nigeria where thereare negative values, typical of black carbon aerosols. Itappears that a offers a more stringent constraint on thedata than w670 � w412. However, we keep both criteria todetect dust.[10] Figure 3 illustrates the sensitivity of filtering a to the
calculation of FOO with t > tthresh for two different valuesof tthresh (0.25 and 1). It should be noted that FOO iscalculated for the total number of days with t > 0, in orderto compare equal area with missing data, because of thepresence of clouds or dark surface (surface reflectivity <0.15). In this figure, the statistics are built for each year, andthe mean FOO over 4 years is plotted. Without constraint ona, t is greater than 0.25 for more than 80% of the time, butfor t > 1 a similar percentage is only observed over thecentral ephemeral lake in the Bodele depression. In other
Figure 1. Monthly mean MODIS Deep Blue aerosoloptical depth at 550 nm for March averaged from 2003 to2006 on a fixed grid with 0.1� resolution. Country namesand geographic features are indicated in black and darkgray, respectively.
D05204 GINOUX ET AL.: ANTHROPOGENIC AND NATURAL DUST SOURCES
3 of 10
D05204

words, after increasing tthresh, FOO maxima are foundmainly over source locations and weaker sources arescreened out. Constraining a allows us to use a relativelylow value of tthresh, as can be seen in Figure 2. Indeed withathresh = 0.5 or 0 and low tthresh, hot spots appear moreclearly and are located primarily in Niger and Chad but arealso present in northern Nigeria with maxima around LakeChad. Figure 4 shows the seasonal variation of the FOO
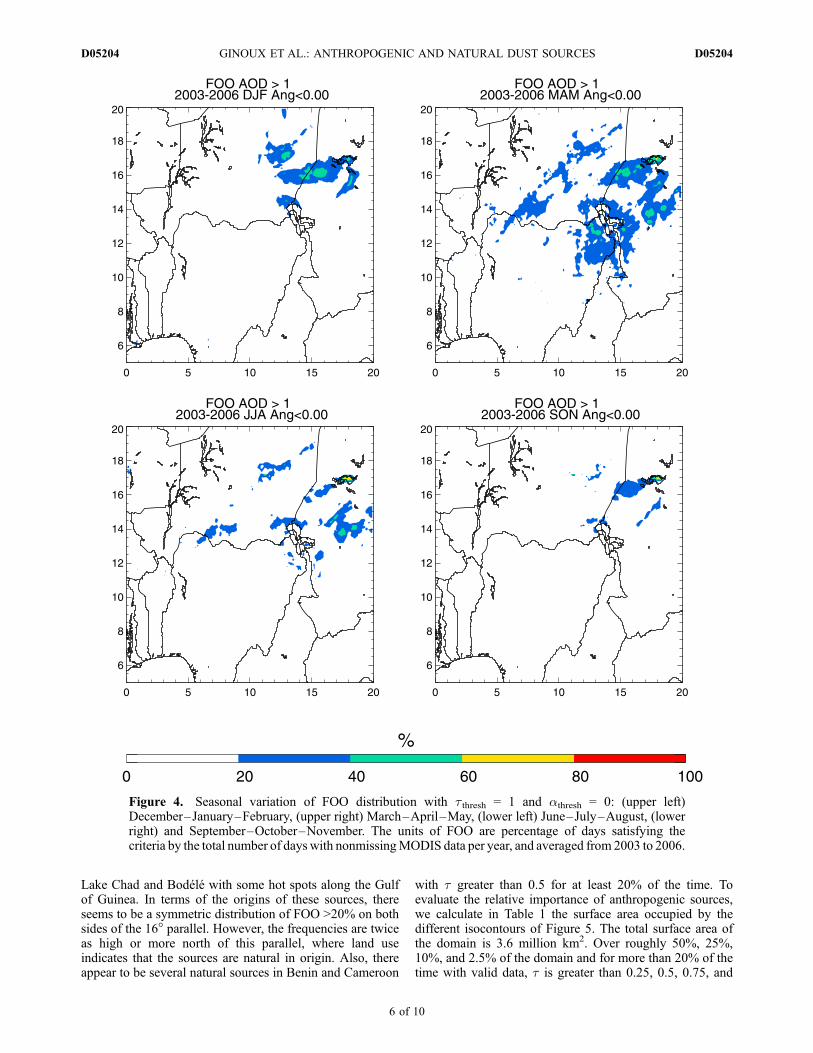
averaged over 4 years (2003–2006) for tthresh = 1 andathresh = 0. For all seasons, the highest frequencies arewithin the ephemeral lakes of the Bodele depression.Outside these lakes but within the Bodele depression thereis all yearlong dust activity. Such yearly activity is alsonoticeable on the northern shore of Lake Chad. Spring is theseason with the largest spread of source activity reachingfarthest south in Nigeria and Cameroon. The lowest activityappears in fall. These seasonal properties do not changesignificantly from year to year or for lower value of tthresh(not shown), so the best period to detect dust sources fromhuman activities is in spring, which shows the highest FOOin northern Nigeria and Lake Chad region.
5. Comparison With Other Studies
[11] The first aerosol product retrieved globally was theaerosol index derived by Herman et al. [1997] using theTOMS measurements in the near ultraviolet. Prospero et al.[2002] have shown that the most frequent location of themaxima of TOMS AI in arid or semiarid regions is overtopographic depression and can be associated with thepresence of ephemeral lakes. Because of the couplingmolecular-aerosol scattering in the ultraviolet, TOMS AIdepends almost linearly on the altitude of the plume[Ginoux and Torres, 2003]. As the sensitivity near thesurface is reduced, the source location is biased towarddownwind area as it has been shown by Mahowald et al.[2007]. Although the exact location of dust sources fromTOMS may be slightly biased, a study by Engelstaedteret al. [2003] using visibility data confirmed that dust stormfrequency increases with the fraction of topographic depres-sion. As MODIS DB algorithm is using wavelength in thevisible, although near the ultraviolet part of the visiblespectrum, the retrieval is much less sensitive to the altitudeof the aerosol layer [Hsu et al., 2006]. A second uncertaintyin our results may be related to the time of sampling byMODIS instrument. Polar orbiting satellite instruments, likeTOMS or MODIS, have a local passing time which may notnecessarily correspond to the peak of dust emission. Ginouxand Torres [2003] presented a detailed analysis of TOMSAI dependencies and showed that TOMS passing time at11:30 am does not always correspond to the maximumfrequency of diurnal variation of friction velocity. Compar-ing the distribution of source activity over West Africa,derived from TOMS AI and from geostationary infrareddata, Schepanski et al. [2007] explain the differencebetween the two by the fact that the time of dust activityis ahead of TOMS passing time. In our case, we useMODIS on Aqua platform which has a local passing timeat 1:30 pm. This is even later than TOMS. But as long as asource is statistically active throughout the day, it can bedetected by MODIS as was shown by Koren and Kaufman[2004] in the case of the Bodele depression. Schepanski etal. [2009] provided from satellite infrared data the diurnalvariation of the frequency of dust storms for nine regions inWest Africa. In all regions, the frequency of dust storms isnever null between noon and 3 pm. We are using 4 years ofdaily data and this should provide satisfactory representationof source activity even for sources with maximum activityearlier than MODIS passing time. Koren and Kaufman[2004] using 500 m resolution MODIS data showed that
Figure 2. (Upper) Daily aerosol optical depth at 550 nm,(middle) Angstrom exponent, and (lower) difference ofsingle scattering albedo between 670 and 412 nm on3 March 2005.
D05204 GINOUX ET AL.: ANTHROPOGENIC AND NATURAL DUST SOURCES
4 of 10
D05204
dust source in the Bodele depression correspond with theephemeral lakes characterized by large deposits of whitediatoms. Figure 4 shows that our technique with slightlycoarser resolution agree with their study. Schepanski et al.[2007] presented seasonal variation of dust activity on a 1�resolution grid. Figure 4 shows similarities with their results.First, the Bodele depression is active all yearlong. Second,there is all yearlong dust activity in Niger, which is notobvious by Prospero et al. [2002] results. Third, spring isthe season with the southernmost dust activity. Fourth, thereis all yearlong dust activity along the northern shore of LakeChad. On the other hand, the most active season along theSahara-Sahel border appears in winter in their analysis,while in our case it is in spring. A more quantitativecomparison would be useful to evaluate and understandsuch discrepancy.
6. Natural and Anthropogenic Sources
[12] Human activities may affect wind erosion directly bydisturbing soil properties or indirectly through the increaseddesertification associated with climate change. In this anal-
ysis, we attempt to locate instances of the former. There iscurrently no data set that provides the geographic distribu-tion of disturbed soils, but inventories of land use areavailable at a resolution comparable with our data. Toattribute an anthropogenic or natural origin to a dust source,we assume that any source within a grid cell with 10% ormore land use (croplands and pastures) is anthropogenic;otherwise it is natural. The fraction of grid cells containingchanges in land cover by croplands and pastures for the year2000 is obtained from the 8 km resolution HYDE database[Klein Goldewijk, 2001]. Figure 5 shows the distributionof FOO where t is greater than 0.25, 0.5, 0.75, and 1 at550 nm over a year and the average over 4 years (2003–2006). Figure 5 also shows the distribution of land useexceeding 10% and the estimated anthropogenic and naturalcontribution to dust. Most of the domain south of 16�Nshows significant land use with values up to 85% innorthern Nigeria and southern Chad, around Lake Chad.In Benin, Cameroon, and Central African Republic, thereare large untouched areas. The maxima of FOO distributionfor different values of tthresh show a similar pattern up to0.75. Beyond this value, they appear essentially between
Figure 3. (Upper) Variability of FOO distribution with tthresh = 0.25 and (lower) and tthresh = 1 whenthe data are constrained with Angstrom exponent less than (left) 2, (middle) 0.5, and (right) 0. The unitsare percentage of days satisfying the criteria by the total number of days with nonmissing MODIS dataper year, and averaged from 2003 to 2006.
D05204 GINOUX ET AL.: ANTHROPOGENIC AND NATURAL DUST SOURCES
5 of 10
D05204
Lake Chad and Bodele with some hot spots along the Gulfof Guinea. In terms of the origins of these sources, thereseems to be a symmetric distribution of FOO >20% on bothsides of the 16� parallel. However, the frequencies are twiceas high or more north of this parallel, where land useindicates that the sources are natural in origin. Also, thereappear to be several natural sources in Benin and Cameroon
with t greater than 0.5 for at least 20% of the time. Toevaluate the relative importance of anthropogenic sources,we calculate in Table 1 the surface area occupied by thedifferent isocontours of Figure 5. The total surface area ofthe domain is 3.6 million km2. Over roughly 50%, 25%,10%, and 2.5% of the domain and for more than 20% of thetime with valid data, t is greater than 0.25, 0.5, 0.75, and
Figure 4. Seasonal variation of FOO distribution with tthresh = 1 and athresh = 0: (upper left)December–January–February, (upper right) March–April–May, (lower left) June–July–August, (lowerright) and September–October–November. The units of FOO are percentage of days satisfying thecriteria by the total number of days with nonmissingMODIS data per year, and averaged from 2003 to 2006.
D05204 GINOUX ET AL.: ANTHROPOGENIC AND NATURAL DUST SOURCES
6 of 10
D05204

Figure 5. Distribution of natural (red shading) and anthropogenic (blue shading) FOO with athresh = 0and (upper left) tthresh = 0.25, (upper right) 0.5, (lower left) 0.75, and (lower right) 1, overplotted on thepercentage land use (croplands and pastures) from 10% to 100% (in yellow, the lighter the color thehigher the percentage of land use). The units of FOO are percentage of days satisfying the criteria bythe total number of days with nonmissing MODIS data per year, and averaged from 2003 to 2006.
D05204 GINOUX ET AL.: ANTHROPOGENIC AND NATURAL DUST SOURCES
7 of 10
D05204

1.0, respectively. Out of these regions, 50% is occupied byanthropogenic dust for a value of optical depth less than0.75. This percentage decreases as the frequency of occur-rence increases, except for tthresh = 0.5 where there is anequivalent surface at 80% FOO. For an optical depth of 0.75or higher, only natural dust has a frequency of occurrencehigher than 60%. As the choice of a minimum 10% land usewas quite arbitrary, we calculate in Table 2 the percentage ofanthropogenic source for 5%, 25%, and 50% minimum landuse. For optical depth below 0.75, anthropogenic dust areaappears relatively independent of the percentage of land use.But for higher optical depth, the surface area of anthropo-genic dust decreases rapidly with an increasing cutoff valueof land use. This is because a large fraction of dust withoptical depth higher than 0.5 is located in southern Nigerwhere the land use is between 20% and 50%. At loweroptical depth a large fraction of dust is over northern Nigeriaand southern Chad with land use much larger than 50%.These results indicate that anthropogenic sources may emitat low optical depth as much as 50% of all dust in thatregion and at least 20% of the time, while only naturalsources can generate optical depth greater than 1 for morethan 40% of the time. Although the anthropogenic sourcesappear weaker than natural sources, it is important to note thatthey are located further south than any previously studieddust sources in West Africa. This may increase the amount oflong range transport of dust, mostly in winter, to the Amazonbasin where it provides nutrients [Swap et al., 1992] and mayalso contribute to low elevation dust as observed during fieldexperiment over Sahel [Osborne et al., 2008].
7. Evaluation
[13] The validation of our results with data is not possibleas there are no ground observations of anthropogenic dust inthis part of the world. One empirical method is to attempt tocorrelate the FOO maxima with either urban areas or known
natural features such as ephemeral lakes. Using high reso-lution imagery of the Earth, such as GoogleEarthTM, it isgenerally possible to determine the plausibility of an an-thropogenic source detected using our methodology. Wepresent several such cases where the characterization of dustsources in Nigeria and Chad is inaccurate or ambiguous.Figure 6 shows the 40% and 60% contours of FOO overLake Iro in Chad, which is attributed to human activity onthe basis of the existence of land use over the area. But itslocation on an ephemeral lake bed is not taken into accountby our algorithm. Most likely, dust emission is generatedfrom the dry lake bed in period of drought, in which case weshould identify the source as natural. It is also possible thatthe river flow to the lake is diverted for irrigation, in whichcase the source should be identified as anthropogenic. Thisillustrates the limitation of using only the land use data setto classify dust sources. Figure 7 demonstrates a similarcase where there is an equal attribution to anthropogenicand natural dust over the Kainji reservoir in Nigeria. Dustemission from dry lake beds is very effective and appears asan obvious natural source, but if the lake bed is exposed as aconsequence of irrigation or over-pumping, the sourceshould be considered solely as anthropogenic. Figure 8 showsa wrong attribution of natural dust over Lagos, capital ofNigeria due to the absence of pasture or cropland in megacities. On the other hand, we found that most sources inBenin and Cameroon are wrongly attributed to natural
Table 1. Surface Area of Natural and Anthropogenic Sources of t (550 nm) Greater than 0.25, 0.5, 0.75, and 1 for Frequency of
Occurrence Greater than 20%, 40%, 60%, and 80%a
t
FOO > 20% FOO > 40% FOO > 60% FOO > 80%
N(106 km2)
A(106 km2)
A/(A + N)(%)
N(106 km2)
A(106 km2)
A/(A + N)(%)
N(106 km2)
A(106 km2)
A/(A + N)(%)
N(106 km2)
A(106 km2)
A/(A + N)(%)
0.25 786 942 54 302 290 49 57 37 40 6 1.5 190.5 472 530 53 109 64 37 13 2.8 18 0.3 0.2 410.75 193 167 46 27 4.9 15 0.9 0 0 0 0 01 75 25 25 4.5 0 0 0.2 0 0 0 0 0
aThe percentage of anthropogenic surface relative to total dusty surface (A/(A + N)), where N is natural and A is anthropogenic, is also given foreach case.
Figure 6. GoogleEarth image of Lake Iro (10�5053.5000N,19�24059.2000E) in Chad, with 40% and 60% FOOanthropogenic (blue semitransparent polygons) dust withtthresh = 0.25 and athresh = 0.
Table 2. Percentage of Anthropogenic Surface Relative to Total
Dusty Surface for Three Values of Land Use Change, 5%, 25%,
and 50%, and Four Minimum Values of FOO, 20%, 40%, 60%,
and 80%
t
FOO > 20% FOO > 40% FOO > 60% FOO > 80%
5% 25% 50% 5% 25% 50% 5% 25% 50% 5% 25% 50%
0.25 57 48 33 50 45 34 40 38 32 21 16 100.5 55 48 34 38 33 26 20 16 11 41 41 410.75 47 41 29 16 13 8 0 0 0 0 0 01 26 18 11 0 0 0 0 0 0 0 0 0
D05204 GINOUX ET AL.: ANTHROPOGENIC AND NATURAL DUST SOURCES
8 of 10
D05204

origin as they appear, by zooming with GoogleEarth but notshown, centered on recently cleared land in forests. Thiserror may be due to the fact that these clearings are morerecent than the land use database. The surface areas of thesewrong attributions are a few hundreds kilometer square andare insignificant compared with the total dust sources.However, in other regions, it may be necessary to obtaindetailed information for each source individually. In thatregard, high resolution data sets are crucial, and the over-laying of the FOO isocontours on GoogleEarth is of greathelp but not sufficient.
8. Summary and Conclusions
[14] In order to evaluate the anthropogenic contribution todust emission from direct measurement, we have used theMODIS Deep Blue level 2 aerosol products in combinationwith land use data set. The daily MODIS products havebeen interpolated on a regular grid of 0.1� resolution fromJanuary 2003 to December 2006. Using the spectral valuesof single scattering albedo (w) and the Angstrom wave-length exponent (a), the daily gridded data are screened forcoarse dust particles by imposing the constraints a < 0 andw412 < w670. The frequency of occurrence of areas where theaerosol optical depth (t) is greater than a threshold opticaldepth (tthresh) is calculated, and its seasonal and yearlydistributions are used to locate dust sources. We select adomain which includes the most active natural dust source,the Bodele, and Nigeria with the highest population densityin Africa. The most permanent sources have higher FOOvalues and the most intense have higher tthresh for similarFOO.[15] For low tthresh, yearly FOO is relatively uniformly
distributed in the upper half of the domain but as weincrease tthresh up to 1 only regions around Lake Chadand Bodele appear active. The distribution of FOO shows aseasonal cycle with maxima in winter and fall over Niger, inspring over Chad and Nigeria, and in summer over Mali,Niger, and Chad. During all seasons there are hot spots over
Bodele and around Lake Chad. Except in summer, when theITCZ occupies its northernmost position and there are nodata because of clouds, there are multiple local maximaaround the Gulf of Guinea.[16] The identification of anthropogenic or natural sour-
ces is performed by using land use data set. In regionswhere at least 5%–25% of the land surface is cultivated orotherwise disturbed, more than half of the domain ispotentially an anthropogenic dust source. By overlayingthe distribution of FOO, it appears that for t < 0.75, 50% ofdust is anthropogenic but beyond such optical depth dust isessentially of natural origin. The anthropogenic sources areessentially located in northern Nigeria and western Chadaround Lake Chad. Some local natural and anthropogenicsources are found as far south as the Gulf of Guinea.[17] Evaluation of the results using GoogleEarthTM indi-
cates some false or ambiguous identification. We showcases of a lake and reservoir where the attribution isambiguous as it is not possible to determine whether thesource arises because of climate drought or human activitieswithout further information. These cases account for rela-tively small areas and should not modify our resultssignificantly. But quantitative comparison with other datasets should provide more solid evaluation. This will beperformed at the global scale in a follow-up paper.
[18] Acknowledgments. We are thankful to the reviewers commentswho help us improve the manuscript. Dmitri Garbuzov was funded underthe summer internship program by the Princeton Environmental Institute.Figures 6, 7, and 8 have been realized using GoogleEarth
TM.
ReferencesBou Karam, D., C. Flamant, P. Knippertz, O. Reitebuch, J. Pelon,M. Chong, and A. Dabas (2008), Dust emissions over the Sahelassociated with the West African monsoon intertropical discontinuityregion: A representative case-study, Q. J. R. Meteorol. Soc., 134,621–634, doi:10.1002/qj.244.
Dubovik, O., B. Holben, T. F. Eck, A. Smirnov, Y. J. Kaufman, M. D. King,D. Tanre, and I. Slutsker (2002), Variability of absorption and opticalproperties of key aerosol types observed in worldwide locations, J. Atmos.Sci., 59, 590–608.
Figure 7. GoogleEarth image of Kainji reservoir(10�24035.2800N, 4�32045.9000E) in Nigeria, with 40% FOOnatural (red semitransparent polygon) and anthropogenic(blue semitransparent polygon) dust with tthresh = 0.25 andathresh = 0.
Figure 8. GoogleEarth image of Lagos (6�3200.1200N,3�22032.2700E) in Nigeria, with 40% and 60% FOO natural(red semitransparent polygons) and anthropogenic (bluesemitransparent polygon) dust with tthresh = 0.25 andathresh = 0.
D05204 GINOUX ET AL.: ANTHROPOGENIC AND NATURAL DUST SOURCES
9 of 10
D05204

Eck, T. F., B. N. Holben, J. S. Reid, O. Dubovik, A. Smirnov, N. T. O’Neill,I. Slutsker, and S. Kinne (1999), Wavelength dependence of the opticaldepth of biomass burning, urban, and desert dust aerosols, J. Geophys.Res., 104(D24), 31,333–31,349.
Engelstaedter, S., K. E. Kohfeld, I. Tegen, and S. P. Harrison (2003), Con-trols of dust emissions by vegetation and topographic depressions: Anevaluation using dust storm frequency data, Geophys. Res. Lett., 30(6),1294, doi:10.1029/2002GL016471.
Forster, P., et al. (2007), Changes in atmospheric constituents and in radia-tive forcing, in Climate Change 2007: The Physical Science Basis, inContribution of Working Group I to the Fourth Assessment Report of theIntergovernmental Panel on Climate Change, edited by S. Solomon etal., pp. 129–234, Cambridge Univ. Press, Cambridge, U. K.
Ginoux, P., and O. Torres (2003), Empirical TOMS index for dust aerosol:Applications to model validation and source characterization, J. Geophys.Res., 108(D17), 4534, doi:10.1029/2003JD003470.
Ginoux, P., M. Chin, I. Tegen, J. M. Prospero, B. Holben, O. Dubovik, andS.-J. Lin (2001), Sources and distributions of dust aerosols simulatedwith the GOCART model, J. Geophys. Res., 106, 20,255–20,274.
Hastenrath, S. (1991), Climate Dynamics of the Tropics, Kluwer Acad.,Dordrecht, Netherlands.
Herman, J., P. Bhartia, O. Torres, C. Hsu, C. Seftor, and E. Celarier (1997),Global distribution of UV-absorbing aerosols from Nimbus 7/TOMSdata, J. Geophys. Res., 102, 16,911–16,922.
Hsu, N. C., S.-C. Tsay, M. King, and J. R. Herman (2004), Aerosol proper-ties over bright-reflecting source regions, IEEE Trans. Geosci. RemoteSens., 42, 557–569.
Hsu, N. C., S.-C. Tsay, M. King, and J. R. Herman (2006), Deep Blueretrievals of Asian aerosol properties during ACE-Asia, IEEE Trans.Geosci. Remote Sens., 44, 3180–3195.
Klein Goldewijk, K. (2001), Estimating global land use change over thepast 300 years: The HYDE database, Global Biogeochem. Cycles, 15,417–433.
Koren, I., and Y. J. Kaufman (2004), Direct wind measurements of Saharandust events from Terra and Aqua satellites, Geophys. Res. Lett., 31,L06122, doi:10.1029/2003GL019338.
Legrand, M., A. Plana-Fattori, and C. N’doume (2001), Satellite detectionof dust using the IR imagery of Meteosat: 1. Infrared difference dustindex, J. Geophys. Res., 106, 18,251–18,274.
Maring, H., D. L. Savoie, M. A. Izaguirre, L. Crustals, and J. S. Reid(2003), Mineral dust aerosol size distribution change during atmospherictransport, J. Geophys. Res., 108(D19), 8592, doi:10.1029/2002JD002536.
Mahowald, N. M., and C. Luo (2003), A less dusty future?, Geophys. Res.Lett., 30(17), 1903, doi:10.1029/2003GL017880.
Mahowald, N. M., J. A. Ballantine, J. Feddema, and N. Ramankutty (2007),Global trends in visibility: Implications for dust sources, Atmos. Chem.Phys., 7, 3309–3399.
Martin, J. H., R. M. Gordon, and S. E. Fitzwater (1991), The case for iron,Limnol. Oceanogr., 36(8), 1793–1802.
Mortimore, M., and W. Adams (1999), Working the Sahel: Environmentand Society in Northern Nigeria, Routledge, London.
Moulin, C., and I. Chiapello (2006), Impact of human-induced desertifica-tion on the intensification of Sahel dust emission and export over the lastdecades, Geophys. Res. Lett., 33, L18808, doi:10.1029/2006GL025923.
Neff, J. C., A. P. Ballantyne, G. L. Farmer, N. M. Mahowald, J. L. Conroy,
C. C. Landry, J. T. Overpeck, T. H. Painter, C. R. Lawrence, andR. L. Reynolds (2008), Increasing eolian dust deposition in the WesternUnited States linked to human activity, Nat. Geosci., 1, 189 –195,doi:10.1038/ngeo133.
Osborne, S. R., B. T. Johnson, J. M. Haywood, A. J. Baran, M. A. J.Harrison, and C. L. McConnell (2008), Physical and optical propertiesof mineral dust aerosol during the dust and biomass-burning experiment,J. Geophys. Res., 111, D00C03, doi:10.1029/2007JD009551.
Prospero, J. M., P. Ginoux, O. Torres, S. E. Nicholson, and T. E. Gill(2002), Environmental characterization of global sources of atmosphericsoil dust identified with the Nimbus 7 Total Ozone Mapping Spectro-meter (TOMS) absorbing aerosol product, Rev. Geophys., 40(1), 1002,doi:10.1029/2000RG000095.
Schepanski, K., I. Tegen, B. Laurent, B. Heinold, and A. Macke (2007), Anew Saharan dust source activation frequency map derived from MSG-SEVIRI IR-channels, Geophys. Res. Lett., 34, L18803, doi:10.1029/2007GL030168.
Schepanski, K., I. Tegen, M. C. Todd, B. Heinold, G. Bonisch,B. Laurent, and A. Macke (2009), Meteorological processes forcingSaharan dust emission inferred from MSG-SEVIRI observations of sub-daily dust source activation and numerical models, J. Geophys. Res.,114, D10201, doi:10.1029/2008JD010325.
Swap, R., M. Garstang, S. Greco, R. Talbot, and P. Kallberg (1992), Sahar-an dust in Amazon Basin, Tellus Ser. B, 44, 133–149.
Tegen, I., S. P. Harrison, K. Kohfeld, I. C. Prentice, M. Coe, andM. Heimann (2002), Impact of vegetation and preferential source areason global dust aerosol: Results from a model study, J. Geophys. Res.,107(D21), 4576, doi:10.1029/2001JD000963.
Todd, M. C., R. Washington, J. V. Martins, O. Dubovik, G. Lizcano,S. M’Bainayel, and S. Engelstaedter (2007), Mineral dust emission fromthe Bodele Depression, northern Chad, during BoDEx 2005, J. Geophys.Res., 112, D06207, doi:10.1029/2006JD007170.
Washington, R., M. C. Todd, S. Engelstaedter, S. M’bainayel, and F.Mitchell(2006), Dust and the low-level circulation over the Bodele Depression,Chad: Observations from BoDEx 2005, J. Geophys. Res., 111, D03201,doi:10.1029/2005JD006502.
Yoshioka, M., N. Mahowald, J.-L. Dufresne, and C. Luo (2005), Simulationof absorbing aerosol indices for African dust, J. Geophys. Res., 110,D18S17, doi:10.1029/2004JD005276.
Zender, C. S., D. Newman, and O. Torres (2003), Spatial heterogeneity inaeolian erodibility: Uniform, topographic, geomorphologic, and hydro-logic hypotheses, J. Geophys. Res., 108(D17), 4543, doi:10.1029/2002JD003039.
Zender, C. S., R. L. Miller, and I. Tegen (2004), Quantifying mineral dustmass budgets: Terminology, constraints, and current estimates, Eos Trans.AGU, 85, 509–512.
�����������������������D. Garbuzov, Department of Computer Sciences, Princeton University,
NJ 08542, USA. ([email protected])P. Ginoux, Geophysical Fluid Dynamics Laboratory, NOAA, Princeton,
NJ 08542, USA. ([email protected])N. C. Hsu, NASA Goddard Space Flight Center, Greenbelt, MD 20771,
USA. ([email protected])
D05204 GINOUX ET AL.: ANTHROPOGENIC AND NATURAL DUST SOURCES
10 of 10
D05204


![The Influence of Dust and Black Carbon on Clouds, in Africaaerosol types such as black carbon, the dust included, come from anthropogenic activities [20]. The figure clearly shows](https://static.fdocuments.us/doc/165x107/60c51d7b6cd1ce7e1a4464d5/the-influence-of-dust-and-black-carbon-on-clouds-in-africa-aerosol-types-such-as.jpg)


