
Identification and Description of Mineral Processing .... Identify Mineral Commodity Sectors of...
45
Transcript of Identification and Description of Mineral Processing .... Identify Mineral Commodity Sectors of...


II. METHODS AND DATA SOURCES
This chapter details EPA's step-wise methodology for both defining the universe of mineral processing sectors, facilities, and waste streams potentially affected by the proposed Phase IV Land Disposal Restrictions and estimating the corresponding waste volumes.
The Agency developed a step-wise methodology that began with the broadest possible scope of inquiry to ensure that EPA captured all of the potentially affected mineral commodity sectors and waste streams. The Agency then narrowed the focus of its data gathering and analysis at each subsequent step. The specific steps and sources of data employed throughout this analysis are described below, and are summarized in Exhibit 2-1.
EXHIBIT 2-1
Overview of the Agency's Methodology for Defining the Universe of Potentially Affected Mineral Processing Waste Streams
STEP 1
STEP 2
STEP 3
STEP 4
STEP 5
Identify Mineral Commodity
Sectors of Interest
Prepare Mineral Commodity Analysis Reports on
Each Sector
Conduct Exhaustive Information Search on Mineral Commodity Sectors of Interest
Define Universe of Mineral Processing Waste Streams
Potentially Affected by The Phase IV LDRs
Define Universe of Mineral Processing Facilities Potentially Affected by the Phase IV LDRs

A. Identify Mineral Commodity Sectors of Interest
Step One
Identify Mineral Commodity Sectors of Interest
Conduct Exhaustive Information Search on Mineral Commodity Sectors of Interest
EPA reviewed the 36 industrial sectors (commodities) and 97 different general categories of wastes previously developed and published in the October 21, 1991 Advanced Notice of Public Rule Making (ANPRM). EPA also reviewed the U.S. Bureau of Mines' 1991 Minerals Yearbook, 1995 Mineral Commodities Summary, and the 1985 Mineral Facts and Problems. The Agency reviewed this comprehensive listing of all of the mineral commodity sectors and removed from further consideration all non-domestically produced mineral commodities; all inactive mineral commodities, such as nickel; and all mineral commodities generated from operations known not to employ operations that meet the Agency's definition of mineral processing.1 As a result of this process, EPA identified a total of 62 mineral commodities that potentially generate “mineral processing” waste streams of interest. These mineral commodity sectors are listed in Exhibit 2-2.
The Agency notes that Exhibit 2-2 represents EPA's best efforts at identifying mineral commodities that may generate mineral processing wastes. Omission or inclusion on this list does not relieve the generator of the responsibility of appropriately managing wastes that would be subject to RCRA Subtitle C requirements.
B. Conduct Exhaustive Information Search on Mineral Commodity Sectors of Interest
EPA researched and obtained information characterizing the mineral processing operations and wastes associated with the mineral commodities listed in Exhibit 2-2. This information was used by EPA both to update existing data characterizing mineral processing wastes obtained through past Agency efforts and to obtain characterization information on newly identified waste streams not previously researched.
To provide the necessary foundation to develop a fully comprehensive inventory of mineral commodity sectors, facilities, and waste streams that might be affected by the Phase IV LDRs program, EPA embarked on an ambitious information collection program. Specifically, to capitalize on information collected through past efforts, as well as to collect more recent data, the Agency conducted the following activities:
C Reviewed mineral processing survey instruments (NSSWMPF) and public comments (submitted in response to the 1991 ANPRM) for process-related information (e.g., process flow diagrams, waste characterization data, and waste management information) contained in our in-house files.
C Reviewed numerous documents (e.g., Bureau of Mines publications, the Randol Mining Directory and other Industrial Directories, and various Agency contractor reports) for process-related information.
C Reviewed trip reports prepared both by EPA and its contractors from sampling visits and/or inspections conducted at approximately 50 mineral processing sites located throughout the United States.
1 Sectors that employ operations that mill (e.g., grind, sort, wash), physically separate (e.g., magnetic, gravity, or electrostatic separation, froth flotation), concentrate using liquid separation (e.g., leaching followed by ion exchange), and/or calcine (i.e., heat to drive off water or carbon dioxide), and use no techniques that the Agency considers to be mineral processing operations (e.g., smelting or acid digestion) are unaffected by the Phase IV LDRs.

EXHIBIT 2-2
MINERAL COMMODITIES OF POTENTIAL INTEREST
1) Alumina 32) Lightweight Aggregate 2) Aluminum 33) Lithium (from ores) 3) Ammonium Molybdate 34) Lithium Carbonate 4) Antimony 35) Magnesia (from brines) 5) Arsenic Acid 36) Magnesium 6) Asphalt (natural) 37) Manganese and MnO2 7) Beryllium 38) Mercury 8) Bismuth 39) Mineral Waxes 9) Boron 40) Molybdenum
10) Bromine (from brines) 41) Phosphoric Acid 11) Cadmium 42) Platinum Group Metals 12) Calcium Metal 43) Pyrobitumens 13) Cerium, Lanthanides, and Rare Earths 44) Rhenium 14) Cesium/Rubidium 45) Scandium 15) Chromium 46) Selenium 16) Coal Gas 47) Silicomanganese 17) Copper 48) Silicon 18) Elemental Phosphorus 49) Soda Ash 19) Ferrochrome 50) Sodium Sulfate 20) Ferrochrome-Silicon 51) Strontium 21) Ferrocolumbium 52) Sulfur 22) Ferromanganese 53) Synthetic Rutile 23) Ferromolybdenum 54) Tantalum/Columbium 24) Ferrosilicon 55) Tellurium 25) Gemstones 56) Tin 26) Germanium 57) Titanium/TiO2 27) Gold and Silver 58) Tungsten 28) Hydrofluoric Acid 59) Uranium 29) Iodine (from brines) 60) Vanadium 30) Iron and Steel 61) Zinc 31) Lead 62) Zirconium/Hafnium

Step Two C
Identify Mineral Commodity Sectors of Interest
Conduct Exhaustive Information Search on Mineral Commodity Sectors of Interest
Prepare Mineral Commodity Analysis Reports on Each Sector
C
C
C
Reviewed sampling data collected by EPA's Office of Research and Development (ORD), EPA's Office of Water (OW), and Agency survey data collected to support the preparation of the 1990 Report to Congress.
Reviewed the 1993, 1994, and 1995 “Mineral Commodity Summaries” prepared by the U.S. Bureau of Mines (BOM) for salient statistics on commodity production.
Partially reviewed and summarized damage case information presented in the “Mining Sites on the National Priorities List, NPL Site Summary Reports” to support work on assessing the appropriateness of the Toxicity Characteristic Leaching Procedure (TCLP) for mineral processing wastes.
Contacted the BOM Commodity Specialists associated with the commodity sectors of interest to (1) obtain current information on mining companies, processes, and waste streams, and (2) identify other potential sources of information.
C Retrieved applicable and relevant documents from the BOM's FAXBACK document retrieval system. Documents retrieved included monthly updates to salient statistics, bulletins, and technology review papers.
C Conducted an electronic query of the 1991 Biennial Reporting System (BRS) for waste generation and management information on 34 mineral processing-related Standard Industrial Classification (SIC) numbers.
C Conducted an electronic literature search for information related to mineral processing and waste treatment technologies contained in numerous technical on-line databases, including: NTIS, Compendex Plus, METADEX, Aluminum Industry Abstracts, ENVIROLINE, Pollution Abstracts, Environmental Bibliography, and GEOREF.
B.1 Review of Hard Copy Reports, Comments, and Survey Instruments
Using the information obtained from our in-house files and the various BOM and contractor documents, EPA was able to find process flow diagrams for the following 27 commodities:
C AluminaC AluminumC AntimonyC BismuthC Cerium/Lanthanides/Rare Earth MetalsC Cesium/RubidiumC Coal GasC CopperC Elemental PhosphorusC GermaniumC Gold and SilverC Hydrofluoric AcidC Iron and SteelC Lead
C Lightweight AggregateC MagnesiumC MercuryC MolybdenumC Phosphoric AcidC RheniumC ScandiumC Soda AshC Synthetic RutileC Titanium/TiO2
C TungstenC UraniumC Zinc
EPA also found either less detailed or fewer (in number) process flow diagrams for all of the remaining mineral commodities except:
C Ammonium Molybdate C GemstonesC Asphalt (natural) C Mineral WaxesC Ferrocolumbium C PyrobitumensC Ferromolybdenum C SilicomanganeseC Ferrosilicon
EPA has been unable to locate any process information for the above nine commodities. All of the process-related information that we retrieved was then photocopied and filed by commodity.
B.2 Electronic Literature Search
EPA devised a search strategy and performed an electronic literature search for journal articles, conference reports, technical reports and bulletins, books, doctoral dissertations, patents, and news articles containing information related to the production of mineral commodities, and the characterization and treatment of mineral processing wastes. We searched the on-line databases summarized below in Exhibit 2-3.
Using the on-line databases summarized in Exhibit 2-3, we searched for relevant information (published since 1990) on the mineral commodities listed in Exhibit 2-2 using the keywords presented in Exhibit 2-4. We chose 1990 as the cutoff year so as not to duplicate past information collection activities conducted by EPA and EPA contractors, and to obtain information on mineral processes "retooled" since clarification of the Bevill Exclusion to address truly "high volume, low hazard" mineral processing wastes.
Accordingly, using the strategy outlined in Exhibit 2-4, an article would have been selected if anywhere in either the title, record descriptors, or full text, one of the mineral commodities listed in Exhibit 2-2 and the keywords (waste, residue, wastewater, sludge, slag, dust, or blowdown) with one or more modifiers was found. For example, if a particular record had the industrial sector - "alumina" or "aluminum" and the keyword - "waste" and the modifier - "characteristics", the database record would have been selected. Unfortunately, this search strategy proved to be too expansive; the first search for information on alumina and aluminum turned up over 3,000 citations. We therefore elected to modify the search strategy by requiring the commodity, keyword, and modifier to be present in either the title or record descriptor (and not in the full text). This modification allowed for a more manageable number of citations -- 1,242 titles.
To conserve resources, we first reviewed the results of the literature search output which contained the full title of the selected record to see if the article seemed promising. If, based on our review of the title the record appeared promising, we then requested the full abstract. We then reviewed the full abstract to further screen the appropriateness of the record. If the abstract appeared relevant, we then ordered the document. Using the alumina/aluminum example, we reviewed the 1,242 title citations and determined that it was necessary to request full abstracts for 333 of the title citations. Using this protocol, we identified a total of 10,298 citations relating to one or more of the commodities listed in Exhibit 2-2. We then reviewed the title citations and requested a total of 1,776 full abstracts. Lastly, based on our review of the abstracts, we requested a total of 863 documents (using a tracking system to ensure that a selected reference material was not requested more than once). The top five industrial sectors that appear to be the most studied (based on number of citations meeting our search strategy specifications) are the following:
C Iron and Steel (1,460 titles);C Alumina/Aluminum (1,242 titles);C Copper (1,081 titles);C Chromium (833 titles); andC Lead (800 titles).

EXHIBIT 2-3
SUMMARY OF ON-LINE DATABASES SEARCHED
Databases Description Subjects Covered Sources
NTIS
Dates Covered
1964 to the present.
File Size
1,639,906 records as of 1/93.
Update Frequency
Biweekly.
The NTIS database consists of government-sponsored research, development, and engineering plus analyses prepared by federal agencies, their contractors, or grantees. It is the means through which unclassified, publicly available, unlimited distribution reports are made available for sale from agencies such as NASA, DDC, DOE, EPA, HUD, DOT, Department of Commerce, and some 240 other agencies. In addition, some state and local government agencies now contribute their reports to the database. Truly multi-disciplinary, this database covers a wide spectrum of subjects including: administration and management, agriculture and food, behavior and society, building, business and economics, chemistry, civil engineering, energy, health planning, library and information science, materials science, medicine and biology, military science, transportation, and much more.
Administration and Management -- Aeronautics and Aerodynamics -- Agriculture and Food -- Astronomy and Astrophysics -- Atmospheric Sciences -- Behavior and Society -- Biomedical Technology and Engineering -- Building Industry Technology --Business and Economics -- Chemistry -- Civil Engineering -- Communication -- Computers, Control, and Information Theory -- Electrotechnology -- Energy -- Environmental Pollution and Control -- Health Planning -- Industrial and Mechanical Engineering --Library and Information Sciences -- Materials Sciences -- Mathematical Sciences -- Medicine and Biology --Military Sciences -- Missile Technology -- Natural Resources and Earth Sciences -- Navigation, Guidance, and Control -- Nuclear Science and Technology --Ocean Technology and Engineering -- Photography and Recording Devices -- Physics -- Propulsion and Fuels -- Space Technology -- Transportation -- Urban and Regional Technology.
The NTIS database represents the reports of four major U.S. federal government agencies: U.S. Department of Energy (DOE), U.S. Department of Defense (DoD), U.S. Environmental Protection Agency (EPA), National Aeronautics and Space Administration (NASA), plus many other agencies.
COMPENDEX PLUS
Dates Covered
1970 to the present.
File Size
3,015,116 records as of 1/93.
Update Frequency
Weekly.
The COMPENDEX PLUS database is the machine-readable version of the Engineering Index (monthly/annual), which provides abstracted information from the world's significant engineering and technological literature. The COMPENDEX database provides worldwide coverage of approximately 4,500 journals and selected government reports and books. Subjects covered include: civil, energy, environmental, geological, and biological engineering; electrical, electronics, and control engineering; chemical, mining, metals, and fuel engineering; mechanical, automotive, nuclear, and aerospace engineering; and computers, robotics, and industrial robots. In addition to journal literature, over 480,000 records of significant published proceedings of engineering and technical conferences formerly indexed in Ei ENGINEERING MEETINGS are included.
Aeronautical and Aerospace Engineering -- Applied Physics (High Energy, Plasma, Nuclear and Solid State) -- Bioengineering and Medical Equipment --Chemical Engineering, Ceramics, Plastics and Polymers, Food Technology -- Civil and Structural Engineering, Environmental Technology -- Electrical, Instrumentation, Control Engineering, Power Engineering -- Electronics, Computers, Communications -- Energy Technology and Petroleum Engineering -- Engineering Management and Industrial Engineering -- Light and Optical Technology -- Marine Engineering, Naval Architecture, Ocean and Underwater Technology -- Mechanical Engineering, Automotive Engineering and Transportation -- Mining and Metallurgical Engineering, and Materials Science.
Publications from around the world are indexed, including approximately 4,500 journals, publications of engineering societies and organizations, approximately 2,000 conferences per year, technical reports, and monographs.

EXHIBIT 2-3 (Continued)
SUMMARY OF ON-LINE DATABASES SEARCHED
Databases Description Subjects Covered Sources
METADEX
Dates Covered
1966 to the present.
File Size
911,907 records as of 1/93.
Update Frequency
Monthly.
The METADEX (Metals Abstracts/Alloys Index) database, produced by Materials Information of ASM International and the Institute of Metals, provides comprehensive coverage of international metals literature. The database corresponds to the printed publications: Review of Metal Literature (1966-1967), Metals Abstracts (1968 to the present), Alloys Index (1974 to the present), Steels Supplement (1983-1984), and Steels Alert (January - June 1985). The Metals Abstracts portion of the file includes references to about 1,200 primary journal sources. Alloys Index supplements Metals Abstracts by providing access to the records through commercial, numerical, and compositional alloy designations; specific metallic systems; and intermetallic compounds found within these systems.
Materials -- Processes -- Properties -- Products --Forms -- Influencing Factors.
Each month over 3,000 new documents from a variety of international sources are scanned and abstracted for the ASM database, with intensive coverage of appropriate journals, conference papers, reviews, technical reports, and books. Dissertations, U.S. patents, and government reports have been included since 1979, British (GB) patents since 1982, and European (EP) patents since 1986.
ALUMINUM INDUSTRY ABSTRACTS
Dates Covered
1968 to the present.
File Size
172,000 records as of 7/93.
Update Frequency
Monthly.
ALUMINUM INDUSTRY ABSTRACTS (AIA), formerly World Aluminum Abstracts (WAA), provides coverage of the world's technical literature on aluminum, ranging from ore processing through applications. The AIA database includes information abstracted from approximately 2,300 scientific and technical journals, government reports, conference proceedings, dissertations, books, and patents. All aspects of the aluminum industry, aside from mining, are covered.
Aluminum Industry - General -- Ores, Extraction of Alumina and Aluminum -- Melting, Casting, and Foundry -- Physical and Mechanical Metallurgy --Business Information -- Extractive Metallurgy --Metalworking, Fabrication, and Finishing --Engineering Properties and Tests -- Quality Control and Tests -- End Uses of Aluminum -- Aluminum Intermetallics -- Patents.
The AIA database includes information abstracted from approximately 2,300 scientific and technical journals, patents, government reports, conference proceedings, dissertations, books, and other publications.
ENVIROLINE
Dates Covered
January 1, 1971 to the present.
File Size
165,000 records as of 10/93.
Update Frequency
Monthly.
ENVIROLINE covers the world's environmental related information. It provides indexing and abstracting coverage of more than 1,000 international primary and secondary publications reporting on all aspects of the environment. These publications highlight such fields as management, technology, planning, law, political science, economics, geology, biology, and chemistry as they relate to environmental issues.
Air Pollution -- Environmental Design & Urban Ecology -- Energy -- Environmental Education -- Food and Drugs -- General Environmental Topics --International Environmental Topics -- Land Use & Pollution -- Noise Pollution -- Non-Renewable Resources -- Oceans and Estuaries -- Population Planning & Control -- Radiological Contamination --Renewable Resources -- Terrestrial -- Water --Toxicology & Environmental Safety -- Transportation -- Waste Management -- Water Pollution -- Weather Modification & Geophysical Change -- Wildlife.
ENVIROLINE draws material from over 1,000 scientific, technical, trade, professional, and general periodicals; conference papers and proceedings; government documents; industry reports; newspapers; and project reports.

EXHIBIT 2-3 (Continued)
SUMMARY OF ON-LINE DATABASES SEARCHED
Databases Description Subjects Covered Sources
POLLUTION ABSTRACTS
Dates Covered
1970 to the present.
File Size
185,551 records as of 1/93.
Update Frequency
Bimonthly.
POLLUTION ABSTRACTS is a leading resource for references to environmentally related literature on pollution, its sources, and its control.
Air Pollution -- Environmental Action -- Freshwater Pollution -- Land Pollution -- Marine Pollution -- Noise -- Radiation -- Sewage and Wastewater Treatment --Toxicology and Health -- Waste Management.
References in POLLUTION ABSTRACTS are drawn from approximately 2,500 primary sources from around the world, including books, conference papers/proceedings, periodicals, research papers, and technical reports.
ENVIRONMENTAL BIBLIOGRAPHY
Dates Covered
1973 to the present.
File Size
451,702 records as of 1/93.
Update Frequency
Bimonthly (4,000 records per update).
ENVIRONMENTAL BIBLIOGRAPHY provides access to the contents of periodicals dealing with the environment. Coverage includes periodicals on water, air, soil, and noise pollution, solid waste management, health hazards, urban planning, global warming, and many other specialized subjects of environmental consequence.
Air -- Energy -- Human and Animal Ecology -- Land Resources -- Nutrition and Health -- Water Resources.
More than 400 of the world's journals concerning the environment are scanned to create ENVIRONMENTAL BIBLIOGRAPHY.

EXHIBIT 2-3 (Continued)
SUMMARY OF ON-LINE DATABASES SEARCHED
Databases Description Subjects Covered Sources
GEOREF
Dates Covered
1785 to the present (North American material). 1933 to the present (worldwide material).
File Size
1,818,777 records as of 1/93.
Update Frequency
Monthly (approximately 6,700 records per update).
GEOREF, the database of the American Geological Institute (AGI), covers worldwide technical literature on geology and geophysics. GEOREF corresponds to the print publications Bibliography and Index of North American Geology, Bibliography of Theses in Geology, Geophysical Abstracts, Bibliography and Index of Geology Exclusive of North America, and the Bibliography and Index of Geology. GEOREF organizes and indexes papers from over 3,500 serials and other publications representative of the interests of the twenty professional geological and earth science societies that are members of the AGI.
Areal Geology -- Economic Geology -- Energy Sources -- Engineering Geology -- Environmental Geology -- Extraterrestrial Geology -- Geochemistry --Geochronology -- Geomorphology -- Geophysics --Hydrology -- Marine Geology -- Mathematical Geology -- Mineralogy -- Mining Geology --Paleontology -- Petrology -- Seismology --Stratigraphy -- Structural Geology -- Surficial Geology.
GEOREF is international in coverage with about 40 percent of the indexed publications originating in the United States and the remainder from outside the U.S. Publications of international organizations represent about 7 percent of the file. The database includes coverage of over 3,500 journals as well as books and book chapters, conference papers, government publications, theses, dissertations, reports, maps, and meeting papers.
MATERIALS BUSINESS FILE
Dates Covered
1985 to the present.
File Size
83,228 records as of 1/93.
Update Frequency
Monthly.
MATERIALS BUSINESS FILE covers technical and commercial developments in iron and steel, nonferrous metals, composites, plastics, etc. Over 1,300 publications including magazines, trade publications, financial reports, dissertations, and conference proceedings are reviewed for inclusion. Subjects covered are grouped into nine categories: 1) Fuel, Energy Usage, Raw Materials, Recycling; 2) Plant Developments and Descriptions; 3) Engineering, Control and Testing, Machinery; 4) Environmental Issues, Waste Treatment, Health and Safety; 5) Product and Process Development; 6) Applications, Competitive Materials, Substitution; 7) Management, Training, Regulations, Marketing; 8) Economics, Statistics, Resources, and Reserves; and 9) World Industry News, Company Information, and General Issues.
Fuel, Energy Usage, Raw Materials, Recycling -- Plant Developments and Descriptions -- Environmental Issues, Waste Treatment, Health and Safety -- Product and Process Development -- Applications, Competitive Materials, Substitution -- Management, Training, Regulations, Marketing -- Economics, Statistics, Resources, and Reserves -- World Industry News, Company Information, and General Issues.
Each month over 1,300 magazines, trade publications, journals, financial reports, dissertations, and conference proceedings are reviewed and abstracted from worldwide sources.

EXHIBIT 2-4
KEYWORDS AND SEARCH STRATEGY
Industrial Sector with
Keywords
Waste with -- or --
Residue -- or --
Wastewater -- or --Sludge -- or --Slag
-- or --Dust
-- or --Blowdown
Modifiers
Characteristics -- or --
Composition -- or --
Properties -- or --
Recovery -- or --
Recycling -- or --
Reduction -- or --
Generation -- or --
Management -- or --
Treatment
Finally, as part of the electronic literature search, we queried the Chemical Economics Handbook (CEH) database prepared by SRI International and last updated in February 1994. Due to the high cost of using the database (i.e., $85 per record -- each chemical is divided into numerous records -- and $3 per minute of on-line time), we only attempted to retrieve information on the following ten commodities for which published information is extremely limited or absent:
C Arsenic Acid C Rare EarthsC Asphalt (natural) C RubidiumC Ferroalloys (all of them) C Tantalum/ColumbiumC Manganese C Waxes (mineral)C Pyrobitumens C Zirconium/Hafnium
Limited process information was available only for ferroalloys, manganese, rare earths, waxes (natural), and zirconium/hafnium.
B.3 Contacts with Bureau of Mines
EPA contacted commodity experts at the U.S. Bureau of Mines in an attempt to collect up-to-date information on the names and locations of the facilities within each mineral sector. We also attempted to obtain process and waste characterization information; however, only a limited number of commodity specialists were able to provide such technical information. We present below in Exhibit 2-5, a listing of the Bureau of Mines personnel contacted by EPA.

EXHIBIT 2-5
LIST OF PERSONAL COMMUNICATIONS
Contacts Telephone Nos. Commodity Sectors
John Blossom 202-501-9435 Molybdenum Rhenium
Larry Cunningham 202-501-9443 Columbium (niobium) Tantalum
Joseph Gambogi 202-501-9390 Zirconium/Hafnium
James Hedrick 202-501-9412 Cerium Lanthanides Rare Earths Scandium
Henry Hillard 202-501-9429 Vanadium
Steve Jasinski 202-501-9418 Mercury Selenium Tellurium
Thomas Jones 202-501-9428 Manganese
Deborah Kramer 202-501-9394 Beryllium
Peter Kuck 202-501-9436 Cadmium
Roger Loebenstein 202-501-9416 Arsenic Acid Platinum Group Metals
John Lucas 202-501-9417 Gold
Phyllis Lyday 202-501-9405 Bromine Iodine
McCaulin 202-501-9426 Antimony
Dave Morris 202-501-9402 Elemental Phosphorus Phosphoric Acid
Joyce Ober 202-501-9406 Lithium
John Papp 202-501-9438 Chromium Ferrochrome
Ferrochrome-silicon
Robert Reese 202-501-9413 Cesium Rubidium
Silver
Erol Sehnke 202-501-9421 Alumina Aluminum Germanium
Gerald Smith 202-501-9431 Tungsten

B.4 Review of Outside Data/Reports
In light of both the significant changes in the regulatory status of many of these wastes and the passing of several years since the 1991 ANPRM was published, EPA also reviewed several additional information sources:
C Sampling Data from EPA's Office of Research and Development
C Data from the Effluent Guidelines from the Office of Water
C Survey Data contained in the 1990 Report to Congress
C Publications from the Bureau of Mines, Randol Mining Directory, and other Industrial Directories and Sources
C Files available form the Waste Treatment Branch and the Special Wastes Branch in OSW
C Industry Profiles
C Comments and Information received through the 1991 ANPRM
to (1) determine which industrial commodities and waste streams are still generated today and (2) identify new commodities and/or waste streams that should be added to the existing universe.
EPA also queried the 1991 Biennial Reporting System (BRS) for waste generation and management information on 34 mineral processing-related Standard Industrial Classification (SIC) numbers. Specific information requested included:
- RCRA Facility Identification No. - Facility Name - Location (City & State) - Origin Code - Source Code - Form Code - Waste Volume - On-site/Off-site Management - EPA Hazardous Waste ID No.(s)
As shown in Exhibit 2-6, the 1991 BRS contained data for 24 of the 34 mineral processing-related SIC numbers (71 percent). We note that several of these SICs encompass a wide variety of mineral/inorganic chemical products. For example, SIC 2819 represents "Industrial Inorganic Chemicals, Not Elsewhere Classified," which includes more than 170 products ranging from activated carbon, alkali metals, and alumina to tin salts, water glass, and zinc chloride. Although some of these materials are outside the scope of primary mineral processing, there was no effective way to screen these products from the BRS search.
Also shown in Exhibit 2-6 is the relative ranking of the quantity of available information contained in the BRS (1 being the greatest and 24 being the smallest). The top five SIC number categories are:
C SIC 2819 - Industrial Inorganic Chemicals, Not Elsewhere Classified;
C SIC 3312 - Blast Furnaces (including Coke Ovens), Steel Works, and Rolling Mills;
C SIC 3334 - Primary Smelting and Refining of Aluminum;
C SIC 2812 - Alkalies and Chlorine; and
C SIC 3339 - Primary Smelting and Refining of Nonferrous Metals, Not Elsewhere Classified.

EXHIBIT 2-6
SUMMARY OF SIC CODES SEARCHED IN THE 1991 BRS
SIC Code INDUSTRIAL COMMODITY SECTOR REPORTED IN 1991 BRS
RANK IN BRS
1011 Iron Ores Yes 8
1021 Copper Ores Yes 7
1031 Lead and Zinc Ores Yes 19
1041 Gold Ores Yes 9
1044 Silver Ores Yes 17
1051 Bauxite and Other Aluminum Ores No -
1061 Ferroalloy Ores, Except Vanadium Yes 22
1092 Mercury Ores No -
1094 Uranium-Radium-Vanadium Ores Yes 21
1099 Metal Ores Not Elsewhere Classified Yes 16
1446 Industrial Sand Yes 20
1452 Bentonite No -
1453 Fire Clay No -
1455 Kaolin and Ball Clay No -
1459 Clay, Ceramic, and Refractory Minerals, Not Elsewhere Classified
No -
1472 Barite Yes 15
1473 Fluorspar No -
1474 Potash, Soda, and Borate Minerals Yes 23
1475 Phosphate Rock Yes 14
1477 Sulfur No -
1479 Chemical and Fertilizer Mineral Mining, Not Elsewhere Classified
Yes 24
1499 Miscellaneous Nonmetallic Minerals, Not Elsewhere Classified
Yes 10
2812 Alkalies and Chlorine Yes 4
2819 Industrial Inorganic Chemicals, Not Elsewhere Classified Yes 1
2874 Phosphatic Fertilizers Yes 12
3274 Lime Yes 18
3295 Minerals and Earths, Ground or Otherwise Treated Yes 13
3312 Blast Furnaces (Including Coke Ovens), Steel Works, and Rolling Mills
Yes 2

EXHIBIT 2-6 (Continued)
SUMMARY OF SIC CODES SEARCHED IN THE 1991 BRS
SIC Code INDUSTRIAL COMMODITY SECTOR REPORTED IN 1991 BRS
RANK IN BRS
3313 Electrometallurgical Products Yes 6
3331 Primary Smelting and Refining of Copper Yes 11
3332 Primary Smelting and Refining of Lead No -
3333 Primary Smelting and Refining of Zinc No -
3334 Primary Smelting and Refining of Aluminum Yes 3
3339 Primary Smelting and Refining of Nonferrous Metals, Not Elsewhere Classified
Yes 5
It is not surprising that the above SIC number categories comprise the top five because these industries are (1) known to generate listed hazardous wastes such as K061, K062, K064, K065, K066, K071, K088, K090, K091, and K106, and (2) are SICs that encompass a wide variety of mineral/inorganic chemical products. The lack of information for the other mineral processing related wastes may be explained by the age of the data evaluated. Specifically, the most recent data available at the time of the original analysis were from the 1991 Biennial Reports. Thus, at that time many of the respondents (and potential respondents) might not yet have been required to manage their mineral processing-derived wastes as if they were no longer considered "high volume, low toxicity wastes."
Although EPA did not perform an exhaustive review and analysis of the BRS reports, it appears as though the bulk of the records contained in the BRS appear to be related to non-mineral processing activities (e.g., painting wastes, laboratory wastes, used oil, discarded chemicals, and cleaning/degreasing wastes). The BRS does, however, contain limited information on production-derived wastes, product filtering wastes, spent process liquids, routine cleaning wastes, and wastes from rinsing operations (flushing, dipping, and spraying). The typical types of wastes include:
C Halogenated and non-halogenated solvents; C Caustics with inorganics; C Thinners and petroleum distillates; C Reactive sulfide and salts; C Other halogenated and non-halogenated organic C Other inorganic sludges;
solids; C Air pollution control wastes; C Asbestos solids and debris; C Solvent extraction wastes; and C Caustics with inorganics and cyanide; C Spent acids.
Much of the information reported is for listed hazardous wastes. For example, within the SIC 3312 classification, the following EPA Hazardous Waste Identification Numbers were used at least once (but not at every facility):
D001 D028 F008 P119 D002 D029 F012 U002 D003 D030 K060 U012 D004 D032 K061 U019 D005 D034 K062 U044 D006 D035 K087 U080 D007 D036 P010 U144 D008 D038 P012 U154
D009 D039 P022 U159 D010 D040 P029 U161 D011 F001 P030 U196 D018 F002 P039 U201 D019 F003 P048 U210 D021 F004 P098 U211 D022 F005 P104 U218 D026 F006 P105 U220 D027 F007 P106 U239
Lastly, although we did not perform a rigorous analysis, it seems that most of the reported wastes were managed off-site. Treatment/disposal options for wastes that were reportedly managed on-site included wastewater treatment, discharge to a publicly owned treatment works (POTW), incineration, deep-well injection, stabilization and land disposal, and materials (e.g., metals) recovery.
After an exhaustive search through both the publicly available and Agency-held information sources, EPA assembled and organized all of the collected information by mineral commodity sector.
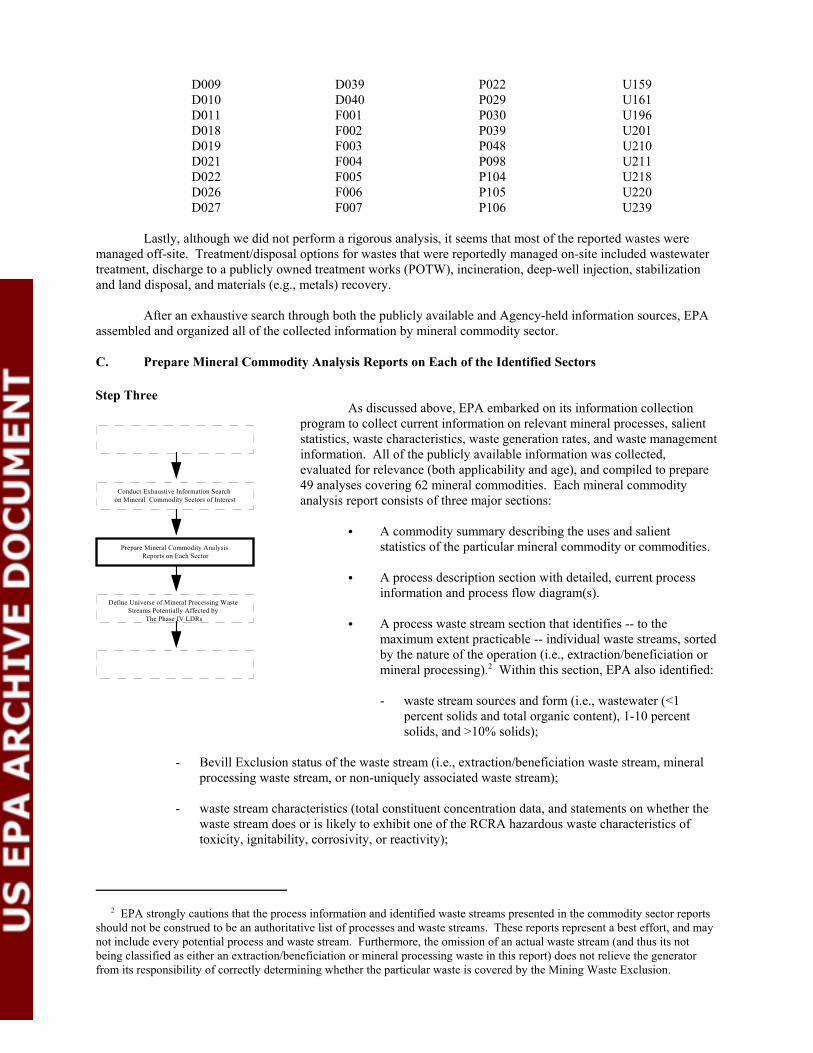
C. Prepare Mineral Commodity Analysis Reports on Each of the Identified Sectors
Step Three
Conduct Exhaustive Information Search on Mineral Commodity Sectors of Interest
Prepare Mineral Commodity Analysis Reports on Each Sector
Define Universe of Mineral Processing Waste Streams Potentially Affected by
T e hase IV LDRs Ph
As discussed above, EPA embarked on its information collection program to collect current information on relevant mineral processes, salient statistics, waste characteristics, waste generation rates, and waste management information. All of the publicly available information was collected, evaluated for relevance (both applicability and age), and compiled to prepare 49 analyses covering 62 mineral commodities. Each mineral commodity analysis report consists of three major sections:
C A commodity summary describing the uses and salient statistics of the particular mineral commodity or commodities.
C A process description section with detailed, current process information and process flow diagram(s).
C A process waste stream section that identifies -- to the maximum extent practicable -- individual waste streams, sorted by the nature of the operation (i.e., extraction/beneficiation or mineral processing).2 Within this section, EPA also identified:
- waste stream sources and form (i.e., wastewater (<1 percent solids and total organic content), 1-10 percent solids, and >10% solids);
- Bevill Exclusion status of the waste stream (i.e., extraction/beneficiation waste stream, mineral processing waste stream, or non-uniquely associated waste stream);
- waste stream characteristics (total constituent concentration data, and statements on whether the waste stream does or is likely to exhibit one of the RCRA hazardous waste characteristics of toxicity, ignitability, corrosivity, or reactivity);
2 EPA strongly cautions that the process information and identified waste streams presented in the commodity sector reports should not be construed to be an authoritative list of processes and waste streams. These reports represent a best effort, and may not include every potential process and waste stream. Furthermore, the omission of an actual waste stream (and thus its not being classified as either an extraction/beneficiation or mineral processing waste in this report) does not relieve the generator from its responsibility of correctly determining whether the particular waste is covered by the Mining Waste Exclusion.

- annual generation rates (reported or estimated);
- management practices (e.g., tank treatment and subsequent NPDES discharge, land disposal, or in-process recycling); and
- whether the waste stream was being (or could potentially be) recycled, and thus be classified as either as a sludge, by-product, or spent material.
The collection and documentation of the commodity summary and process description sections of the mineral commodity analysis reports was relatively straightforward and involved little interpretation on the part of EPA. However, the preparation of the process waste stream sections of the mineral commodity analysis reports required extensive analysis and substantive interpretation of the publicly available information by the Agency. The process used by EPA to develop descriptions of waste stream sources, form, characteristics, management, and recyclability is described below.
C.1 Bevill-Exclusion Status
Determining the Special Waste Status of Mineral Industry Wastes
EPA used the Agency's established definitions and techniques for determining which operations and waste streams might be subject to LDR standards. EPA decisions concerning whether individual wastes are within the scope of the RCRA Mining Waste Exclusion are based upon a number of different factors. The Agency examines these factors in sequence, in such a way as to yield unambiguous and consistent decisions from site to site and across all regions of the country. The basic thought process is illustrated conceptually in the flow diagram presented on the next page (Exhibit 2-7).
By resolving the basic questions posed in this diagram in step-wise fashion, persons should be able to generally understand the special waste status of any individual mineral production waste. The steps in this process are outlined below. The sequence of these steps is very important, as the need for proceeding to the next step is determined by the answer to the question posed in the current step. Of particular importance is determining the point at which mineral processing first occurs; all wastes generated after that initial processing step are considered processing wastes or downstream manufacturing wastes.
EPA's evaluation sequence proceeds as follows:
C Ascertain whether the material is considered a solid waste under RCRA.
C Determine whether the waste is generated by a primary mineral production step, and, more generally, whether or not primary production occurs in the sector/within a process type.
C Establish whether the waste and the operation that generates it are uniquely associated with mineral production.
C Determine whether the waste is generated by a mineral extraction, beneficiation, or processing step.
C Check to see whether the waste, if it is a processing waste, is one of the 20 special wastes from mineral processing. This analytical sequence results in one of three outcomes:
(1) the material is not a solid waste and hence, not subject to RCRA;

EXHIBIT 2-7Process Summary for Mining Waste Exclusion Determinations
Material in Question
Solid Waste?
G enerated by Prim ary M ineral
Production?
Uniquely A ssociated
w ith M ineral Production?
Generated Downstream of
Initial Processing O peration?
Generated by E xtraction or
Beneficiation O peration?
Exem pt from RCRA Subtitle C
One of the 20 Special M ineral
Processing Wastes?
Generated by Processing
O peration?
Reclaim ed With N o Land
Storage?
Not Covered by the M ining
Waste E xclusion (See Exhibit 3-9)
N ot Subject to RCRA
No
No
No
No
No
No
No
No
Yes
Yes
Yes
Yes
Yes
Yes
Yes
(e.g., spent solvents, used oil, lab w astes)
(e.g., alloying wastes, chem ical m anufacturing wastes)
Yes

(2) the material is a solid waste but is exempt from RCRA Subtitle C because of the Mining Waste Exclusion; or
(3) the material is a solid waste that is not exempt from RCRA Subtitle C and is subject to regulation as a hazardous waste if it is listed as a hazardous waste or it exhibits any of the characteristics of hazardous waste.3
General Considerations
The first step in evaluating whether or not wastes produced by a facility are excluded from RCRA Subtitle C regulation is to establish whether primary mineral production takes place at the facility. The Mining Waste Exclusion does not apply to secondary production of mineral commodities; wastes from scrap recycling, metals recovery from flue dust, and similar activities have always been subject to Subtitle C regulation if these wastes exhibit hazardous characteristics or are listed hazardous wastes (as some are).
Primary mineral production operations are defined as those using at least 50 percent ores, minerals, or beneficiated ores or minerals as the feedstock(s) providing the mineral value. In addition, the Exclusion is limited in scope to wastes from the extraction, beneficiation, and processing of ores and minerals; it does not extend to alloying or to downstream chemical manufacturing, metal casting or fabrication, or other activities that use a saleable commodity (e.g., carbon steel, cathode copper, titanium tetrachloride, merchant grade phosphoric acid) as the primary raw material.
It may, therefore, be possible to establish easily and quickly that a particular facility and its wastes are not eligible for special waste status. If primary mineral production does not occur at the facility, then, by definition, the Mining Waste Exclusion does not apply to any of the wastes that the facility generates. The key questions that arise here are, "What does this facility produce?" and "From what?" If the facility does not produce intermediate or final mineral commodities from a raw material mix containing at least 50 percent ores, minerals, or beneficiated ores or minerals, then no wastes generated at the site are eligible for the Exclusion, and the facility (and its wastes) has the same RCRA status as that of any other industrial plant.
If (and only if) it has been determined by EPA that primary mineral production occurs at a particular facility, then the analytical focus can shift to specific operations, materials, and waste streams.4 In that instance, the next logical question is whether or not the material in question is a solid waste. If the material is not a solid waste, then the question of whether the Mining Waste Exclusion applies will be irrelevant, because RCRA requirements will not apply to that material. In general, EPA's position has always been that materials that are discarded or are managed in a waste-like manner (e.g., placed on the ground) are solid wastes and subject to RCRA. This policy is amplified and tailored to the particular circumstances found in the minerals industry in today’s final rule. EPA is today establishing a conditional exclusion from the definition of solid waste for secondary materials from mineral processing that are recycled; the conditions for the exclusion are no land placement of the materials5, legitimate recovery of metals, water, acid, and/or cyanide values, and no speculative accumulation of secondary materials. A one-time notification also is required. EPA recognizes that establishing whether a material is a solid waste may be difficult, but believes that this determination needs to be made so that the regulatory status of the material in question can be ascertained.
3 RCRA Subtitle C regulations define toxicity as one of the four characteristics of a hazardous waste. EPA uses the Toxicity Characteristic Leaching Procedure (TCLP) to assess whether a solid waste is a hazardous waste due to toxicity. In today’s final rule, EPA is reinstating the application of the TCLP to mineral processing wastes in response to a Court remand. For further discussion, see the preamble to today’s final rule.
4 Because of the confusion regarding the scope of the Mining Waste Exclusion that has occurred in the past, EPA believes that it is important to clarify its long-standing position that the Exclusion applies to wastes, not to facilities. Therefore, it must be understood that claims that a particular facility is "exempt" from regulation under Subtitle C because of the Bevill Amendment are inaccurate; the applicability of the Exclusion is judged "one waste at a time."
5 Site-specific waivers of the land placement prohibition may be obtained from delegated state agencies for storage of solid (i.e., no free liquids) materials on concrete or asphalt pads, provided that run-on/run-off controls are installed, fugitive dust is controlled, and all of these constituent release controls are maintained properly.

Once it has been determined that a material is a solid waste generated by a facility engaged in primary mineral production, the more difficult questions concerning whether the waste is excluded from Subtitle C requirements may be tackled. In evaluating whether a particular solid waste is or is not covered by the Mining Waste Exclusion, EPA starts at the beginning of the production sequence, i.e., where the ores or minerals are in their most impure form, and focuses on the operations in the production sequence that are directly involved in producing the mineral commodity. It is very important to follow the sequence of production operations carefully. The same activities, occurring at different points in the production sequence, may generate wastes that are classified very differently under the Mining Waste Exclusion.
It is worth emphasizing that only wastes that are “uniquely associated” with primary mineral production operations are eligible for special waste status. All other types of wastes are not eligible for special waste status, even if they are generated and/or managed at a mineral production site, and even if that site generates some wastes that are defined as special wastes. This "uniquely associated" concept is discussed in greater detail in the next section.
It is also worthy of note that spills of certain materials require prescribed actions on the part of the facility operator. If the spilled substance has a Reportable Quantity (RQ) limit and that limit is exceeded, then the facility operator must report the incident to the appropriate regulatory authority.6 This requirement has been established by EPA pursuant to the Comprehensive Environmental Response, Compensation, and Liability Act (CERCLA); accordingly, it is not affected by the Mining Waste Exclusion to RCRA. That is, exempt status (or even the question of whether a material is a solid waste) has no bearing on whether or not the spill reporting requirements must be met.
The Uniquely Associated Concept - "Indigenous" to Mineral Production or Not?
As mentioned earlier, in order for a waste generated at a mineral production site to be eligible for special waste status, it must be "uniquely associated" with the extraction or beneficiation of ores and minerals and with certain processing wastes. The Agency believes that the following summary of the uniquely associated concept can enable persons to understand the required site-specific decisions unambiguously:
(1) Uniquely associated mineral production wastes originate from, and obtain all or substantially all of their chemical composition through direct contact with, ores, minerals, or beneficiated ores or minerals;
(2) Operations that generate uniquely associated wastes are restricted to those that serve to remove mineral values from the ground, concentrate or otherwise enhance their characteristics, remove impurities, or are part of a sequence leading to the production of a saleable mineral product; and
(3) Wastes from all ancillary operations (e.g., vehical maintenance shop) taking place at mineral extraction, beneficiation, and processing sites are not uniquely associated.
This concept has been a central part of EPA's interpretation of the Bevill Amendment since the Agency's first response to Congressional directives was published in 1980 and is illustrated in the example provided in Highlight 1. In this notice, EPA stated that
[T]his exclusion does not, however, apply to solid wastes, such as spent solvents, pesticide wastes, and discarded commercial chemical products, that are not uniquely associated with these mining and allied processing operations,
Highlight 1. L u b r icat ion W a s t e s and Chemical Spills
EPA reviewed the claims of a company in the minerals industry in 1992, regarding the regulatory status of several wastes generated at its lanthanide production facility. ong the wastes discussed were pinion gear grease and residues from cleanup of spills of clean solvents that are used in solvent extraction operations. at these wastes were not uniquely associated with ineral beneficiation, or processing operations, and thus, were not excluded wastes. EPA based this conclusion on the fact that these wastes do not originate from, and do not obtain their chemical composition primarily through direct contact with, ores, minerals, or beneficiated ores or minerals.
Am
EPA concluded thm extraction,
6 Reportable quantity substances, limits, and requirements may be found at 40 CFR Part 301.

or cement kiln operations. Therefore, should either industry generate any of these non-indigenous wastes and the waste is identified or listed as hazardous under Part 261 of the regulations, the waste is hazardous and must be managed in conformance with the Subtitle C regulations. (45 FR 76619, November 19, 1980)
The Agency further stated at 54 FR 36616 (September 1, 1998) that:
“Congress intended to put within the regulatory exclusion only wastes generated as a consequence of exploiting a natural resource, not wastes from other industrial activities, even if both occur at the same facility”.
EPA reiterated the “non uniquely associated” standard in the 1989 Final Bevill Rule:
[T]he Agency finds no compelling reason to provide exemptions for particular small volume wastes that may be associated with mineral processing operations, such as cleaning wastes. Many other industrial operations also generate such wastes, and EPA does not believe that the fact that current management involving co-management justifies continued regulatory exclusion...
The Agency has repeatedly applied the uniquely associated concept to delineate the boundaries of the Mining Waste Exclusion since that time, and it remains a key determinant of whether or not a particular waste should be afforded exclusion from RCRA Subtitle C. In fact, EPA addressed this issue at length in the preambles to its final rules establishing the boundaries of the Mining Waste Exclusion for mineral processing wastes.
Mineral extraction, beneficiation, and processing facilities usually generate some wastes that are not unique to mineral production, some of which may exhibit characteristics of hazardous waste. It is critical to understand that such wastes are not and have never been exempt from regulation as hazardous wastes under RCRA Subtitle C. To the extent that any such materials are solid wastes and are listed or exhibit characteristics of hazardous wastes, they must be managed as hazardous wastes, i.e., in accordance with the standards found at 40 CFR Parts 261-264 or analogous state requirements.
The Agency believes that it is appropriate to evaluate whether a particular waste is uniquely associated with mining and mineral processing as follows:
(1) Any waste from ancillary operations are not “uniquely associated” because they are not properly viewed as being “from” mining or mineral processing;
(2) In evaluating wastes from non-ancillary operations, one must consider the extent to which the waste originates or derives from processes that serve to remove mineral values from the ground, concentrated or otherwise enhance their characteristics or remove impurities; and
(3) The extent to which the mineral recovery process imparts its chemical characteristics to the waste. Under this test, the greater the extent to which the waste results from the mineral recovery process itself, and the more the process imparts to the waste its chemical characteristics, the more likely the waste is “uniquely associated.”
The Agency believes that this approach provides a reasonable basis to determine whether a waste is “uniquely associated.”
The Agency believes that these factors touch on the full range of facts that are likely to be relevant in any particular case. As is evident from the criteria summarized above, judgment must be exercised where the question is whether a waste from a non-ancillary operation is uniquely associated. EPA believes that this is appropriate because of the fact-specific nature of this determination and the myriad circumstances that can arise. However, as noted above, the Agency believes that wastes generated from ancillary operations (such as truck maintenance shops at a mine and not from the mining or mineral recovery process itself), are not uniquely associated. Such circumstances would likely present the most readily identifiable cases of non-uniquely associated wastes.
The approach noted above reflects the longstanding principle, based on the clear language in Section 3001 of RCRA, that uniquely associated wastes must result from mining and mineral processes themselves. This

approach also is generally consistent with industry’s underlying contention that the uniquely associated concept should exempt wastes that are “indigenous” to mining. EPA disagrees, however, with industry’s contention that uniquely associated wastes are any wastes that are unavoidably generated by mining operations.
Examples of non-exempt wastes that may be found at mineral extraction, beneficiation, and/or processing sites, and that may be subject to regulation if they are listed as hazardous wastes or exhibit characteristics of hazardous waste, include (but are not limited to) the following:
C Cleaning wastes (e.g., spent solvents);
C Used oil and antifreeze from motor vehicles and equipment;
C Wastes from automotive and equipment maintenance shops;
C Pesticide, painting, and other chemical product wastes;
C Off-specification products;
C Spills (including contaminated soil) of any material outside of the primary mineral commodity production process, including unused beneficiation or processing reagents (e.g., sodium cyanide);
C Laboratory wastes (e.g., cupels, spent or contaminated reagents);
C Certain types of wastewater treatment sludges.7
Evaluating whether or not a particular waste is uniquely associated with primary mineral production operations should be straightforward in most cases. The key concept to bear in mind is that the composition and chemical characteristics of uniquely associated wastes are determined, or at least heavily influenced, by whether they are generated from resources that serve to remove or concentrate mineral values. Accordingly, wastes generated by generic industrial activities (e.g., vehicle or machinery operation, maintenance, or cleaning), laboratory operations, painting, pesticide application, and plant trash incineration, among others, are not uniquely associated and therefore, are not eligible for the Mining Waste Exclusion. In addition, discarded, spilled, or off-specification chemicals are ineligible for the same reason. (See Highlight 2.)
Finally, as a practical matter, the uniquely associated question is critical only in determining the exempt status of wastes from extraction and beneficiation operations. All mineral processing wastes except for the 20 specific wastes listed at 40 CFR Part 261.4(b)(7) have been removed from the scope of the Exclusion through formal
rulemaking procedures. Therefore, all solid wastes produced by mineral processing operations (except the 20 specific wastes) are either not uniquely associated or were removed from the Exclusion through rulemaking. In either case, such wastes are not covered by the Mining Waste Exclusion.
Highlight 2. Off-Specification Products
In response to an inquiry related to the special waste status of several materials generated at a facility that produces boron and related products from brines, in 1992 EPA stated, "The Bevill Exclusion does not apply to solid wastes such as discarded commercial chemicals; they are not uniquely associated with mineral extraction, beneficiation, or processing. Discarded commercial chemicals include finished mineral-derived products that are generated at these plants but found to be off-specification and, thus, are discarded. Other wastes not uniquely associated with mineral extraction, beneficiation, or processing include many cleaning wastes (such as spent commercial solvent that was used in cleaning production vessels) and used lubricating oils."
Consequently, the need to determine whether a waste is or is not uniquely associated is limited to operations in the upstream end of the production sequence, which is generally simpler and easier to understand from a
7 Only sludges resulting from mineral extraction and beneficiation operations plus the 20 exempt mineral processing wastes are covered by the exclusion; all other treatment sludges are not exempt under the Mining Waste Exclusion.

conceptual standpoint than downstream processing and/or manufacturing operations. The issue of where the "line"between beneficiation and processing lies and how this line is applied to individual mineral production facilities is discussed below.
Definitions of Beneficiation and Processing - Finding the Line
Once it has been established that extraction, beneficiation, and/or processing occurs at a particular facility and that the facility generates wastes that are uniquely associated with minerals production, the next question is whether mineral processing activities (as distinct from extraction or beneficiation) occur on site, and if so, whether these activities generate solid wastes that are subject to RCRA Subtitle C. The distinction between extraction/ beneficiation and processing is critical because all wastes that are uniquely associated with extraction and beneficiation operations are excluded from Subtitle C, while only 20 specific mineral processing wastes are exempt from Subtitle C requirements under the Mining Waste Exclusion.
In response to a 1988 Federal Appeals Court decision, EPA has developed explicit regulatory definitions of mineral beneficiation and processing, which are articulated in two final rules published in 1989 and 1990. As a consequence, when considering the regulatory status of wastes generated by a particular facility, EPA no longer relies upon pre-September, 1989 EPA notices, correspondence, or other guidance. (See Highlight 3) As delineated in the final rule published on January 23, 1990 (55 FR 2322),8 beneficiation of ores and minerals includes and is restricted to a set of discrete activities that are generally performed in a predictable sequence, while processing of ores, minerals, and beneficiated ores and minerals is defined by a set of attributes rather than by specific activities.9 Moreover, processing wastes were evaluated using specific quantitative criteria to determine whether
Highlight 3. Decisions on Regulatory Status Made Prior to September 1, 1989 Must be Reevaluated and Should not be Relied Upon
In 1985, EPA was asked to clarify the special waste status of leachate derived from certain smelter wastes. ecause at that time smelter wastes were considered to be special wastes (and thus, excluded from Subtitle C regulation under the Mining Waste Exclusion) and because wastes derived from special wastes were also deemed special wastes, EPA concluded that leachate from smelter slag and pyritic cinders (the smelter wastes in question) were covered by the Mining Waste Exclusion and, accordingly, were exempt from regulation under RCRA Subtitle C. Subsequently, however, the scope of the Exclusion for mineral processing wastes (such as those from smelting) was narrowed considerably, to a list of 20 specific high volume, low hazard solid wastes. astes derived from these 20 wastes (or any other processing wastes, for that matter) were explicitly removed from the scope of the Exclusion in 1989 and 1990 (54 FR 36623). earlier findings notwithstanding, leachates and other wastes derived from any mineral processing wastes are not excluded from RCRA Subtitle C regulation under the Mining Waste Exclusion, unless they are one of the 20 wastes listed in Figure 1-1, above.
B
W
That is, EPA's
they were of high volume and low hazard, and thus, eligible for special waste status.
Residues arising from treatment of extraction or beneficiation wastes (e.g., sludge from treatment of acid mine drainage) are also excluded from regulation. In contrast, treatment residues of mineral processing wastes are not eligible for the Exclusion unless they are one of the 20 wastes identified during the rulemaking process, because no such additional treatment residues were found to meet the special waste criteria (high volume and low hazard) during the rulemaking process. One important additional point concerns the mixing of excluded and hazardous, non-excluded wastes; this practice is generally subject to Subtitle C regulation and is addressed below.
EPA has emphasized that operations following the initial "processing" step in the production sequence are also considered processing operations, irrespective of whether they involve only techniques otherwise defined as
8 The final rule establishing the definition of beneficiation was first published on September 1, 1989 (54 FR 36592). The January 23, 1990 publication includes a technical correction to the definition originally promulgated in September.
9 It is worthy of note that, as stated in the September 1, 1989 (54 FR 36592) rulemaking notice, no new special mineral processing wastes will be recognized by EPA in the future, even if particular newly generated wastes should happen to comply with the established criteria. That is, the list of 20 excluded processing wastes will not be expanded under any circumstances.

beneficiation. Therefore, solid wastes arising from such operations are considered mineral processing wastes, rather than beneficiation wastes. For that reason, a clear understanding of the mineral production sequence is vital to sound decision-making; the sequence considered extends to the operations preceding entry of the mineral value into a particular facility or portion thereof. (See Highlight 4).
Highlight 4. When "Beneficiation" Follows Processing
The primary copper industry provides an interesting illustration of the distinctions that exist between mineral beneficiation and processing. ber of active primary copper facilities, copper is recovered from ores in two different ways: dump leaching is used to solubilize copper values in mined and stockpiled low grade ores, and conventional mining, milling, flotation, smelting, and refining are used to process higher grade ores. the dump leaching operation is, in many cases, sent to electrowinning (a type of beneficiation operation), which yields purified metallic copper. In contrast, after smelting, conventional copper production yields partially purified copper, in the form of "anodes," which is then further purified in an electrolytic refining process that is functionally very similar to that used to recover copper values from the dump leaching solution. Because, however, the anode copper is produced by operations that are defined as mineral processing, wastes generated by this electrolytic refining operation are mineral processing wastes, while wastes generated by the electrowinning of copper from the dump leach solution are defined as beneficiation wastes and are excluded from Subtitle C regulation. Because wastes from refining of anode copper are not among the 20 special mineral processing wastes, they are not exempt from Subtitle C regulation. s from similar operations may be subject to different regulatory requirements, even if they are generated at the same facility, depending upon the points in the production sequence from which they arise.
At a num
Metal-bearing solution from
Thus, in this case and in others, waste stream
Defining which operations are beneficiation and which (if any) are processing can be a complex undertaking, and is best approached in a step-wise fashion, beginning with relatively straightforward questions and proceeding into more detailed examination of unit operations, as necessary. To perform this type of analysis, the level and depth of information needed on facility operations increases dramatically over that required to resolve the issues discussed above. A detailed process flow diagram, as well as information on ore type(s), the functional importance of each step in the production sequence, waste generation points and quantities, and waste management practices are the minimum data needs for locating the beneficiation/processing "line" at a given facility. Typically, EPA must obtain this information directly from the facility operator. Because mineral production operations are almost always non-linear (i.e., include internal cycling of materials), at least to some degree, the process flow diagram is probably the single piece of information that is most critical to establishing which activities are defined as beneficiation operations.
The meaning of some mineral production terms may not be readily apparent. Furthermore, minerals industry terminology is not highly standardized. Therefore, it is important to focus on the nature of individual operations in a mineral production sequence, rather than simply relying on the names or descriptions that may be applied to portions of the facility by the owner or operator.
Once the necessary information has been obtained from the facility operator, the Agency can begin an analysis to determine at what point beneficiation activities end and processing begins. As a first step, the Agency applies it's definitions of beneficiation activities. Using these definitions as a reference point, the decision-maker may then evaluate information that he/she has gathered concerning specific operations to determine whether those operations comport with Agency definitions. In EPA's experience, the following activities are generally easy to identify as beneficiation using this simple analytical process:

crushing grinding briquettingsorting sizing flotationsintering pelletizing gravity concentrationcalcining drying magnetic separationwashing filtration electrostatic separation
roasting, autoclaving, and/or chlorination10
It is useful to note that these operations share certain qualities that make them easily identifiable as beneficiation activities. Many of these operations do not generate any waste streams or effluents under typical operating conditions. To the extent that others on the list do generate wastes (e.g., flotation), such wastes generally share certain common attributes. First, the wastes typically fall into one of three general categories: 1) waste rock; 2) mill tailings; or 3) mine water. Second, the volumes of waste generated by beneficiation activities tend to be very large. Where there is doubt concerning whether a particular waste is generated by beneficiation or processing operations, the Agency finds it useful to consider whether or not the waste shares these identifying attributes.
Other mineral industry activities are more difficult to classify unambiguously as beneficiation operations. Certain beneficiation activities may bear a close resemblance to certain mineral processing operations. The lack of standard industry terminology means that beneficiation activities may be described using a mineral processing term and vice versa. Beneficiation activities that may easily be confused with processing activities are listed below. The mineral processing operations which these beneficiation operations resemble are included in parentheses.
C Amalgamation (similar to smelting)
C Crystallization (similar to chemical conversion)
C Dissolution (similar to digestion)
C Leaching (similar to digestion)
C Ion Exchange (similar to chemical conversion)
C Solvent Extraction (similar to chemical conversion)
C Electrowinning (similar to electrolytic refining)
C Precipitation (similar to chemical conversion)
As a result of the similarity of these activities to certain mineral processing operations, it is critical that the decision-maker have complete and detailed information concerning the unit operations in question in order to adequately evaluate whether they qualify as beneficiation activities. In most cases, the amount of information and the level of detail required will exceed that required for evaluating the simpler activities discussed above. In addition, the potentially complex nature of some of these operations means that more in-depth study of unit operations may be necessary before a determination can be made. Once the decision-maker has all of the relevant information needed and fully understands the unit operations involved, analysis can proceed. The decision-maker first consults Agency definitions, and then evaluates unit operations using the definitions as a reference point.
It is likely that, when evaluating facility information that includes references to these more complex operations, the state or regional decision-maker will be required to make judgment calls as to the nature of the operation. This may be particularly true in cases in which a production sequence involves the use of heat or acid (see discussion at 54 FR 36618). For example, there may be disagreement regarding whether a particular operation is "leaching" or "dissolution" (beneficiation) or is "acid attack" or "digestion" (processing). When faced with operations that cannot be classified unambiguously as beneficiation or processing activities, EPA decision-makers sometimes find that considering the following information can help them in making these difficult determinations.
C Beneficiation operations typically serve to separate the mineral value(s) from waste material, i.e., remove impurities, or otherwise improve the characteristics of the material for further refinement. Beneficiation activities do not change the mineral
10 Only in preparation for a leaching operation that does not produce a final or intermediate product that does not undergo further beneficiation or processing.

values themselves and typically include reducing (e.g., by crushing or grinding) or enlarging (e.g., pelletizing or briquetting) particle size to facilitate processing. Where heat or chemicals, such as acid, are applied in a beneficiation operation, it is generally to drive off impurities (e.g., water), dissolve mineral values in a solution as a means of separation (leaching), or to retrieve dissolved values from a solution (e.g., crystallization or solvent extraction). A chemical change in the mineral value does not typically occur.
C Processing operations, in contrast, generally follow beneficiation and serve to change the value(s) into a more useful chemical form, often by use of vigorous, even destructive, thermal or chemical reactions of the value(s) and/or waste material with fluxes or reagents. In contrast to beneficiation operations, processing activities often destroy the physical structure of the incoming ore or mineral feedstock(s), such that the materials leaving the operations do not closely resemble those that entered the operation. Examples of the differences between beneficiation and processing operations are provided in Highlights 5 and 6.
Highlight 5. "Acid Treatment" of Clay is Beneficiation
A facility produces desiccant and adsorbent products from calcium montmorillonite clay using a sequence of steps that includes crushing, drying, acid treatment, washing and filtration, drying, and sizing. from the relevant state agency in 1989, EPA reviewed the available information regarding the acid treatment operation and concluded that it is a beneficiation operation, for the following reasons: es a beneficiated ore as the primary feedstock; and (2) the acid treatment process (which substitutes protons for some aluminum, magnesium, and iron ions in the clay) does not "appear to destroy or substantially change the physical structure of the clay particles entering the operation." , the aqueous waste that results from the acid treatment operation (as well as the wastes generated by the other operations listed above) is a beneficiation waste that is exempt from hazardous waste regulation under the Mining Waste Exclusion.
Highlight 6. Bauxite Refining is Mineral Processing
Bauxite refining in the U.S. is accomplished through the use of the Bayer process, in which bauxite ore (impure hydrated aluminum oxide) is digested with a concentrated caustic (sodium hydroxide) solution under elevated temperature and pressure conditions. ields soluble sodium aluminate, which is cooled, diluted, and hydrolyzed to form insoluble aluminum hydroxide, which can then be filtered out and calcined to produce alumina (aluminum oxide). Because in the Bayer process the bauxite ore is vigorously attacked by a strong chemical agent, thereby destroying the physical structure of the mineral, and because a large percentage of the solid material entering the process is chemically altered, EPA concluded in its rulemaking activities in 1989 that this operation constitutes mineral processing, rather than beneficiation. eratures are not employed in the Bayer process, the combination of the strongly alkaline (rather than acidic) reagent and the high pressures (several times atmospheric) applied to the ore slurry are sufficient to change the chemical form of the mineral value and the physical form of the feed material stream.
In response to an inquiry
(1) it us
Consequently
This y
Even though strong acids and extreme temp
C Typically, beneficiation wastes are earthen in character and comprise a relatively high proportion of the material entering the operation. Processing wastes, on the other hand, are often very different in character from the material(s) entering the operation (i.e., are typically not earthen in character), and comprise a comparatively small proportion of the feedstock. This distinction is illustrated in Highlight 6. Waste streams that differ substantially in character or volume from the input materials are in most cases either processing wastes or wastes from downstream operations (e.g., chemical manufacturing) that are completely outside the scope of the Mining Waste Exclusion. Indeed, the generation rates and accumulated quantities of extraction and beneficiation wastes typically dwarf those of downstream, on-site processing and manufacturing operations.

If it is determined that a material is a processing waste, the EPA decision-maker checks to determine if the waste is on the list of 20 excluded wastes. If the processing waste is on that list, it is unambiguously exempt from RCRA Subtitle C hazardous waste regulations under the Mining Waste Exclusion. Any processing wastes that are not listed under the 20 excluded wastes are not covered by the Exclusion, and therefore are subject to regulations under Subtitle C, if the wastes are listed hazardous wastes or exhibit a characteristic of hazardous waste.
Active Management - Disturbing Old Wastes Can Influence Regulatory Status
EPA believes that among the positive effects of this proposal would be to encourage the “re-mining” of previously generated mineral processing wastes--that is, the excavation of such wastes from disposal sites (including remediation sites) for purposes of mineral recovery. Many of the 60 or more mine and mineral processing sites on the National Priorities List could reduce costs of remediation by remining. Such recovery would promote the statutory goals of less land disposal, increased material recovery, and also proper waste treatment (since the treatment standards for most mineral processing wastes are based on performance of High Temperature Metal Recovery processes such as smelting). The reason re-mining could be encouraged is that the previously disposed mineral processing materials would not be solid wastes once they are excavated for purposes of legitimate recovery by mineral processing or beneficiation processes, provided they satisfy the same conditions that a newly-generated secondary material from mineral processing would satisfy. See also 261.1(c)(8) (stating that a material that is speculatively accumulated need not be considered a solid waste any longer “once they are removed from accumulation for recycling”).
EPA notes further that excavation of wastes would not render the historic disposal unit subject to RCRA requirements. See 53 FR at 51444 (Dec. 21, 1988) (movement of waste from one unit to another does not subject the initial unit to land disposal restriction requirements); 55 FR at 8758 (same); Letter from Lisa K. Friedman, Associate General Counsel Solid Waste and Emergency Response Division to Richard Stoll (Sept. 5, 1990) (indicating that under the same reasoning movement of waste from one unit to another, by itself, does not trigger RCRA permitting requirements for the initial unit). EPA notes that some questions have been raised about the scope of EPA's discussion of ``active management'' in the preamble to the Sept. 1, 1989 rule. In that discussion, EPA described some activities that could subject existing waste management units containing non-Bevill wastes to Subtitle C. 55 FR at 8755; 54 FR at 36597. The 1989 preamble did not specifically address the question of whether removal of some waste from an existing unit subjects the waste remaining in the unit to Subtitle C regulation. EPA is clarifying that the Agency's position, as discussed above, is that removal of waste from such a unit does not constitute “disposal” for purposes of triggering Subtitle C regulation, and the language of the 1989 preamble, although somewhat unclear, should be read to be consistent with EPA's statements in the NCP preamble on this point.
Mixture Rule
Under today’s rule, the Agency has decided that if subtitle C hazardous waste exhibiting a characteristic is mixed with Bevill-exempt waste exhibiting the same characteristic and the mixture continues to exhibit that common characteristic, then the entire mixture should be considered to be non-exempt hazardous waste. This result is consistent with normal rules on when wastes are hazardous, which state that if a waste exhibits a hazardous waste characteristic, it remains a hazardous waste unless and until it no longer exhibits a characteristic. 261.3(d)(1). In addition, such a principle will make this rule easier to administer (should this situation actually occur), since enforcement officials will not have to parse out which portion of the waste mixture is imparting the characteristic property. Finally, the result is consistent with the overall object of today’s rule: not to let Bevill wastes be used as a means of allowing unregulated management of normal subtitle C hazardous wastes.
The Agency reiterates that the rule does not alter in any way the current Agency mixture rule. The purpose of this rulemaking is to eliminate the current Bevill mixture rule and place the mixing of hazardous wastes that may occur at mineral processing plants on the same status as all other hazardous waste management.
Illustrations of how today’s rule operates
Although the regulatory parlance for today’s rule has always been the ‘Bevill mixture rule’, the greatest practical consequence of the rule is probably on the units where mixing occurs. This is because units (i.e. tanks, impoundments, piles, landfills, etc.) where hazardous wastes are placed will (absent some exemption or exclusion other than that provided by the Bevill amendment) be regulated units, i.e. units subject to subtitle C standards for

treatment, storage, and/or disposal. This point is illustrated by the following examples, which also illustrate the effect of the rule on the resulting mixtures;
Example 1. Facility A generates F 001 listed spent solvents which it mixes with a solid waste that has Bevill exempt-status. The mixing occurs in a landfill. The landfill is a regulated unit because hazardous waste --F 001 --is being disposed in it. (Among other things, this means that the F 001 wastes could not be placed in the landfill until the LDR treatment standard is satisfied.) In addition, all of the wastes with which the F 001 wastes are mixed are hazardous wastes carrying the F 001 waste code by application of the mixture rule.
Example 1a. Same facts as in example 1, except that the waste being mixed is F 003 spent solvent, a waste listed only because it exhibits a characteristic of hazardous waste. The landfill becomes a regulated unit for the same reason as in example 1. (See Chemical Waste Management v. EPA, 976 F.2d at 20 n.4 and 24 n. 10 (placement of waste which is hazardous for any amount of time in a unit subject that unit to subtitle C regulation); 61 FR at 2352 (same). However, the status of the resulting waste mixture is determined by the principles for characteristic hazardous wastes, illustrated below.
Example 2. Facility B generates a characteristic ignitable solvent which it adds to a surface impoundment containing a Bevill-exempt waste that would exhibit the TC for lead. The resulting mixture exhibits TC for lead but is no longer ignitable. The surface impoundment is a regulated unit, since it is engaged in treatment (elimination of the ignitability characteristic) and disposal (the placement of the ignitable waste). The remaining wastes in the unit retain their Bevill-exempt status because they do not exhibit the characteristic property of the non-Bevill hazardous waste. Thus, if the waste were to be removed from the impoundment and disposed elsewhere, disposal need not occur in a regulated unit.
Example 3. Facility C generates a characteristic hazardous waste exhibiting TC for lead which it mixes in a tank with Bevill-exempt wastes which also would exhibit the TC for lead. The resulting mixture continues to be TC for lead. The tank is engaged at least in storage of hazardous waste, and possibly treatment (depending on how the D008 hazardous waste is affected by the mixing). If waste is removed from the tank, it remains subject to subtitle C because it continues to exhibit the characteristic of the non-exempt hazardous waste.
C.2 Waste Stream Sources and Form
EPA reviewed process descriptions and process flow diagrams obtained from numerous sources including, Kirk-Othmer, EPA's Effluent Guideline Documents, EPA survey instruments, and the literature. As one would expect, the available process descriptions and process flow diagrams varied considerably in both quality and detail, both by commodity and source of information. Therefore, EPA often needed to interpret the information to identify specific waste streams. For example, process descriptions and process flow charts found through the Agency's electronic literature search process often focused on the production process of the mineral product and omitted any description or identification of waste streams (including their point of generation). In such cases, the Agency used professional judgment to determine how and where wastes were generated.
C.3 Waste Stream Characteristics
EPA used waste stream characterization data obtained from numerous sources to document whether a particular waste stream exhibited one (or more) of the characteristics of a RCRA hazardous waste (i.e., toxicity, corrosivity, ignitability, and reactivity). In cases in which actual data indicated that a waste did exhibit one of the characteristics of a hazardous waste, the specific characteristic was designated with a Y. Despite, however, more than ten years of Agency research on mineral processing operations, EPA was unable to find waste characterization data for many waste streams. To present mineral commodity profiles that were as complete as possible, EPA used a step-wise methodology for estimating waste characteristics for individual waste streams when documented waste generation rates and analytical data were not available. Specifically, due to the paucity of waste characterization data (particularly, TCLP data), EPA used total constituent data (if available) or professional judgment to determine whether a particular waste exhibits one of the characteristics of a RCRA hazardous waste (i.e., toxicity, corrosivity, ignitability, or reactivity).

To determine whether a waste might exhibit the characteristic of toxicity, EPA first compared 1/20th of the total constituent concentration of each TC metal to its respective TC level.11 In cases in which total constituent data were not available, EPA then used professional judgment to evaluate whether the waste stream could potentially exhibit the toxicity characteristic for any of the TC metals. For example, if a particular waste stream resulted through the leaching of a desired metal from an incoming concentrated feed, the Agency assumed that the precipitated leach stream contained high total constituent (and therefore, high leachable) concentrations of non-desirable metals, such as arsenic. Continuing through the step-wise methodology, EPA relied on professional judgment to determine, based on its understanding of the nature of a particular processing step that generated the waste in question, whether the waste could possibly exhibit one (or more) of the characteristics of ignitability, corrosivity, or reactivity. Waste streams that EPA determined could potentially exhibit one or more of the characteristics of a RCRA hazardous waste were designated by Y?. The Agency acknowledges the inherent limitations of this conservative, step-wise methodology and notes that it is possible that EPA may have incorrectly assumed that a particular waste does (or does not) exhibit one or more of the RCRA hazardous waste characteristics.
The Agency stresses that the results and information presented in the individual commodity analysis reports are based on the review of publicly available information. The accuracy and representativeness of the collected information are only as good as the source documents. As a result of this limited data quality review, EPA notes that in some instances, Extraction Procedure (EP) leachate data reported by various sources are greater than 1/20th of the total constituent concentration. Generally one would expect, based on the design of the EP testing procedure, the total constituent concentrations to be at least 20-times the EP concentrations. This apparent discrepancy, however, can potentially be explained if the EP results were obtained from total constituent analyses of liquid wastes (i.e., EP tests conducted on wastes that contain less than one-half of one percent solids content are actually total constituent analyses).
C.4 Waste Stream Generation Rates
As data were available, EPA used actual waste generation rates reported by facilities in various Agency survey instruments and background documents. Due, however, to the general lack of data for many of the mineral commodity sectors and waste streams, the Agency needed to develop a step-wise method for estimating mineral processing waste stream generation rates when actual data were unavailable.
Specifically, EPA developed an “expected value” estimate for each waste generation rate using draft industry profiles, supporting information, process flow diagrams, and professional judgment. From the “expected value” estimate, EPA developed upper and lower bound estimates, which reflect the degree of uncertainty in our data and understanding of a particular sector, process, and/or waste in question. For example, EPA obtained average or typical commodity production rates from published sources (e.g., BOM Mineral Commodity Summaries) and determined input material quantities or concentration ratios from published market specifications. In parallel with this activity, EPA reviewed process flow diagrams for information on flow rates, waste-to-product ratios, or material quantities. The Agency then calculated any additional waste generation rates and subtracted out known material flows, leaving a defined material flow, which was allocated among waste streams using professional judgment. Finally, EPA assigned a maximum, expected, and minimum volume estimate to each waste stream.
A key element in developing waste generation rates was the fact that by definition, average facility level generation rates of solids and sludges are less that 45,000 metric tons/year, and generation rates of wastewaters are less than 1,000,000 metric tons/year. Using this fact, in the absence of any supporting information, maximum values for solids and sludges were set at the highest waste generation rate found in the sector in question or 45,000 metric tons/year/ facility, whichever is lower.
The precise methodology for determining waste generation rates varied depending on the quantity and quality of available information. The waste streams for which EPA had no published annual generation rate were divided into five groups and a methodology for each group was assigned as follows.
11 Based on the assumption of a theoretical worst-case leaching of 100 percent and the design of the TCLP extraction test, where 100 grams of sample is diluted with two liters of extractant, the maximum possible TCLP concentration of any TC metal would be 1/20th of the total constituent concentration.

1. Actual generation rates for the waste in question from one or more facilities were available. EPA extrapolated from the available data to the sector on the basis of waste-to-product ratios to develop the expected value, and used a value of +/- 20% of the expected value to define the upper and lower bounds.
2. A typical waste-to-product ratio for the waste in question was available. EPA multiplied the waste-to-product ratio by sector production (actual or estimated) to yield a sector wide waste generation expected value, and used one-half and twice this value for the lower and upper bounds, respectively.
3. No data on the waste in question were available, but generation rates for other generally comparable wastes in the sector were available. EPA used the maximum and minimum waste generation rates as the upper and lower bounds, respectively, and defined the expected value as the midpoint between the two ends of the range. Adjustments were made using professional judgment if unreasonable estimates resulted from this approach.
4. No data were available for any analogous waste streams in the sector, or information for the sector generally was very limited. EPA drew from information on other sectors using analogous waste types and adjusting for differences in production rates/material throughput. The Agency used upper and lower bound estimates of one order of magnitude above and below the expected value derived using this approach. Results were modified using professional judgment if the results seemed unreasonable.
5. All EPA knew (or suspected) was the name of the waste. The Agency used the high value threshold (45,000 metric tons/year/facility or 1,000,000 metric tons/year/facility) as the maximum value, 0 or 100 metric tons per year as the minimum, and the midpoint as the expected value.
Appendix A provides detailed descriptions of the methodology used to estimate waste generation rates for individual waste streams.
C.5 Waste Stream Management Practices
EPA reviewed process descriptions and process flow diagrams obtained from numerous sources including, Kirk-Othmer, EPA's Effluent Guideline Documents, EPA survey instruments, and the literature. As noted earlier, the available process descriptions and process flow diagrams varied considerably in both quality and detail, both by commodity and source of information. Therefore, EPA often needed to interpret the information to determine how specific waste streams were managed. For example, process descriptions and process flow charts found through the Agency's electronic literature search process often focused on the production process of the mineral product and omitted any description or identification of how or where waste streams were managed. In such cases, the Agency used professional judgment to determine how and where specific waste streams were managed. For example, EPA considered (1) how similar waste streams were managed at mineral processing facilities for which the Agency had management information, (2) the waste form and whether it was amenable to tank treatment, (3) generation rates, and (4) proximity of the point of waste generation to the incoming raw materials, intermediates, and finished products to predict the most likely waste management practice.
C.6 Waste Stream Recyclability and Classification
As was the case for the other types of waste stream-specific information discussed above, EPA was unable to locate published information showing that many of the identified mineral processing waste streams were being recycled. In cases in which the Agency found information showing that a particular waste stream was being either fully or partially recycled, the recyclability of the waste stream is designated by Y and YS, respectively.
However, due to the paucity of data for many of the mineral commodity sectors and waste streams, the Agency needed to develop a method for determining whether a particular mineral processing waste stream was expected to be either fully or partially recycled, designated by Y? and YS?, respectively. The Agency developed a work sheet to assist EPA staff in making consistent determinations of whether the mineral processing waste streams could potentially be recycled, reused, or recovered. This work sheet, shown in Appendix B, was designed to capture

the various types of information that could allow one, when using professional judgment, to determine whether a particular waste stream could be recycled or if it contained material of value.
If EPA determined that the waste stream was or could be fully/partially recycled, it used the definitions provided in 40 CFR §§ 260.10 and 261.1 to categorize the waste streams as either by-products, sludges, or spent materials. Appendix C presents the RCRA definitions and examples of by-products, sludges, and spent materials. Work sheets developed for individual waste streams are presented in Appendix D.
EPA, through the process of researching and preparing mineral commodity analysis reports for the mineral commodities listed in Exhibit 2-2, identified a total of 553 waste streams that are believed to be generated at facilities involved in mineral production operations. These extraction/beneficiation and mineral processing waste streams are listed in Appendix E.
D. Define the Universe of “Mineral Processing” Waste Streams Potentially Affected by the Phase IV LDRs
Step Four The Agency then evaluated each of the waste streams listed in Appendix E using the process outlined in Exhibit 2-9, to remove waste streams that would not be affected by the Phase IV LDRs. Specifically, EPA removed:
C
C
C
C
All of the extraction and beneficiation waste streams;
The “Special 20” Bevill-Exempt mineral processing waste streams;
Waste streams that were known to be fully recycled in process; and
All of the mineral processing waste streams that did not exhibit one or more of the RCRA characteristics of a hazardous waste (based on either actual analytical data or professional judgment).
Prepare Mineral Commodity Analysis As a result of this evaluation process, EPA narrowed the potentialReports on Each Sector
universe of waste streams that could potentially be affected by the proposed Phase IV LDRs to the 120 hazardous mineral processing waste streams
presented below in Exhibit 2-10.Define Universe of Mineral Processing Waste Streams Potentially Affected by
The Phase IV LDRs
Define Universe of Mineral Processing Facilities Potentially Affected by the Phase IV LDRs

EXHIBIT 2-9
Waste Streams Potentially Affected by the Phase IV LDRs
Waste Stream Not Covered by the
Mining Waste Exclusion (see Exhibit 3-7)?
Does Material Exhibit
Hazardous Characteristics?*
No Not a Hazardous
Waste
Is Material
Recycled?
Does Material Meet Conditional
Exclusion?**
Yes
Yes
Not A Solid Waste
No
Subject to LDRs
* Listed hazardous waste are excluded from further analysis because they are already subject to all relevant Subtitle C requirements.
** To meet the conditional exclusion, materials must be stored in tanks, containers, of buildings for less than one year, or have a site specific determination that sold material may be stored on a concrete or asphalt pad. (Other requirements can be found in 261.4(a)(15))
No

EXHIBIT 2-10
POTENTIALLY HAZARDOUS MINERAL PROCESSING WASTE STREAMS BY COMMODITY SECTOR
Alumina and Aluminum Copper Cast house dust Acid plant blowdown Electrolysis waste APC dust/sludge
Antimony Process wastewaters Autoclave filtrate Spent bleed electrolyte Slag and furnace residue Tankhouse slimes Stripped anolyte Solids Waste contact cooling water
Beryllium Spent furnace brick Chip treatment wastewater WWTP sludge Filtration discard Elemental Phosphorus Spent Barren Filtrate Andersen Filter Media
Bismuth Precipitator slurry Alloy residues NOSAP slurry Spent caustic soda Phossy Water Electrolytic slimes Furnace building washdown Lead and zinc chlorides Furnace scrubber blowdown Metal chloride residues Fluorspar and Hydrofluoric Acid Slag Off-spec fluosilicic acid Spent electrolyte Germanium Spent soda solution Waste acid wash and rinse water Waste acid solutions Chlorinator wet air pollution control Waste acids sludge
Cadmium Hydrolysis filtrate Caustic washwater Leach residues Copper and lead sulfate filter cakes Spent acid/leachate Copper removal filter cake Waste still liquor Iron containing impurities Gold and Silver Spent leach solution Slag Lead sulfate waste Spent furnace dust Post-leach filter cake Lead Spent purification solution Acid plant sludge Scrubber wastewater Baghouse incinerator ash Spent electrolyte Slurried APC dust Zinc precipitates Solid residues
Calcium Spent furnace brick Dust with quick lime Stockpiled miscellaneous plant waste
Chromium and Ferrochromium Wastewater treatment plant solids/sludges ESP Dust Wastewater treatment plant liquid effluent GCT Sludge Magnesium and Magnesia from Brines
Coal Gas Cast house dust Multiple effects evaporator concentrate Smut
Mercury DustFurnace residueQuench water

EXHIBIT 2-10 (Continued)
Molybdenum, Ferromolybdenum, and Titanium and Titanium Dioxide Ammonium Molybdate Pickle liquor and wash water
Flue dust/gases Scrap milling scrubber water Liquid residues Smut from Mg recovery
Platinum Group Metals Leach liquor and sponge wash water Slag Spent surface impoundment liquids Spent acids Spent surface impoundments solids Spent solvents Waste acids (Sulfate process)
Rare Earths Waste acids (Chloride process) Spent ammonium nitrate processing WWTP sludge/solids solution Tungsten Electrolytic cell caustic wet APC Spent acid and rinse water sludge Process wastewater Process wastewater Uranium Spent scrubber liquor Waste nitric acid from UO2 production Solvent extraction crud Vaporizer condensate Spent lead filter cake Superheater condensate Waste solvent Slag Wastewater from caustic wet APC Uranium chips from ingot production
Rhenium Zinc Spent barren scrubber liquor Acid plant blowdown Spent rhenium raffinate Waste ferrosilicon
Scandium Process wastewater Spent acids Spent refractory brick Spent solvents from solvent extraction Spent cloths, bags, and filters
Selenium Spent goethite and leach cake residues Spent filter cake Spent surface impoundment liquids Plant process wastewater Spent synthetic gypsum Slag TCA tower blowdown Tellurium slime wastes Wastewater treatment plant liquid effluent Waste solids WWTP solids
Synthetic Rutile Zirconium and Hafnium Spent iron oxide slurry Spent acid leachate from zirconiumAPC dust/sludges alloy productionSpent acid solution Spent acid leachate from zirconium
Tantalum, Columbium, and Ferrocolumbium metal production Digester sludge Leaching rinse water from zirconium Process wastewater alloy production Spent raffinate solids Leaching rinse water from zirconium
Tellurium metal production Slag Solid waste residues Waste electrolyte Wastewater
Note: EPA was unable to collect sufficient information to determine whether the production of Bromine, Gemstones, Iodine, Lithium and Lithium Carbonate, Soda Ash, Sodium Sulfate, and Strontium produce mineral processing wastes.
Note: This is not necessarily a complete list of hazardous mineral processing waste. This is only a list of wastestream the Agency believes could be hazardous based on best available information.

E. Define the Universe of “Mineral Processing” Facilities Potentially Affected by the Phase IV LDRs
EPA then used the information contained in the individual sector analysis reports to identify the number of facilities, by commodity, that
Step Five
Define Universe of Mineral Processing WasteStreams Potentially Affected by
The Phase IV LDRs
Define Universe of MineralProcessing Facilities Potentially Affected by the Phase IV LDRs
potentially generate the hazardous mineral processing wastes listed in Exhibit 2-10. As discussed earlier, the individual sector analysis reports listed the facilities involved in the production of a particular mineral commodity. In addition, as the available information allowed, the Agency also (1) identified which facilities used which processes and (2) which processes generated which waste streams. In cases in which the Agency had insufficient information to determine which of the individual facilities generated a particular waste stream, EPA assumed that the waste stream was generated at all of the reported facilities known to be using the same process.
The Agency then used the individual sector analysis reports, various U.S. Bureau of Mines documents, the Randol Mining Directory, and the Mine Safety and Health Administration (MSHA) address/employment database to determine which of the mineral processing facilities were collocated with mining (extraction) and/or extraction/beneficiation facilities.
Lastly, the Agency used the 1990 Report to Congress and the individual commodity sector analysis reports to identify the mineral processing
facilities that also generate one (or more) of the special 20 Bevill-Exempt mineral processing wastes.
Exhibit 2-11 presents the final mineral processing database developed using our methodology as discussed above. Appendix F presents a summary of the mineral processing facilities by mineral commodity sector that EPA believes generate hazardous mineral processing wastes. Appendix F also indicates whether the mineral processing facilities are collocated and/or generate one (or more) of the “Special 20” waste streams. Appendix G, presents the same information (as shown in Appendix F) for the mineral processing sectors that do not generate hazardous mineral processing wastes.
Caveats and Limitations
The results and information presented in this report are based on extensive review of publicly available information, supplemented by information provided in public comment. The accuracy and representativeness of the collected information are only as good as the source documents. As a result of this limited data quality review, EPA notes that in some instances, Extraction Procedure (EP) leachate data reported by various sources are greater than 1/20th of the total constituent concentration. Generally, one would expect, based on the design of the EP testing procedure, the total constituent concentrations to be at least 20-times the EP concentrations. This apparent discrepancy, however, can potentially be explained if the EP results were obtained from total constituent analyses of liquid wastes (i.e., EP tests conducted on wastes that contain less than one-half of one percent solids content are actually total constituent analyses).
In addition, to present mineral commodity profiles that are as complete as possible, EPA used a step-wise methodology for estimating both annual waste generation rates and waste characteristics for individual waste streams when documented waste generation rates and analytical data were not available. EPA's application of this methodology to estimate waste generation rates resulted in the development of low, medium, and high annual waste generation rates for non-wastewaters and wastewaters that were bounded by zero and 45,000 metric tons/yr/facility and by zero and 1,000,000 metric tons/yr/facility, respectively (the thresholds for determining whether a waste stream is a high volume, Bevill-exempt waste). Due to the paucity of waste characterization data (particularly, TCLP data), EPA used total constituent data (if available) or best engineering judgment to determine whether a particular waste exhibited one of the characteristics of a RCRA hazardous waste (i.e., toxicity, corrosivity, ignitability, and reactivity).

To determine whether a waste might exhibit the characteristic of toxicity, EPA first compared 1/20th of the total constituent concentration of each TC metal to its respective TC level12. In cases in which total constituent data were not available, EPA then used best engineering judgment to evaluate whether the waste stream could potentially exhibit the toxicity characteristic for any of the TC metals. For example, if a particular waste stream resulted through the leaching of a desired metal from an incoming concentrated feed, we assumed that the precipitated leach stream contained high total constituent (and therefore, high leachable) concentrations of non-desirable metals, such as arsenic. Continuing through the step-wise methodology, we relied on EPA's best engineering judgment to determine, based on our understanding of the nature of a particular processing step that generated the waste in question, whether the waste could possibly exhibit one (or more) of the characteristics of ignitability, corrosivity, or reactivity. The Agency acknowledges the inherent limitations of this conservative, step-wise methodology and notes that it is possible that EPA may have incorrectly assumed that a particular waste does (or does not) exhibit one or more of the RCRA hazardous waste characteristics.
12 Based on the assumption of a theoretical worst-case leaching of 100 percent and the design of the TCLP extraction test, where 100 grams of sample is diluted with two liters of extractant, the maximum possible TCLP concentration of any TC metal would be 1/20th of the total constituent concentration.

EXHIBIT 2-11Final Mineral Processing Waste Stream Database
Reported Est./Reported Number
Generation Generation (1000mt/yr) of Facilities Average Facility Generation (mt/yr)Commodity Waste Stream (1000mt/yr) Min Avg. Max with Process Minimum Expected Maximum
Alumina and Aluminum Cast house dust 19 19 19 19 23 830 830 830Electrolysis waste 58 58 58 58 23 2,500 2,500 2,500
Antimony Autoclave filtrate NA 0.32 27 54 6 53 4,500 9,000Stripped anolyte solids 0.19 0.19 0.19 0.19 2 95 95 95Slag and furnace residue 21 21 21 21 6 3,500 3,500 3,500
Beryllium Chip treatment wastewater NA 0.2 100 2000 2 100 50,000 1,000,000Spent barren filtrate 55 55 55 55 1 55,000 55,000 55,000Filtration discard NA 0.2 45 90 2 100 23,000 45,000
Bismuth Alloy residues NA 0.1 3 6 1 100 3,000 6,000Spent caustic soda NA 0.1 6.1 12 1 100 6,100 12,000Electrolytic slimes NA 0 0.02 0.2 1 0 20 200Lead and zinc chlorides NA 0.1 3 6 1 100 3,000 6,000Metal chloride residues 3 3 3 3 1 3,000 3,000 3,000
Slag NA 0.1 1 10 1 100 1,000 10,000Spent electrolyte NA 0.1 6.1 12 1 100 6,100 12,000Spent soda solution NA 0.1 6.1 12 1 100 6,100 12,000Waste acid solutions NA 0.1 6.1 12 1 100 6,100 12,000Waste acids NA 0 0.1 0.2 1 0 100 200
Cadmium Caustic washwater NA 0.19 1.9 19 2 95 950 9,500Copper and lead sulfate filter cakes NA 0.19 1.9 19 2 95 950 9,500Copper removal filter cake NA 0.19 1.9 19 2 95 950 9,500Iron containing impurities NA 0.19 1.9 19 2 95 950 9,500Spent leach solution NA 0.19 1.9 19 2 95 950 9,500Lead sulfate waste NA 0.19 1.9 19 2 95 950 9,500Post-leach filter cake NA 0.19 1.9 19 2 95 950 9,500Spent purification solution NA 0.19 1.9 19 2 95 950 9,500Scrubber wastewater NA 0.19 1.9 19 2 95 950 9,500Spent electrolyte NA 0.19 1.9 19 2 95 950 9,500Zinc precipitates NA 0.19 1.9 19 2 95 950 9,500
Calcium Dust with quicklime 0.04 0.04 0.04 0.04 1 40 40 40
Chromium and Ferrochromium ESP dust 3 3 3 3 1 3,000 3,000 3,000GCT sludge NA 0.03 0.3 3 1 30 300 3,000
Coal Gas Multiple effects evaporator concentrate NA 0 0 65 1 0 0 65,000

EXHIBIT 2-11 (Continued)
Reported Est./Reported Number
Generation Generation (1000mt/yr) of Facilities Average Facility Generation (mt/yr)Commodity Waste Stream (1000mt/yr) Min Avg. Max with Process Minimum Expected Maximum
Copper Acid plant blowdown 5300 5300 5300 5300 10 530,000 530,000 530,000Spent furnace brick 3 3 3 3 10 300 300 300WWTP sludge 6 6 6 6 10 600 600 600
Elemental Phosphorus Andersen Filter Media 0.46 0.46 0.46 0.46 2 230 230 230Precipitator slurry 160 160 160 160 2 80,000 80,000 80,000NOSAP slurry 160 160 160 2 80,000 80,000 80,000Phossy Water 670 670 670 670 2 340,000 340,000 340,000Furnace scrubber blowdown 410 410 410 410 2 210,000 210,000 210,000Furnace Building Washdown 700 700 700 700 2 350,000 350,000 350,000
Fluorspar and Hydrofluoric Acid Off-spec fluosilicic acid NA 0 15 44 3 0 5,000 15,000
Germanium Waste acid wash and rinse water NA 0.4 2.2 4 4 100 550 1,000Chlorinator wet air pollution controlsludge
NA 0.01 21 0.4 4 3 53 100
Hydrolysis filtrate NA 0.01 0.21 0.4 4 3 53 100Leach residues 0.01 0.01 0.01 0.01 3 3 3 3Spent acid/leachate NA 0.4 2.2 4 4 100 550 1,000Waste still liquor NA 0.01 0.21 0.4 4 3 53 100
Lead Acid plant sludge 14 14 14 14 3 4,700 4,700 4,700Baghouse incinerator ash NA 0.3 3 30 3 100 1,000 10,000Slurried APC Dust 7 7 7 7 3 2,300 2,300 2,300Solid residues 0.4 0.4 0.4 0.4 3 130 130 130Spent furnace brick 1 1 1 1 3 330 330 330Stockpiled miscellaneous plant waste NA 0.3 67 130 3 100 22,000 43,000WWTP liquid effluent 2600 2600 2600 2600 3 870,000 870,000 870,000
Magnesium and Magnesia fromBrines
Cast house dust NA 0.076 0.76 7.6 1 76 760 7,600
Smut 26 26 26 2 13,000 13,000 13,000
Mercury Dust 0.007 007 0.007 0.007 7 1 1 1Quench water NA 63 77 420 7 9,000 11,000 60,000Furnace residue 0.077 0.077 0.077 0.077 7 11 11 11
Molybdenum, Ferromolybdenum,and Ammonium Molybdate
Flue dust/gases NA 1.1 250 500 11 100 23,000 45,000
Liquid residues 1 1 1 1 2 500 500 500
Platinum Group Metals Slag NA 0.0046 0.046 0.46 3 2 15 150Spent acids NA 0.3 1.7 3 3 100 570 1,000Spent solvents NA 0.3 1.7 3 3 100 570 1,000
160
0.
26
0.

EXHIBIT 2-11 (Continued)
Reported Est./Reported Number
Generation Generation (1000mt/yr) of Facilities Average Facility Generation (mt/yr)Commodity Waste Stream (1000mt/yr) Min Avg. Max with Process Minimum Expected Maximum
Rare Earths Spent ammonium nitrate processingsolution
14 14 14 1 14,000 14,000 14,000
Electrolytic cell caustic wet APC sludge NA 0.07 0.7 7 1 70 700 7,000Process wastewater 7 7 7 7 1 7,000 7,000 7,000Spent scrubber liquor NA 0.1 500 1000 1 100 500,000 1,000,000Solvent extraction crud NA 0.1 2.3 4.5 1 100 2,300 4,500Wastewater from caustic wet APC NA 0.1 500 1000 1 100 500,000 1,000,000
Rhenium Spent barren scrubber liquor NA 0 0.1 0.2 2 0 50 100Spent rhenium raffinate 88 88 88 88 2 44,000 44,000 44,000
Scandium Spent acids NA 0.7 3.9 7 7 100 560 1,000Spent solvents from solvent extraction NA 0.7 3.9 7 7 100 560 1,000
Selenium Spent filter cake NA 0.05 0.5 5 3 17 170 1,700 Plant process wastewater 66 66 66 66 2 33,000 33,000 33,000
Slag NA 0.05 5 5 3 17 170 1,700Tellurium slime wastes NA 0.05 0.5 5 3 17 170 1,700Waste solids NA 0.05 0.5 5 3 17 170 1,700
Synthetic Rutile Spent iron oxide slurry 45 45 45 45 1 45,000 45,000 45,000APC dust/sludges 30 30 30 30 1 30,000 30,000 30,000Spent acid solution 30 30 30 30 1 30,000 30,000 30,000
Tantalum, Columbium, andFerrocolumbium
Digester sludge 1 1 1 1 2 500 500 500
Process wastewater 150 150 150 150 2 75,000 75,000 75,000Spent raffinate solids 2 2 2 2 2 1,000 1,000 1,000
Tellurium Slag NA 0.2 9 2 100 1,000 4,500Solid waste residues NA 0.2 2 9 2 100 1,000 4,500Waste electrolyte NA 0.2 2 20 2 100 1,000 10,000Wastewater NA 0.2 40 2 100 10,000 20,000
Titanium and Titanium Dioxide Pickle liquor and wash water NA 2.2 2.7 3.2 3 730 900 1,100Scrap milling scrubber water NA 4 5 6 1 4,000 5,000 6,000Smut from Mg recovery NA 0.1 22 45 2 50 11,000 23,000Leach liquor and sponge wash water NA 380 480 580 2 190,000 240,000 290,000Spent surface impoundment liquids NA 0.63 3.4 6.7 7 90 490 960Spent surface impoundments solids 36 36 36 36 7 5,100 5,100 5,100Waste acids (Sulfate process) NA 0.2 39 77 2 100 20,000 39,000WWTP sludge/solids 420 420 420 420 7 60,000 60,000 60,000
Tungsten Spent acid and rinse water NA 0 0 21 6 0 0 3,500
14
0.
2
20

EXHIBIT 2-11 (Continued)
Reported Est./Reported Number
Generation Generation (1000mt/yr) of Facilities Average Facility Generation (mt/yr) Commodity Waste Stream (1000mt/yr) Min Avg. Max with Process Minimum Expected Maximum
Process wastewater NA 2.2 4.4 9 6 370 730 1,500
Uranium Waste nitric acid from UO2 production NA 1.7 2.5 3.4 17 100 150 200 Vaporizer condensate NA 1.7 9.3 17 17 100 550 1,000 Superheater condensate NA 1.7 9.3 17 17 100 550 1,000 Slag NA 0 5 17 17 0 500 1,000 Uranium chips from ingot production NA 1.7 2.5 3.4 17 100 150 200
Zinc Acid plant blowdown 130 130 130 130 1 130,000 130,000 130,000 Waste ferrosilicon 17 17 17 1 17,000 17,000 17,000 Process wastewater 5000 5000 5000 5000 3 1,700,000 1,700,000 1,700,000 Discarded refractory brick 1 1 1 1 1 1,000 1,000 1,000 Spent cloths, bags, and filters 0.15 0.15 0.15 0.15 3 50 50 50 Spent goethite and leach cake residues 15 15 15 15 3 5,000 5,000 5,000 Spent surface impoundment liquids 1900 1900 1900 1900 3 630,000 630,000 630,000 WWTP Solids 0.75 0.75 0.75 0.75 3 250 250 250 Spent synthetic gypsum 16 16 16 16 3 5,300 5,300 5,300 TCA tower blowdown 0.25 0.25 0.25 0.25 1 250 250 250 Wastewater treatment plant liquid effluent
2600 2600 2600 3 870,000 870,000 870,000
Zirconium and Hafnium Spent acid leachate from Zr alloy prod. NA 0 0 850 2 0 0 430,000 Spent acid leachate from Zr metal prod. NA 0 0 1600 2 0 0 800,000 Leaching rinse water from Zr alloy prod.
NA 34 51 2 17,000 21,000 26,000
Leaching rinse water from Zr metal prod.
NA 0.2 2000 2 100 500,000 1,000,000
8.
17
2600
42
1000

EXHIBIT 2-11 (Continued)
RCRA Waste Type Treatment Type
TC Metals Cur-rent
Commodity Waste Stream As Ba Cd Cr Pb Hg Se Ag Corr Ignit Rctv Haz?
Re-cycle
By-Prod
SpentMat'l Sludge
WasteWater
1-10%Solids Solid
Alumina and Aluminum Cast house dust Y Y N? N? N? 1 Y? 1 0 0 1 Electrolysis waste Y? N? N? N? 0.5 Y? 1 0 0 1
Antimony Autoclave filtrate Y? Y? Y? Y? Y? N? N? 0.5 YS? 1 1 0 0 Stripped anolyte solids Y? N? N? N? 0.5 Y 1 0 0 1 Slag and furnace residue Y? N? N? N? 0.5 N 0 0 1
Beryllium Chip treatment wastewater Y? N? N? N? 0.5 S? 1 1 0 0 Spent barren filtrate Y N? N? N? 1 YS 1 1 0 0 Filtration discard Y? N? N? N? 0.5 N 0 0 1
Bismuth Alloy residues Y? N? N? N? 0.5 N 0 0 1 Spent caustic soda Y? N? N? N? 0.5 Y? 1 0 1 0 Electrolytic slimes Y? N? N? N? 0.5 Y? 1 0 0 1 Lead and zinc chlorides Y? N? N? N? 0.5 N 0 0 1 Metal chloride residues Y? N? N? N? 0.5 N 0 0 1
Slag Y? N? N? N? 0.5 N 0 0 1 Spent electrolyte Y? N? N? N? 0.5 N 0 1 0 Spent soda solution Y? Y? N? N? 0.5 Y? 1 1 0 0 Waste acid solutions Y? N? N? 0.5 1 0 0 Waste acids Y? N? N? 0.5 S? 1 1 0 0
Cadmium Caustic washwater Y? Y? N? N? 0.5 Y? 1 1 0 0 Copper and lead sulfate filtercakes
Y? Y? N? N? N? 0.5 ? 1 0 0 1
Copper removal filter cake Y? N? N? N? 0.5 Y? 1 0 0 1 Iron containing impurities Y? N? N? N? 0.5 N 0 0 1 Spent leach solution Y? Y? Y? Y? N? N? 0.5 Y? 1 0 1 0 Lead sulfate waste Y? Y? N? N? N? 0.5 Y? 1 0 0 1 Post-leach filter cake Y? N? N? N? 0.5 N 0 0 1 Spent purification solution Y? Y? N? N? 0.5 N 1 0 0 Scrubber wastewater Y? Y? N? N? 0.5 Y? 1 1 0 0 Spent electrolyte Y? Y? N? N? 0.5 N 0 1 0 Zinc precipitates Y? N? N? N? 0.5 Y? 1 0 0 1
Calcium Dust with quicklime Y? N? N? 0.5 1 0 0 1
Chromium andFerrochromium
ESP dust Y Y N? N? N? 1 YS 1 0 0 1
GCT sludge Y? N? N? N? 0.5 Y 1 0 0 1
Y
NY
Y
Y

EXHIBIT 2-11 (Continued)
RCRA Waste Type Treatment Type
TC Metals Cur-rent
Commodity Waste Stream As Ba Cd Cr Pb Hg Se Ag Corr Ignit Rctv Haz?
Re-cycle
By-Prod
SpentMat'l Sludge
WasteWater
1-10%Solids Solid
Coal Gas Multiple effects evaporatorconcentrate
Y Y N? N? N? 1 S 1 0 1 0
Copper Acid plant blowdown Y Y Y Y N? N? 1 YS 1 0 1 0 Spent furnace brick Y? N? N? N? 0.5 Y? 1 0 0 1 WWTP sludge Y? Y? N? N? N? 0.5 YS 1 0 0 1
Elemental Phosphorus Andersen Filter Media Y N? N? N? 1 N 0 0 1 Precipitator slurry Y? N? Y Y 1 YS 1 0 1 0 NOSAP slurry N? N? Y 1 N 0 1 0 Phossy Water Y? N? Y Y 1 YS 1 0 1 0 Furnace scrubber blowdown Y Y N? N? 1 Y 1 1 0 0 Furnace Building Washdown Y N? N? N? 1 Y 1 1 0 0
Fluorspar andHydrofluoric Acid
Off-spec fluosilicic acid Y? N? N? 0.5 YS 1 1 0 0
Germanium Waste acid wash and rinse water Y? Y? Y? Y? Y? Y? Y? N? N? 0.5 YS? 1 1 0 0 Chlorinator wet air pollution controlsludge
Y? Y? Y? Y? Y? Y? N? N? N? 0.5 YS? 1 0 0 1
Hydrolysis filtrate Y? Y? Y? Y? Y? Y? N? N? N? 0.5 N 0 0 1 Leach residues Y? Y? N? N? N? 0.5 N 0 0 1 Spent acid/leachate Y? Y? Y? N? N? 0.5 YS? 1 1 0 0 Waste still liquor Y? Y? Y? Y? Y? Y? N? Y? N? 0.5 N 0 0 1
Lead Acid plant sludge Y? N? N? 0.5 ? 1 0 0 1 Baghouse incinerator ash Y Y N? N? N? 1 N 0 0 1 Slurried APC Dust Y Y N? N? N? 1 Y 1 0 0 1 Solid residues Y? N? N? N? 0.5 Y? 1 0 0 1 Spent furnace brick Y N? N? N? 1 Y 1 0 0 1 Stockpiled miscellaneous plantwaste
Y Y N? N? N? 1 S? 1 0 0 1
WWTP liquid effluent Y? Y? N? N? 0.5 Y 1 1 0 0
Magnesium andMagnesia from Brines
Cast house dust Y? N? N? N? 0.5 Y? 1 0 0 1
Smut Y N? N? N? 1 N 0 0 1
Mercury Dust Y? N? N? N? 0.5 N 0 0 1 Quench water Y? Y? N? N? N? 0.5 Y? 1 1 0 0 Furnace residue Y? N? N? N? 0.5 N 0 0 1
Y
YYYY
Y
Y

EXHIBIT 2-11 (Continued)
RCRA Waste Type Treatment Type
TC Metals Cur-rent
Commodity Waste Stream As Ba Cd Cr Pb Hg Se Ag Corr Ignit Rctv Haz?
Re-cycle
By-Prod
SpentMat'l Sludge
WasteWater
1-10%Solids Solid
Molybdenum,Ferromolybdenum, andAmmonium Molybdate
Flue dust/gases Y? N? N? N? 0.5 N 0 0 1
Liquid residues Y? Y? Y? Y? N? N? N? 0.5 N 1 0 0
Platinum Group Metals Slag Y? Y? N? N? N? 0.5 Y? 1 0 0 1 Spent acids Y? Y? Y? N? N? 0.5 N 1 0 0 Spent solvents Y? Y? N? Y? N? 0.5 N 1 0 0
Rare Earths Spent ammonium nitrateprocessing solution
Y N? N? 1 0 1 0 0
Electrolytic cell caustic wet APCsludge
Y? N? N? 0.5 1 0 0 1
Process wastewater Y Y? N? N? 1 YS? 1 1 0 0 Spent scrubber liquor Y? N? N? 0.5 S? 1 1 0 0 Solvent extraction crud N? Y? N? 0.5 N 0 0 1 Wastewater from caustic wet APC Y? Y? Y? N? N? 0.5 YS? 1 1 0 0
Rhenium Spent barren scrubber liquor Y? N? N N 0.5 Y? 1 1 0 0 Spent rhenium raffinate Y? N? N? N? 0.5 N 0 0 1
Scandium Spent acids Y? N? N? 0.5 1 0 0 Spent solvents from solventextraction
N? Y? N? 0.5 ? 1 1 0 0
Selenium Spent filter cake Y? N? N? N? 0.5 Y? 1 0 0 1 Plant process wastewater Y Y N? N? 1 YS? 1 1 0 0
Slag Y? N? N? N? 0.5 S? 1 0 0 1 Tellurium slime wastes Y? N N? N? 0.5 Y? 1 0 0 1 Waste solids Y? N? N? N? 0.5 N 0 0 1
Synthetic Rutile Spent iron oxide slurry Y? Y? N? N? N? 0.5 YS? 1 0 0 1 APC dust/sludges Y? Y? N? N? N? 0.5 Y 1 0 0 1 Spent acid solution Y? Y? Y? N? N? 0.5 Y 1 1 0 0
Tantalum, Columbium,and Ferrocolumbium
Digester sludge Y? N? N? 0.5 0 0 1
Process wastewater Y? Y? Y? Y? Y? Y N? N? 1 Y? 1 0 1 0 Spent raffinate solids Y? N? N? 0.5 0 0 1
Tellurium Slag Y? N? N? N? 0.5 S? 1 0 0 1 Solid waste residues Y? N? N? N? 0.5 N 0 0 1 Waste electrolyte Y? Y? N? N? N? 0.5 N 1 0 0
Y
Y
NY
Y
N
N
Y

EXHIBIT 2-11 (Continued)
RCRA Waste Type Treatment Type
TC Metals Cur-rent
Commodity Waste Stream As Ba Cd Cr Pb Hg Se Ag Corr Ignit Rctv Haz?
Re-cycle
By-Prod
SpentMat'l Sludge
WasteWater
1-10%Solids Solid
Wastewater Y? Y? N? N? 0.5 1 1 0 0
Titanium and TitaniumDioxide
Pickle liquor and wash water Y? Y? Y? Y? N? N? 0.5 YS? 1 1 0 0
Scrap milling scrubber water Y? Y? Y? Y? N? N? N? 0.5 YS? 1 1 0 0 Smut from Mg recovery N? N? Y 1 Y? 1 0 0 1 Leach liquor and sponge washwater
Y? Y? Y N? N? 1 YS? 1 1 0 0
Spent surface impoundmentliquids
Y? Y? N? N? N? 0.5 ? 1 1 0 0
Spent surface impoundmentssolids
Y? Y? N? N? N? 0.5 0 0 1
Waste acids (Sulfate process) Y Y Y Y Y N N 1 N 1 0 0 WWTP sludge/solids Y? N N N 0.5 N 0 0 1
Tungsten Spent acid and rinse water Y? N? N? 0.5 YS? 1 1 0 0 Process wastewater Y? N? N? 0.5 S? 1 1 0 0
Uranium Waste nitric acid from UO2production
Y? N? N? 0.5 S? 1 1 0 0
Vaporizer condensate Y? N? N? 0.5 1 0 0 Superheater condensate Y? N? N? 0.5 N 1 0 0 Slag N? Y? N? 0.5 1 0 0 1 Uranium chips from ingotproduction
N? Y? N? 0.5 ? 1 0 0 1
Zinc Acid plant blowdown Y Y Y Y? Y? Y Y Y N N 1 Y 1 1 0 0 Waste ferrosilicon Y? N? N? N? 0.5 Y? 1 0 0 1 Process wastewater Y Y Y Y Y Y Y N? N? 1 Y? 1 1 0 0 Discarded refractory brick Y? Y? Y? Y? N? N? N? 0.5 N 0 0 1
Spent cloths, bags, and filters Y? Y? Y? Y? Y? N? N? N? 0.5 Y 1 0 0 1 Spent goethite and leach cakeresidues
Y Y Y Y? ? Y N? N? N? 1 Y 0 0 1
Spent surface impoundmentliquids
Y? Y N? N? 1 YS? 1 1 0 0
WWTP Solids Y? Y? Y? Y? Y? Y? N? N? N? 0.5 YS 1 0 0 1 Spent synthetic gypsum Y? Y Y? N? N? N? 1 N 0 0 1 TCA tower blowdown Y? Y? Y? Y? Y? N? N? 0.5 YS 1 1 0 0 Wastewater treatment plant liquideffluent
Y? N? N? N? 0.5 S? 1 1 0 0
Y
Y
N
Y
Y
N
YY
Y Y
Y

EXHIBIT 2-11 (Continued)
RCRA Waste Type Treatment Type
TC Metals Cur-rent
Commodity Waste Stream As Ba Cd Cr Pb Hg Se Ag Corr Ignit Rctv Haz ?
Re-cycle
By-Prod
Spent Mat'l Sludge
Waste Water
1-10% Solids Solid
Zirconium and Hafnium Spent acid leachate from Zr alloy prod.
Y? N? N? 0.5 1 0 0
Spent acid leachate from Zr metal prod.
Y? N? N? 0.5 1 0 0
Leaching rinse water from Zr alloy prod.
Y? N? N? 0.5 S? 1 1 0 0
Leaching rinse water from Zr metal prod.
Y? N? N? 0.5 S? 1 1 0 0
N
N
Y
Y


