Identification and Comprehension of Symbolic Exit...
38
Identification and Comprehension of Symbolic Exit Signs for Small Transport-Category Airplanes David B. Weed Lawrence N. Paskoff David J. Ruppel Cynthia L. Corbett Garnet A. McLean Civil Aerospace Medical Institute Federal Aviation Administration Oklahoma City, OK 73125 February 2014 Final Report DOT/FAA/AM-14/3 Office of Aerospace Medicine Washington, DC 20591 Federal Aviation Administration
Transcript of Identification and Comprehension of Symbolic Exit...

Identification and Comprehension of Symbolic Exit Signs for Small Transport-Category Airplanes
David B. WeedLawrence N. PaskoffDavid J. RuppelCynthia L. CorbettGarnet A. McLeanCivil Aerospace Medical InstituteFederal Aviation AdministrationOklahoma City, OK 73125
February 2014
Final Report
DOT/FAA/AM-14/3Office of Aerospace MedicineWashington, DC 20591
Federal AviationAdministration

NOTICE
This document is disseminated under the sponsorship of the U.S. Department of Transportation in the interest
of information exchange. The United States Government assumes no liability for the contents thereof.
___________
This publication and all Office of Aerospace Medicine technical reports are available in full-text from the
Civil Aerospace Medical Institute’s publications website: www.faa.gov/go/oamtechreports

i
Technical Report Documentation Page1. Report No. 2. Government Accession No. 3. Recipient's Catalog No.DOT/FAA/AM-14/34. Title and Subtitle 5. Report Date
Identification and Comprehension of Symbolic Exit Signs for Small Transport-Category Airplanes
February 20146. Performing Organization Code
7. Author(s) 8. Performing Organization Report No.
Weed DB, Paskoff LN, Ruppel DJ, Corbett CL, McLean GA
9. Performing Organization Name and Address 10. Work Unit No. (TRAIS)
FAA Civil Aerospace Medical InstituteP.O. Box 25082 11. Contract or Grant No.
Oklahoma City, OK 73125
12. Sponsoring Agency name and Address 13. Type of Report and Period Covered
Office of Aerospace MedicineFederal Aviation Administration800 Independence Ave., S.W.Washington, DC 20591 14. Sponsoring Agency Code
15. Supplemental Notes
Work was accomplished under approved task AM-PSR Lab16. Abstract
Global growth in travel has resulted in the need to standardize safety information and guidance systems for communication of significant information to the widest audience possible. Through uniform design and common visual components, persons in all countries can better recognize and follow directional information for safe passage, particularly in emergency situations.
In order to communicate guidance information efficiently across language barriers, graphical signs and symbolic markings have come to incorporate a range of fairly standard visual components, such as exit signs that include arrows and the international running man symbol. A symbolic emergency exit sign has been approved for placement on a single, large transport-category airplane type in place of the signs currently required by 14 CFR 25.811 and 25.812. Use of a similar symbolic exit sign has been proposed for deployment on a small transport airplane. This sign would be smaller and use variations of the approved symbols.
This study evaluated the smaller symbolic exit sign, comparing it with the approved sign in combination with variations of individual sign elements. Overall, there was little difference in the identification of either the approved or proposed running man element, although participants were better able to identify the type of arrow element currently approved for the larger transport airplanes.
The main recommendations from this study are that future symbolic exit signs on transport-category airplanes be standardized and spaced within the cabin to provide the visual size needed for proper identification and comprehension.
17. Key Words 18. Distribution StatementSymbolic Exit Sign, Emergency Exit, Perception, Comprehension, Arrow Elements, Running Man
Document is available to the public through the Internet:
www.faa.gov/go/oamtechreports19. Security Classif. (of this report) 20. Security Classif. (of this page) 21. No. of Pages 22. Price
Unclassified Unclassified 34Form DOT F 1700.7 (8-72) Reproduction of completed page authorized


iii
CONTENTS
Identification and Comprehension of Symbolic Exit Signs for Small Transport-Category Airplanes
Introduction -------------------------------------------------------------------------------------------------------------1Test Method --------------------------------------------------------------------------------------------------------------2 Graphical Symbol Evaluations --------------------------------------------------------------------------------------2 Research Design -------------------------------------------------------------------------------------------------------2Phase One: Paper Signs -------------------------------------------------------------------------------------------------2 Materials ----------------------------------------------------------------------------------------------------------------3 Participants -------------------------------------------------------------------------------------------------------------4 Procedure ---------------------------------------------------------------------------------------------------------------4 Data Analysis ----------------------------------------------------------------------------------------------------------4Results ----------------------------------------------------------------------------------------------------------------------5 Visual Acuity -----------------------------------------------------------------------------------------------------------5 Sign Element Identification ------------------------------------------------------------------------------------------5 Sign Comprehension -------------------------------------------------------------------------------------------------5Phase One Discussion --------------------------------------------------------------------------------------------------8Phase Two: Self-illuminated Exit Signs ----------------------------------------------------------------------------9 Materials ----------------------------------------------------------------------------------------------------------------9 Procedure ------------------------------------------------------------------------------------------------------------- 10 Participants ---------------------------------------------------------------------------------------------------------- 10 Visual Acuity --------------------------------------------------------------------------------------------------------- 10 Data Analysis -------------------------------------------------------------------------------------------------------- 10Results -------------------------------------------------------------------------------------------------------------------- 11 Ambient Lighting Conditions ------------------------------------------------------------------------------------ 11 Self-illuminated Exit Sign Comprehension ---------------------------------------------------------------------- 12 Automatic External Defibrillator Comprehension ------------------------------------------------------------- 15Conclusion -------------------------------------------------------------------------------------------------------------- 16References --------------------------------------------------------------------------------------------------------------- 17Appendix A: Snellen Letter Charts Used for Testing Visual Acuity-----------------------------------------------A1Appendix B: Paper Sign Trials Test Booklet Layouts ---------------------------------------------------------------- B1Appendix C: Composite Symbolic Sign Comprehension Results ------------------------------------------------C1


1
IdentIfIcatIon and comprehensIon of symbolIc exIt sIgns for small transport-category aIrplanes
INTRODUCTION
Global growth in travel has resulted in the need to stan-dardize safety information and guidance systems so that they communicate significant information to the widest audience possible. Through uniform design and application of common visual components, people in all countries can better recognize and follow directional information for safe passage, particularly in emergency situations. To communicate guidance information efficiently across language barriers, graphical signs and symbolic markings have come to incorporate a range of fairly standard visual components, such as exit signs that include arrows and the international running man symbol. Consistent use of standard-ized symbols has improved public awareness of these guidance system elements and supported more rapid recognition during emergencies. Consequently, graphical safety signs and color standards that have already been accepted in a large part of the world are slowly being integrated into American (U.S.) society. Examples include green and white EXIT signs and the interna-tional running man exit symbol, which has been accepted as an auxiliary symbol by the U.S. National Fire Protection Associa-tion (NFPA) for use with traditional EXIT signs in buildings (Turner, 2010). In addition, a symbolic emergency exit sign has been approved for placement on a single, large transport-category airplane type, instead of the red and white EXIT signs required by Title 14 of the Code of Federal Regulations (CFR) Part 25, §25.811(d) (Emergency Exit Marking, 2012).
Approval for the symbolic exit sign placement on the airplane was based on an equivalent level of safety (ELOS) find-ing (with compensating factors), with the characteristics of the new symbolic sign (size, contrast, luminance, etc.) remaining generally consistent with those required by the §25.812(b)(1)
illuminated EXIT sign regulation, except for the text (Federal Aviation Administration, 2010). The approved sign is a com-bination of the International Organization for Standardization (ISO) 7010:2011 running man exit symbol, combined with modified directional arrows for the movement of people (ISO 3864-3:2012 (E), p. 15, type D), which appear to conform with the stroke width-to-height ratio for letters on the §25.812(b)(1) EXIT sign (Figure 1). The modified arrow head and shaft are thinner than those of the ISO standard arrow.
Following FAA approval of the symbolic exit sign, use of a similar exit sign has been proposed for a small transport-category airplane. Given the smaller physical aircraft interior, the size of the exit sign has been reduced; the other sign parameters such as stroke width to height, contrast ratios, and self-illumination, fall within those recommended by 14 CFR 25.812(b)(2). In contrast with the already approved symbolic exit sign, however, the newly proposed sign contains a modified ISO 7010:2011 running man exit symbol, having a relatively larger running man with rounded limbs, combined with shorter, wider arrows similar to the ISO 3864-3:2012 (E), p. 15, type D (Figure 2) arrow.
When the two signs are sized identically overall, the ISO 7010:2011 sign provides sharper definition, even though its run-ning man is actually smaller. As a result of these differences in appearance, the basis of the original ELOS finding was determined to be potentially inapplicable to the newly proposed symbolic exit sign. Thus, the current study was conducted to compare the two signs with regard to identifiability and comprehension, specifically the influence of differences in the rendering of the arrows and the configuration of the running man on the identifi-ability of the proposed sign at distances (sizes) relevant to small transport airplanes, using a predominantly American audience.
Figure 1: Approved Symbolic Exit Sign Featuring the ISO 7010:2011Running Man With Narrow Arrows
Figure 1: Approved Symbolic Exit Sign Featuring the ISO 7010:2011
Running Man With Narrow Arrows
Figure 2: Proposed Symbolic Exit Sign Composed of a Modified ISO 7010:2011Running Man and ISO 3864-3:2012 (E) Wide Arrows
Figure 2: Proposed Symbolic Exit Sign Composed of a Modified ISO 7010:2011
Running Man and ISO 3864-3:2012 (E) Wide Arrows
2
TEST METHOD
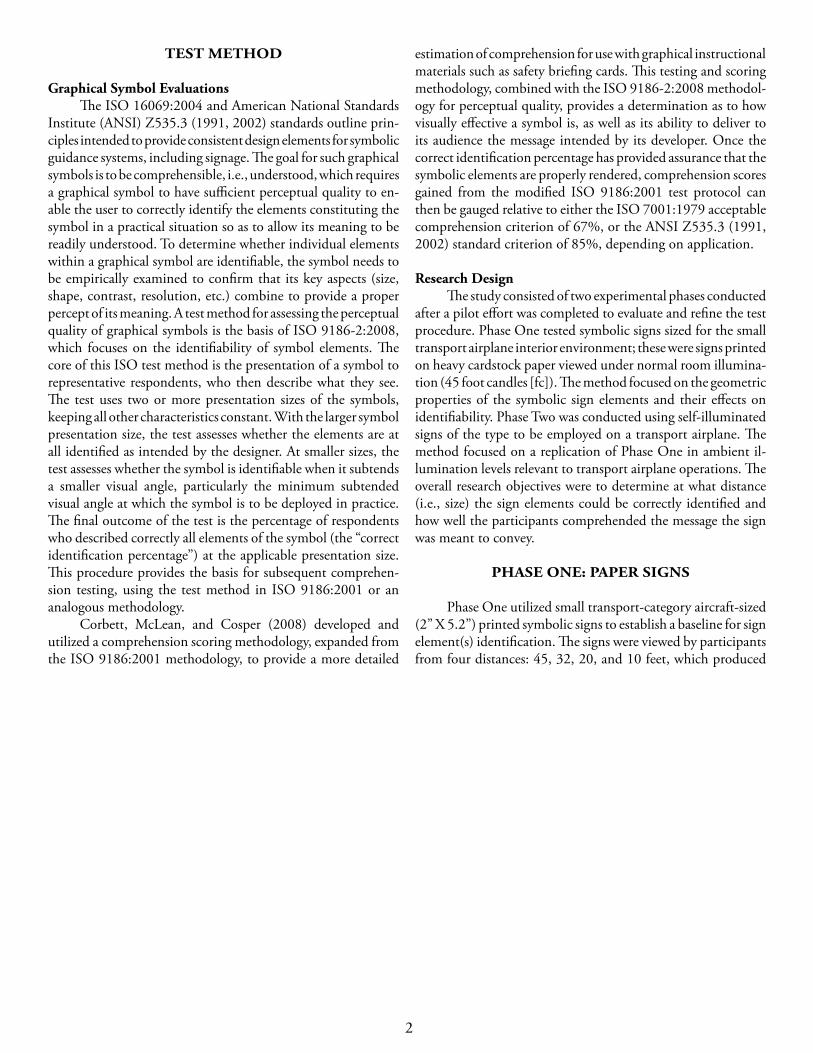
Graphical Symbol EvaluationsThe ISO 16069:2004 and American National Standards
Institute (ANSI) Z535.3 (1991, 2002) standards outline prin-ciples intended to provide consistent design elements for symbolic guidance systems, including signage. The goal for such graphical symbols is to be comprehensible, i.e., understood, which requires a graphical symbol to have sufficient perceptual quality to en-able the user to correctly identify the elements constituting the symbol in a practical situation so as to allow its meaning to be readily understood. To determine whether individual elements within a graphical symbol are identifiable, the symbol needs to be empirically examined to confirm that its key aspects (size, shape, contrast, resolution, etc.) combine to provide a proper percept of its meaning. A test method for assessing the perceptual quality of graphical symbols is the basis of ISO 9186-2:2008, which focuses on the identifiability of symbol elements. The core of this ISO test method is the presentation of a symbol to representative respondents, who then describe what they see. The test uses two or more presentation sizes of the symbols, keeping all other characteristics constant. With the larger symbol presentation size, the test assesses whether the elements are at all identified as intended by the designer. At smaller sizes, the test assesses whether the symbol is identifiable when it subtends a smaller visual angle, particularly the minimum subtended visual angle at which the symbol is to be deployed in practice. The final outcome of the test is the percentage of respondents who described correctly all elements of the symbol (the “correct identification percentage”) at the applicable presentation size. This procedure provides the basis for subsequent comprehen-sion testing, using the test method in ISO 9186:2001 or an analogous methodology.
Corbett, McLean, and Cosper (2008) developed and utilized a comprehension scoring methodology, expanded from the ISO 9186:2001 methodology, to provide a more detailed
estimation of comprehension for use with graphical instructional materials such as safety briefing cards. This testing and scoring methodology, combined with the ISO 9186-2:2008 methodol-ogy for perceptual quality, provides a determination as to how visually effective a symbol is, as well as its ability to deliver to its audience the message intended by its developer. Once the correct identification percentage has provided assurance that the symbolic elements are properly rendered, comprehension scores gained from the modified ISO 9186:2001 test protocol can then be gauged relative to either the ISO 7001:1979 acceptable comprehension criterion of 67%, or the ANSI Z535.3 (1991, 2002) standard criterion of 85%, depending on application.
Research DesignThe study consisted of two experimental phases conducted
after a pilot effort was completed to evaluate and refine the test procedure. Phase One tested symbolic signs sized for the small transport airplane interior environment; these were signs printed on heavy cardstock paper viewed under normal room illumina-tion (45 foot candles [fc]). The method focused on the geometric properties of the symbolic sign elements and their effects on identifiability. Phase Two was conducted using self-illuminated signs of the type to be employed on a transport airplane. The method focused on a replication of Phase One in ambient il-lumination levels relevant to transport airplane operations. The overall research objectives were to determine at what distance (i.e., size) the sign elements could be correctly identified and how well the participants comprehended the message the sign was meant to convey.
PHASE ONE: PAPER SIGNS
Phase One utilized small transport-category aircraft-sized (2” X 5.2”) printed symbolic signs to establish a baseline for sign element(s) identification. The signs were viewed by participants from four distances: 45, 32, 20, and 10 feet, which produced

3
overall horizontal viewing angles of 33.1, 46.55, 74.47, and 149 minutes of arc, respectively. However, because of the differences in the size and shape of individual sign elements, viewing angles for each element were inherently different (Table 1).
MaterialsThree test booklets were developed, consisting of eight
slides each (three Snellen letter charts (Appendix A), two target symbolic exit signs. and three alternate signs (Appendix B), printed on heavy cardstock paper, with blank pages between the slides. The test booklets were displayed on a blue partition background, 6-feet tall and 4-feet wide (Figure 3).
The arrow elements were paired with the running man elements or a standard first aid symbol. These element combi-nations were intended to gauge any effect of prior experience (priming) on identification of both arrow types combined in a symbolic exit sign. Arrow presentation order was counterbal-anced to preclude systematic priming effects.
Table 1: Viewing Angles for Sign Elements
Sign TypeElement Size
Minutes of Arc at each Viewing Distance
45 ft 32 ft 20 ft 10 ft
All SignsOverall Width 33.10 46.55 74.47 149
Overall Height 12.73 17.90 28.65 57.29
ISO 7010:2011-Approved Running Man
Symbol
Figure Width 7.52 10.57 16.92 33.84
Figure Height 10.28 14.45 23.12 46.24
Modified Running ManSymbol
Figure Width 7.27 10.22 16.35 32.71
Figure Height 10.03 14.10 22.56 45.11
Approved Modified Narrow Stroke-Width
Arrow
Figure Width 5.26 7.40 11.84 23.69
Figure Height 5.76 8.11 12.97 25.94
Stroke Width 0.75 1.06 1.69 3.38
ISO 3864-3Wide Stroke-Width
Arrow
Figure Width 3.01 4.23 6.77 13.53
Figure Height 4.26 5.99 9.59 19.17
Stroke Width 3.01 4.23 6.77 13.53
NOTE: Minutes of arc were calculated by finding the visual angle (a), Tan a = (S/D), where S is the size of the object and D is the distance from the viewer to the object, and multiplying it by 60 (Coren, Ward, & Enns, 2003).
Figure 3: Test Area and Booklet From 32-ft. Mark
Figure 3: Test Area and Booklet From 32-Foot Mark.

4
For the purpose of brevity, sign elements have been given a shortened referential name. The previously approved ISO 7010:2011 running man will be referred to as the “ISO run-ning man,” while the proposed running man will be referred to as the “modified running man.” The previously approved arrow in Figure 1, that conforms to the §25.812(b)(1) stroke width-to-height ratio for letters on an EXIT sign, will be referred to as the “narrow arrow,” and the proposed arrow in Figure 2 generally conforming to the ISO 3864-3:2012 (E), p. 15, type D figure will be referred to as the “wide arrow.”
ParticipantsThe 75 volunteer participants (27 female, 48 male) were
recruited from FAA Civil Aerospace Medical Institute (CAMI) personnel and attendees of cabin safety workshops held at CAMI. They ranged in age from 20 to 67 years with an average age of 45.5 years. The numbers of participants by age-decade were as follows: 20-29 (6), 30-39 (18), 40-49 (23), 50-59 (22), and 60-69 (6). Participant height ranged from 60 inches to 76 inches, with an average height of 68.4 inches.
ProcedureParticipants were recruited and brought to the laboratory
on an individual basis. They first read and signed the required informed consent form and provided limited demographic in-formation. When told that their vision would be tested, some participants asked if they needed to retrieve their eyeglasses. They were asked whether they would normally do so while walking or flying as a passenger on a transport aircraft, and because all of them answered “no,” none of the participants who asked re-trieved their eyeglasses. Participants were then briefed as to the test procedure, including where to stand on the test track, how to indicate the smallest line of text they could read on a standard Snellen chart, and the procedure for performing the vision test repeatedly at the 32-, 20-, and 10-foot viewing distance marks before beginning the ISO 9186-2 identification task. The test facilitator recorded all oral responses in a Microsoft (MS) Excel® spreadsheet, with a digital audio-recording back-up.
Upon completion of the visual acuity test, each participant was instructed to go to the 45-foot viewing distance mark, where s/he was shown the first symbolic sign in the test booklet and asked to “please identify all the elements of the picture.” After giving an answer, or after 20 seconds had elapsed without an
answer, the researcher said, “Thank you,” the graphic was cov-ered with a blank page, and the participant was instructed to move to the 32-foot mark. This procedure was repeated again, followed by repetitions of the procedure at the 20- and 10-foot marks. Following his or her response at the 10-foot mark, the participant was asked to “Please describe the meaning of this picture.” Once this comprehension question was answered, the participant then returned to the 45-foot mark, and the process was repeated for the other four symbolic signs in the test booklet. At the conclusion of the test, the participant was thanked and escorted out of the testing lab by an assistant, who then brought in the next participant. During this interval, the test booklets were changed in preparation for the next participant. The average time for each participant to complete the test was approximately 12 minutes.
Data AnalysisAll responses, including those to the alternate signs, were
categorized by the distance from which the participant first cor-rectly identified the elements of the sign, i.e., 45, 32, 20, or 10 feet. Since each trial involved the participant seeing one type of arrow element in varying combinations with the running man symbol and the alternate symbol(s), all participants yielded three categorical data points for correct identification of the target elements. Descriptive statistics and chi-square analyses were conducted using MS Excel® and IBM SPSS® software.
Comprehension responses were assessed using the Corbett, McLean, & Cosper (2008) modification of the ISO 9186:2001 procedure. The comprehension responses were evaluated by three expert judges, based on correctness, and categorized as follows, with comprehension being: certain = response was correct and complete, i.e., exit ahead; likely = response was mostly correct but missing a key element(s), e.g., exit this way; arguable = response contained words or ideas that indicated partial correctness but were ambiguous or unclear, e.g., get out, exit; suspect = response contained words or ideas that were related but misconstrued, e.g., run/move ahead; opposite = response contained words or ideas that were related but contradictory to the correct response, e.g., run inside; wrong = response was wrong, e.g., elevator ahead; none = response was “I do not know” or equivalent. Categorized responses were then transformed, using a weighted algorithm, to yield comprehension “scores.”
5
RESULTS
Visual AcuitySix participants (8%) tested at lower than normal visual
acuity (ex. 20/25, 20/32), 24 participants (32%) tested at normal visual acuity (20/20), and the remaining 45 (60%) participants tested at better than normal visual acuity (20/16, 20/12, 20/10).
Chi-square analysis showed that identifiability of symbolic sign elements was dependent upon visual acuity for the modified running man with both wide and narrow arrows, as well as the ISO running man with narrow arrows (χ2(6, N = 75) = 19.967, p = .003). The analysis also confirmed the contribution of visual acuity for correct identification of all sign elements (p < .01), in that participants with greater visual acuity correctly identified sign elements from farther away. Table 2 illustrates this effect.
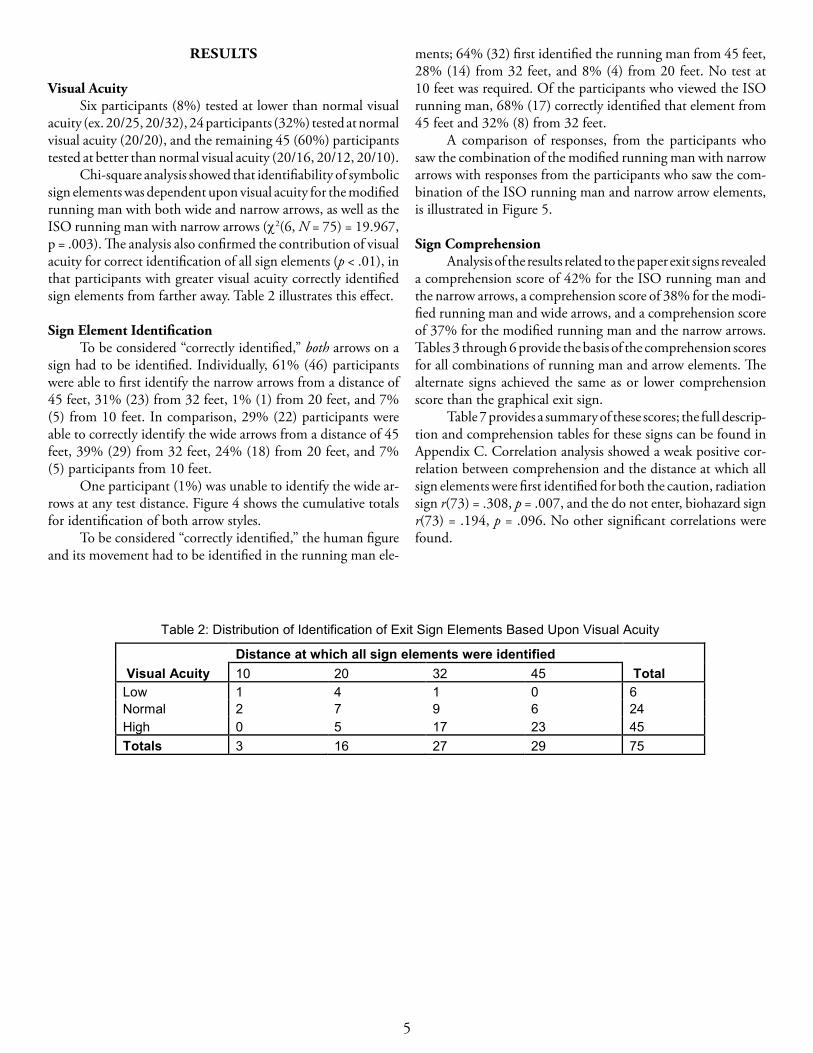
Sign Element IdentificationTo be considered “correctly identified,” both arrows on a
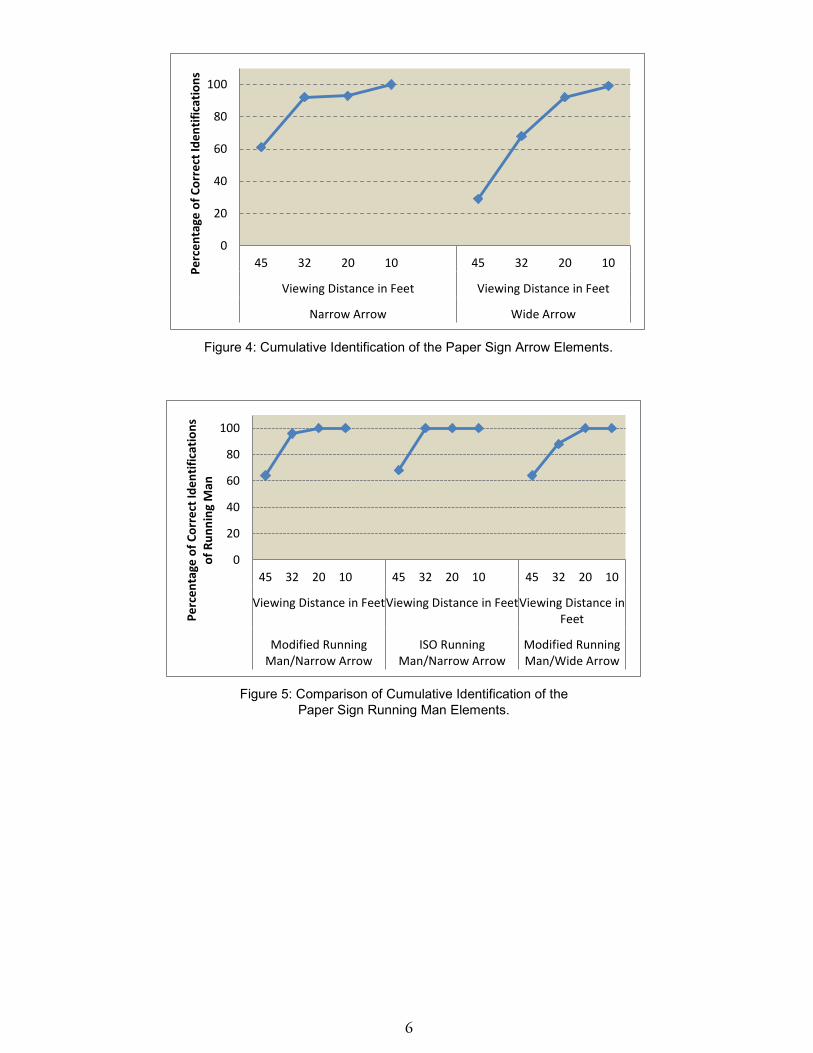
sign had to be identified. Individually, 61% (46) participants were able to first identify the narrow arrows from a distance of 45 feet, 31% (23) from 32 feet, 1% (1) from 20 feet, and 7% (5) from 10 feet. In comparison, 29% (22) participants were able to correctly identify the wide arrows from a distance of 45 feet, 39% (29) from 32 feet, 24% (18) from 20 feet, and 7% (5) participants from 10 feet.
One participant (1%) was unable to identify the wide ar-rows at any test distance. Figure 4 shows the cumulative totals for identification of both arrow styles.
To be considered “correctly identified,” the human figure and its movement had to be identified in the running man ele-
Table 2: Distribution of Identification of Exit Sign Elements Based Upon Visual Acuity
Distance at which all sign elements were identifiedVisual Acuity 10 20 32 45 TotalLow 1 4 1 0 6Normal 2 7 9 6 24High 0 5 17 23 45Totals 3 16 27 29 75
ments; 64% (32) first identified the running man from 45 feet, 28% (14) from 32 feet, and 8% (4) from 20 feet. No test at 10 feet was required. Of the participants who viewed the ISO running man, 68% (17) correctly identified that element from 45 feet and 32% (8) from 32 feet.
A comparison of responses, from the participants who saw the combination of the modified running man with narrow arrows with responses from the participants who saw the com-bination of the ISO running man and narrow arrow elements, is illustrated in Figure 5.
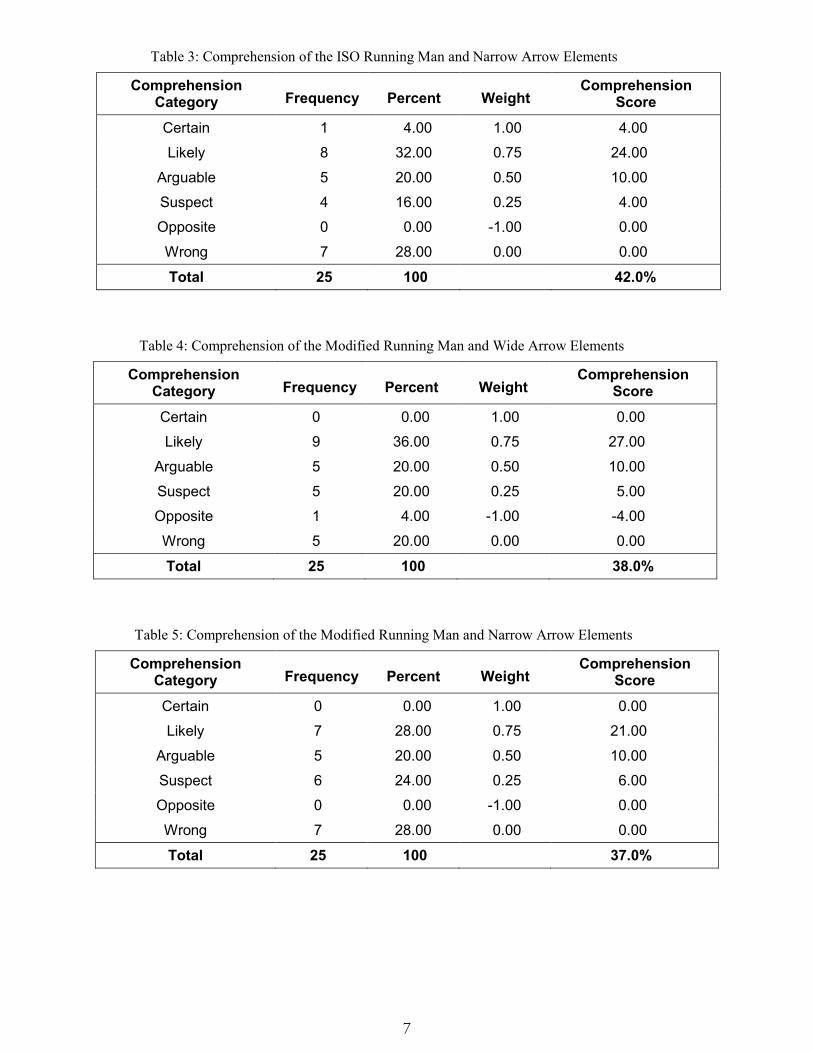
Sign ComprehensionAnalysis of the results related to the paper exit signs revealed
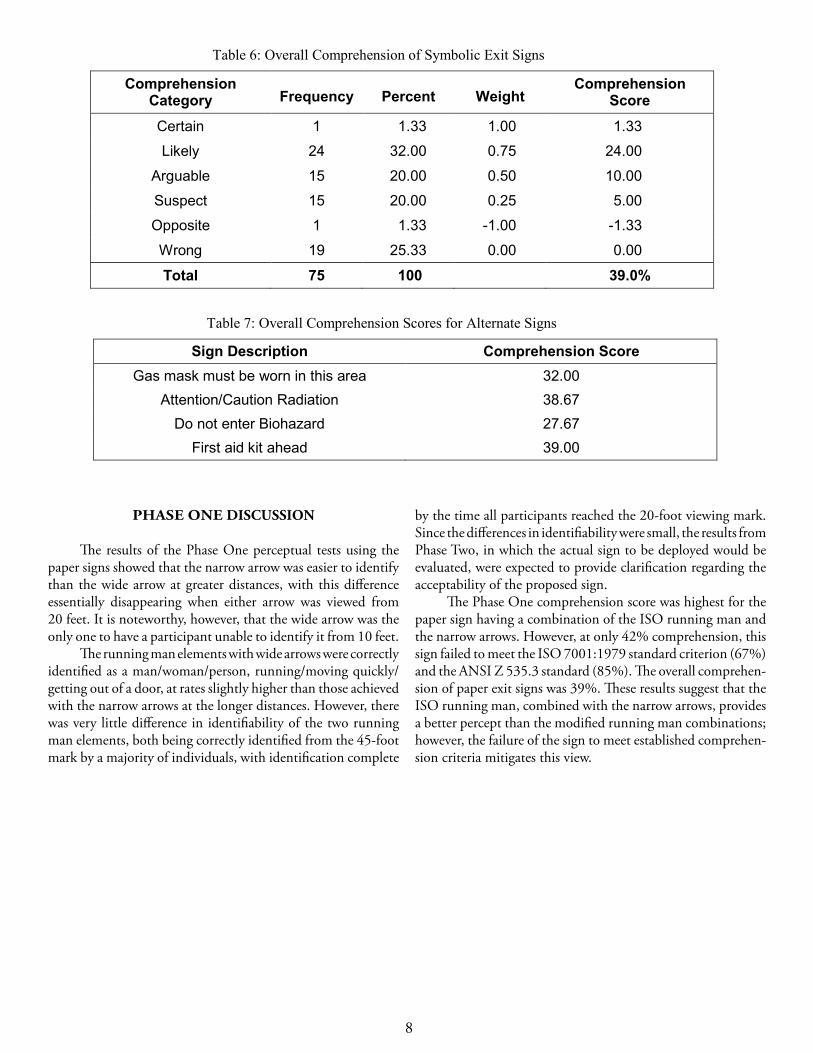
a comprehension score of 42% for the ISO running man and the narrow arrows, a comprehension score of 38% for the modi-fied running man and wide arrows, and a comprehension score of 37% for the modified running man and the narrow arrows. Tables 3 through 6 provide the basis of the comprehension scores for all combinations of running man and arrow elements. The alternate signs achieved the same as or lower comprehension score than the graphical exit sign.
Table 7 provides a summary of these scores; the full descrip-tion and comprehension tables for these signs can be found in Appendix C. Correlation analysis showed a weak positive cor-relation between comprehension and the distance at which all sign elements were first identified for both the caution, radiation sign r(73) = .308, p = .007, and the do not enter, biohazard sign r(73) = .194, p = .096. No other significant correlations were found.
6
Figure 5: Comparison of Cumulative Identification of the Paper Sign Running Man Elements.
0
20
40
60
80
100
45 32 20 10 45 32 20 10 45 32 20 10
Viewing Distance in FeetViewing Distance in FeetViewing Distance inFeet
Modified RunningMan/Narrow Arrow
ISO RunningMan/Narrow Arrow
Modified RunningMan/Wide Arrow
Perc
enta
ge o
f Cor
rect
Iden
tific
atio
ns
of R
unni
ng M
an
Figure 4: Cumulative Identification of the Paper Sign Arrow Elements.
0
20
40
60
80
100
45 32 20 10 45 32 20 10
Viewing Distance in Feet Viewing Distance in Feet
Narrow Arrow Wide Arrow
Perc
enta
ge o
f Cor
rect
Iden
tific
atio
ns
7
Table 4: Comprehension of the Modified Running Man and Wide Arrow Elements
Comprehension Category Frequency Percent Weight
Comprehension Score
Certain 0 0.00 1.00 0.00
Likely 9 36.00 0.75 27.00
Arguable 5 20.00 0.50 10.00
Suspect 5 20.00 0.25 5.00
Opposite 1 4.00 -1.00 -4.00
Wrong 5 20.00 0.00 0.00
Total 25 100 38.0%.
Table 5: Comprehension of the Modified Running Man and Narrow Arrow Elements
Comprehension Category Frequency Percent Weight
Comprehension Score
Certain 0 0.00 1.00 0.00
Likely 7 28.00 0.75 21.00
Arguable 5 20.00 0.50 10.00
Suspect 6 24.00 0.25 6.00
Opposite 0 0.00 -1.00 0.00
Wrong 7 28.00 0.00 0.00
Total 25 100 37.0%
Table 3: Comprehension of the ISO Running Man and Narrow Arrow Elements
Comprehension Category Frequency Percent Weight
Comprehension Score
Certain 1 4.00 1.00 4.00
Likely 8 32.00 0.75 24.00
Arguable 5 20.00 0.50 10.00
Suspect 4 16.00 0.25 4.00
Opposite 0 0.00 -1.00 0.00
Wrong 7 28.00 0.00 0.00
Total 25 100 42.0%
8
Table 6: Overall Comprehension of Symbolic Exit Signs
Comprehension Category Frequency Percent Weight
Comprehension Score
Certain 1 1.33 1.00 1.33
Likely 24 32.00 0.75 24.00
Arguable 15 20.00 0.50 10.00
Suspect 15 20.00 0.25 5.00
Opposite 1 1.33 -1.00 -1.33
Wrong 19 25.33 0.00 0.00
Total 75 100 39.0%
Table 7: Overall Comprehension Scores for Alternate Signs
Sign Description Comprehension ScoreGas mask must be worn in this area 32.00
Attention/Caution Radiation 38.67Do not enter Biohazard 27.67
First aid kit ahead 39.00
PHASE ONE DISCUSSION
The results of the Phase One perceptual tests using the paper signs showed that the narrow arrow was easier to identify than the wide arrow at greater distances, with this difference essentially disappearing when either arrow was viewed from 20 feet. It is noteworthy, however, that the wide arrow was the only one to have a participant unable to identify it from 10 feet.
The running man elements with wide arrows were correctly identified as a man/woman/person, running/moving quickly/getting out of a door, at rates slightly higher than those achieved with the narrow arrows at the longer distances. However, there was very little difference in identifiability of the two running man elements, both being correctly identified from the 45-foot mark by a majority of individuals, with identification complete
by the time all participants reached the 20-foot viewing mark. Since the differences in identifiability were small, the results from Phase Two, in which the actual sign to be deployed would be evaluated, were expected to provide clarification regarding the acceptability of the proposed sign.
The Phase One comprehension score was highest for the paper sign having a combination of the ISO running man and the narrow arrows. However, at only 42% comprehension, this sign failed to meet the ISO 7001:1979 standard criterion (67%) and the ANSI Z 535.3 standard (85%). The overall comprehen-sion of paper exit signs was 39%. These results suggest that the ISO running man, combined with the narrow arrows, provides a better percept than the modified running man combinations; however, the failure of the sign to meet established comprehen-sion criteria mitigates this view.

9
PHASE TWO: SELF-ILLUMINATED EXIT SIGNS
The sign presentation medium was changed from paper to the self-illuminated signs intended for use on a small transport airplane (Figure 2) in Phase Two. However, rather than presenting multiple alternate signs in addition to the symbolic exit signs, the number of signs was reduced to four: the modified running man element with wide arrows pointing either upward or out and an Automatic External Defibrillator (AED) alternate sign combined with similarly-oriented narrow arrows (Figure 6). Each participant viewed one of the exit signs and one of the alternate signs.
The arrow orientations were varied to test for orientation effects on identification and comprehension. These signs were presented in four different ambient illumination conditions (0.0, 0.05, 0.5, and 45 foot candles) typical of the illumination levels found during aircraft operations at night and during the day. Sign presentation order and ambient lighting condition was counterbalanced among participants to reduce priming effects on arrow identification. The test area was also modified, includ-ing the provision of an outline of the “test track” (Figure 7) and placement of a side track at the 32-foot mark for displaying the Snellen vision screening charts (Figure 8).
MaterialsThe four signs of the type to be used on a transport
airplane were mounted in a box having dividers between the signs to prevent glare from illumination of non-tested signs. Two signs had the modified running man exit signs; the other two presented alternate facings. The signs were connected to a switchboard powered by an adjustable DC power supply set at 24 volts to simulate aircraft power. Adjustable ambient room lighting was achieved with a stand-alone 120 volt AC dimmer and two strings of steady-burning white indoor miniature lights mounted above the fluorescent light fixture diffusion panels to prevent point-source glare during the trials, except for the high lighting condition, which was achieved merely by turning on the fluorescent room lights.
Distance markers were distinguished by photo luminescent strips placed on the floor and numbered 1 through 4, corre-sponding to the 45-, 32-, 20-, and 10-foot viewing distances, respectively. The strips were used to facilitate participant place-ment at the various viewing locations during trials in which the room was darkened. The viewing distance to the Snellen charts was 20 feet. Phase Two data were collected in a manner analogous to that used in Phase One, except that instead of using flip charts for sign presentation, the test administrator operated the switchboard to turn the self-illuminated signs on and off.
Figure 6: ISO 7010:2011 Automatic External Defibrillator and Narrowed ISO 3864-3:2012 (E), pg 15, Type D Arrows
Figure 6: ISO 7010:2011 Automatic External Defibrillator and Narrowed ISO 3864-3:2012 (E), pg 15, Type D Arrows
Figure 7: Test Track and Signs Viewed From the 45-Foot Marker
Figure 7: Test Track and Signs Viewed From the 45-Foot Marker.
Figure 8: Snellen Charts Displayed on Side Test Track
Figure 8: Snellen Charts Displayed on Side Test Track
10
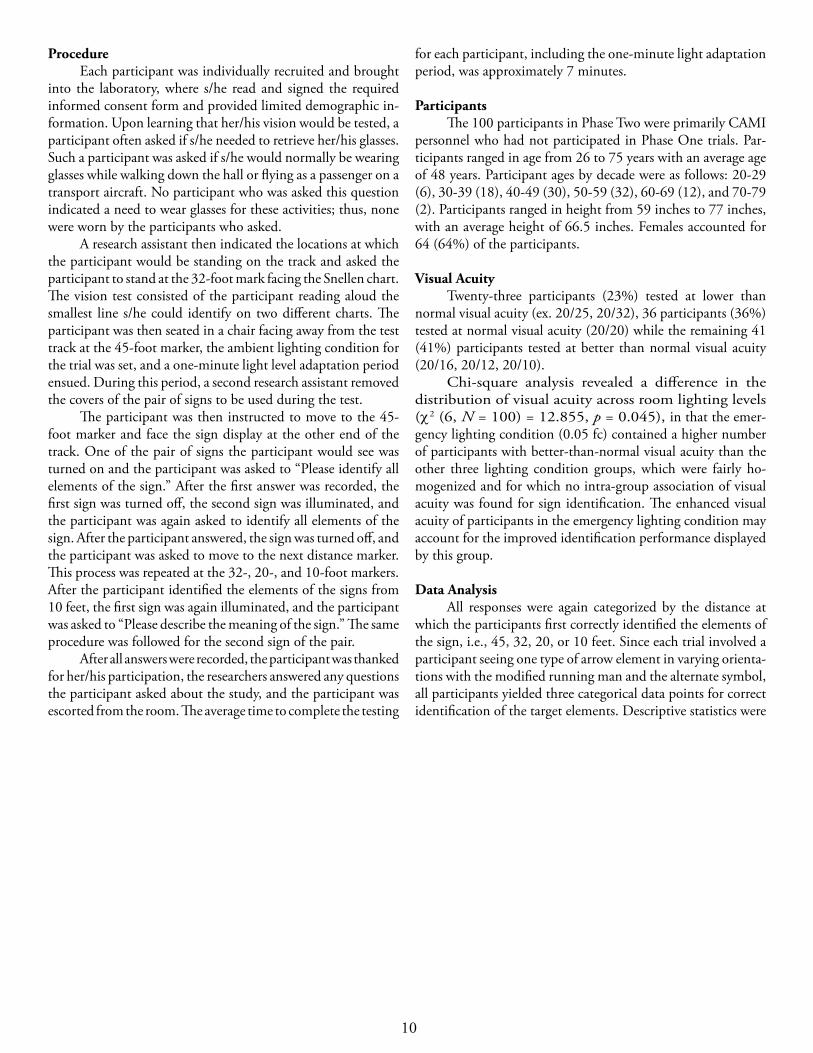
ProcedureEach participant was individually recruited and brought
into the laboratory, where s/he read and signed the required informed consent form and provided limited demographic in-formation. Upon learning that her/his vision would be tested, a participant often asked if s/he needed to retrieve her/his glasses. Such a participant was asked if s/he would normally be wearing glasses while walking down the hall or flying as a passenger on a transport aircraft. No participant who was asked this question indicated a need to wear glasses for these activities; thus, none were worn by the participants who asked.
A research assistant then indicated the locations at which the participant would be standing on the track and asked the participant to stand at the 32-foot mark facing the Snellen chart. The vision test consisted of the participant reading aloud the smallest line s/he could identify on two different charts. The participant was then seated in a chair facing away from the test track at the 45-foot marker, the ambient lighting condition for the trial was set, and a one-minute light level adaptation period ensued. During this period, a second research assistant removed the covers of the pair of signs to be used during the test.
The participant was then instructed to move to the 45-foot marker and face the sign display at the other end of the track. One of the pair of signs the participant would see was turned on and the participant was asked to “Please identify all elements of the sign.” After the first answer was recorded, the first sign was turned off, the second sign was illuminated, and the participant was again asked to identify all elements of the sign. After the participant answered, the sign was turned off, and the participant was asked to move to the next distance marker. This process was repeated at the 32-, 20-, and 10-foot markers. After the participant identified the elements of the signs from 10 feet, the first sign was again illuminated, and the participant was asked to “Please describe the meaning of the sign.” The same procedure was followed for the second sign of the pair.
After all answers were recorded, the participant was thanked for her/his participation, the researchers answered any questions the participant asked about the study, and the participant was escorted from the room. The average time to complete the testing
for each participant, including the one-minute light adaptation period, was approximately 7 minutes.
Participants The 100 participants in Phase Two were primarily CAMI
personnel who had not participated in Phase One trials. Par-ticipants ranged in age from 26 to 75 years with an average age of 48 years. Participant ages by decade were as follows: 20-29 (6), 30-39 (18), 40-49 (30), 50-59 (32), 60-69 (12), and 70-79 (2). Participants ranged in height from 59 inches to 77 inches, with an average height of 66.5 inches. Females accounted for 64 (64%) of the participants.
Visual AcuityTwenty-three participants (23%) tested at lower than
normal visual acuity (ex. 20/25, 20/32), 36 participants (36%) tested at normal visual acuity (20/20) while the remaining 41 (41%) participants tested at better than normal visual acuity (20/16, 20/12, 20/10).
Chi-square analysis revealed a difference in the distribution of visual acuity across room lighting levels (χ2 (6, N = 100) = 12.855, p = 0.045), in that the emer-gency lighting condition (0.05 fc) contained a higher number of participants with better-than-normal visual acuity than the other three lighting condition groups, which were fairly ho-mogenized and for which no intra-group association of visual acuity was found for sign identification. The enhanced visual acuity of participants in the emergency lighting condition may account for the improved identification performance displayed by this group.
Data AnalysisAll responses were again categorized by the distance at
which the participants first correctly identified the elements of the sign, i.e., 45, 32, 20, or 10 feet. Since each trial involved a participant seeing one type of arrow element in varying orienta-tions with the modified running man and the alternate symbol, all participants yielded three categorical data points for correct identification of the target elements. Descriptive statistics were

11
primarily derived from the Excel® spreadsheet in which the data were recorded, whereas IBM SPSS® was used to conduct chi-square analyses. Comprehension scoring utilized the same methodology as in Phase One; tables displaying the comprehen-sion scores are presented below.
RESULTS
To receive credit for correctly identifying the arrow ele-ments, participants had to identify both arrow elements on the sign as arrows, including their orientation. To receive credit as correctly identifying the running man element the participants had to identify a human figure and its movement symbolism. As expected, Chi-square analysis revealed that participants with greater visual acuity were able to correctly identify the sign elements from farther away (p < .01) than their counterparts. Arrow element rotations were compared within each ambient lighting condition; arrow identification was not associated with arrow orientation.
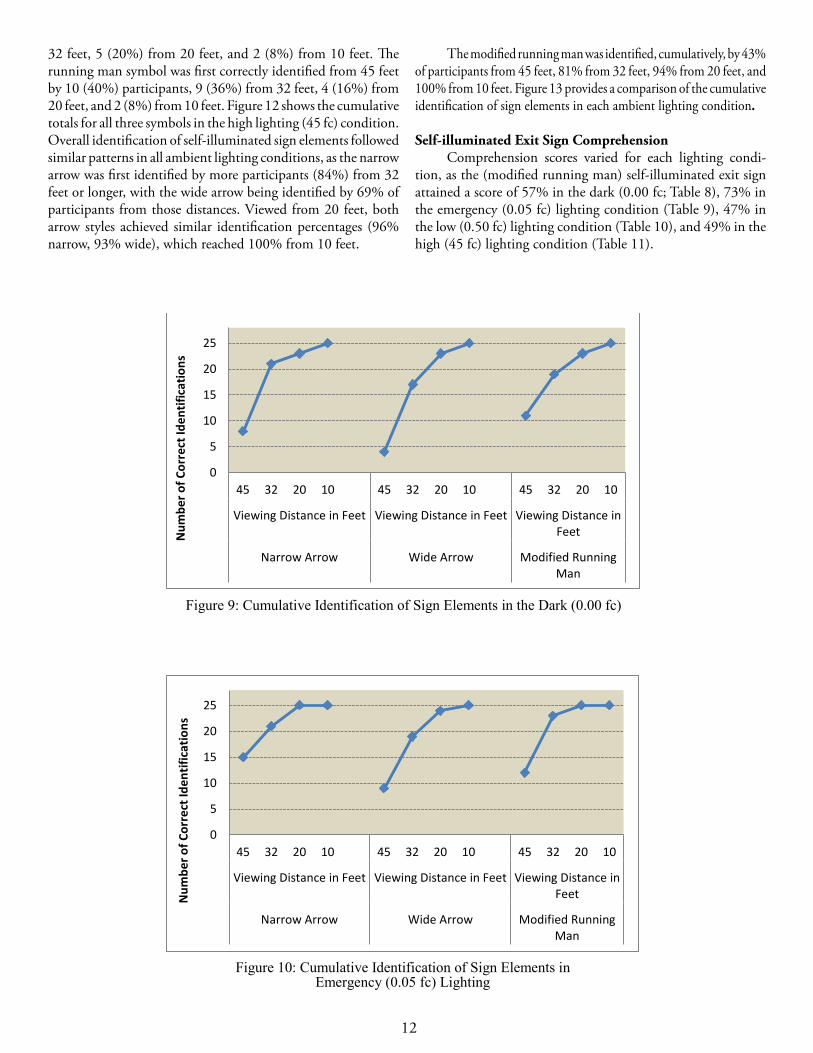
Ambient Lighting Conditions In the Dark (0.00 fc) — Twenty-five participants viewed the
self-illuminated signs in the dark (0.00 fc) condition, with the notable exception that the ambient illumination at the 10-foot mark was approximately 0.05 fc due to the illumination produced by the self-illuminated signs. Eighteen (72%) of the participants in this test condition were female. The average participant age was 47 years. Seven (28%) participants had lower than normal visual acuity, 8 (32%) had normal visual acuity, and 10 (40%) had better than normal visual acuity.
Eight (32%) participants first correctly identified the nar-row arrow from 45 feet, 13 (52%) from 32 feet, 2 (8%) from 20 feet, and 2 (8%) from 10 feet. Four (16%) participants first correctly identified the wide arrow from 45 feet, 13 (52%) from 32 feet, 6 (24%) from 20 feet, and 2 (8%) from 10 feet. The running man symbol was first correctly identified from 45 feet by 11 (44%) participants, 8 (32%) from 32 feet, 4 (16%) from 20 feet, and 2 (8%) from 10 feet. Figure 9 shows the cumula-tive totals for all three symbols in the dark (0.00 fc) condition.
In Emergency Lighting (0.05 fc) — Twenty-five participants viewed the self-illuminated signs in the airplane emergency lighting (0.05 fc) condition. Thirteen (52%) participants in this
test condition were female. The average participant age was 40 years. Three (12%) participants had lower than normal visual acuity, 5 (20%) had normal visual acuity, and 17 (68%) had better than normal visual acuity.
Fifteen (60%) participants first correctly identified the nar-row arrow at 45 feet, 6 (24%) first correctly identified the narrow arrow from 32 feet, 4 (16%) from 20 feet, and all participants had already identified the narrow arrow before reaching 10 feet. Nine (36%) participants first correctly identified the wide arrow from 45 feet, 10 (40%) from 32 feet, 5 (20%) from 20 feet, and 1 (4%) from 10 feet. The running man symbol was first correctly identified from 45 feet by 13 (52%) participants, 10 (40%) from 32 feet, and 2 (8%) from 20 feet. All participants identified the running man before reaching the 10-foot mark. Figure 10 shows the cumulative totals for all three symbols in the emergency lighting (0.05 fc) condition.
In Low Lighting (0.50 fc) — Twenty-five participants viewed the self-illuminated signs in the low lighting (0.50 fc) condition. The majority (56%) of participants in this group was female and the average age was 50 years. Five (20%) participants had lower than normal visual acuity, 13 (52%) had normal visual acuity, and 7 (28%) had better than normal visual acuity.
Seven (28%) participants first correctly identified the narrow arrow from 45 feet, 14 (56%) from 32 feet, 3 (12%) from 20 feet, and 1 (4%) from 10 feet. Two (8%) participants first correctly identified the wide arrow from 45 feet, 13 (52%) from 32 feet, 8 (32%) from 20 feet, and 2 (8%) from 10 feet. The running man symbol was first correctly identified from 45 feet by 9 (36%) participants, 11 (44%) from 32 feet, 3 (12%) from 20 feet, and 2 (8%) from 10 feet. Figure 11 shows the cumulative totals for all three symbols in the low lighting (0.50 fc) condition.
In High Lighting (45 fc) — Twenty-five participants viewed the signs in the high lighting (45 fc) condition. Nineteen (76%) of the participants in this group were female, and the average participant age was 52 years. Eight (32%) participants had lower than normal visual acuity, 10 (40%) had normal visual acuity, and 7 (28%) had better than normal visual acuity.
Twelve (48%) participants first correctly identified the narrow arrow from 45 feet, 9 (36%) from 32 feet, 3 (12%) from 20 feet, and 1 (4%) from 10 feet. Three (12%) participants first correctly identified the wide arrow from 45 feet, 15 (60%) from
12
32 feet, 5 (20%) from 20 feet, and 2 (8%) from 10 feet. The running man symbol was first correctly identified from 45 feet by 10 (40%) participants, 9 (36%) from 32 feet, 4 (16%) from 20 feet, and 2 (8%) from 10 feet. Figure 12 shows the cumulative totals for all three symbols in the high lighting (45 fc) condition. Overall identification of self-illuminated sign elements followed similar patterns in all ambient lighting conditions, as the narrow arrow was first identified by more participants (84%) from 32 feet or longer, with the wide arrow being identified by 69% of participants from those distances. Viewed from 20 feet, both arrow styles achieved similar identification percentages (96% narrow, 93% wide), which reached 100% from 10 feet.
The modified running man was identified, cumulatively, by 43% of participants from 45 feet, 81% from 32 feet, 94% from 20 feet, and 100% from 10 feet. Figure 13 provides a comparison of the cumulative identification of sign elements in each ambient lighting condition.
Self-illuminated Exit Sign ComprehensionComprehension scores varied for each lighting condi-
tion, as the (modified running man) self-illuminated exit sign attained a score of 57% in the dark (0.00 fc; Table 8), 73% in the emergency (0.05 fc) lighting condition (Table 9), 47% in the low (0.50 fc) lighting condition (Table 10), and 49% in the high (45 fc) lighting condition (Table 11).
Figure 9: Cumulative Identification of Sign Elements in the Dark (0.00 fc)
0
5
10
15
20
25
45 32 20 10 45 32 20 10 45 32 20 10
Viewing Distance in Feet Viewing Distance in Feet Viewing Distance inFeet
Narrow Arrow Wide Arrow Modified RunningMan
Num
ber o
f Cor
rect
Iden
tific
atio
ns
Figure 10: Cumulative Identification of Sign Elements in Emergency (0.05 fc) Lighting
0
5
10
15
20
25
45 32 20 10 45 32 20 10 45 32 20 10
Viewing Distance in Feet Viewing Distance in Feet Viewing Distance inFeet
Narrow Arrow Wide Arrow Modified RunningMan
Num
ber o
f Cor
rect
Iden
tific
atio
ns

13
Figure 11: Cumulative Identification of Sign Elements in Low (0.50 fc) Lighting
0
5
10
15
20
25
45 32 20 10 45 32 20 10 45 32 20 10
Viewing Distance in Feet Viewing Distance in Feet Viewing Distance inFeet
Narrow Arrow Wide Arrow Modified RunningMan
Num
ber o
f Cor
rect
Iden
tific
atio
ns
Figure 12: Cumulative Identification of Sign Elements in High (45 fc) Lighting
0
5
10
15
20
25
45 32 20 10 45 32 20 10 45 32 20 10
Viewing Distance in Feet Viewing Distance in Feet Viewing Distance inFeet
Narrow Arrow Wide Arrow Modified RunningMan
Num
ber o
f Cor
rect
Iden
tific
atio
ns
Figure 13: Cumulative Identification of Sign Elements in All Lighting Conditions
0
5
10
15
20
25
45 32 20 10 45 32 20 10 45 32 20 10 45 32 20 10
Viewing Distance inFeet
Viewing Distance inFeet
Viewing Distance inFeet
ViewingDistance in Feet
Dark (0.0 fc) Emergency (0.05 fc) Low (0.5 fc) High (45 fc)
Num
ber o
f Cor
rect
Iden
tific
atio
ns
Wide Arrow Narrow Arrow Modified Running Man

14
Table 8. Comprehension of Self-Illuminated Exit Signs In Dark (0.00 fc) Lighting
Comprehension Category Frequency Percent Weight
Comprehension Score
Certain 10 40.00 1.00 40.00
Likely 3 12.00 0.75 9.00
Arguable 2 8.00 0.50 4.00
Suspect 4 16.00 0.25 4.00
Opposite 0 0.00 -1.00 0.00
WrongNone
60
24.000.00
0.000.00
0.000.00
Total 25 100.0 57.00
Table 9. Comprehension of Self-Illuminated Exit Signs In Emergency (0.05 fc) Lighting
Comprehension Category Frequency Percent Weight
Comprehension Score
Certain 14 56.00 1.00 56.00
Likely 1 4.00 0.75 3.00
Arguable 5 20.00 0.50 10.00
Suspect 4 16.00 0.25 4.00
Opposite 0 0.00 -1.00 0.00
WrongNone
10
4.000.00
0.000.00
0.000.00
Total 25 100.0 73.00
Table 10. Comprehension of Self-Illuminated Exit Signs In Low (0.50) fc Lighting
Comprehension Category Frequency Percent Weight
Comprehension Score
Certain 4 16.00 1.00 16.00
Likely 5 20.00 0.75 15.00
Arguable 7 28.00 0.50 14.00
Suspect 2 8.00 0.25 2.00
Opposite 0 0.00 -1.00 0.00
WrongNone
61
24.004.00
0.000.00
0.000.00
Total 25 100.0 47.00
15
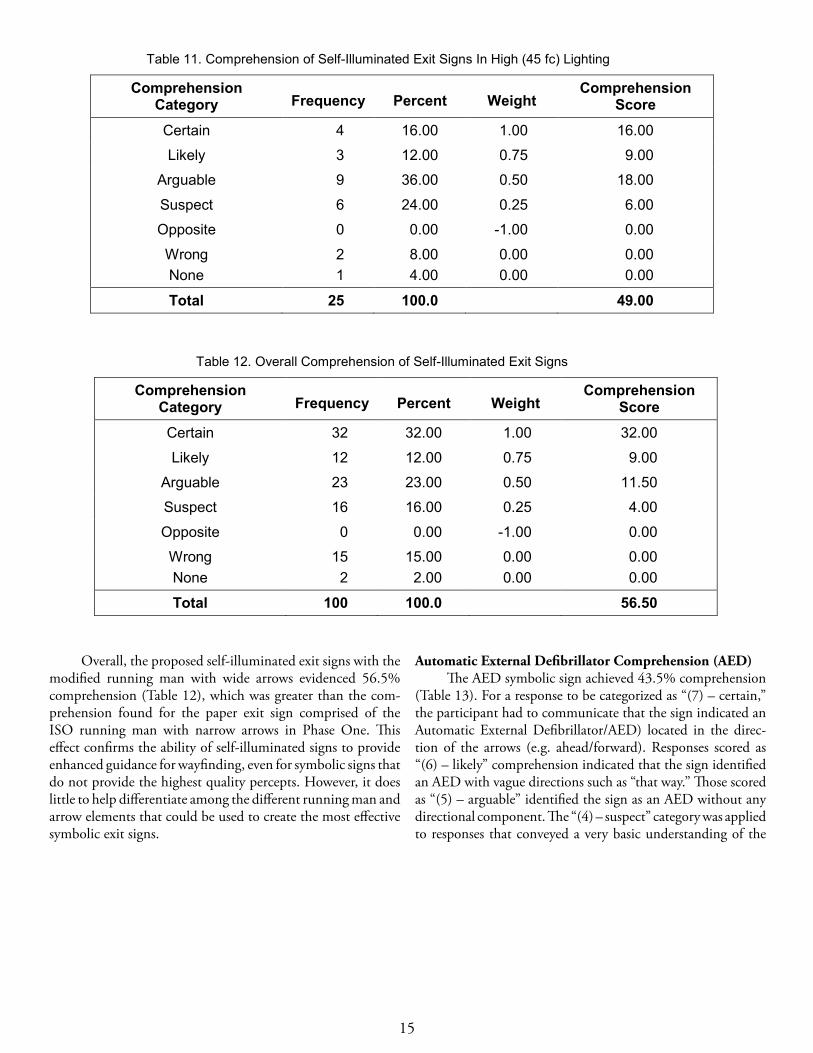
Overall, the proposed self-illuminated exit signs with the modified running man with wide arrows evidenced 56.5% comprehension (Table 12), which was greater than the com-prehension found for the paper exit sign comprised of the ISO running man with narrow arrows in Phase One. This effect confirms the ability of self-illuminated signs to provide enhanced guidance for wayfinding, even for symbolic signs that do not provide the highest quality percepts. However, it does little to help differentiate among the different running man and arrow elements that could be used to create the most effective symbolic exit signs.
Automatic External Defibrillator Comprehension (AED)The AED symbolic sign achieved 43.5% comprehension
(Table 13). For a response to be categorized as “(7) – certain,” the participant had to communicate that the sign indicated an Automatic External Defibrillator/AED) located in the direc-tion of the arrows (e.g. ahead/forward). Responses scored as “(6) – likely” comprehension indicated that the sign identified an AED with vague directions such as “that way.” Those scored as “(5) – arguable” identified the sign as an AED without any directional component. The “(4) – suspect” category was applied to responses that conveyed a very basic understanding of the
Table 11. Comprehension of Self-Illuminated Exit Signs In High (45 fc) Lighting
Comprehension Category Frequency Percent Weight
Comprehension Score
Certain 4 16.00 1.00 16.00
Likely 3 12.00 0.75 9.00
Arguable 9 36.00 0.50 18.00
Suspect 6 24.00 0.25 6.00
Opposite 0 0.00 -1.00 0.00
WrongNone
21
8.004.00
0.000.00
0.000.00
Total 25 100.0 49.00
Table 12. Overall Comprehension of Self-Illuminated Exit Signs
Comprehension Category Frequency Percent Weight
Comprehension Score
Certain 32 32.00 1.00 32.00
Likely 12 12.00 0.75 9.00
Arguable 23 23.00 0.50 11.50
Suspect 16 16.00 0.25 4.00
Opposite 0 0.00 -1.00 0.00
WrongNone
152
15.002.00
0.000.00
0.000.00
Total 100 100.0 56.50

16
Table 13.Overall Automatic External Defibrillator Comprehension
Comprehension Category Frequency Percent Weight
Comprehension Score
Certain 19 19.00 1.00 19.00
Likely 17 17.00 0.75 12.75
Arguable 19 19.00 0.50 9.50
Suspect 9 9.00 0.25 2.25
Opposite 0 0.00 -1.00 0.00
Wrong 16 16.00 0.00 0.00
None 20 20.00 0.00 0.00
Total 100 100.0 43.50
medical nature of the sign, such as “heart safety information,” “emergency thing,” and “go there if you are having a heart at-tack,” as well as those responses only indicating direction. The “(3) – wrong” answers were varied, including responses such as identifying the sign as an indicator for a first aid kit. Responses categorized as “(1) – none” included “I do not know” or the equivalent body gesture, as well as a large number of “no” replies to the question “Could you please describe the meaning of the
sign” and participants whose response showed a lack of under-standing of the question, such that the response was a repetition of describing the characteristics of the symbols.
These results suggest that, even at this early date in the history of symbolic exit sign deployment in the U.S., their fa-miliarity has already exceeded that of symbolic signs related to less common referents such as the AED.
CONCLUSION
The scope and outcomes of this research lead to multiple conclusions and recommendations. First, considering the small size of the signs tested, the larger arrow element with the narrow stroke width provides enhanced discriminability at distances greater than 20 feet. Secondly, the minor differences in configuration between the ISO 7010:2011 running man and the modified running man do not appear to alter identification and comprehension rates appreciably, except at greater distances, which suggests a general need to consider identifiability and comprehensibility vis-à-vis visual acuity for all symbolic signs. Third, the comprehension results of all signs and symbols used in this study point to an un-derlying component of symbol literacy that should be considered alongside exposure and experience with the sign: the intuitiveness of the symbols. Experience could account for the highest scoring non-exit signs, the AED indicator and the first-aid kit identifier. However, with a sampling of an American audience, familiar with seeing a red and white EXIT sign, the symbol of a person running out a door, signifying exit, was comprehended at a same or better percentage than the other symbols which commonly appear in both real-world settings (AED, first-aid kit) and common enter-tainment settings (Biohazard, Radiation). Also, the symbol not seen in either setting (Gas mask/Personal protective equipment) scored the lowest comprehension of all symbols.
Given the goal of providing the highest quality safety information and guidance to the widest audience possible, stan-dardization would appear useful. As such, it would be logical for symbolic exit signs deployed on small-transport category airplanes to be comprised of the ISO 7010:2011 running man element combined with the narrow arrows, i.e., the same symbolic exit sign currently approved for certain large-transport airplanes. A second recommendation is that the distance between any viewer inside the airplane cabin and these smaller exit signs should not exceed 20 feet.
* Procedural NoteOne interesting occurrence common to both phases of the
study was the variation in level of detail given by participants when asked to identify the sign elements. Some participants would identify the three main elements of any particular sign, i.e. “arrow pointing up, person running, arrow pointing up.” Other participants would completely identify everything about the sign, i.e. “I see a green rectangle made up of three smaller rectangles surrounded by a white box, with a figure of a man moving inside the a white box in the middle rectangle in green, two outer green boxes separated by white lines with white arrows pointing upwards.” While interesting, this level of detail could depend on multiple factors (age, education level, individual affect, or personality traits) and is noted here only to highlight a potential methodological issue that might be considered in the design of future studies.

17
REFERENCES
American National Standards Institute (ANSI) Z535.3, 1991, 2002. Criteria for Safety Symbols (Annex A: Principles And Guidelines for Graphical Design of Hazard Symbols). Ross-lyn, VA: National Electrical Manufacturers Association.
Corbett, C.L., McLean, G.A., & Cosper, D.K. (2008, Septem-ber). Effective Presentation Media for Passenger Safety I: Comprehension of Briefing Card Pictorials and Pictograms. Washington, DC: U.S. Department of Transportation (Report No. DOT/FAA/AAM-08/20).
Coren, S., Ward, L.M., & Enns, J.T. (2003). Sensation and perception (6th ed.). Hoboken, NJ: Wiley.
14 CFR 25, Aeronautics and Space, Airworthiness Standards: Transport Category Airplanes, Washington, DC: U.S. Government Printing Office: 2012.
Federal Aviation Administration. (2010, June). Equivalent Level Of Safety (ELOS) Finding for Graphical Exit Signs on a Model 787, Boeing Commercial Airplanes Delegated Compliance Organization (BDCO) Project # PS09-0585. Washington DC: U.S. Government Printing Office, Memorandum.
ISO 7001:1979, Public Information Symbols Index, Survey and Compilation of the Single Sheets. Geneva: Author.
ISO 9186:1989, 2001, Graphical Symbols – Test Methods for Judged Comprehensibility and for Comprehension. Geneva: Author.
ISO 16069:2004, Graphical Symbols – Safety Signs – Safety Way Guidance Systems (SWGS). Geneva: Author.
ISO 9186-2:2008, Graphical Symbols – Test Methods – Part 2: Method for Testing Perceptual Quality. Geneva: Author.
Turner, J. (2010, March). The Big Red Word vs. the Little Green Man. Slate. Retrieved February 2010: http://www.slate.com/articles/life/signs/2010/03/the_big_red_word_vs_the_little_green_man.html


A1
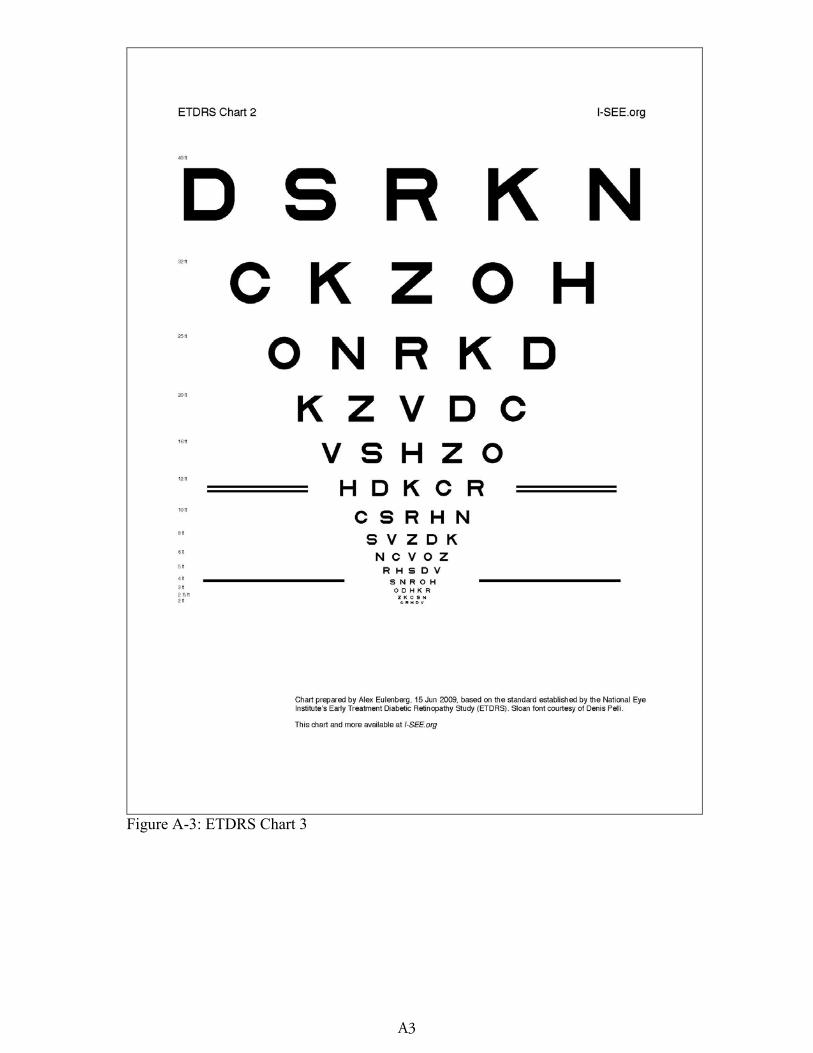
APPENDIX ASnellen Letter Charts Used for Testing Visual AcuityAppendix A
Snellen Letter Charts Used for Testing Visual Acuity
Page 1: ETDRS Chart R

A2
Page 2: ETDRS Chart 1
A3
Figure A-3: ETDRS Chart 3


B1
APPENDIX BPaper Sign Trials Test Booklet Layouts
Appendix BPaper Sign Trials Test Booklet Layouts
Test Booklet A Layout Test Booklet B Layout:
Gas mask must be worn: Gas mask must be worn:
Do not enter biohazard: Do not enter biohazard:
Modified green man, wide arrows: Modified green man, narrow arrows:
Attention/caution radiation: Attention/caution radiation:
First-aid kit, narrow arrows: First-aid kit, wide arrows:

B2
Test Booklet C Layout:
Gas mask must be worn:
Do not enter biohazard:
ISO green man, narrow arrows:
Attention/caution radiation:
First-aid kit, wide arrows:
C1
APPENDIX C Composite Symbolic Sign Comprehension Results
Appendix CComposite Symbolic Sign Comprehension Results
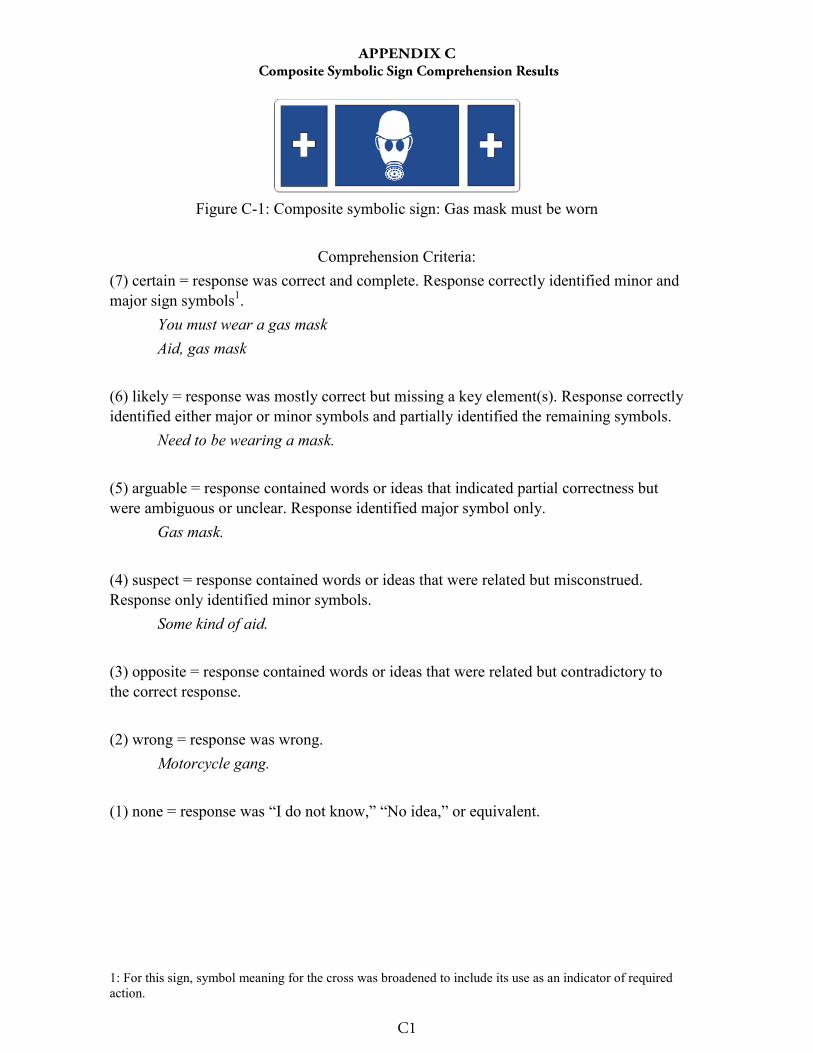
1: For this sign, symbol meaning for the cross was broadened to include its use as an indicator of required action.
Figure C-1: Composite symbolic sign: Gas mask must be worn
Comprehension Criteria: (7) certain = response was correct and complete. Response correctly identified minor and major sign symbols1.
You must wear a gas maskAid, gas mask
(6) likely = response was mostly correct but missing a key element(s). Response correctly identified either major or minor symbols and partially identified the remaining symbols.
Need to be wearing a mask.
(5) arguable = response contained words or ideas that indicated partial correctness but were ambiguous or unclear. Response identified major symbol only.
Gas mask.
(4) suspect = response contained words or ideas that were related but misconstrued. Response only identified minor symbols.
Some kind of aid.
(3) opposite = response contained words or ideas that were related but contradictory to the correct response.
(2) wrong = response was wrong.Motorcycle gang.
(1) none = response was “I do not know,” “No idea,” or equivalent.

C2
Appendix CComposite Symbolic Sign Comprehension Results
Table C-1: Gas mask must be worn comprehension scores
Comprehension Category Frequency Percent Weight Comprehension Score
Certain 5 10.00 1.00 10.00
Likely 4 8.00 0.75 6.00
Arguable 7 14.00 0.50 7.00
Suspect 18 36.00 0.25 9.00
Opposite 0 0.00 -1.00 0.00
Wrong 6 12.00 0.00 0.00
None 10 20.00 0.00 0.00
Blank 0 - - 0.00
Total 50 100.0 32.00
Procedural note:Data were unavailable for 25 participants due to an error at the time of data collection. This sign was always presented first and initially treated as a practice trial for initial participants. As such, the responses to this sign were not as completely recorded as the responses to the other signs in the test booklet.

C3
Appendix CComposite Symbolic Sign Comprehension Results
Figure C-2: Composite symbolic sign: Do not enter; Biohazard
Comprehension Criteria: (7) certain = response was correct and complete. Response correctly identified minor and major sign symbols.
Do not enter, biohazard.
(6) likely = response was mostly correct but missing a key element(s). Response correctly identified either major or minor symbols and partially identified the remaining symbols.
Hazard sign of some sort, do not enter.Stay away, something is hazardous.
(5) arguable = response contained words or ideas that indicated partial correctness but were ambiguous or unclear. Response identified major symbol only.
Biohazard.
(4) suspect = response contained words or ideas that were related but misconstrued. Response only identified minor symbols.
Do not enter.
(3) opposite = response contained words or ideas that were related but contradictory to the correct response.
(2) wrong = response was wrong.Something to do with radiation.Maybe a fan.
(1) none = response was “I do not know,” “No idea,” or equivalent.

C4
Appendix CComposite Symbolic Sign Comprehension Results
Table C-2: Do not enter; Biohazard comprehension scores
Comprehension Category Frequency Percent Weight Comprehension Score
Certain 5 6.67 1.00 6.67
Likely 6 8.00 0.75 6.00
Arguable 12 16.00 0.50 8.00
Suspect 21 28.00 0.25 7.00
Opposite 0 0.00 -1.00 0.00
Wrong 20 26.67 0.00 0.00
None 11 14.67 0.00 0.00
Blank 0 - - 0.00
Total 75 100.0 27.67

C5
Appendix CComposite Symbolic Sign Comprehension Results
Figure C-3: Composite symbolic sign: Caution/attention; Radiation
Comprehension Criteria: (7) certain = response was correct and complete. Response correctly identified minor and major sign symbols.
Caution, Radioactive material in use.
(6) likely = response was mostly correct but missing a key element(s). Response correctly identified either major or minor symbols and partially identified the remaining symbols.
Warning, radiation in area.
(5) arguable = response contained words or ideas that indicated partial correctness but were ambiguous or unclear. Response identified major symbol only.
Radiation sign.
(4) suspect = response contained words or ideas that were related but misconstrued. Response only identified minor symbols.
Hazardous materials.
(3) opposite = response contained words or ideas that were related but contradictory to the correct response.
(2) wrong = response was wrong.Propeller in area.
(1) none = response was “I do not know,” “No idea,” or equivalent.
C6
Appendix CComposite Symbolic Sign Comprehension Results
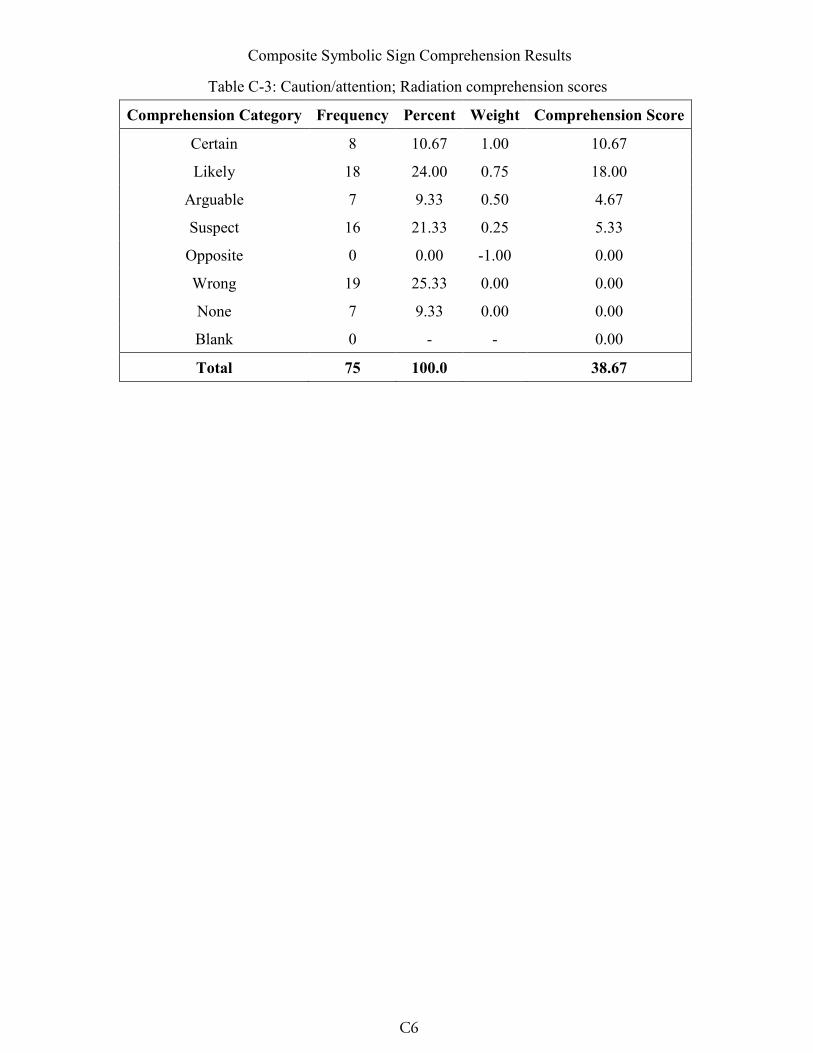
Table C-3: Caution/attention; Radiation comprehension scores
Comprehension Category Frequency Percent Weight Comprehension Score
Certain 8 10.67 1.00 10.67
Likely 18 24.00 0.75 18.00
Arguable 7 9.33 0.50 4.67
Suspect 16 21.33 0.25 5.33
Opposite 0 0.00 -1.00 0.00
Wrong 19 25.33 0.00 0.00
None 7 9.33 0.00 0.00
Blank 0 - - 0.00
Total 75 100.0 38.67
C7
Appendix CComposite Symbolic Sign Comprehension Results
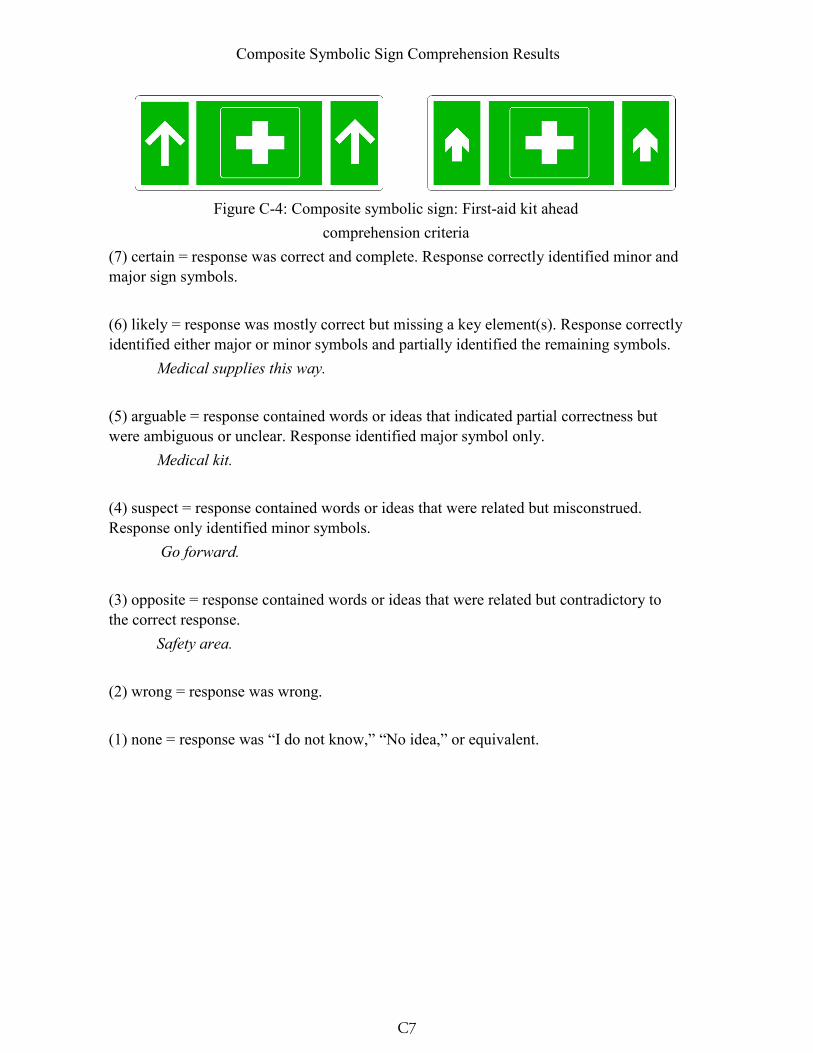
Figure C-4: Composite symbolic sign: First-aid kit aheadcomprehension criteria
(7) certain = response was correct and complete. Response correctly identified minor and major sign symbols.
(6) likely = response was mostly correct but missing a key element(s). Response correctly identified either major or minor symbols and partially identified the remaining symbols.
Medical supplies this way.
(5) arguable = response contained words or ideas that indicated partial correctness but were ambiguous or unclear. Response identified major symbol only.
Medical kit.
(4) suspect = response contained words or ideas that were related but misconstrued. Response only identified minor symbols.
Go forward.
(3) opposite = response contained words or ideas that were related but contradictory to the correct response.
Safety area.
(2) wrong = response was wrong.
(1) none = response was “I do not know,” “No idea,” or equivalent.
C8
Appendix CComposite Symbolic Sign Comprehension Results
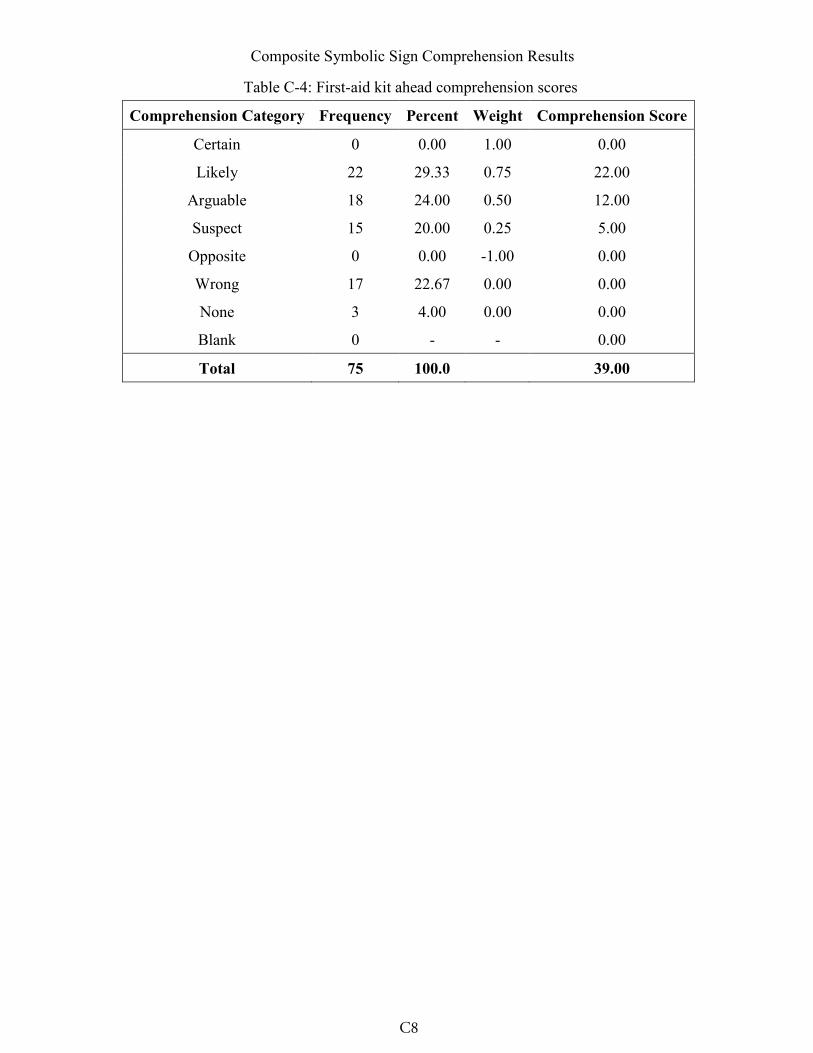
Table C-4: First-aid kit ahead comprehension scores
Comprehension Category Frequency Percent Weight Comprehension Score
Certain 0 0.00 1.00 0.00
Likely 22 29.33 0.75 22.00
Arguable 18 24.00 0.50 12.00
Suspect 15 20.00 0.25 5.00
Opposite 0 0.00 -1.00 0.00
Wrong 17 22.67 0.00 0.00
None 3 4.00 0.00 0.00
Blank 0 - - 0.00
Total 75 100.0 39.00