IDEA Section 619 IDEA Preschool Grants Program Maria Synodi, 619 Coordinator Early Childhood Special...
40
Section 619 IDEA Preschool Grants Program Maria Synodi, 619 Coordinator Early Childhood Special Education State Department of Education
-
Upload
claude-booth -
Category
Documents
-
view
221 -
download
0
Transcript of IDEA Section 619 IDEA Preschool Grants Program Maria Synodi, 619 Coordinator Early Childhood Special...
IDEASection 619
IDEA Preschool Grants Program
Maria Synodi, 619 CoordinatorEarly Childhood Special Education
State Department of Education
Federal StatuteFederal Regulations
2
IDEA Section 619

IDEA 2004 – Legal Landscape
Individuals with Disabilities Education Improvement Act (IDEA) of 2004 (Public Law 108-446)
IDEA has four (4) “Parts” Part A: General Provisions Part B: Assistance for the Education of All Children
with Disabilities – Includes Section 619* Part C: Infants and Toddlers with Disabilities Part D: National Activities to Improve the
Education of Children with Disabilities
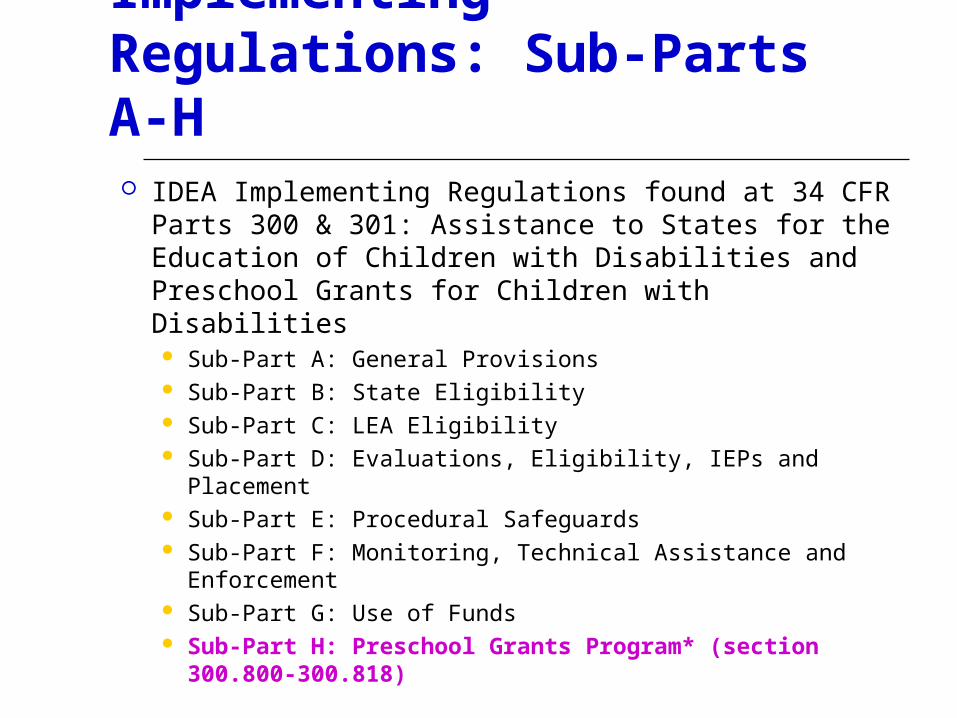
IDEA Part B: Implementing Regulations: Sub-Parts A-H IDEA Implementing Regulations found at 34 CFR Parts
300 & 301: Assistance to States for the Education of Children with Disabilities and Preschool Grants for Children with Disabilities Sub-Part A: General Provisions Sub-Part B: State Eligibility Sub-Part C: LEA Eligibility Sub-Part D: Evaluations, Eligibility, IEPs and Placement Sub-Part E: Procedural Safeguards Sub-Part F: Monitoring, Technical Assistance and
Enforcement Sub-Part G: Use of Funds Sub-Part H: Preschool Grants Program* (section
300.800-300.818)
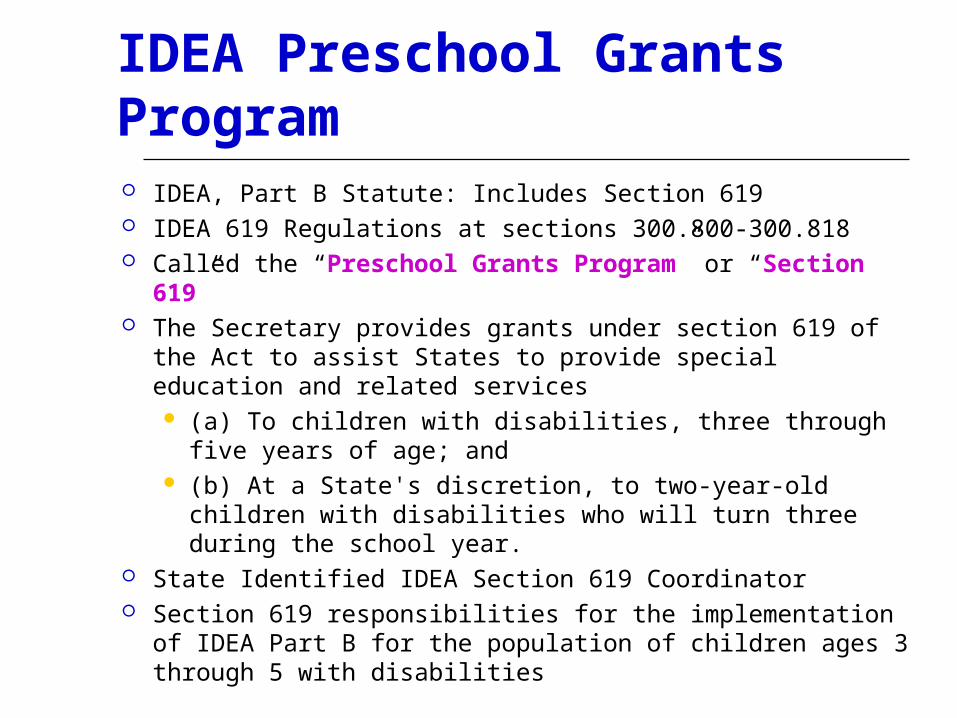
IDEA Preschool Grants Program IDEA, Part B Statute: Includes Section 619 IDEA 619 Regulations at sections 300.800-300.818 Called the “Preschool Grants Program” or “Section 619” The Secretary provides grants under section 619 of the Act to
assist States to provide special education and related services (a) To children with disabilities, three through five years of
age; and (b) At a State's discretion, to two-year-old children with
disabilities who will turn three during the school year. State Identified IDEA Section 619 Coordinator Section 619 responsibilities for the implementation of IDEA
Part B for the population of children ages 3 through 5 with disabilities
IDEA – Special Education IDEA Part B:
Children ages 3 through 21, or graduation from high school, whichever is first attained
IDEA Part B, Section 619: Children ages 3 through 5 – Regardless of grade

IDEA Preschool Grants Program Section 619 Fiscal Responsibilities – State Allocation of
$4,818,610 in 2010-2011 - $3,943,828 to school districts IDEA 619 grant dollars
82% is disbursed to school districts (80% minimum) 13% is set aside by the state for state-level activities 5% supports 619 in the State Department of Ed
IDEA 619 funds to school districts are spent on the excess cost of providing special education to children ages 3-5
Annual IDEA 619 grant application for school districts Federal formula for determining how much each school
district receives is specified in section 619 Annual IDEA 619 funds flat-funded since 1997 (no federal
increase – actual decrease in funding to state)

8
What Is Special Education?

IDEA Part B – Purpose (applies to 619*)
The purposes of this part are—
(a) To ensure that all children with disabilities have available to them a free appropriate public education that emphasizes special education and related services designed to meet their unique needs and prepare them for further education, employment, and independent living;
(b) To ensure that the rights of children with disabilities and their parents are protected;
(c) To assist States, localities, educational service agencies, and Federal agencies to provide for the education of all children with disabilities; and
(d) To assess and ensure the effectiveness of efforts to educate children with disabilities.
(Authority: 20 U.S.C. 1400(d))

IDEA Services = Special Education IDEA, Part B = Special Education: means that a free
appropriate public education (FAPE) is provided to a child with a disability who requires special education and related services.
Special Education means “specially designed instruction, at no cost to parents, to meet the unique needs if a child with a disability including instruction conducted in the classroom, in the home, in hospitals and institutions and in other settings.”
Speech and Language Pathology is considered special education “only if the service is considered special education rather than a related service.”
IDEA Related Services
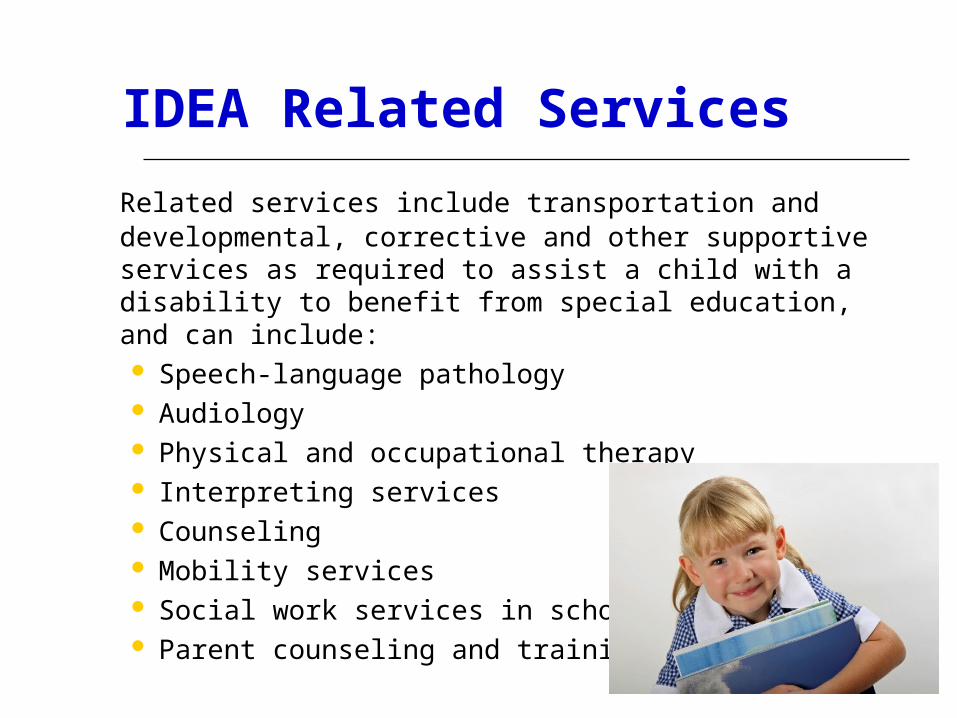
Related services include transportation and developmental, corrective and other supportive services as required to assist a child with a disability to benefit from special education, and can include: Speech-language pathology Audiology Physical and occupational therapy Interpreting services Counseling Mobility services Social work services in schools Parent counseling and training

12
Who Are The Children 3-5?
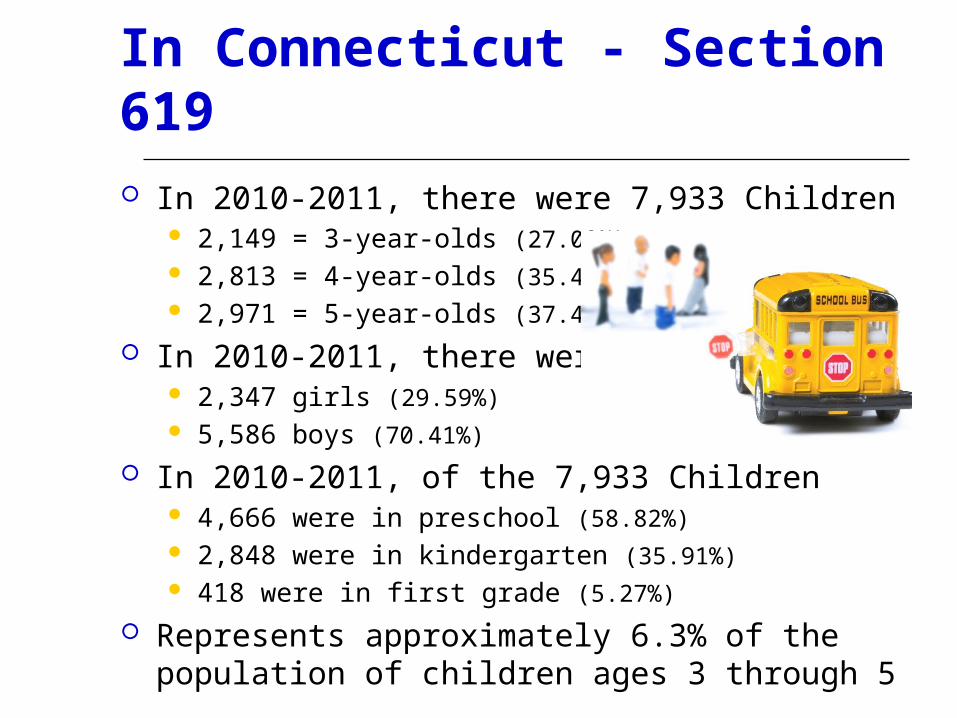
In Connecticut - Section 619 In 2010-2011, there were 7,933 Children
2,149 = 3-year-olds (27.09%) 2,813 = 4-year-olds (35.46%) 2,971 = 5-year-olds (37.45%)
In 2010-2011, there were 2,347 girls (29.59%) 5,586 boys (70.41%)
In 2010-2011, of the 7,933 Children 4,666 were in preschool (58.82%) 2,848 were in kindergarten (35.91%) 418 were in first grade (5.27%)
Represents approximately 6.3% of the population of children ages 3 through 5

IDEA Special Education Eligibility
The determination that a child requires special education and related services is a decision of each child’s planning and placement team (PPT) – which includes the parent(s).
The determination of a child’s eligibility is based upon the results and review of each child’s initial evaluation information.
Child is determined to be eligible for special education when their educational needs meet one of the IDEA disability categories and it is determined by reason thereof, that the child requires needs special education and related services.

IDEA Special EducationDisability Categories
Intellectual Disability Hearing Impairment
(including deafness) Speech or Language
Impairment Visual Impairment
(including blindness) Serious Emotional
Disturbance Multiple Disabilities Autism
Orthopedic Impairment Traumatic Brain Injury Other Health
Impairment Specific Learning
Disability Deaf-Blindness Neurologically Impaired
DEVELOPMENTAL DELAY (for children 3 through 5)

Disability Category: Children 3-5 (2010-2011)
Intellectual Disability (also called Mental Retardation = 36 Children (0.45%)
Hearing Impaired = 94 Children (1.18%)
Speech and Language Impaired = 2,354 Children (29.76%)
Visually Impaired = 18 Children (0.23%)
Seriously Emotionally Disturbed = 9 Children (0.11%)
Other Health Impaired = 182 Children (2.29%)
Learning Disabled = 48 Children (0.61%)
Deaf-Blind = 0 Children Multiple Disabilities = 98
Children (1.24%) Autism = 763 Children
(9.62%) Traumatic Brain Injury = 5
Children (0.06%) Developmental Delay =
4,318 Children (54.43%)

Race & Ethnicity: Children 3-5 (ECO)
Race/Ethnicity PercentAm. Indian/Native Alaskan 0.4%
Asian 3.7%
Black 10.2%
White 65.0%
Hispanic 20.8%

Time in Pre-K Special Education (ECO)
Time (in Months) Children Received Special Education in
Pre-K
Percent of Children
6 to 12 months 21.7%
13 to 18 months 24.6%
19 to 24 months 32.0%
25 to 30 months 17.1%
31 to 36 months 3.6%
36+ months 1.0%

Parent Participation & Satisfaction 93.7% of parents of children ages 3-5 and 90.0% of parents of children
ages 18-21 indicated that they are satisfied with their child’s special education program .
94.5% of parents of children ages 3-5 identified that general education teachers make accommodations and modifications as indicated on their child’s IEP.
More than 90% of parents of children ages 3-5 agreed that their child was learning skills that will enable him or her to be as independent as possible.
Similarly, 93.4% of parents of children ages 3-5 were also most likely to agree that their child is learning skills that will lead to a high school diploma, further education or job.
Parents of children with a developmental delay and a speech and language impairment were the most likely to agree that they have the opportunity to talk to their child’s teachers on a regular basis (98.0% and 95.2%, respectively).

20
Who Provides Special Education?

Responsibility for Special Education In Connecticut, school districts are responsible for the
provision of special education and related services to the eligible population of children ages 3-21, including children ages 3 through 5
In IDEA, school districts are referred to as LEAs – local educational agencies
In Connecticut, there are approximately: 169 towns 143 school districts for 619 13 regional school districts for 619 1 state school district: USD II, DCF for 619
Child Find Child Find is the obligation to “locate, identify and evaluate”
children who have a disability or who are suspected of having a disability
Child Find is an obligation of Part C and Part B – an overlapping responsibility of the two systems
The Connecticut Parent Advocacy Center (CPAC) serves as the statewide Child Find agent on behalf of the IDEA, Part B: Special Education, including 619
The Child Development Infoline (CDI) serves as the statewide Child Find agent on behalf of Part C and 619
Referrals received for children nearing the age of 3 are referred on to the responsible school district
MOA between Birth to Three and SDE on Child Find
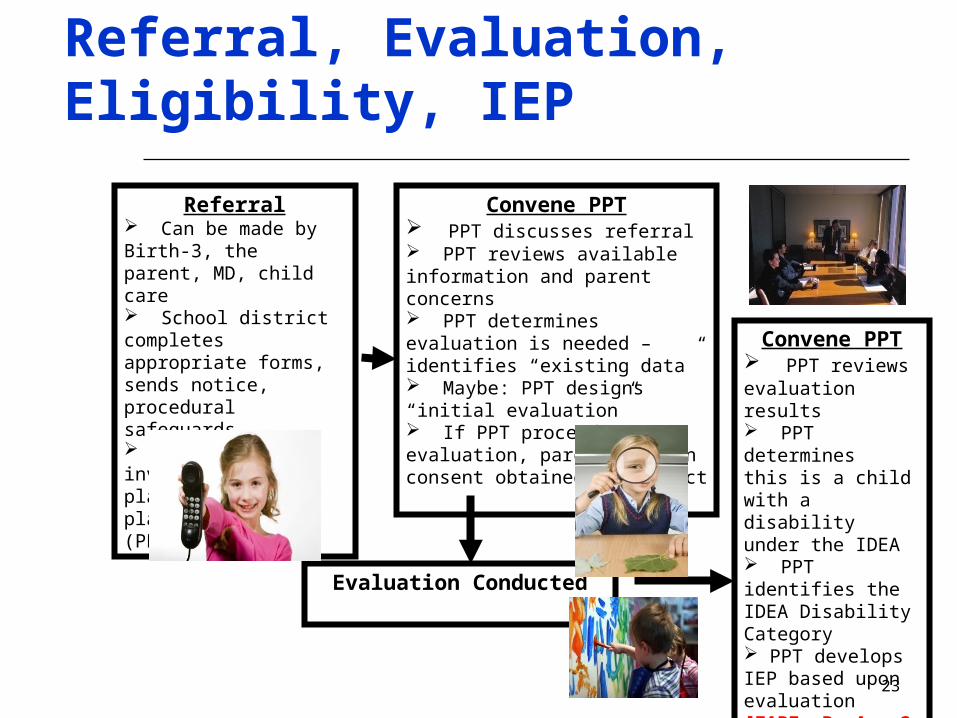
Referral, Evaluation, Eligibility, IEP Referral
Can be made by Birth-3, the parent, MD, child care School district completes appropriate forms, sends notice, procedural safeguards School sends invitation to planning and placement team (PPT) meeting
Convene PPT PPT discusses referral PPT reviews available information and parent concerns PPT determines evaluation is needed – identifies “existing data” Maybe: PPT designs “initial evaluation” If PPT proceeds to evaluation, parent written consent obtained to conduct
Evaluation Conducted
Convene PPT PPT reviews evaluation results PPT determines this is a child with a disability under the IDEA PPT identifies the IDEA Disability Category PPT develops IEP based upon evaluation [FAPE By Age 3 for B-3 children]
23

Special Education Plan: IEP
IEP = Individualized Education Program (IEP)
IEP means a written statement for a child with a disability that is developed, reviewed and revised in accordance with the IDEA
IEP Team – In Connecticut, a planning and placement team (PPT) – a group of individuals that is responsible for developing, reviewing and/or revising an IEP for a child with a disability

Location of Services
Least Restrictive Environment (LRE) To the maximum extent appropriate, children with
disabilities, in public or private institutions or other care facilities, are educated with children who are not disabled; and
Special classes, separate schooling, or other removal of children with disabilities from the regular educational environment occurs only if the nature or severity of the disability is such that education in regular classes with the use of supplementary aids and services cannot be achieved satisfactorily.

LRE for 3-5 In Connecticut (2010-2011)
70.40% or 4,259 children, ages 3-5, spent 80-100% of time with non-disabled peers
There was an increase of 800 children, ages 3-5, or a 3.7% increase in spending 80-100% of time with non-disabled peers from the prior year
6.60 % or 594 children were spending 40-79% of their time with non-disabled peers
2.90% or 296 children were spending 0-39% of their time with non-disabled peers
13.60% or 1,206 children were served in an ECSE program 5.20% or 371 children were served in a provider location 0.06% of children were served in a separate school 0.04% were served in a residential facility 0.02% of children were served at home
Children with IEPs Participate in … Public Schools, integrated early childhood programs Magnet Schools, Charter Schools with Pre-K
Programs School Readiness Head Start State-Funded Child Care Private Nursery Schools, Preschools Parochial Schools Participation may or may not be a part of a child’s IEP Inclusion: Access, Participation and Benefit

28
Where Is The Accountability?
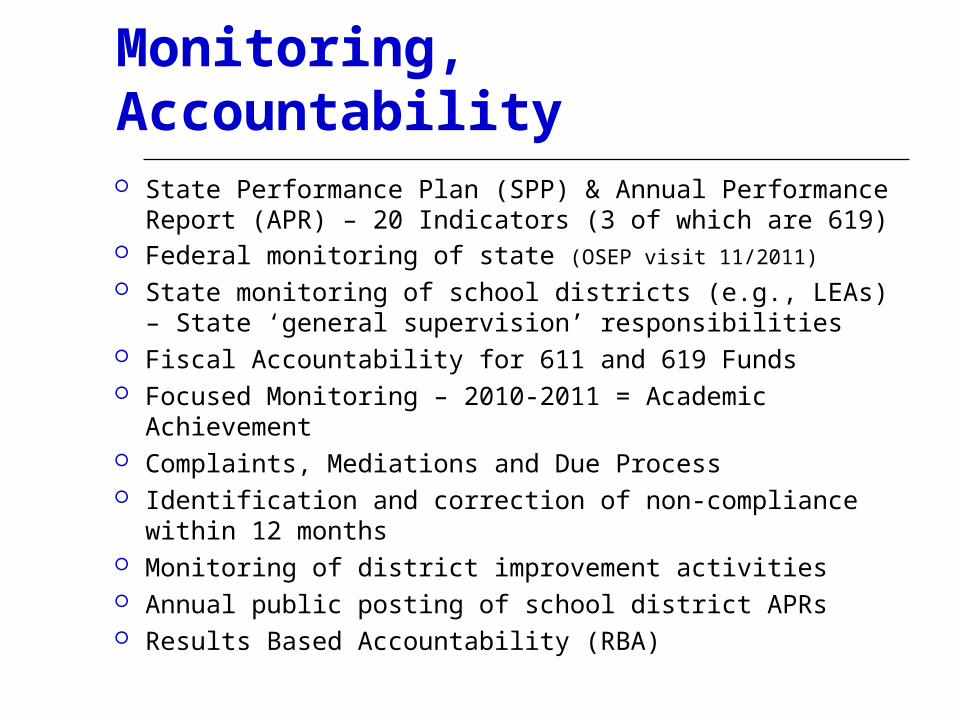
Monitoring, Accountability State Performance Plan (SPP) & Annual Performance
Report (APR) – 20 Indicators (3 of which are 619) Federal monitoring of state (OSEP visit 11/2011)
State monitoring of school districts (e.g., LEAs) – State ‘general supervision’ responsibilities
Fiscal Accountability for 611 and 619 Funds Focused Monitoring – 2010-2011 = Academic Achievement Complaints, Mediations and Due Process Identification and correction of non-compliance within 12
months Monitoring of district improvement activities Annual public posting of school district APRs Results Based Accountability (RBA)

Indicator #12: A Free Appropriate Public Education (FAPE) By Age 3
Indicator #12
This indicator measures the percent of children who were referred by the Birth to Three System and who had an IEP developed and implemented by their third birthday. This is a compliance indicator, meaning that the IDEA requires 100% of all children referred by the Birth to Three System to have an IEP in place by their third birthday, or for children with a summer birthday, by the start of the school year. The graph represents the state’s trend data, indicating substantial to full compliance, on this indicator for the last five years.

Indicator #6: LRE for Children 3 through 5
Indicator #6
This indicator measures the percent of children who spend time in programs that comprise a class composition of no less than 50% of children without disabilities. This data represents the 2010-2011 school year. The data has yet to be reported in the SPP/APR. The 2010-2011 data indicate that 70.40% of children, ages 3 through 5, spend 80-100% of time with non-disabled peers. This data represents time with non-disabled peers (TWNDPs) that includes, but is not limited to, the setting that a child with an IEP receives their special education and related services.
• 70.40% of children spend 80-100% TWNDPs• 6.60% of children spend 40-80% of TWNDPs• 2.90% of children spend 0-40% of TWNDPs• 13.60% of children are in ECSE classrooms• .06% of children are in a separate school• .04% of children are in a residential facility• .02 of children are served at home• 5.20% of children receive services in a service provider location

Positive Social Emotional Skills
Indicator #7: ECO
Progress in the development of positive social emotional skills, including positive social relationships is measured by the percent of children who:o Attained growth near same-age peers, ando Attained developmental and functional skills
within age expectations.
The graph represents data from the school year 2008-2009, the year in which baseline data was established and the school year 2009-2010, the first year of progress data on this indicator.
The 2009-2010 state target reflecting the percent of children who attained growth near same-age peers was 56.0%. The state did not meet that target, with data indicating that only 54.3% of children grew to near same age peers. The 2009-2010 target for children who attained age expectations was 52.0% and the state data exceeded the target with data identifying that 55.5% of children attained age expectations.
Acquisition & Use of Knowledge and Skills
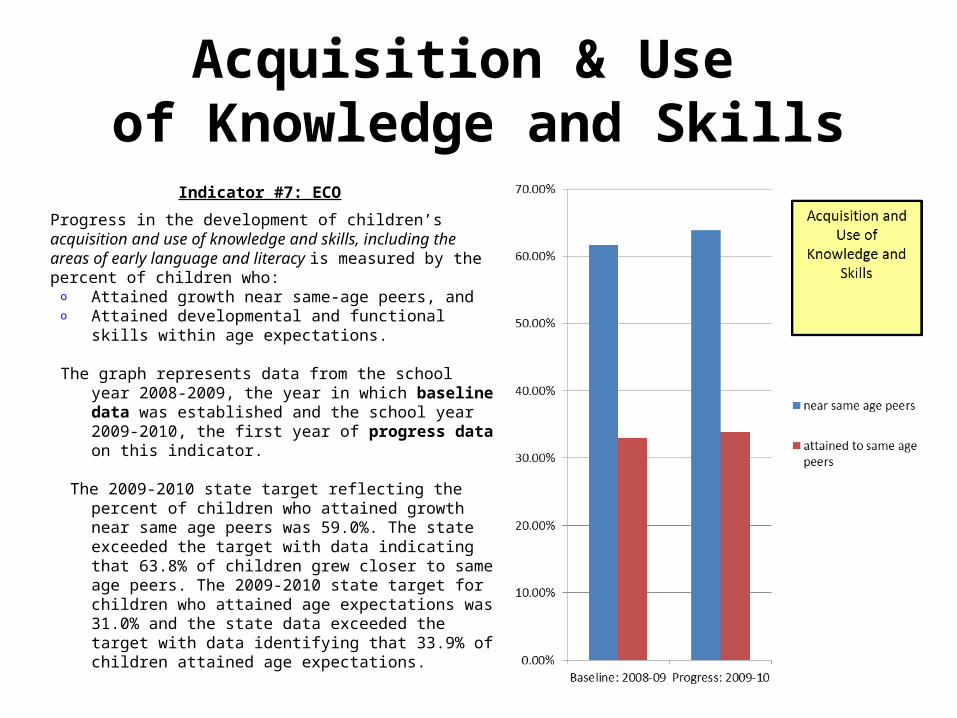
Indicator #7: ECO
Progress in the development of children’s acquisition and use of knowledge and skills, including the areas of early language and literacy is measured by the percent of children who:o Attained growth near same-age peers, ando Attained developmental and functional skills
within age expectations.
The graph represents data from the school year 2008-2009, the year in which baseline data was established and the school year 2009-2010, the first year of progress data on this indicator.
The 2009-2010 state target reflecting the percent of children who attained growth near same age peers was 59.0%. The state exceeded the target with data indicating that 63.8% of children grew closer to same age peers. The 2009-2010 state target for children who attained age expectations was 31.0% and the state data exceeded the target with data identifying that 33.9% of children attained age expectations.

Use of Behaviors to Meet Needs
Indicator #7: ECO
Progress in the development of children’s use of behaviors to meet their needs is measured by the percent of children who:o Attained growth near same-age peers, ando Attained developmental and functional skills
within age expectations.
The graph represents data from the school year 2008-2009, the year in which baseline data was established and the school year 2009-2010, the first year of progress data on this indicator.
The 2009-2010 state target reflecting the percent of children who attained growth near to same age peers was 48.0%. The state exceeded the target with data indicating that 50.7% of children grew nearer to same age peers. The 2009-2010 target for children who attained age expectations was 24.0% and the state data exceeded the target with data identifying that 26.1% of children attained age expectations.

35
IDEA 619 and Links to Early Childhood Cabinet

Workforce & Professional Development
619 and work with Bureau of Certification on certification regulations for teachers (translates to work with higher education institutions)
619 and CCAC: Inclusion Strand, Inclusion Saturday Series 619 and Professional Development
Offering stipends, fee waivers for EC personnel to attend professional development events focused on inclusion and supporting children with disabilities in EC settings
PD Offerings designed to include general and early childhood special education: literacy, behavior, etc.
619 partnership with Birth to Three offering birth-5 PD 619 specific PD TWW statewide conference – multi-agency, organization
planning and delivery of conference

Tiered Quality Rating System (T-QRIS)
619 funds to CCAC and AFP for NAEYC accreditation (2-year MOA)
Funds pay for accreditation, re-accreditation Eligible programs provide an integrated early
childhood opportunity Training and technical assistance is available In 2009-2011:
85 early childhood programs received financial support 70 programs attained accreditation 15 program in the accreditation process 5,462 children 646 children were children with disabilities (an IEP) NAEYC accreditation also supports workforce

Curriculum & Instruction Approximately one quarter of children who receive special
education receive a single service (e.g., speech only) Districts offer integrated early childhood programs
through a variety of options – part-day; full-day Average length of hours per month = 36.5 District operated early childhood special education
programs are delivered by a certified teacher Department supports the use of the PCF and PAF for all
children, as appropriate Department supports a preschool curriculum for all
children to be implemented with the appropriate accommodations, modifications, supports

Data and Data Interface State Department of Education Data Systems:
Registration System; Public School Information System (PSIS); Special Education Data Application and Collection (SEDAC) and Preschool Information System (PKIS);
State Assigned Unique Student Identification Numbers (SASID Numbers);
State Department of Education provides a SASID Number to every child receiving early intervention;
Data used for federal reporting, accountability;