IDBI Bank Limited Regd. Office : IDBI Tower, 104-G1i,
35
The National Stock Exchange of India Limited Listing Department Exchange Plaza, Bandra Kuria Complex Bandra (East) Mumbai 400 051 Company symbol: IDBI BSE Limited Department of Corporate Services Floor 25, Phiroze Jeejeebhoy Towers Dalai Street Mumbai 400 001 Security code no.: 500116 1 1 [Ha 3ra - rdiA *cr4sr 04,90 rvi IDBI Bank Limited Regd. Office : IDBI Tower, WTC Complex, Cuffe Parade, Mumbai -400 005. TEL.: (+91 22) 6655 3355, 2218 9111 FAX : (+91 22) 2218 0411 Website : www.idbi.com a►►id14144ft 6 titTa . chleirdef . ang1 - 4134 ttkr, trtg, qa -400005. Zin c th : (+91 22) 6655 3355, 2218 9111 t - 4vi : (+91 22) 2218 0411 t - 4710 : www.Idbl.com CIN: L65190MH2004G01148838 04 0 10 4- G1i, 2020 Sub: Intimation of Schedule of institutional investor meeting in accordance with the requirements under Regulation 30 of Securities and Exchange Board of India (Listing Obligations and Disclosure Requirements) Regulations, 2015, as amended ("SEBI Listing Regulations") Dear Sir, Pursuant to Regulation 30 read with Schedule III and other applicable provisions of the SEBI Listing Regulations, we wish to inform you that the officials of the Bank will be undertaking the following Investor interactions as scheduled below — Date(s) of the meeting Location of the Investors Mode of Meeting 5th Nov 2020 to 10th Nov 2020 Meeting Investors abroad with in Institutional India and Meetings would be generally conducted through call / video conferencing on a one-on-one basis. A copy of the corporate presentation is enclosed as Annexure for your reference and the same has been uploaded on the "Investor" section of the Bank's website at https://www.idbibank.in This intimation is also being uploaded on the Bank's website at https://www.idbibank.in/fy- 2020-21.asp We request you to take the above on record and the same be treated as compliance under the applicable provisions of the SEBI Listing Regulations. Note: Above details are subject to change. Changes may happen due to exigencies on the part of Investors / Bank. 31 — dtfzi, 317#/t3Tre . ch
Transcript of IDBI Bank Limited Regd. Office : IDBI Tower, 104-G1i,
The National Stock Exchange of India Limited Listing Department Exchange Plaza, Bandra Kuria Complex
Bandra (East) Mumbai 400 051 Company symbol: IDBI
BSE Limited Department of Corporate Services
Floor 25, Phiroze Jeejeebhoy Towers
Dalai Street
Mumbai 400 001 Security code no.: 500116
11 [Ha 3ra-rdiA
*cr4sr
04,90 rvi
IDBI Bank Limited
Regd. Office : IDBI Tower,
WTC Complex, Cuffe Parade,
Mumbai -400 005.
TEL.: (+91 22) 6655 3355, 2218 9111
FAX : (+91 22) 2218 0411
Website : www.idbi.com
a►►id14144ft 6
titTa. chleirdef . ang1-4134 ttkr,
trtg, qa -400005. Zinc th : (+91 22) 6655 3355, 2218 9111
t-4vi : (+91 22) 2218 0411
t-4710 : www.Idbl.com
CIN: L65190MH2004G01148838
04 0104-G1i, 2020
Sub: Intimation of Schedule of institutional investor meeting in accordance with the requirements
under Regulation 30 of Securities and Exchange Board of India (Listing Obligations and Disclosure
Requirements) Regulations, 2015, as amended ("SEBI Listing Regulations")
Dear Sir,
Pursuant to Regulation 30 read with Schedule III and other applicable provisions of the SEBI
Listing Regulations, we wish to inform you that the officials of the Bank will be undertaking the
following Investor interactions as scheduled below —
Date(s) of the meeting Location of the Investors Mode of Meeting
5th Nov 2020 to 10th Nov
2020
Meeting
Investors abroad
with in
Institutional
India and
Meetings would be generally
conducted through call / video
conferencing on a one-on-one basis.
A copy of the corporate presentation is enclosed as Annexure for your reference and the
same has been uploaded on the "Investor" section of the Bank's website at
https://www.idbibank.in
This intimation is also being uploaded on the Bank's website at https://www.idbibank.in/fy-
2020-21.asp
We request you to take the above on record and the same be treated as compliance under
the applicable provisions of the SEBI Listing Regulations.
Note: Above details are subject to change. Changes may happen due to exigencies on the part of
Investors / Bank.
31—dtfzi,
317#/t3Tre .ch

Page 1
Corporate PresentationNovember 2020

Page 2
This presentation has been prepared for general information purposes in respect of IDBI Bank Limited (“Bank”) together with its subsidiaries (together, with the Bank, the “Group”) only, without regard to any specific objectives,suitability, financial situations and needs of any particular person and does not constitute any recommendation or form part of any offer or invitation, present or future, directly or indirectly, in any manner, or inducement to sell orissue, or any solicitation of any offer to purchase or subscribe for, any securities of the Bank in any jurisdiction, nor shall it or any part of it or the fact of its distribution form the basis of, or be relied on in connection with, any contract orcommitment therefor. In particular, this presentation and the information contained herein do not constitute or form part of any offer of securities for sale in the United States and are not for publication or distribution in the UnitedStates. No securities of the Bank have been or will be registered under the U.S. Securities Act of 1933, as amended, and may not be offered or sold in the United States, except pursuant to registration or an exemption from theregistration requirements of the U.S. Securities Act of 1933, as amended. This presentation does not solicit any action based on the material contained herein. No public offering of securities will be made into the United States.
Nothing in this presentation is intended by the Group to be construed as legal, accounting, investment or tax advice.
This presentation only contains general, summary and selected information about the Group, it may omit material information about the Group and is not a complete description of the Group’s business and the risks relating to it. Thispresentation has not been approved and will not or may not be reviewed or approved by any statutory or regulatory authority in India or in any other jurisdiction or by any stock exchange in India or in any other jurisdiction.
This presentation contains certain forward-looking statements relating to the business, financial performance, strategy and results of the Group and/ or the industry in which it operates. Forward-looking statements are statementsconcerning future circumstances and results, and any other statements that are not historical facts, sometimes identified by the words including, without limitation “believes”, “expects”, “predicts”, “intends”, “projects”, “plans”,“estimates”, “aims”, “foresees”, “anticipates”, “targets”, and similar expressions. The forward-looking statements, including those cited from third party sources, contained in this presentation are based on numerous assumptions andare uncertain and subject to risks. A multitude of factors including, but not limited to, changes in demand, competition and technology, can cause actual events, performance or results to differ significantly from any anticipateddevelopment. Neither the Group nor its affiliates or advisors or representatives nor any of its or their parent or subsidiary undertakings or any such person's officers or employees guarantees that the assumptions underlying suchforward-looking statements are free from errors nor does either accept any responsibility for the future accuracy of the forward-looking statements contained in this presentation or the actual occurrence of the forecasteddevelopments. Forward-looking statements speak only as of the date of this presentation and are not guarantees of future performance. As a result, the Group expressly disclaims any obligation or undertaking to release any updateor revisions to any forward-looking statements in this presentation as a result of any change in expectations or any change in events, conditions, assumptions or circumstances on which these forward-looking statements are based.Given these uncertainties and other factors, viewers of this presentation are cautioned not to place undue reliance on these forward-looking statements. Certain numbers in these presentations and materials have been subject toroutine rounding off and accordingly figures shown as total in tables and diagrams may not be an arithmetic aggregation of the figures that precede them.
This presentation has been prepared by the Bank based on information and data which the Bank considers reliable, but the Bank makes no representation or warranty, express or implied, as to and no reliance should be placed on,the fairness, accuracy, completeness or correctness of the information contained herein, or any statement made in this presentation. The presentation has not been independently verified. The Bank, each member of the Group andtheir respective directors, advisers and representatives do not accept any liability for any facts made in or omitted from this presentation. To the maximum extent permitted by law, the Bank, each member of the Group and theirrespective directors, advisers and representatives disclaim all liability and responsibility (including without limitation any liability arising from negligence or otherwise) for any director indirect loss or damage, how so ever arising, whichmay be suffered by any recipient through use of or reliance on anything on anything contained in or omitted from or otherwise arising in connection with this presentation.
The information contained in and the statements made in this presentation should be considered in the context of the circumstances prevailing at the time. There is no obligation to update, modify or amend such information orstatements or to otherwise notify any recipient if any information or statement set forth herein, changes or subsequently becomes inaccurate or outdated. The information contained in this document is provided as at the date of thisdocument and is subject to change without notice.
This presentation is for information purposes only and is not a prospectus, a disclosure document, a statement in lieu of a prospectus, an offering circular, an advertisement or an offer document under the Companies Act, 2013, asamended, the Securities and Exchange Board of India (Issue of Capital and Disclosure Requirements) Regulations, 2018, as amended, or any other applicable law in India or in any other jurisdiction. No part of this presentation, northe fact of its distribution, should form the basis of, or be relied on in connection with any contract or commitment or investment decision whatsoever.
This presentation is strictly confidential and may not be copied or disseminated, reproduced, re-circulated, re-distributed, published or advertised in any media, website or otherwise, in whole or in part, and in any manner or for anypurpose. Any unauthorized use, disclosure or public dissemination of information contained herein is prohibited. No person is authorized to give any information or to make any representation not contained in or inconsistent with thispresentation and if given or made, such information or representation must not be relied upon as having been authorized by any person. Failure to comply with this restriction may constitute a violation of the applicable securitieslaws. Neither this document nor any part or copy of it may be distributed, directly or indirectly, in the United States. The distribution of this document in certain jurisdictions may be restricted by law and persons in to whose possessionthis presentation comes should inform themselves about and observe any such restrictions. Accordingly, any persons in possession of the aforesaid should inform themselves about and observe any such restrictions. In particular, thispresentation may not be transmitted or distributed, directly or indirectly, in Canada or Japan, not is it intended for general circulation in the United States. By reviewing this presentation (i) in the United States, you confirm that you area “qualified institutional buyer” as defined in Rule 144A under the U.S. Securities Act of 1933, as amended, and (ii) outside the United States, you confirm that you are permitted under the laws of your jurisdiction to receive thispresentation. By reviewing this presentation, you agree to be bound by the foregoing limitations.
Information contained in a presentation hosted or promoted by the Group is provided “as is” without warranty of any kind, either expressed or implied, including any warranty of fitness for a particular purpose.
By accessing this presentation, you accept this disclaimer and any claims arising out of or in connection with this presentation shall be governed by the laws of India and only the courts in Mumbai, India, and no other courts shallhave jurisdiction over the same.
Disclaimer

Page 3
Contents
IDBI Bank Overview
Key Business Highlights
Covid-19 Related Policy Reforms
Strengths
Strategies
Annexures
Page 4
IDBI Bank Overview

Page 5
IDBI Bank – Journey so far…
1990 1995 2005 200619941964 2004 20111976 1982 2019
Set up as a
subsidiary of RBI
under an Act of
Parliament as the
apex financial
institution in the
area of industrial
financing and
development
Ownership transferred
to GOI from RBI.
Designated principal FI
for coordinating the
working of institutions
at notional & state
levels engaged in
financing, promoting
& developing industry
IDBI transfers its
export financing
function to EXIM
Bank which was
established with
100% GOI
shareholding
under Export
Import Bank of
India Act 1981
SIDBI was set up
as a wholly
owned subsidiary
of IDBI under an
Act of Parliament
IDBI Act 1964
amended to permit
private ownership up
to 49%
Domestic IPO,
Government
stake reduced to
approximately
72%
IDBI transforms
from a DFI into a
full-service
commercial bank
along with a
continued
mandate for
development
financing under
the name of IDBI
Ltd
Amalgamation of
IDBI Bank Ltd., its
erstwhile
subsidiary, and
IDBI Ltd.
Amalgamation of
United Western
Bank and IDBI
Ltd.
Merger with its
subsidiaries, IDBI
Home finance
and IDBI Gilts with
itself
LIC of India
completed
acquisition of 51%
controlling stake in
IDBI Bank on
January 21, 2019,
making it the
majority shareholder
of the Bank
Set up a private sector
Bank: “IDBI Bank
Limited” for rendering
commercial banking
services
Note – Years mentioned in the above timeline are calendar years

Page 6
Overview
1,887Total
Branches
3,467ATMs
773 Cities & 35 States & UTs
Introduction
Distribution Reach Awards & Accolades
Ranked 13th among 51 Indian banks and financial institutions as a result of theprogress it has made in digital banking, according to MeitY
Conferred BFSI Award under Digital Financial Inclusion category at 4th IndiaBanking Reforms Conclave 2019
#1 most trusted brand in India for the year 2020 in the “Financial Services (PrivateBanks)” category - Reader’s Digest Trusted Brand awards
▪ Diversified financial services group offering a wide
range of banking and financial services to corporate
and retail customers throughout India
▪ The Bank was controlled by the Government of India
since its founding for over five decades
▪ Following the Life Insurance Corporation of India’s
acquisition of a 51% controlling interest in the Bank, the
RBI reclassified the Bank as a private sector bank
Business Segments
Corporate Retail
• Project Finance
• Working Capital
Assistance
Treasury
• Retail Assets
• Retail Liabilities
• Card Products
• Bancassurance
• Third Party
Distribution
As on September 30, 2020
• Money market
instruments
• Fixed income instruments
• Foreign exchange
• Derivatives and equities
trading
1Offshore Banking Unit
(GIFT-City, Gandhinagar)
1Overseas Branch
(Dubai)

Page 7
Value creation through Investments in Financial Sector & Subsidiaries
▪ Policy bank for the Government of India in the area of industrial and infrastructure development
▪ Institution builder -Two of the existing DFIs – EXIM Bank and SIDBI were carved out of IDBI
Name of Company % Holding Line of Activity
IDBI Capital Market & Securities Limited 100% Merchant Banking & Retail Broking
IDBI Intech Limited 100% Technology Service Provider
IDBI MF Trustee Company Ltd. 100%* Trustees of MF
IDBI Asset Management Limited 66.67%* Asset Management Co.
IDBI Trusteeship Services Limited 54.70% Trusteeship
IDBI Federal Life Insurance Company Limited 48%* Life Insurance
Subsidiaries & Joint Ventures
Architect of Indian Financial Sector
*The Bank’s board of directors on November 8, 2019 approved divestment of the Bank’s entire equity stake in IDBI Asset Management Ltd and IDBI MF Trustee Company Limited to Muthoot Finance Ltd. pursuant to a share purchase agreement which has since been executed on November 22, 2019. Further, the board of directors on June 26, 2020 approved divestment of the Bank’s stake in IDBI Federal Life Insurance Company Limited to the extent of 23% to Ageas Insurance International NV and 4% to the Federal Bank Limited pursuant to a share purchase agreement which has since been executed on August 5, 2020. Regulatory approvals for completion of transaction is being contemplated.
Page 8
Strong Parentage
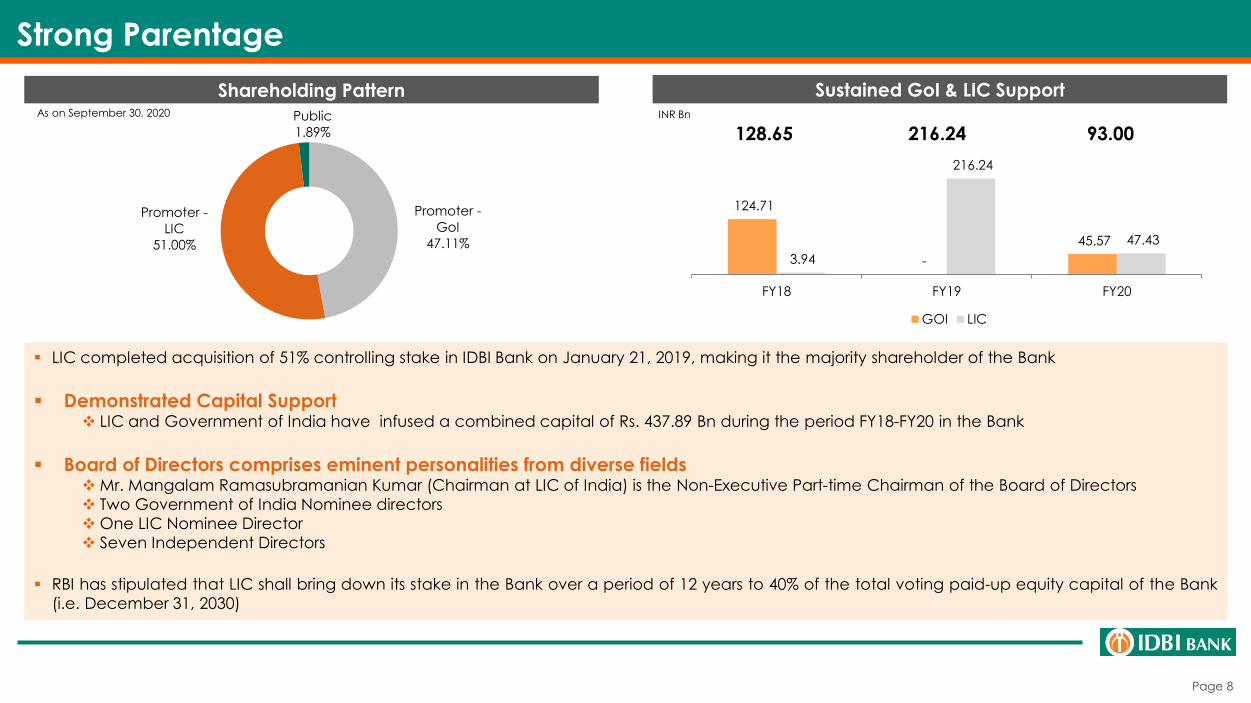
Sustained GoI & LIC SupportShareholding Pattern
Promoter -
GoI
47.11%
Promoter -
LIC
51.00%
Public
1.89%
124.71
-
45.57
3.94
216.24
47.43
FY18 FY19 FY20
GOI LIC
128.65 216.24 93.00
▪ LIC completed acquisition of 51% controlling stake in IDBI Bank on January 21, 2019, making it the majority shareholder of the Bank
▪ Demonstrated Capital Support❖ LIC and Government of India have infused a combined capital of Rs. 437.89 Bn during the period FY18-FY20 in the Bank
▪ Board of Directors comprises eminent personalities from diverse fields❖ Mr. Mangalam Ramasubramanian Kumar (Chairman at LIC of India) is the Non-Executive Part-time Chairman of the Board of Directors
❖ Two Government of India Nominee directors
❖ One LIC Nominee Director
❖ Seven Independent Directors
▪ RBI has stipulated that LIC shall bring down its stake in the Bank over a period of 12 years to 40% of the total voting paid-up equity capital of the Bank
(i.e. December 31, 2030)
INR BnAs on September 30, 2020

Page 9
Verticalization of the Organization Structure
MD & CEO
DMD
ED ED
CMS & GBG Ops
RBG-Zones (Chennai,
Bengaluru,
Hyderabad,
Ahmedabad)
IT & MISCSPD
Digital Banking & Emerging payments
Support Services –
Corp Banking
Audit & FRMG
Retail Liabilities
Training (JINBF)
NMG & Recovery
Credit Monitoring
Group
Legal
Priority Sector (Agri & MSME)
RBG-Zones (Mumbai,
Pune, Nagpur,
kolkata)
Centralized Operations
ED EDED ED ED ED
Large Corporate
Group
DMD
Treasury Front
Office
ED
International
Borrowing
ADMIN & IMD
ED
Human Resources
ED
Structured Retail Asset
RBG-Zones (Delhi,
Lucknow,
Chandigarh &
Bhubaneswar
CMS & GBG
BusinessTPD
Currency Chest
Trade Finance
Financial Inclusion
Credit Cards BOSPD
Data Analytics
Credit Processing
Centre
Retail Collection
& Recovery
Gift City & DIFC
Branch
Mid Corporate
Group
ED

Page 10
Key Business Highlights
Page 11
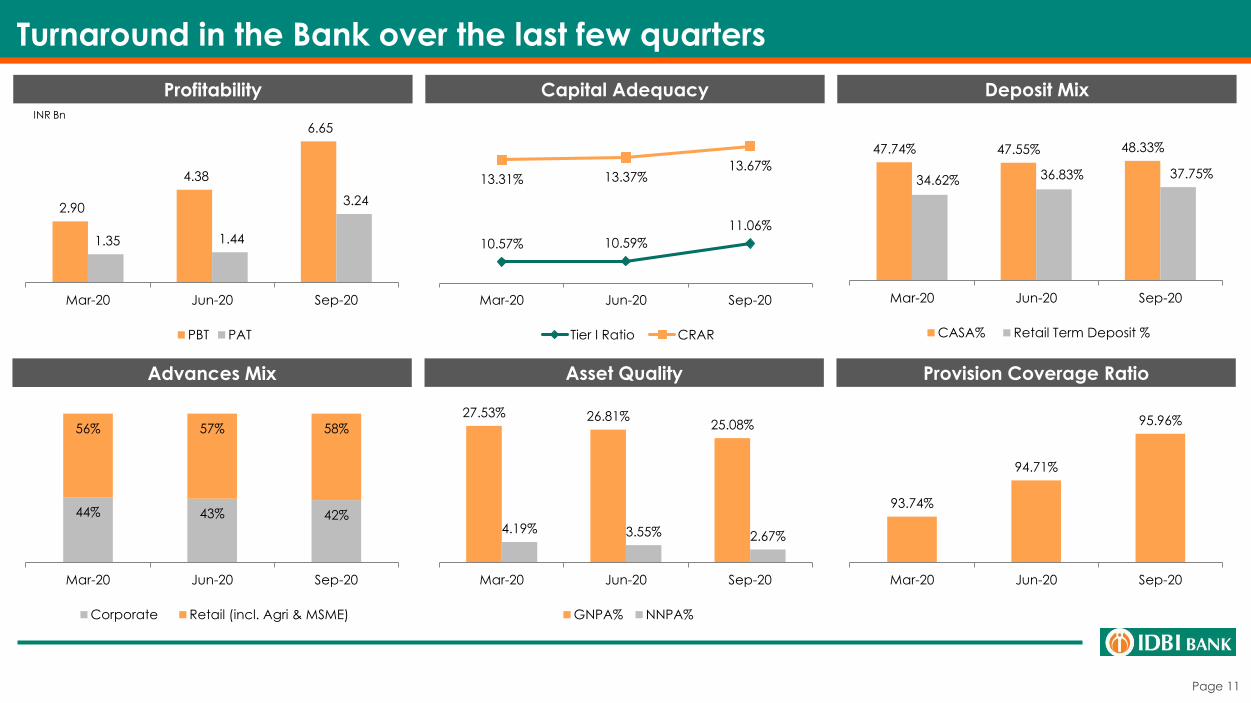
Turnaround in the Bank over the last few quarters
47.74% 47.55% 48.33%
34.62% 36.83% 37.75%
Mar-20 Jun-20 Sep-20
CASA% Retail Term Deposit %
44% 43% 42%
56% 57% 58%
Mar-20 Jun-20 Sep-20
Corporate Retail (incl. Agri & MSME)
Profitability Deposit Mix
27.53% 26.81%25.08%
4.19% 3.55% 2.67%
Mar-20 Jun-20 Sep-20
GNPA% NNPA%
2.90
4.38
6.65
1.35 1.44
3.24
Mar-20 Jun-20 Sep-20
PBT PAT
Advances Mix Asset Quality Provision Coverage Ratio
Capital Adequacy
10.57% 10.59%
11.06%
13.31% 13.37%13.67%
Mar-20 Jun-20 Sep-20
Tier I Ratio CRAR
93.74%
94.71%
95.96%
Mar-20 Jun-20 Sep-20
INR Bn

Page 12
Improving Financial Position
Total Net Interest Income Profit After TaxOperating Profit
Net Interest Margin[1] Cost-Income Ratio
56.40 59.06
69.78
30.89 34.69
FY18 FY19 FY20 H1FY20 H1FY21
79.09
40.5251.12
19.6025.72
FY18 FY19 FY20 H1FY20 H1FY21
(82.38)
(151.16)(128.87)
(72.60)
4.69
FY18 FY19 FY20 H1FY20 H1FY21
37.51%
55.98% 55.35%60.43%
53.60%
FY18 FY19 FY20 H1FY20 H1FY21
1.81%2.03%
2.61%
2.23%
2.76%
FY18 FY19 FY20 H1FY20 H1FY21
Return Ratios
INR BnINR BnINR Bn
1. Net interest margin is the difference of interest earned and interest expended divided by average interest-earning assets2. Return on Assets is profit after tax / average assets3. Return on Equity is profit after tax / networth (excluding revaluation reserve & intangible assets)
-2.46%
-4.68% -4.26% -4.75%
0.32%
FY18 FY19 FY20 H1FY20 H1FY21
-58.30%
-155.20%-128.25%
-163.39%
7.59%
FY18 FY19 FY20 H1FY20 H1FY21
RoA[2]
RoE[3]

Page 13
Retail Focused Asset Book
Gross Advances Yield on Advances[1]Gross Advances Mix
55.44%
44.56%
Corporate Retail
41.55%
58.45%
1,988.53 1,820.97 1,716.90 1,768.68
1,638.41
FY18 FY19 FY20 H1FY20 H1FY21
Structured Retail Advances
458.46540.34
591.38 563.20 593.51
FY18 FY19 FY20 H1FY20 H1FY21
H1FY21FY18
70.32%
23.46%
1.90%
0.88% 3.44%
HL LAP EL PL AL
72.39%
21.61%
1.83%1.02%
3.15%
Structured Retail Advances Mix
H1FY21FY18
Shift towards retail assets along with reduced corporate
exposure
INR Bn
INR Bn • The Bank intends to capture an even largershare of the retail banking space byexpanding its portfolio of retail banking
• Focus on Government initiated schemes such
as Guaranteed Emergency Credit Line, PMSVANidhi), Agriculture Infra Fund, CreditGuarantee Scheme for Sub-ordinated Debtetc. for ramping up the portfolio.
• Tie-up with LICHFL-FSL as Corporate DSA forsourcing under identified MSME/Agri product
1. Yield is Interest income on advances/average advances. Previous period ratios have been re-calculated considering re-grouping/re-classification impacts.
8.34%
8.81%
9.55%
9.14%
9.56%
FY18 FY19 FY20 H1FY20 H1FY21
Increasing Retail share leading to increasing Yield on
Advances

Page 14
Growing focus on low cost CASA Deposits
33.35% 25.39% 17.64% 21.84% 13.92%
66.65% 74.61% 82.36% 78.16% 86.08%
FY18 FY19 FY20 H1FY20 H1FY21Bulk Deposits Other Deposits
5.85% 5.78% 5.44% 5.58%4.84%
5.56% 5.44% 5.08% 5.23%4.53%
FY18 FY19 FY20 H1FY20 H1FY21
Cost of Funds Cost of Deposits
Total Deposits & Borrowings
Cost of Deposits[1] & Cost of Funds[2]
Reduced dependence on Bulk Deposits
• The Bank aims to continue diversifying away
from its historic reliance on bulk deposits bygrowing its low-cost CASA deposits
• Retail customer-specific orientation willresult in an increase in CASA deposits,which will expand its pool of low-costfunding
INR Bn
Increasing CASA focus
921.02 967.30 1,061.88 1,040.27 1,082.17
37.15%42.54%
47.74%44.87%
48.33%
FY18 FY19 FY20 H1FY20 H1FY21CASA CASA Ratio
INR Bn
631.86 452.88 367.49 302.06 364.22
2,479.31 2,273.72 2,224.24 2,318.30 2,239.15
FY18 FY19 FY20 H1FY20 H1FY21Borrowings Deposits
Customer Accounts
0.82 0.91 1.14 0.94 1.23
16.57 18.48 19.69 19.15 19.94
2.782.68 2.66 2.74 2.89
FY18 FY19 FY20 H1FY20 H1FY21
Current Accounts Savings Account Term Deposit
Consistent growth in Customer Accounts across types
Mn
1.Cost of deposits is Interest on deposits divided by average deposits2.Cost of funds is interest expense divided by average interest-bearing liabilities (i.e. deposits & borrowings

Page 15
Stable Capital Base
59.15
44.97 43.44 41.29 41.06
2.68% 2.45% 2.74% 2.46% 2.61%
FY18 FY19 FY20 H1FY20 H1FY21Tier II Capital Tier II Ratio
229.91
212.50 211.28
201.02
215.09
10.41% 11.58% 13.31% 11.98% 13.67%
FY18 FY19 FY20 H1FY20 H1FY21Total Capital CRAR %
170.76 167.53 167.85 159.72174.03
7.73%9.13%
10.57%9.52%
11.06%
FY18 FY19 FY20 H1FY20 H1FY21Tier I Capital Tier I Ratio
Tier I Total (Tier I + Tier II)Tier II
RWA
2208.64
1834.571587.46 1678.42 1573.23
FY18 FY19 FY20 H1FY20 H1FY21
RWA/ Advances
90.66%80.89% 76.00% 77.34% 78.18%
111.07%100.75% 92.46% 94.90% 96.02%
FY18 FY19 FY20 H1FY20 H1FY21
Credit RWA/ Gross Advances
Total RWA/ Gross Advances
Liquidity Coverage Ratio*
102.87%114.37%
127.68% 134.15%155.48%
FY18 FY19 FY20 H1FY20 H1FY21
INR Bn
INR Bn
INR Bn INR Bn
*For FY18-FY20: Average LCR of the Bank; For H1FY20 & H1FY21: Average LCR of the Bank for Q2FY20 & Q2FY21 respectively

Page 16
NPA Movement
INR Bn FY18 FY19 FY20 H1FY20 H1FY21Opening Balance 447.53 555.88 500.28 500.28 472.72
Add:
a. First Time NPA 356.05 152.81 83.84 55.45 1.01
b. Increase in existing NPA 27.46 29.27 26.38 11.01 1.41
Less:
c. Settled 68.40 64.43 65.56 19.63 25.49
d. Up-gradation 81.61 14.07 12.86 6.63 0.72
e. Written off 125.15 159.18 59.36 19.95 38.02
Closing Balance 555.88 500.28 472.72 520.53 410.91
Gross NPA % 27.95% 27.47% 27.53% 29.43% 25.08%
Net NPA % 16.69% 10.11% 4.19% 5.97% 2.67%
PCR% 63.40% 82.88% 93.74% 91.25% 95.96%
Improving Asset Quality
Category Gross NPA Provision Net NPA Provision %Sub Standard Assets 11.91 4.55 7.36 38%
-of which 100% provided 0.45 0.45 - 100%
Doubtful-1 Assets 28.97 19.94 9.03 69%
-of which 100% provided 14.16 14.16 - 100%
Doubtful-2 Assets 126.34 109.11 17.23 86%
-of which 100% provided 66.11 66.11 - 100%
Doubtful-3 Assets 76.35 76.35 - 100%
Loss Assets 167.34 167.34 - 100%
Total 410.91 377.28 33.63 92%
Retail 60.20
Corporate 350.71
Po
sitio
n a
s o
n S
ep
30
, 2
02
0
Technical Written off Book 412.80Retail TWO 26.57
Corporate TWO 386.23

Page 17
SMA Position
52.83
29.90
17.09 15.42
53.26
18.87
29.27 30.33
10.12 9.23
62.95
19.77
12.29
5.30 4.93
Sep-19 Dec-19 Mar-20 Jun-20 Sep-20
SMA 0 SMA 1 SMA 2INR Bn
59.71
30.84
78.94
134.65
67.42
83.45
26.15 19.32 7.67 13.29
51.20
52.79 40.39
23.17
54.13
Sep-19 Dec-19 Mar-20 Jun-20 Sep-20
Corporate Retail
59.71 30.84
78.94
134.65
67.42

Page 18
Criteria IndicatorRisk IDBI-Actual
Threshold 1 (T1)
Threshold 2(T2)
Threshold 3 (T3)
Mar-18 Mar-19 Mar-20 Jun-20 Sep-20
Capital(Breach ofeither CRAR
or CET1 Ratioto triggerPCA)
CRAR+CCB(9%+2.5%)
<11.5% but >=9% <9% but >7.5% <7.5% 10.41% 11.58% 13.31% 13.37% 13.67%Complied
With
CET 1+CCB (5.5+2.5)=8%
>=6.375% but <8%
>=4.875% but <6.375%
<4.875% 7.42% 8.91% 10.54% 10.59% 11.06%Complied
With
Asset Quality NNPA Ratio >=6% but <9% >=9% but <12% >=12% 16.69% 10.11% 4.19% 3.55% 2.67%Complied
With
ProfitabilityROA (should be positive)
-ve ROA for 2 consecutive yrs
-ve ROA for 3 consecutive yrs
-ve ROA for 4 consecutive yrs
-ve ROA -ve ROA 0.18% 0.20% 0.43%
T3
CompliedWith for last
3 consecutive
quarters
Leverage Leverage Ratio <=4.0 but >=3.5 <3.5 4.25% 4.61% 4.97% 5.05% 5.09% Complied With
The Bank is on track toward full compliance with the RBI’s parameters under the “Prompt Corrective Action” regime, and intends to pursue an exit from that regime in due course
Compliance with Prompt Corrective Action (PCA) Matrix

Page 19
Covid-19 Related Policy Reforms

Page 20
Important announcements since the onset of COVID-19
▪ The RBI significantly reduced the repo rate to 4% in May 2020 and injected a large amount of liquidity of approximately 3.9% of
GDP.
▪ With 100 bps cut in CRR, 155 bps cut in reverse repo and increase in MSF to 3% of net demand and time liabilities, attempts
were afloat to enhance credit flow in the economy and provide banks with increased access to funds
▪ The RBI deferred the implementation of the last tranche of 0.625 per cent. of the Capital Conservation Buffer (CCB) from
September 30, 2020 to April 1, 2021 and deferred the implementation of Net Stable Funding Ratio (NSFR) guidelines from
September 30, 2020 to April 1, 2021
▪ A window provided under the Prudential Framework for Resolution of Stressed Assets Directions 2019 to enable lenders to
implement a resolution plan in respect of eligible corporate exposures without change in ownership as well as personal loans
for borrowers having stress on account of COVID-19, while classifying such exposures as ‘Standard’, subject to specified
conditions
▪ The Union Government of India, in announcements from May 12 to May 17, 2020, declared a series of measures across sectors
as a part of a Special Economic Package of more than INR 20 trillion – ‘Atma Nirbhar Bharat Abhiyan’ to mitigate the impact
of COVID-19
Policy environment was made conducive beginning March 2020 when the RBI and the Government were able to correctly anticipate the economic downturn following the outbreak of COVID-19
RBI expects a combination of fiscal, monetary and administrative measures currently undertaken to create conditions for a gradual revival in activity in the second half of FY2020-21
Page 21
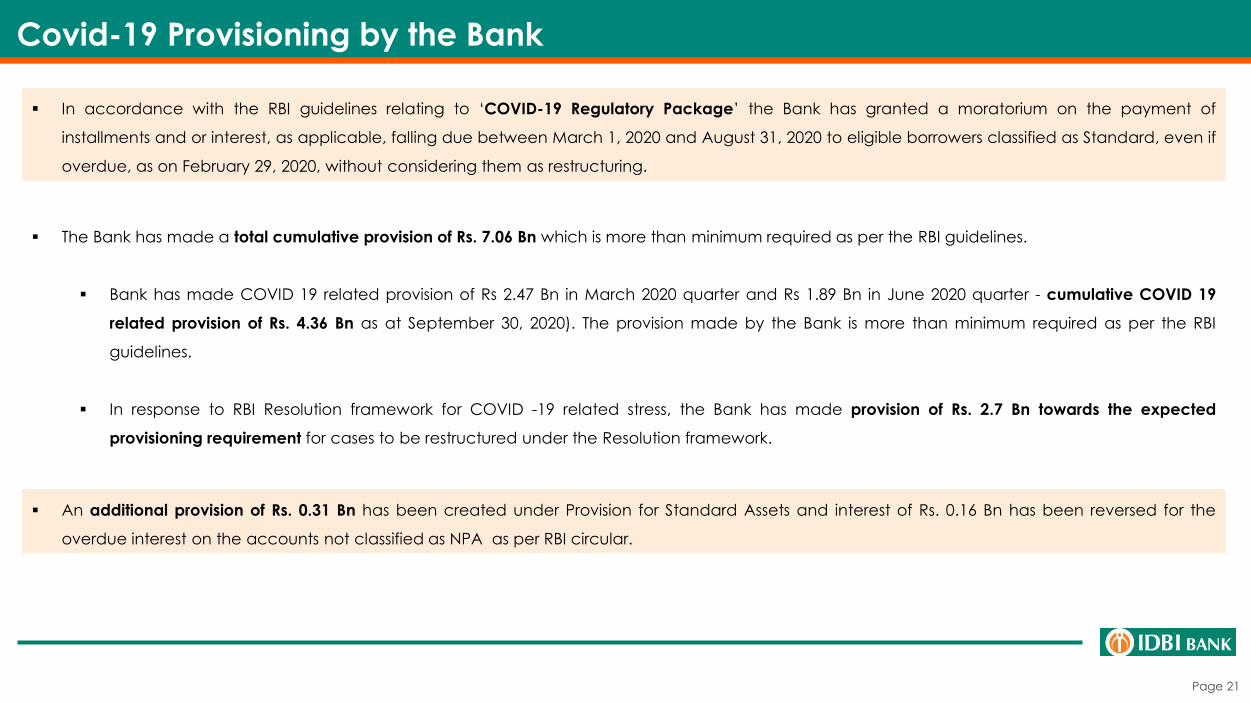
Covid-19 Provisioning by the Bank
▪ The Bank has made a total cumulative provision of Rs. 7.06 Bn which is more than minimum required as per the RBI guidelines.
▪ Bank has made COVID 19 related provision of Rs 2.47 Bn in March 2020 quarter and Rs 1.89 Bn in June 2020 quarter - cumulative COVID 19
related provision of Rs. 4.36 Bn as at September 30, 2020). The provision made by the Bank is more than minimum required as per the RBI
guidelines.
▪ In response to RBI Resolution framework for COVID -19 related stress, the Bank has made provision of Rs. 2.7 Bn towards the expected
provisioning requirement for cases to be restructured under the Resolution framework.
▪ In accordance with the RBI guidelines relating to ‘COVID-19 Regulatory Package’ the Bank has granted a moratorium on the payment of
installments and or interest, as applicable, falling due between March 1, 2020 and August 31, 2020 to eligible borrowers classified as Standard, even if
overdue, as on February 29, 2020, without considering them as restructuring.
▪ An additional provision of Rs. 0.31 Bn has been created under Provision for Standard Assets and interest of Rs. 0.16 Bn has been reversed for the
overdue interest on the accounts not classified as NPA as per RBI circular.

Page 22
Strengths

Page 23
Strengths
12
3
4
5
Valuable and trusted brand
Experienced Board & Management Team
Synergies from the relationship with LIC
Strong technology-enabled operating platform
Pan-India presence with diversified distribution network and product offering
Revamped risk management and credit monitoring framework
6

Page 24
Pan-India presence with diversified distribution network and product offering
21.67%
31.00%24.59%
22.74%
Rural
Semi Urban
Urban
Metro
Branch Distribution
1
5
19
50
71
112
433
8
81
63
52115
87
56
42
106
69
75
54 97
70
119
5
30
1
4
2
5
9
2
1
6
2
31
3>400 Branches
100-400 Branches
40-100 Branches
10-40 Branches
<10 Branches
Nationwide Network
773 Cities,
35 States
& UTs
3,467
ATMs/ CRMs
1,885
Domestic
Branches
1
Overseas
Branch
(DIFC)
1
Offshore
Banking Unit
– Gift City
▪ Through broad physical and digital distribution network,
the Bank offers a full range of banking products and
services
▪ The network is important in cross-selling the transaction
banking business to generate additional fee-based
income
▪ Provides access to an extensive retail depositor base,
which give a funding depth and a relatively low-cost
deposit pool
Extensive distribution network allows the Bank to serve a large and growing customer base throughout India
As on September 30, 2020 As on September 30, 2020

Page 25
Strong technology-enabled operating platform
86%
14%
Digital Branch
91%
9%
H1FY21H1FY20
Shift in Channel Mix
Customer Induced Financial Transaction Analysis
Mobile BankingInternet Banking Debit CardsUPI
45.7048.20 42.60
22.1012.90
8.8610.13
11.24 10.74 11.58
FY18 FY19 FY20 H1FY20 H1FY21No. of Transactions (Mn)
No. of Users (Mn)
1.80
8.20
11.90
5.60 4.70
2.052.58
3.042.80
3.25
FY18 FY19 FY20 H1FY20 H1FY21No. of Transactions (Mn)
No. of Users (Mn)
21.7
62.2
166.1
65.5
123
0.711.81
2.96 2.363.49
FY18 FY19 FY20 H1FY20 H1FY21No. of Transactions (Mn)
No. of Users (Mn)
59.20
79.2074.20
37.60 23.00
11.40 12.20 12.60 12.10 12.90
FY18 FY19 FY20 H1FY20 H1FY21No. of Transactions (Mn)
No. of Users (Mn)
• Digital infrastructure of has been strengthened and revamped for smooth, convenient, safe & secure
Banking experience
• Designated one officer at every retail branch as a ‘Digital Guru’ to act as a single point of contact
for all digital product related queries
• Updated the mobile banking app ‘GO Mobile+’, availability in regional languages and revamped
the internet banking to an upgraded version
• 3-in-1 IDBI BHIM Digital POS Application where payments can be accepted through VPA, BHIM QR &
AePS
• All Debit Cards, World Currency Cards, Cash and Gift Cards have been upgraded to EMV chip-
enabled cards along with ‘PayWave’ (Tap-n-Go) transaction facility
Bank has made significant investments in technology and digital analytics to transform its operating architecture into a strong,technology enabled digital operating platform
Page 26
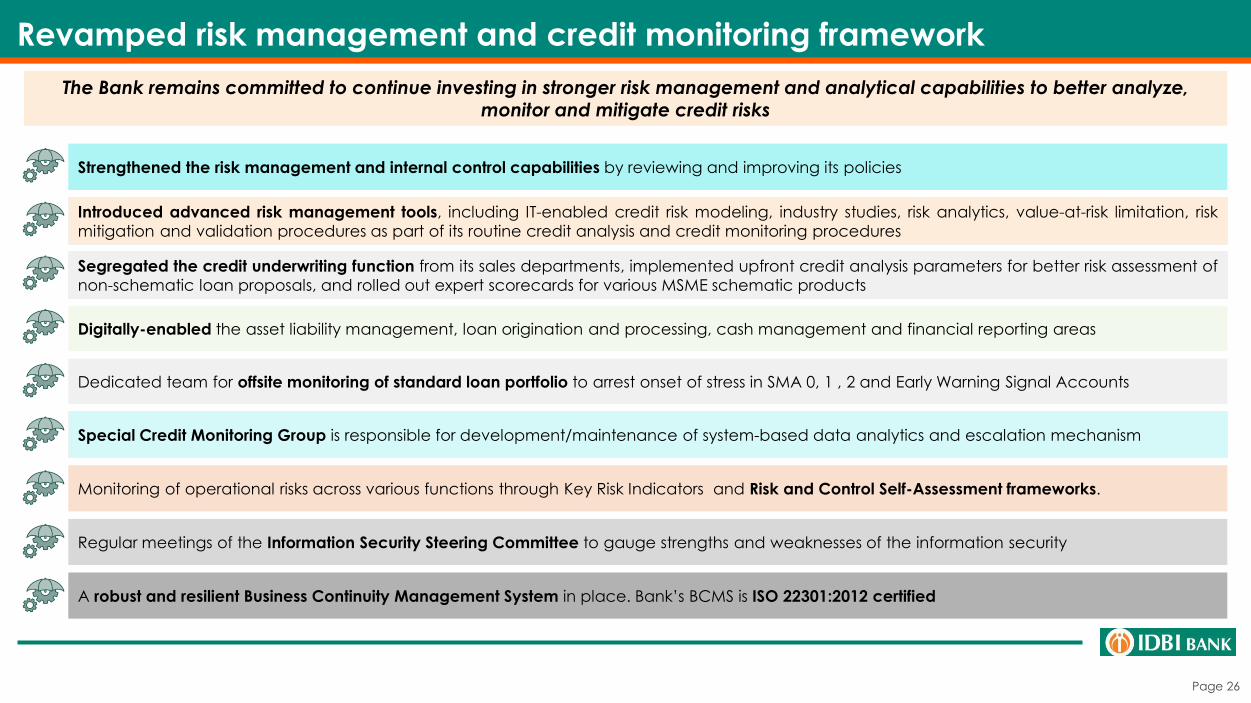
Revamped risk management and credit monitoring framework
The Bank remains committed to continue investing in stronger risk management and analytical capabilities to better analyze, monitor and mitigate credit risks
Introduced advanced risk management tools, including IT-enabled credit risk modeling, industry studies, risk analytics, value-at-risk limitation, risk
mitigation and validation procedures as part of its routine credit analysis and credit monitoring procedures
Strengthened the risk management and internal control capabilities by reviewing and improving its policies
Digitally-enabled the asset liability management, loan origination and processing, cash management and financial reporting areas
Special Credit Monitoring Group is responsible for development/maintenance of system-based data analytics and escalation mechanism
Regular meetings of the Information Security Steering Committee to gauge strengths and weaknesses of the information security
Segregated the credit underwriting function from its sales departments, implemented upfront credit analysis parameters for better risk assessment of
non-schematic loan proposals, and rolled out expert scorecards for various MSME schematic products
Dedicated team for offsite monitoring of standard loan portfolio to arrest onset of stress in SMA 0, 1 , 2 and Early Warning Signal Accounts
Monitoring of operational risks across various functions through Key Risk Indicators and Risk and Control Self-Assessment frameworks.
A robust and resilient Business Continuity Management System in place. Bank’s BCMS is ISO 22301:2012 certified

Page 27
Bancassurance
• Sale of LIC policies through Bank’s branches & sourcing LICI’s P&GS products through select Branches of IDBI Bank
• During FY20, Bank was able to cross-sell over 67,660 LIC policies and during H1FY20, Bank was able to cross-sell over
27,050 policies to its customers
Collections
• LIC renewal Premium Collection through Retail Branches, Internet Banking & Direct Debit Facility
• Providing POS terminals at LIC Branches and LIC Premium Collection Points to facilitate collections of LIC
• Supporting collection and payments of all major categories of LIC accounts and departments
Asset & CASA Book
• Launched Salary Accounts for Agents and Employees of LIC & its subsidiaries
• Retail Loan Products for LIC Employees, Agents and staff of subsidiaries
• CASA/SRA Business Drive for reaching out to LIC Premium Paying Customers
Other initiatives under progress
• Setting up of E-lobby, ATMs and Branches in LIC premises
• Enabling IDBI Bank Branches to provide basic services to LIC Policy holder
• Facility of online loan against LIC policy by way of providing online Surrender value and assignment
• LIC renewal premium collection through UPI gateway
Synergies from the relationship with LIC
LIC, a major state-owned insurance group and investment corporation in India, provides the Bank with a significant pool of customers from which to cross-sell its banking products and other financial services

Page 28
Strategies

Page 29
Strategies
Diversify the Bank’s asset portfolio by increasing the Bank’s retail assets
Broaden the Bank’s funding base and reduce its cost of deposits
Increase business synergies with LIC
Focus on digital platforms
Optimize risk management processes, decrease NPA levels and increase recoveries
Increase the Bank’s share of fee-based income
Focus on leveraging the operational flexibility post reclassification as private sector bank

Page 30
Annexures
Page 31
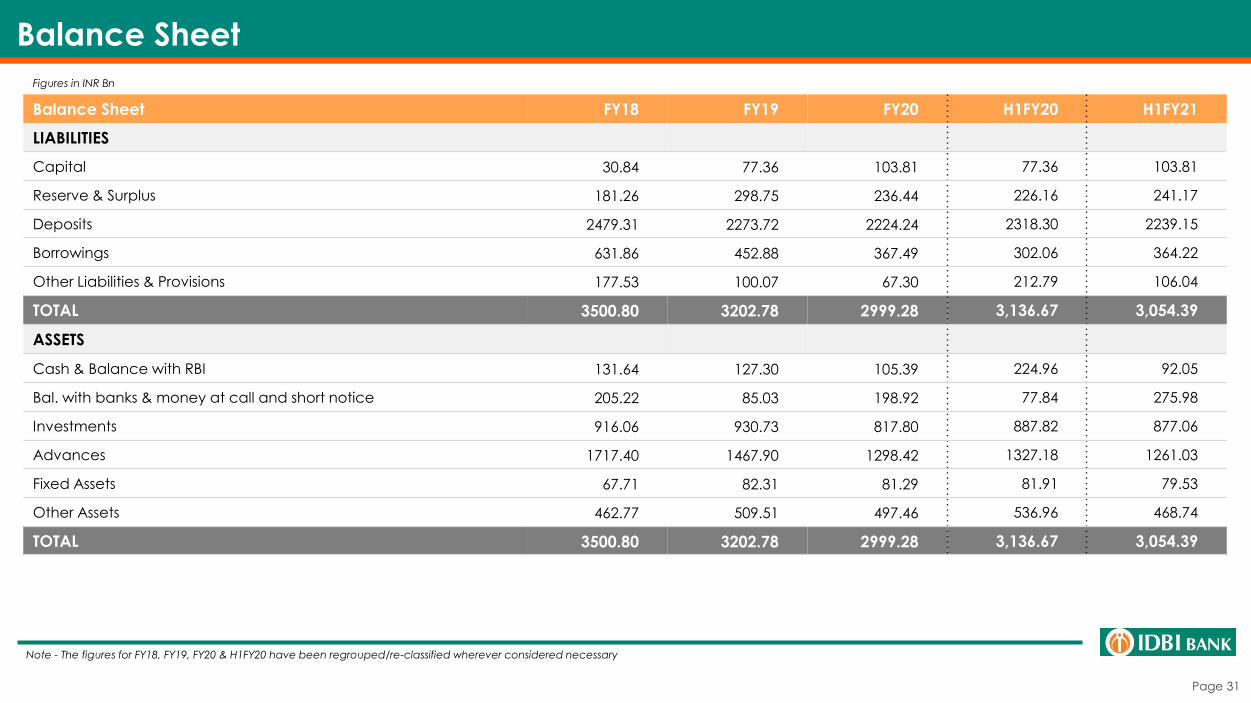
Balance Sheet FY18 FY19 FY20 H1FY20 H1FY21
LIABILITIES
Capital 30.84 77.36 103.81 77.36 103.81
Reserve & Surplus 181.26 298.75 236.44 226.16 241.17
Deposits 2479.31 2273.72 2224.24 2318.30 2239.15
Borrowings 631.86 452.88 367.49 302.06 364.22
Other Liabilities & Provisions 177.53 100.07 67.30 212.79 106.04
TOTAL 3500.80 3202.78 2999.28 3,136.67 3,054.39
ASSETS
Cash & Balance with RBI 131.64 127.30 105.39 224.96 92.05
Bal. with banks & money at call and short notice 205.22 85.03 198.92 77.84 275.98
Investments 916.06 930.73 817.80 887.82 877.06
Advances 1717.40 1467.90 1298.42 1327.18 1261.03
Fixed Assets 67.71 82.31 81.29 81.91 79.53
Other Assets 462.77 509.51 497.46 536.96 468.74
TOTAL 3500.80 3202.78 2999.28 3,136.67 3,054.39
Balance Sheet
Figures in INR Bn
Note - The figures for FY18, FY19, FY20 & H1FY20 have been regrouped/re-classified wherever considered necessary
Page 32
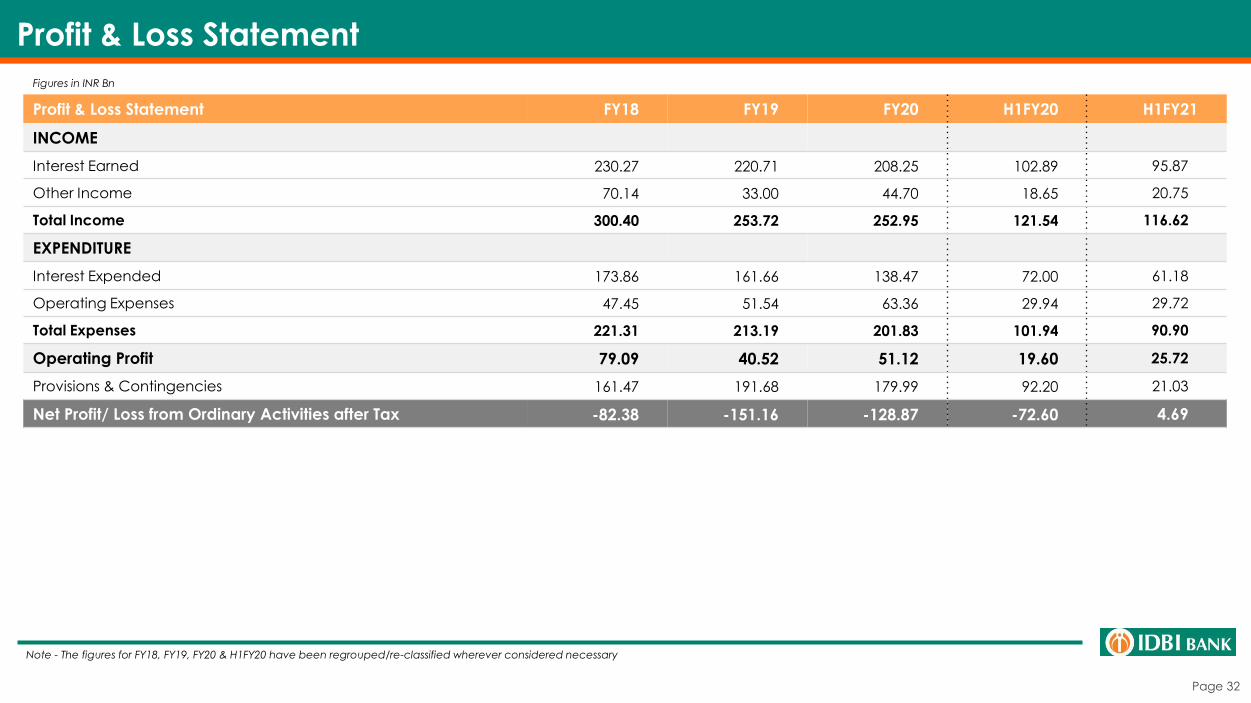
Profit & Loss Statement
Profit & Loss Statement FY18 FY19 FY20 H1FY20 H1FY21
INCOME
Interest Earned 230.27 220.71 208.25 102.89 95.87
Other Income 70.14 33.00 44.70 18.65 20.75
Total Income 300.40 253.72 252.95 121.54 116.62
EXPENDITURE
Interest Expended 173.86 161.66 138.47 72.00 61.18
Operating Expenses 47.45 51.54 63.36 29.94 29.72
Total Expenses 221.31 213.19 201.83 101.94 90.90
Operating Profit 79.09 40.52 51.12 19.60 25.72
Provisions & Contingencies 161.47 191.68 179.99 92.20 21.03
Net Profit/ Loss from Ordinary Activities after Tax -82.38 -151.16 -128.87 -72.60 4.69
Figures in INR Bn
Note - The figures for FY18, FY19, FY20 & H1FY20 have been regrouped/re-classified wherever considered necessary
Page 33
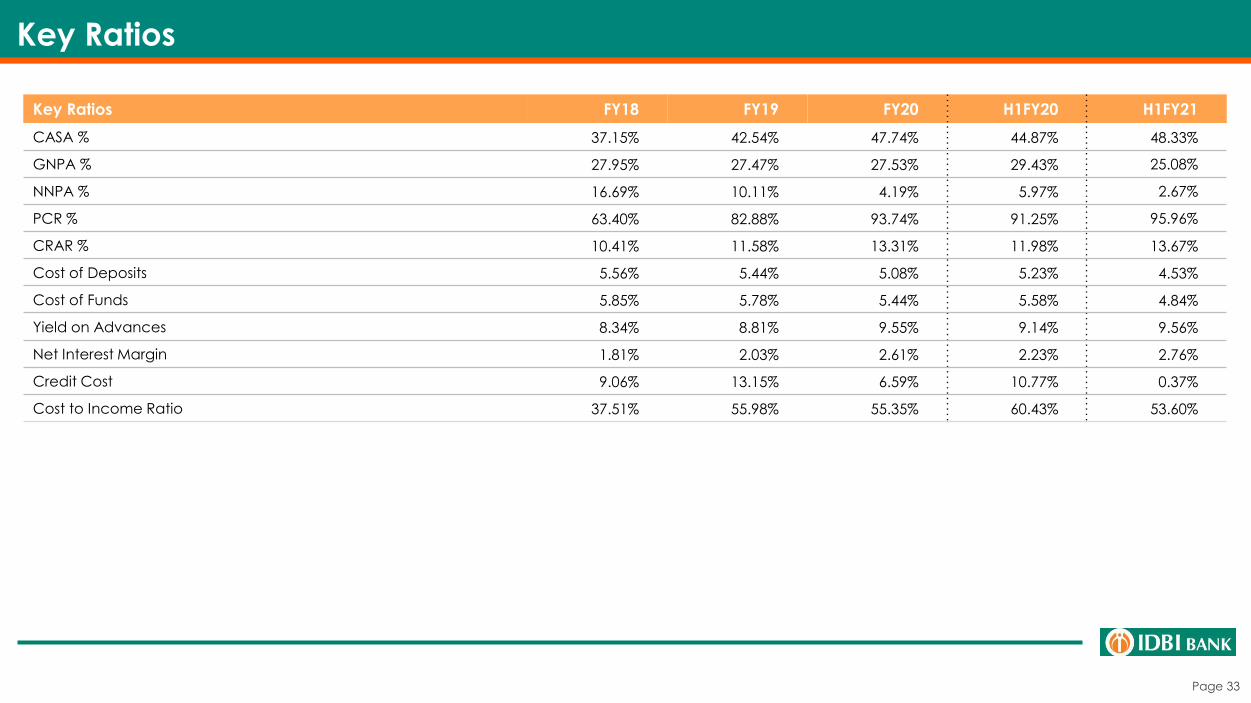
Key Ratios
Key Ratios FY18 FY19 FY20 H1FY20 H1FY21
CASA % 37.15% 42.54% 47.74% 44.87% 48.33%
GNPA % 27.95% 27.47% 27.53% 29.43% 25.08%
NNPA % 16.69% 10.11% 4.19% 5.97% 2.67%
PCR % 63.40% 82.88% 93.74% 91.25% 95.96%
CRAR % 10.41% 11.58% 13.31% 11.98% 13.67%
Cost of Deposits 5.56% 5.44% 5.08% 5.23% 4.53%
Cost of Funds 5.85% 5.78% 5.44% 5.58% 4.84%
Yield on Advances 8.34% 8.81% 9.55% 9.14% 9.56%
Net Interest Margin 1.81% 2.03% 2.61% 2.23% 2.76%
Credit Cost 9.06% 13.15% 6.59% 10.77% 0.37%
Cost to Income Ratio 37.51% 55.98% 55.35% 60.43% 53.60%
Page 34
www.idbibank.in
Thank You