Idaho Water Supply Outlook IDWR State Water Supply Meeting Jan 12, 2012 Current Conditions & New...
36
Idaho Water Supply Outlook IDWR State Water Supply Meeting Jan 12, 2012 Current Conditions & New Normals Maybe new normals also means new peaks and new lows
-
Upload
grant-lloyd -
Category
Documents
-
view
214 -
download
0
Transcript of Idaho Water Supply Outlook IDWR State Water Supply Meeting Jan 12, 2012 Current Conditions & New...
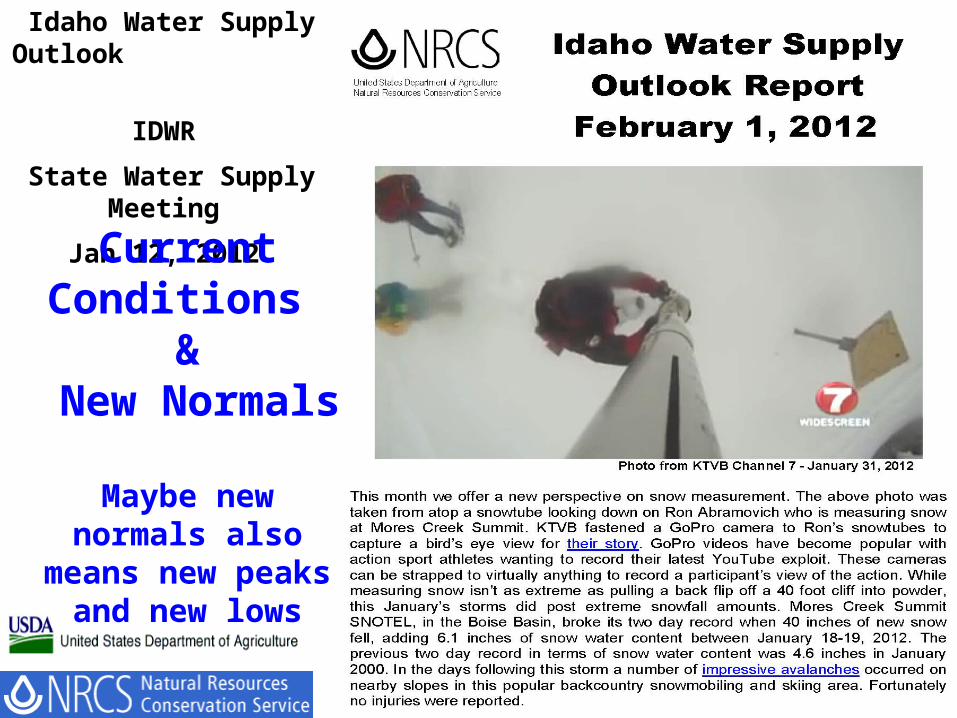
Idaho Water Supply Outlook
IDWR
State Water Supply Meeting
Jan 12, 2012
Current Conditions
& New Normals
Maybe new normals also means new peaks
and new lows
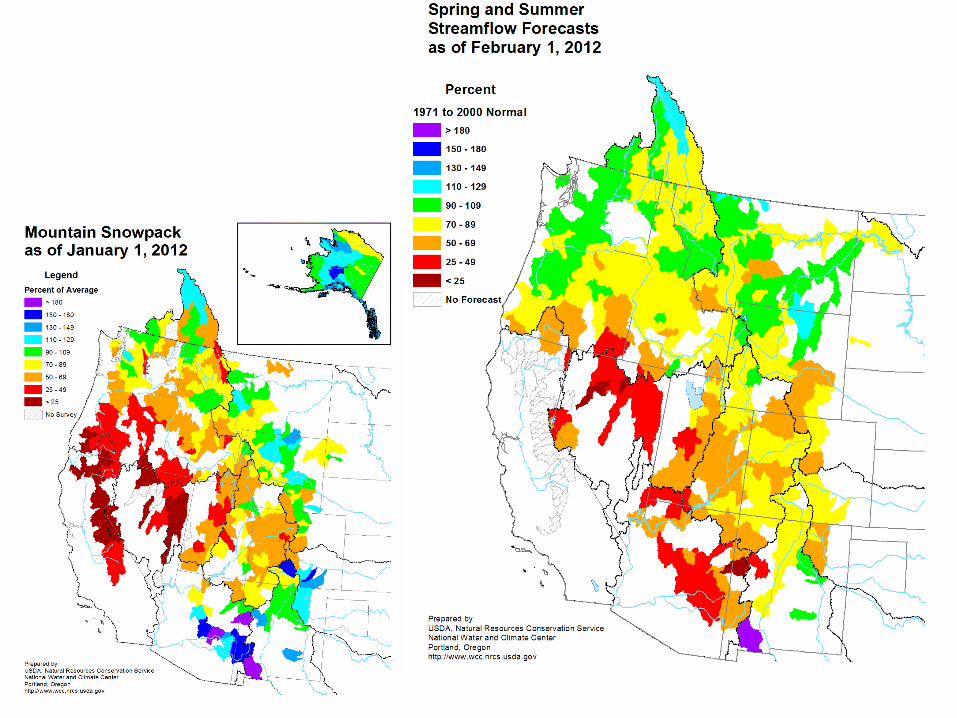


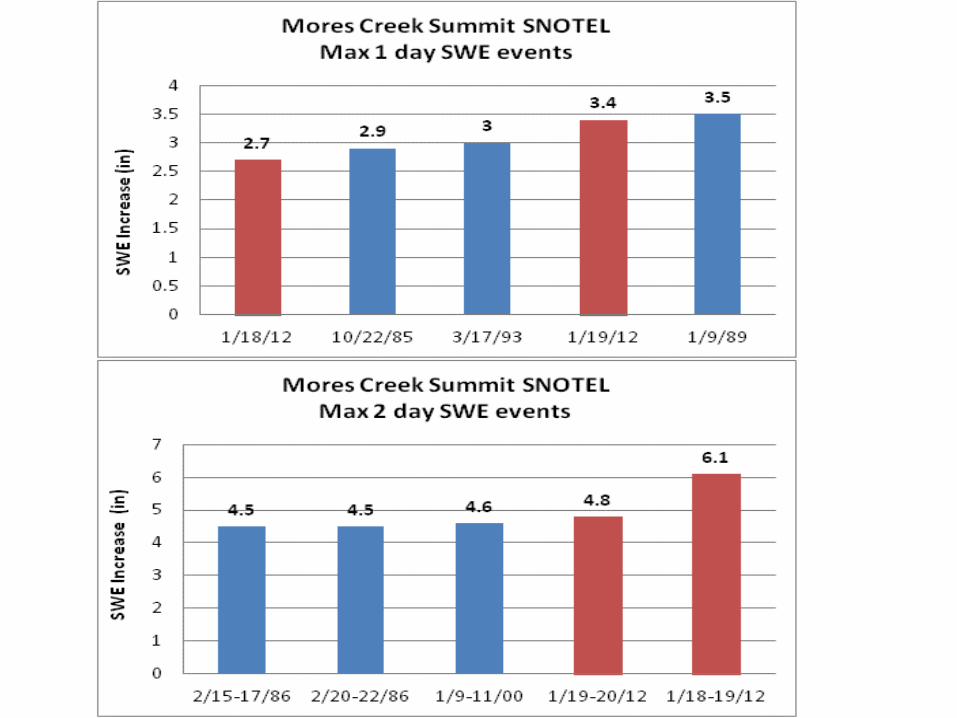
Today’s Snowpack are ONLY 40 - 65% of Seasonal Peaks that occur in early April

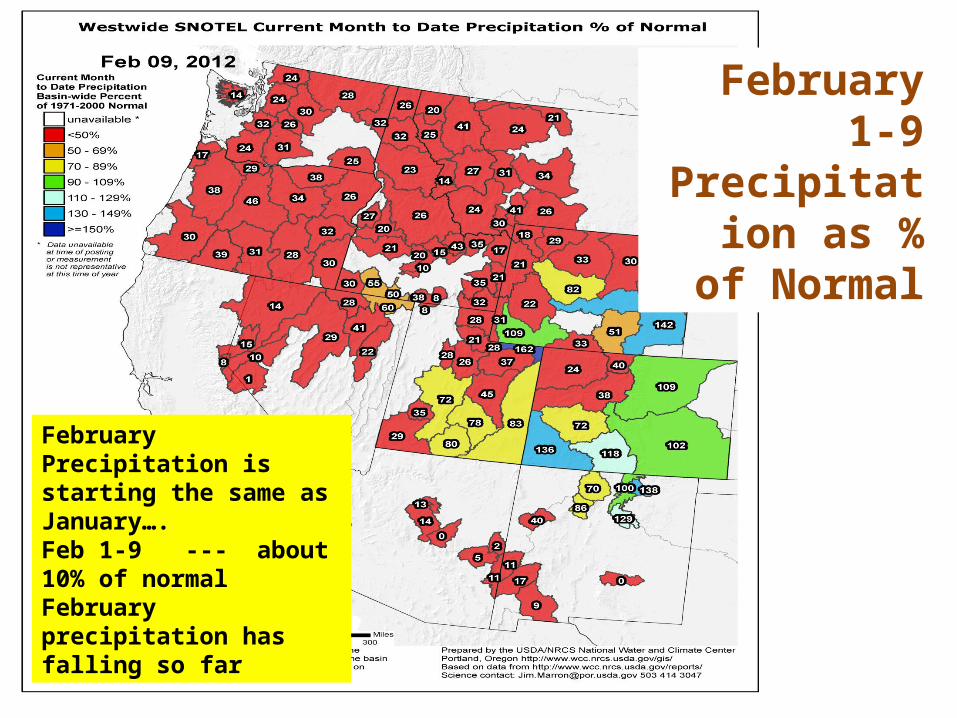
February Precipitation is starting the same as January…. Feb 1-9 --- about 10% of normal February precipitation has falling so far
February 1-9 Precipitation as
% of Normal

January Precipitation for Individual Basins
% of Average
Wood & LostBig Wood 110Camas 143 Little Wood 99Big Lost 88Little Lost 74Birch 60Medicine Lodge, Beaver, Camas 57
Southside Snake River BasinsRaft 175Oakley 204Salmon Falls 150Bruneau 133Owyhee 160
Basin wide average 97%
Basin wide average 161%

Southern Idaho Record High January Precipitation Amounts
for Selected SitesDaily Data Starts in 1982 (inches)
New PreviousRecord Record Maximum January January Monthly
SNOTEL Site 2011 1998 Amount
Bostetter R.S. 7.6 6.6 10.2 Dec 1997
Magic Mountain 9.1 8.2 10.3 Nov 1989
Howell Canyon 9.9 12.8 15.7 Dec 19974th highest January amount since 1982

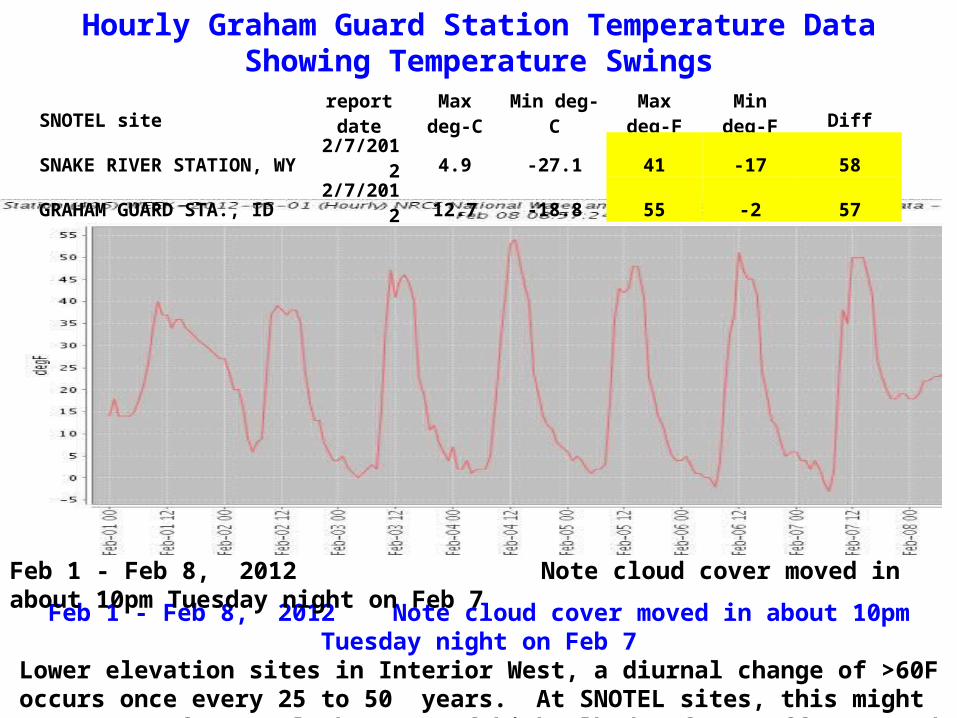
Hourly Graham Guard Station Temperature DataShowing Temperature Swings
Feb 1 - Feb 8, 2012 Note cloud cover moved in about 10pm Tuesday night on Feb 7Lower elevation sites in Interior West, a diurnal change of >60F occurs once every 25 to 50
years. At SNOTEL sites, this might occur more frequently because of high albedo of sun off snow and clear nights with some drainage of dense cold air.
SNOTEL sitereport date
Max deg-C
Min deg-C
Max deg-F
Min deg-F Diff
SNAKE RIVER STATION, WY 2/7/2012 4.9 -27.1 41 -17 58GRAHAM GUARD STA., ID 2/7/2012 12.7 -18.8 55 -2 57
Feb 1 - Feb 8, 2012 Note cloud cover moved in about 10pm Tuesday night on Feb 7


But good news is
from last year
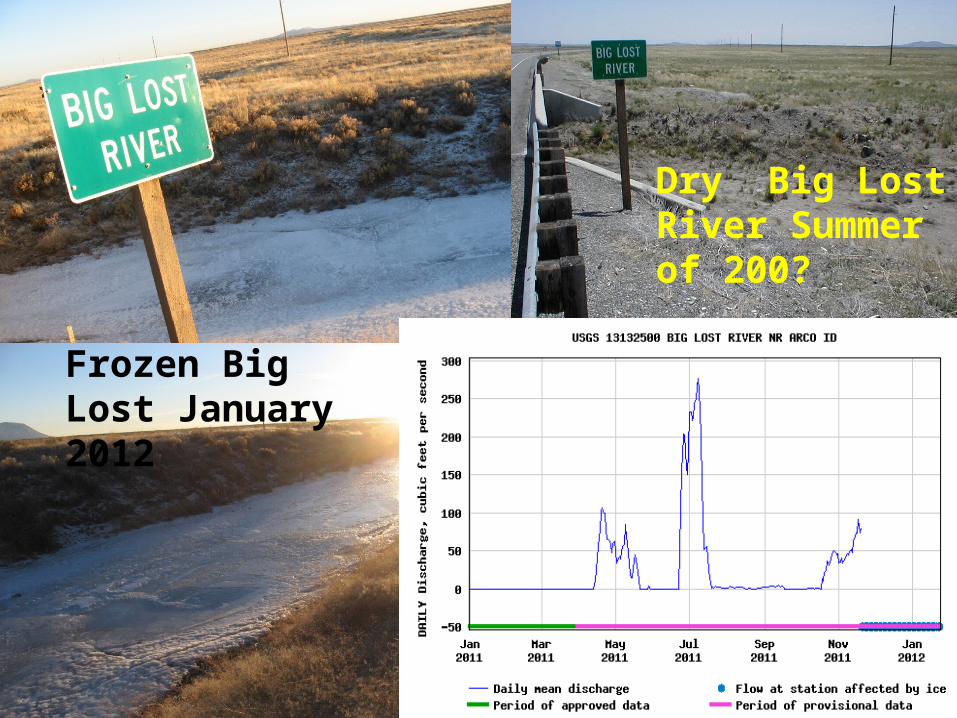
Frozen Big Lost January 2012
Dry Big Lost River Summer of 200?
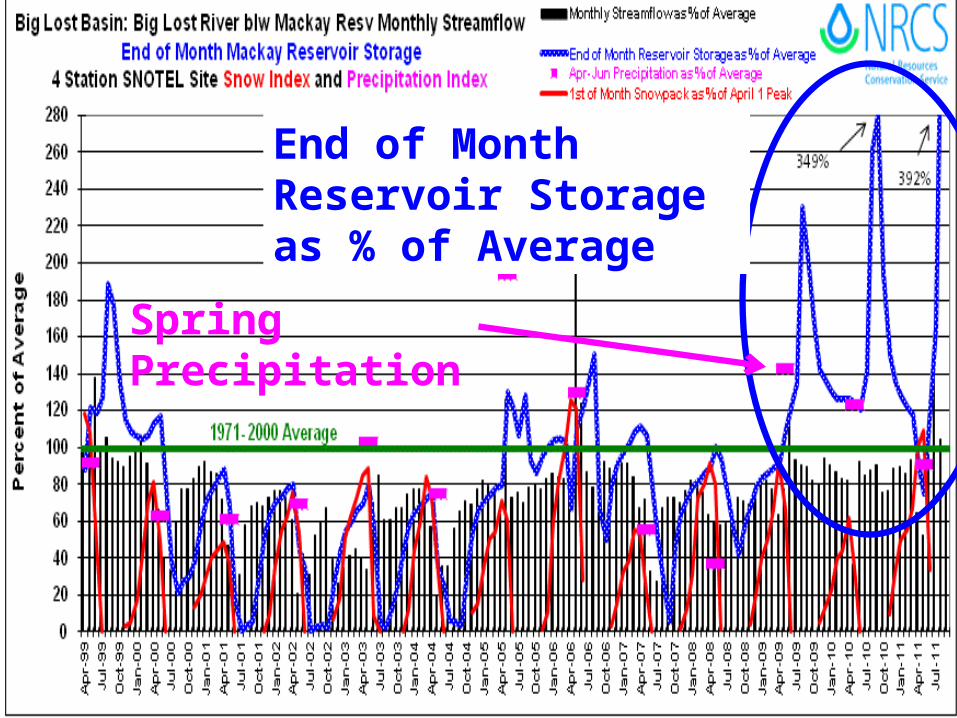
End of Month Reservoir Storage as % of Average
Spring Precipitation
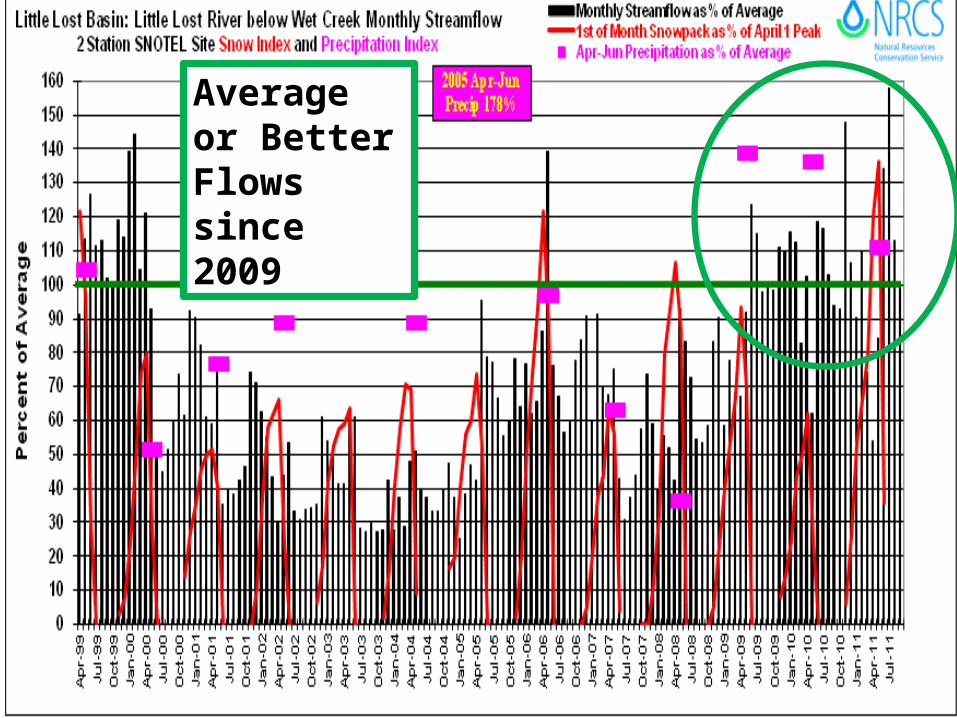
Average or Better Flows since 2009

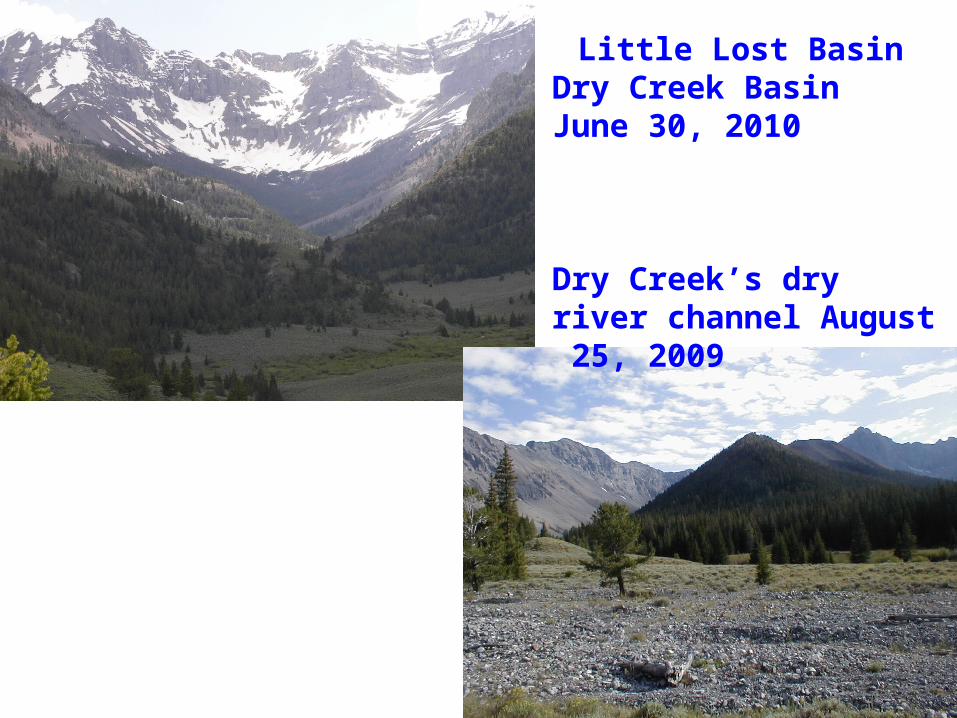
Little Lost Basin Dry Creek BasinJune 30, 2010
Dry Creek’s dry river channel August 25, 2009


33% chance to return to normal snow by April 1 based on 6 out of 18 years with below normal snow on Jan 1 that returned to average by April 1

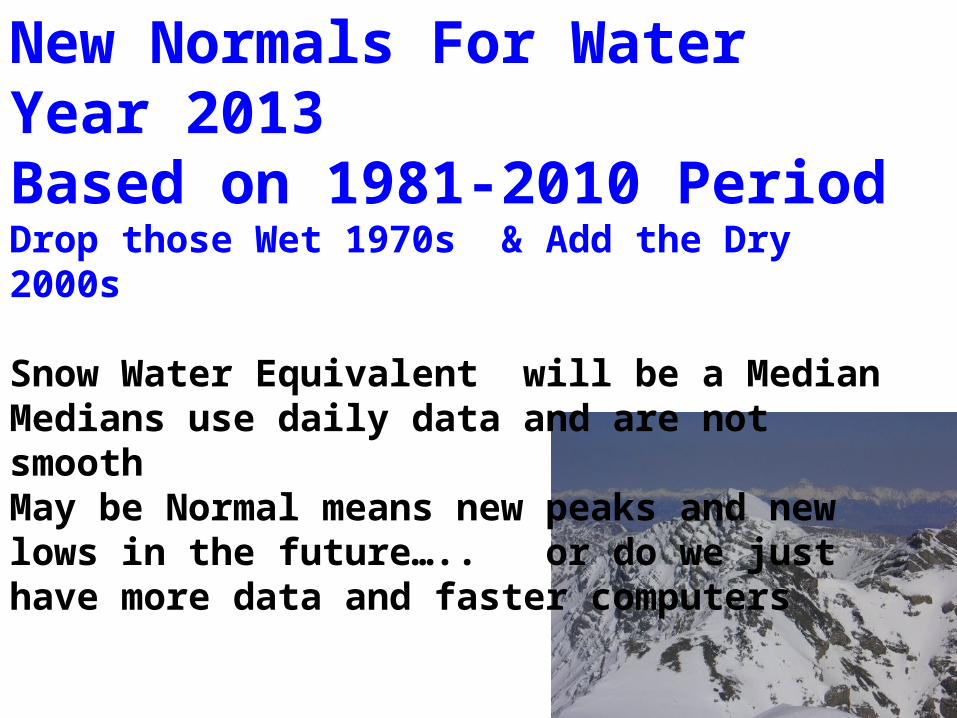
New Normals For Water Year 2013Based on 1981-2010 PeriodDrop those Wet 1970s & Add the Dry 2000s
Snow Water Equivalent will be a MedianMedians use daily data and are not smoothMay be Normal means new peaks and new lows in the future….. or do we just have more data and faster computers
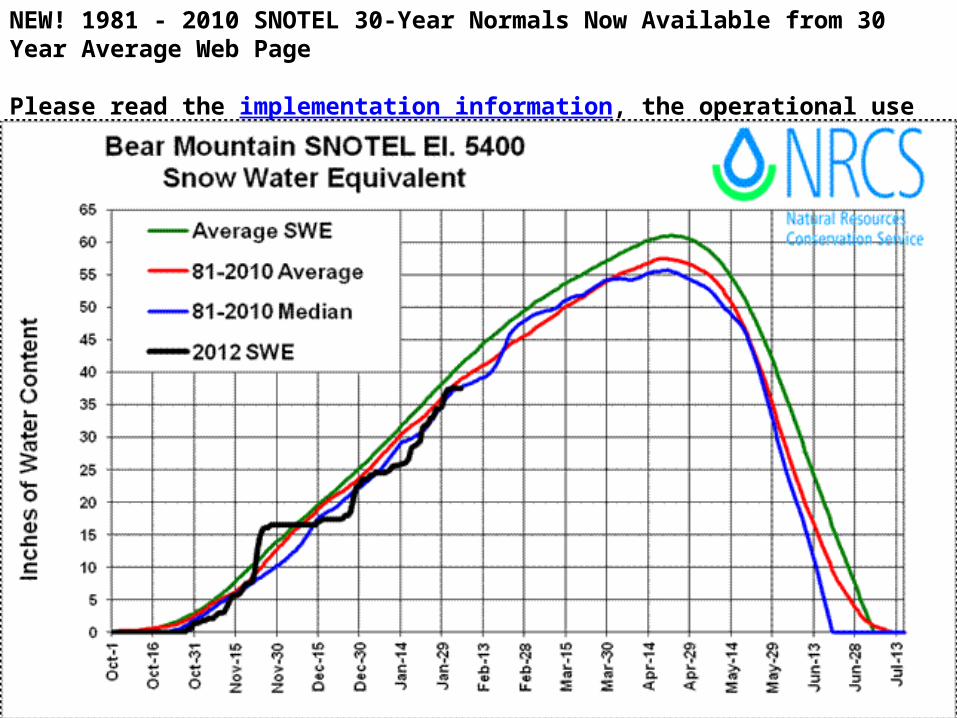
NEW! 1981 - 2010 SNOTEL 30-Year Normals Now Available from 30 Year Average Web Page
Please read the implementation information, the operational use of the new normals will start in October of 2012. Monthly 1981 - 2010 Normals, Idaho Data Collection Area Only


Deadwood Summit 23.6 SWE Feb 8, 201149% of 1971-2000 Peak
59% of 1981-2010 Median Peak
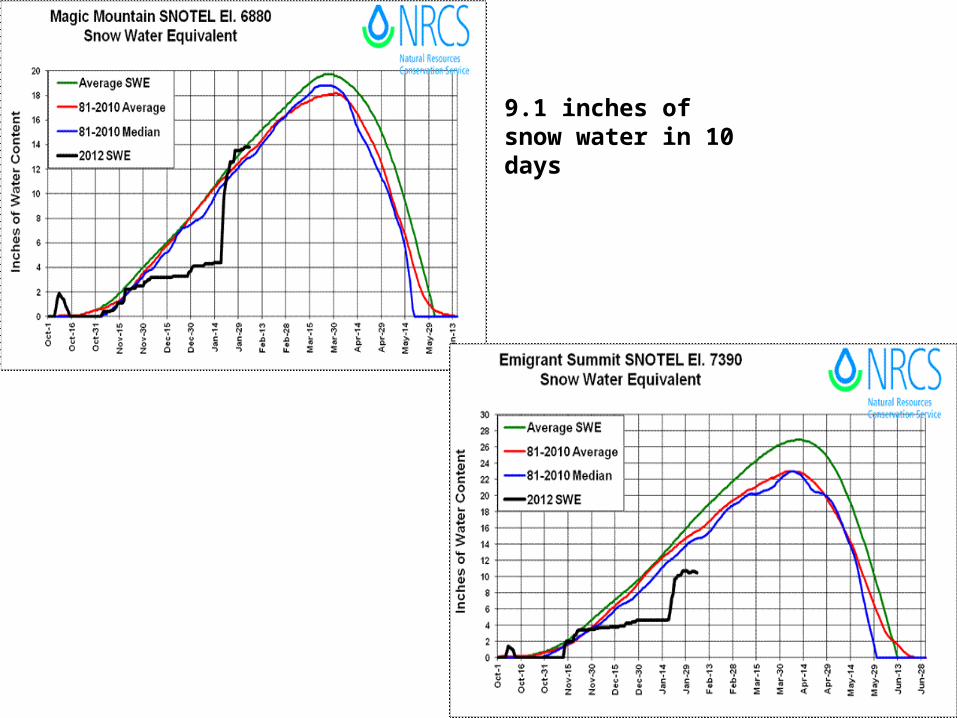
9.1 inches of snow water in 10 days

Lewis Lake Divide SWE Feb 8, 201119.5” 53% of 1971-2000 Peak 64% of 1981-2010 Median Peak
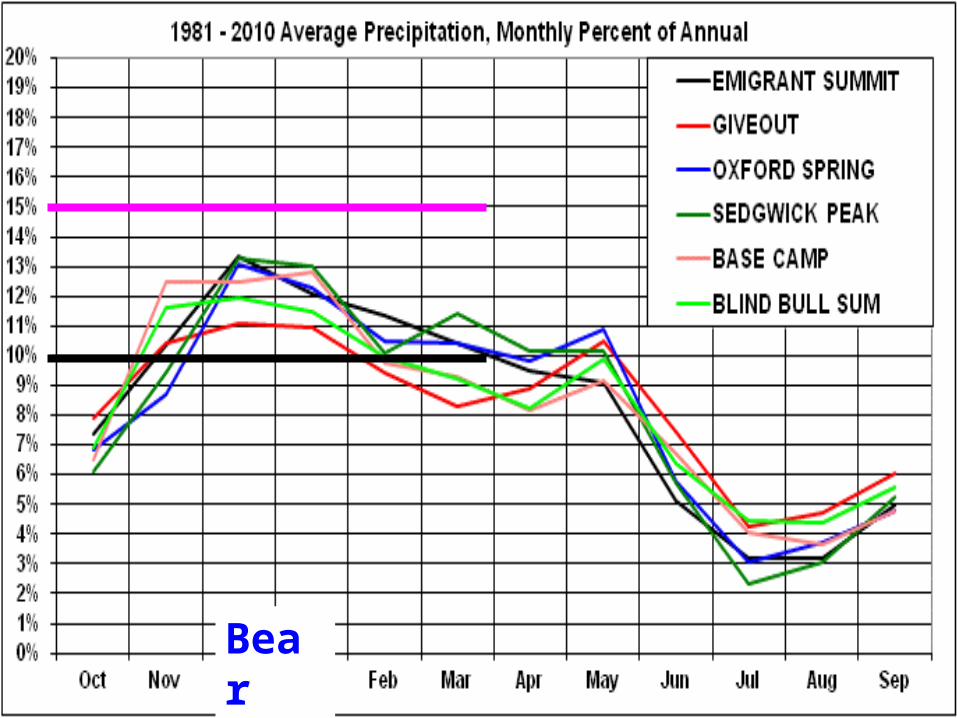
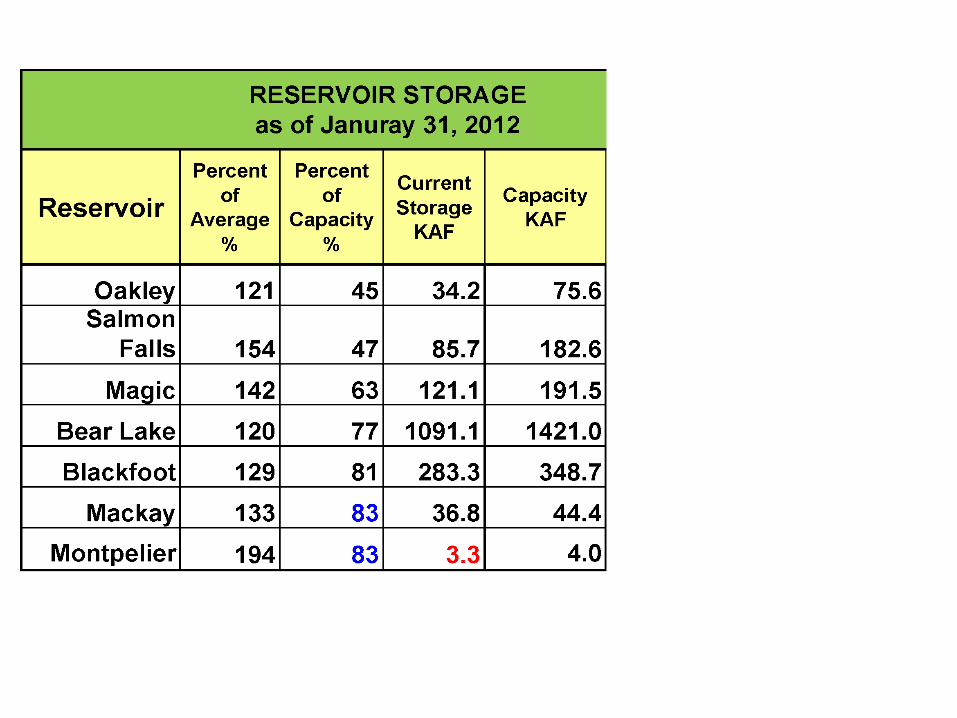
Bear
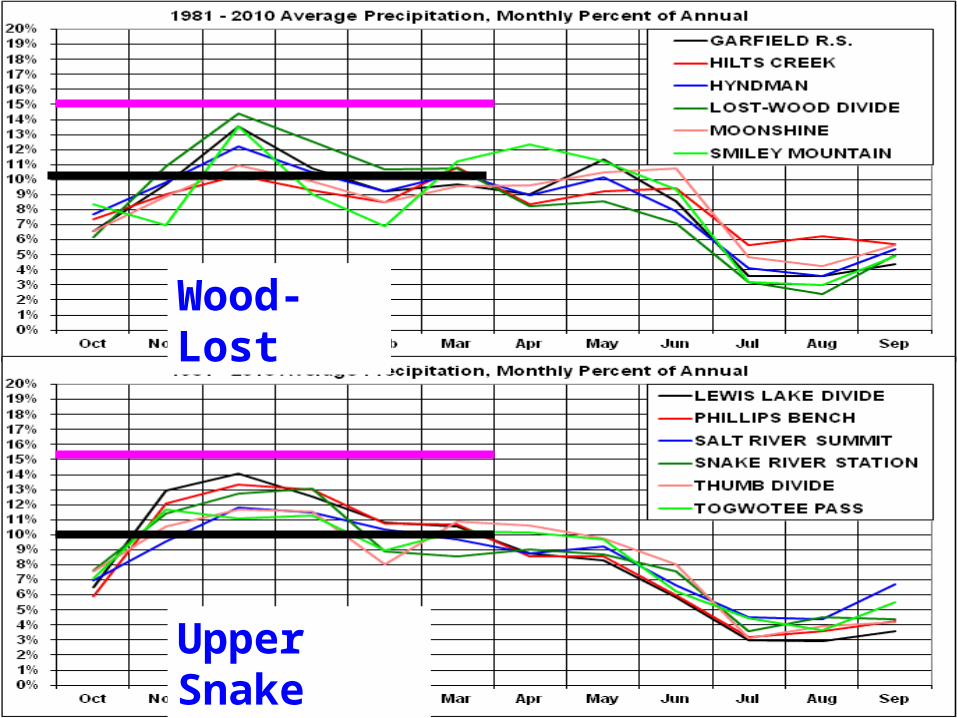
Wood-Lost
Upper Snake
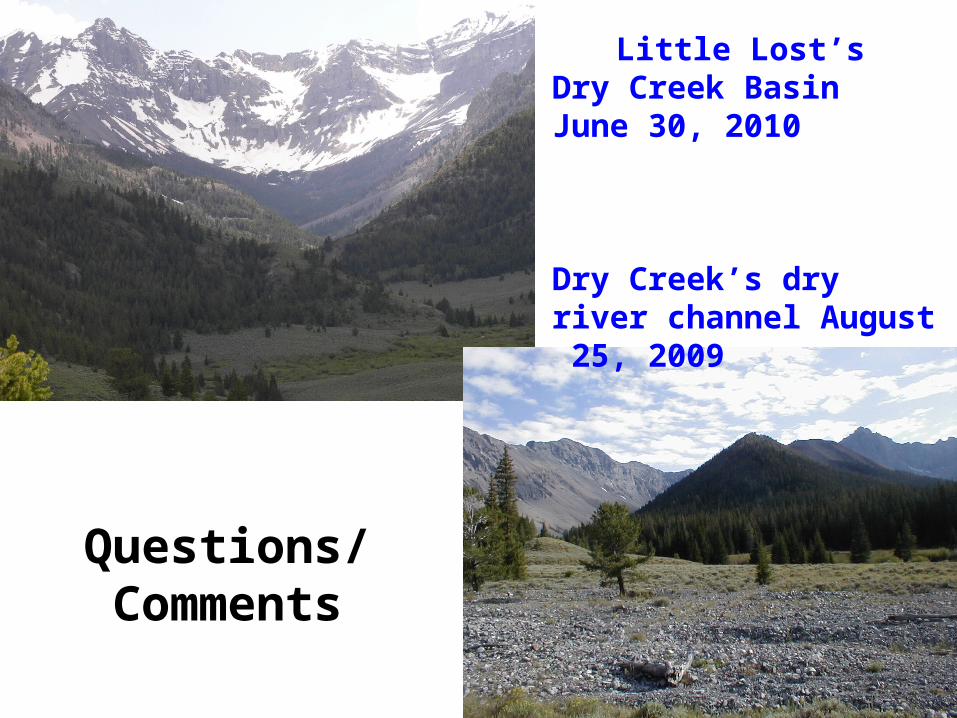
Little Lost’s Dry Creek BasinJune 30, 2010
Dry Creek’s dry river channel August 25, 2009
Questions/ Comments