IDA at 65: Heading Toward Retirement or a Fragile Lease on Life?
27
Working Paper 246 March 2011 IDA at 65: Heading Toward Retirement or a Fragile Lease on Life? Abstract Even under conservative assumptions, IDA will likely face a wave of country graduations by 2025. We project that it will lose more than half of its client countries and that the total population living in IDA-eligible countries will plunge by two- thirds. e remaining IDA-eligible countries will be significantly smaller in size and overwhelmingly African, and a majority are currently considered fragile or post- conflict. is drastically altered client base will have significant implications for IDA’s operational and financial models. We conclude with three possible options for IDA and recommend that World Bank shareholders and management begin frank discussions on its future sooner rather than later. www.cgdev.org Todd Moss and Benjamin Leo
-
Upload
center-for-global-development -
Category
Documents
-
view
219 -
download
0
description
By 2025, the number of IDA client countries will likely shrink substantially and primarily be smaller in size and overwhelmingly African. This working paper predicts how these changes will impact IDA's operational and financial models and recommends the World Bank begin addressing the implications of these developments sooner rather than later.
Transcript of IDA at 65: Heading Toward Retirement or a Fragile Lease on Life?
Working Paper 246March 2011
IDA at 65: Heading Toward Retirement or a Fragile Lease on Life?
Abstract
Even under conservative assumptions, IDA will likely face a wave of country graduations by 2025. We project that it will lose more than half of its client countries and that the total population living in IDA-eligible countries will plunge by two-thirds. The remaining IDA-eligible countries will be significantly smaller in size and overwhelmingly African, and a majority are currently considered fragile or post-conflict. This drastically altered client base will have significant implications for IDA’s operational and financial models. We conclude with three possible options for IDA and recommend that World Bank shareholders and management begin frank discussions on its future sooner rather than later.
www.cgdev.org
Todd Moss and Benjamin Leo

IDA at 65: Heading Toward Retirement or a Fragile Lease on Life?
Todd Moss
Benjamin Leo
Todd Moss is vice president and senior fellow at the Center for Global Development and former deputy assistant secretary for Africa in the U.S. Department of State. Benjamin Leo is a research fellow at CGD and former director for african affairs at the National Security Council and senior staff member of the U.S. Department of Treasury. We are grateful to Stephanie Majerowicz for her outstanding research work. We also thank Ravi Kanbur, Devesh Kapur, Alan Gelb, Lant Pritchett, Nancy Birdsall, and several anonymous reviewers for comments on earlier drafts of this paper. We are also thankful to CGD colleagues for their input during a preliminary internal seminar. The authors are solely responsible for any errors in fact or judgment.
CGD is grateful for contributions from the Swedish Ministry of Foreign Affairs and the Norwegian Ministry of Foreign Affairs in support of this work.
Todd Moss and Benjamin Leo. 2011. “IDA at 65: Heading Toward Retirement or a Fragile Lease on Life?” CGD Working Paper 246. Washington, D.C.: Center for Global Development. http://www.cgdev.org/content/publications/detail/1424901
Center for Global Development1800 Massachusetts Ave., NW
Washington, DC 20036
202.416.4000(f ) 202.416.4050
www.cgdev.org
The Center for Global Development is an independent, nonprofit policy research organization dedicated to reducing global poverty and inequality and to making globalization work for the poor. Use and dissemination of this Working Paper is encouraged; however, reproduced copies may not be used for commercial purposes. Further usage is permitted under the terms of the Creative Commons License.
The views expressed in CGD Working Papers are those of the authors and should not be attributed to the board of directors or funders of the Center for Global Development.

1
I. INTRODUCTION
Figure 1: IDA’s Future?
Fast forward to 2025. In that year, the World Bank’s shareholders will begin discussing
the 21st replenishment of the International Development Association (IDA). Every three
years since IDA’s founding in 1960, the shareholders have met to consider financial
contributions that enable the Bank’s soft loan window to make low-interest loans and
grants to the governments of the world’s poorest countries. In addition to deciding how
much to pledge, the shareholders also use the replenishment negotiations to consider
policy and strategic changes for the institution.

2
In 2025, IDA will be turning 65 years old. By then, the institution will be able to claim
widespread success – pointing to the large number of countries that have ―graduated‖
from IDA as a result of growing too wealthy to qualify for its assistance. IDA, as an
institution serving its shareholders, has twin goals: (1) to provide finance to countries
which cannot borrow because of low-income or lack of creditworthiness; and (2) to help
countries grow wealthier and improve their policies so that they can turn to commercial
markets or the World Bank’s hard window for their capital needs. Indeed, the structural
irony of IDA is that its strategic goals are in contradiction with its own growth, and even
survival, as an institution. In short, IDA’s success is in large part determined by its
ability to shrink its own client base.
For most of its history, IDA has not been forced to confront this graduation issue directly.
The pool of low-income countries has been sufficiently large, and donor/shareholder
attention to the needs of poor countries sufficiently strong. This combination of factors
usually justified continually larger replenishments. The total number of IDA eligible
countries rose as these states gained independence in the 1960s and 1970s. Over the
intervening years, some 27 countries graduated from IDA by growing too wealthy.1 The
graduation of China, its largest client, in 1999 partly justified a steep decline in the IDA-
11 replenishment period envelope (1996-98). However, steady replenishment growth
resumed afterward. In December 2010, IDA concluded its 16th replenishment – its
largest ever – with an overall financing envelope totaling of $49.3 billion for 2011-13,
including $34.7 billion in donor shareholder contributions.
Today, the total number of IDA-eligible countries stands at 79. However, by 2025,
IDA’s client base likely will look very different. A large number of clients, including
some of IDA’s largest borrowers and many of its best-performing clients, currently are
pushing up against the income threshold and thus are expected to graduate within the next
10 to 15 years. This paper projects IDA graduation for the next fifteen years as a thought
exercise about the future of IDA. Specifically, what countries will remain IDA clients in
2025? What will be their profile and needs? What will this changed client base mean for
the future of the Bank? And, what might it mean for IDA’s operations and strategic
direction today?
We find that the pool of clients will change considerably. We find that:
IDA will lose more than half of its client countries within the next 15 years.
1 There actually have been 35 country graduates over time. However, 8 countries have since “reverse-
graduated” and remain eligible today (see appendix I for details).
3
The client base will become overwhelmingly African and dominated by countries
currently classified as fragile or post-conflict states.
These changes bring major implications for IDA’s operational and financial
model.
We conclude by suggesting three possible models going forward. First, IDA
management and shareholders could attempt to maintain the status quo approach in
financial and operational terms. This would imply that assistance envelopes would
increase several-fold for the remaining recipient countries. We call this the hope for the
best approach. Second, country flows could remain constant in real terms. At the same
time, IDA’s overall size would shrink due to country graduation over time. In practice,
this approach may make regular donor replenishments unnecessary beyond the IDA-20 or
IDA-21 periods. Third, management and shareholders could decide to overhaul IDA’s
basic allocation model – thereby shifting from its existing country-based approach to a
regional or global public goods driven model. These conclusions, combined with the
long-term nature of IDA’s financing and operations, suggest that World Bank
management and shareholders should begin discussions soon about the future of IDA and
the best way to meet the World Bank’s overarching goal of a ―world free of poverty‖.
II. PROJECTING THE POOL OF IDA-ELIGIBLE COUNTRIES IN 2025
The first step in thinking about IDA’s future is to project its client base. Decisions about
programmatic focus areas, IDA’s cooperation with other development institutions, and its
financing envelope all will be driven by which countries will remain eligible for IDA
assistance. Although future rates of economic growth are impossible to project with
pinpoint accuracy, there are plausible scenarios for estimating who will be in and who
will be out.
Methodology: Current IDA eligibility is determined by two factors: (1) GDP per capita
below a pre-established threshold; and (2) lack of creditworthiness that prevents
borrowing from the World Bank’s commercial lending window, the International Bank
for Reconstruction and Development (IBRD). In our projections, we use GDP per capita
as the primary indicator of future IDA eligibility and assume that all countries below the
threshold also meet the lack of creditworthiness criterion.2 Currently, the operational
threshold for IDA eligibility is set at a GNI per capita of $1,165 in real 2009 dollars. For
simplicity, we hold all calculations in constant 2009 U.S. dollars and apply real growth
rates. Assuming no change in the operational threshold for IDA other than adjustments 2 IDA (2010). A review of IDA’s Long Term Fiscal Capacity, and Financial Instruments, p. 29.
4
for inflation – a reasonable assumption given past practice – we then compare countries’
projected real GDP per capita to the current threshold to determine when countries are
likely to cross the operational threshold.3
In practice, countries do not immediately graduate after breaching this income-based
threshold. In making its own internal predictions, IDA includes a five-year delay between
exceeding the threshold and the cessation of new IDA lending (i.e., formal graduation).4
This delay allows country authorities adequate time to plan for their changed borrowing
status. It also is designed to prevent ―reverse-graduation‖ as a result of short-term
volatility in income levels and creditworthiness. For consistency, we follow this practice
and apply a five-year lag between when a country first crosses the $1,165 GNI per capita
threshold and our projected graduation date.
Baseline Projection: In order to forecast the GDP per capita going forward, we rely on
the IMF’s World Economic Outlook (WEO) projection estimates. The WEO provides
projections for both nominal GDP and real GDP growth rates through 2015.5 Our
calculations follow three very simple steps. First, we calculate total GDP for each
country in 2025 (in constant 2009 U.S. dollars) by applying the WEO growth projections.
Second, we apply the WEO’s real growth rate projections for the year 2015 – which
represents the IMF’s best estimate of medium-term growth rates – on a constant basis
between 2015 and 2025. Lastly, we divide the real GDP estimates by the most recent
2025 population projections from the UN Population Division to derive per capita
estimates.6
Small Island Nation Exclusion: IDA currently has an exception that allows for extension
of assistance to eleven small island countries that are above the eligibility threshold. This
exception is based upon the premise that these countries still need development assistance
due to special constraints inherent to small countries (i.e. small domestic markets, high
cost of infrastructure, acute vulnerability to natural disasters, etc.). Because credits to
these countries represent a very small percentage of the total IDA lending (less than 0.5
percent for the IDA-15 period), and because decisions to graduate small island countries
3 The main difference between GDP and GNI is that the latter includes income received from other
countries (e.g., interest and dividends) less similar payments made to other countries. 4 Ibid.
5 IMF (2010), World Economic Outlook Database- April 2010.
6 United Nations (2009). World Population Prospects: The 2008 Revision. The UN Population Division
produces eight different variants for their population projections. We use the medium variant. UN
population data provides a more refined estimate than assuming constant population growth, bec ause it
takes into account local demographic dynamics and detailed assumptions about the future paths of
fertil ity, mortality and international migration.

5
are based on other criteria, we exclude these small island nations altogether from our
analysis and make no prediction or judgment on their continued eligibility.7
Key Findings: Our baseline model projects that the composition of IDA clients will
change significantly — if perhaps not surprisingly — by the year 2025.8 Table 1 shows
projected graduation dates by IDA replenishment period. The main findings are:
More than half of the current IDA-eligible countries (36 out of 68) will graduate
by 2025 – even after accounting for a five-year graduation lag.9 This includes all
existing countries currently classified as ―blend,‖ the 11 countries borrowing from
IDA under ―hardened‖ terms, plus 20 currently IDA-only countries.10
Some of the largest current recipients will graduate – including India, Vietnam,
Pakistan, Nigeria, Ghana, and Kenya.
Benin and Bangladesh both cross the operational income threshold by 2025, but
assuming the 5-year lag, they graduate only in 2029 (at the end of the IDA-21
period).
7 Ten small island nations currently fall officially under this exception (Kiribati, Tonga, Vanuatu, Samoa,
Cape Verde, Maldives, Dominica, St. Lucia, St. Vincent & Grenadines, and Grenada). Two others, Solomon
Islands and Sao Tome and Principe, are l ikely to fall under the exception once they reach the operational
threshold (Solomon Islands already crossed the threshold). 8 The year 2025 lies in the middle of the IDA 20 replenishment period, and is thus when the IDA 21
replenishment negotiations will begin. 9 This excludes small island countries.
10 “Blend” refers to countries with GDP per capita below the operational threshold, but who are
considered credit worthy by the IDRB, which allows them to borrow from both World Bank windows.
“Hardened” terms are extended to 1) countries that have recently crossed the operational threshold for a
period of two years, or 2) temporarily to countries that are above the operational threshold but are not
deemed credit worthy enough to have access to IBRD funds. Kosovo is currently classified as IDA eligible,
but has a World Bank estimated GDP per capita of $3240 but confusingly is not l isted as a hardened terms
country. For this reason, we have excluded Kosovo from all analysis.

6
Table 1 – Projected Graduates by IDA Replenishment Period, Baseline Scenario11
IDA-15 IDA-16 IDA-17 IDA-18 IDA-19 IDA-20 IDA-21
Azerb. (H/B) Angola (H) Cameroon Côte d'Ivoire Cambodia
Bangladesh
Armenia (H/B) India (B) Kenya Ghana*
Benin
Bhutan (H) Nigeria Kyrgyz Rep. Lesotho Bolivia (H) Vietnam (B) Laos Nicaragua
Bos. & Herz. (H/B) Yemen Rep. Mauritania Pakistan (B) Congo, Rep. of (H) Zambia PNG (B) Senegal Djibouti
Tajikistan
Georgia (H/B) Guyana
Honduras (H)
Moldova (H) Mongolia Sri Lanka (H)
Sudan* Uzbekistan (B)
Remaining IDA-Eligible Countries: So, who would be left? What will the IDA pool
look like in 2025? Table 2 compares the current IDA client pool with our projections for
2025 and Table 3 lists the countries projected to remain IDA-eligible. Figures 2 and 3
present the projections, income levels, and the size of current IDA allocations. The main
characteristics of the IDA client base by 2025 will be:
(1) Much Smaller:
Only 31 countries left;
Remaining eligible countries account for only 40 percent of current IDA
allocations;
The total population of IDA-eligible countries will fall by nearly two-
thirds, from almost 3 billion currently to roughly 1 billion.
11
This does not include countries that fall under the small island exception. Countries are l isted under the
last replenishment we expect them to receive funding (for instance, Azerbaijan received funds under IDA-
15, but will not do so under IDA-16). *Ghana’s projected graduation does not reflect the rebasing of its
GDP, which could accelerate its graduation significantly (see fn 17). Sudan’s fa te is l ikewise uncertain
pending the outcome of the 2011 Southern Sudanese referendum, and the latter’s envisioned
independence.

7
(2) Largely African
Sub-Saharan Africa will account for over 80 percent of client countries
(25 out of 31).
The only non-African countries will be Afghanistan, Bangladesh,
Myanmar, Nepal, Haiti, and Timor-Leste.
(3) More Fragile
Countries currently defined as fragile or post conflict will account for
nearly 60 percent of clients (18 out of 31).
Only four countries (Bangladesh, Myanmar, Timor-Leste, and
Zimbabwe) have not been classified as Heavily Indebted Poor
Countries (HIPCs).
The average IDA Resource Allocation Index (IRAI) score of
remaining countries drops from 3.3 to 3.1.12
Table 2: IDA Country Client Base Comparison, 2010 and 202513
12
The IRAI measures eligible countries’ institutional and policy performance according to 16 indicators.
Previously, the World Bank named it the Country Policy and Institutional Assessment (CPIA). For
additional details, see www.worldbank.org/ida. 13
*Excludes countries the 10 countries that fall under the small island exception, p lus the Solomon
Islands.
2010 2025
Number of IDA-Eligible Countries* 68 31
Total Population (millions) 2,820 997
% Sub-Saharan Africa 55% 81%
Population-Weighted 31% 65%
Fragile Status (% of Countries) 41% 58%
Population-Weighted 17% 38%
HIPC (% of Countries) 58% 84%
8
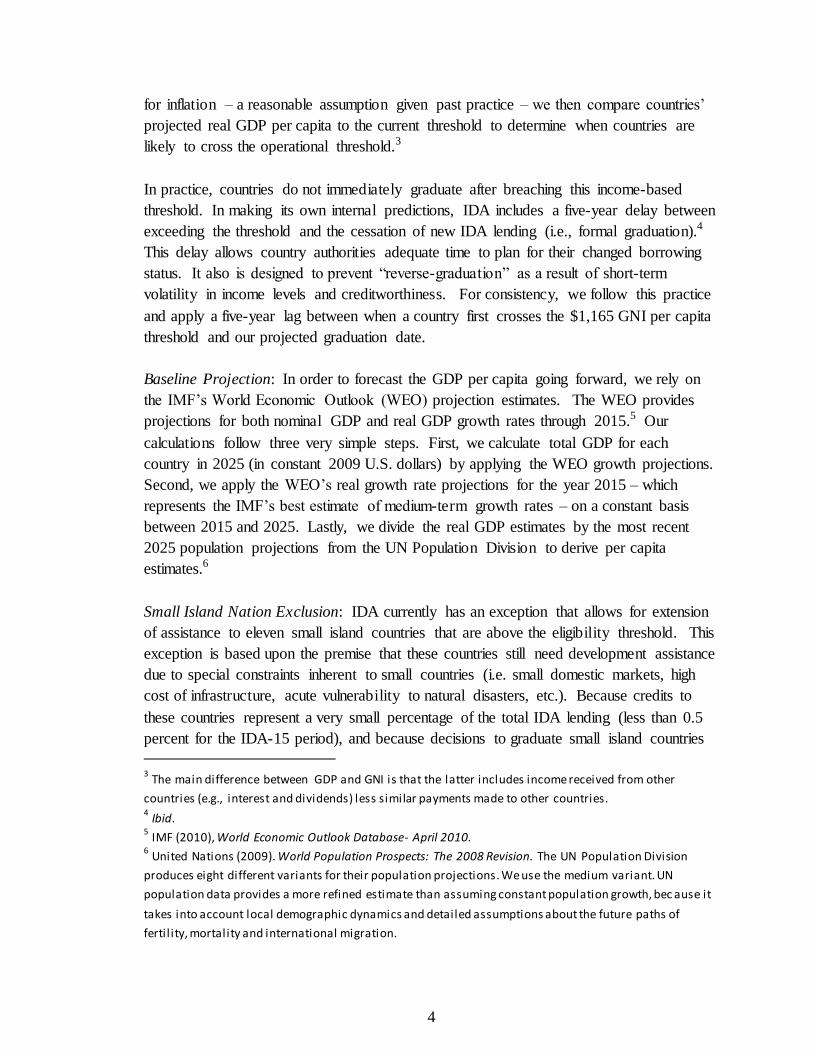
Table 3: Countries Remaining in IDA, 202514
14
* Zimbabwe may reengage with IDA during the IDA-16 period. ** Source: IMF (2010), World Economic
Outlook Database; United Nations (2009), World Population Prospects: The 2008 Revision. *** Source:
IDA (2010), IDA Performance Based Allocation System: Review of the Current System and Key Issue for
IDA16.
CountryGDP Per Capita
(2009)
Real GDP Growth
Rate 2015**
2025 GDP Per Capita
(in 2009 U.S. Dollars)
IDA-15 Allocation
(SDR millions)Notes ***
Somalia - - - - Fragile, Inactive
Myanmar - - - - Fragile, Inactive
Burundi 163 4.9 270 152 Fragile
Congo, Dem. Rep. 171 7.0 339 724 Post-conflict
Niger 371 4.0 411 224 -
Liberia 239 5.7 414 94 Post-conflict
Zimbabwe* 375 2.0 455 0 Fragile, Inactive
Guinea 414 3.9 529 66 Fragile
Malawi 328 7.1 561 288 -
Togo 422 4.3 565 81 Fragile
Ethiopia 390 7.7 634 1,562 -
Sierra Leone 311 6.5 652 46 Fragile
Madagascar 412 5.1 705 506 -
Chad 687 2.7 708 34 Fragile
Gambia, The 440 5.1 714 13 Fragile
Guinea-Bissau 513 4.7 761 12 Fragile
Central African Rep 447 5.5 783 25 Fragile
Nepal 452 4.8 801 427 -
Eritrea 363 3.7 858 43 Fragile
Burkina Faso 564 6.5 884 355 -
Mozambique 465 7.8 892 457 -
Timor-Leste 543 5.8 917 9 Fragile
Uganda 474 7.5 961 753 -
Tanzania 551 7.0 1007 1,205 -
Mali 656 4.4 1023 272 -
Rwanda 536 7.1 1052 250 -
Haiti 733 4.5 1053 52 Post-conflict
Afghanistan 486 7.1 1078 359 Post-conflict
Comoros 799 4.0 1157 6 Fragile
Benin 711 6.0 1236 141 -
Bangladesh 574 6.2 1274 2,563 -

9
Figure 2– IDA-Eligible Countries in 2009
Figure 3– IDA-Eligible Countries in 2025
Bubble size represents relative IDA 15 allocations
10
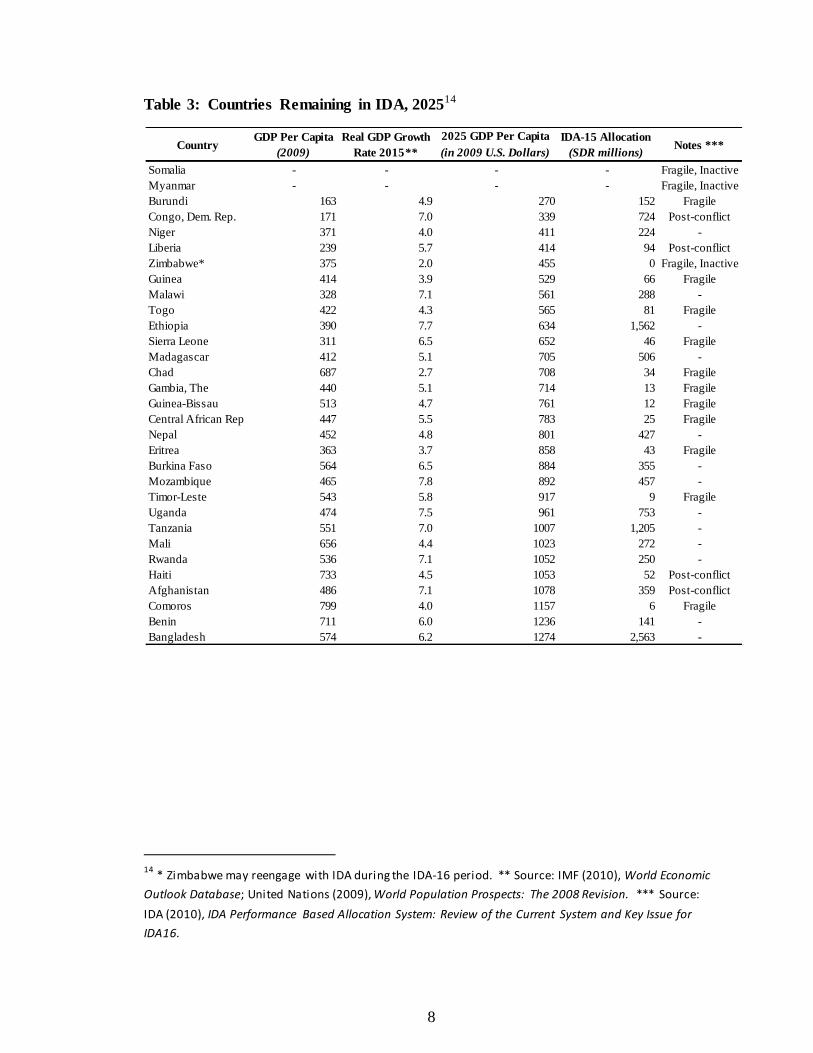
Three Alternative Scenarios: Predicting GDP growth rates fifteen years into the future is
a highly uncertain exercise. Ultimately, our projections depend upon the accuracy of
WEO forecasts. This is particularly problematic given a historical tendency by the IMF
to systematically over-project growth rates for low-income countries.15 For robustness
checks, we ran three additional scenarios with more conservative growth rates, including:
(1) cutting long-term growth rates (2015-2025) in half while maintaining near-term WEO
growth rate projections (2010-2014); (2) following Leo (2009), we subtract one
percentage point from all annual WEO growth projections for 2010-2025; and (3) use the
recent historical averages of the past 15 years (1995-2010) for each country to forecast
the next 15 (2011-2025). Even under these more conservative growth scenarios, the
overall country graduation findings do not change significantly. This is mainly because a
significant portion of IDA-eligible countries are already close to the income threshold.
Therefore, they will more than comfortably graduated from IDA by 2025 even with
modest growth rates. However, there are a few country graduation differences,
including:
Half WEO: Only two countries (Tajikistan and Senegal) would no longer
―graduate‖ before 2025 after allowing for the 5-year lag.16
WEO Minus One Percentage Point: Only Tajikistan no longer graduates.
Recent historical average. Only five countries (Cote d’Ivoire, Kenya, Lesotho,
Rwanda and Tajikistan) would no longer graduate by 2025. Together they
represent less than 6% of current IDA allocations.17
Pakistan: Pakistan is a close call under all alternative growth scenarios,
graduating in either 2025 or 2026.18
15
Benjamin Leo (2009), “Will World Bank and IMF Lending Lead to HIPC IV? Debt Déjà -Vu All Over Again,”
Center for Global Development Working Paper 193. 16
Ghana would not graduate under any of the alternative scenarios using the old GDP base. However, in
November 2010 Ghana completed a GDP rebasing exercise that increased estimates by 63 percent. This
places its GDP per capita just above the current IDA eligibility threshold in 2011. Although these new
estimates are not yet included in WEO data, Ghana’s IDA graduation is now highly l ikely within IDA-17 or
IDA-18 periods and a near certainty by 2025. 17
We recognize that growth rates have been highly unstable and therefore projections, even under
conservative scenarios, may prove optimistic, and indeed will no doubt prove so for certain countries. See
Will iam Easterly, Michael Kremer, Lant Pritchett, and Lawrence Summers (1993), "Good policy or good
luck? Country growth performance and temporary shocks," Journal of Monetary Economics.
11
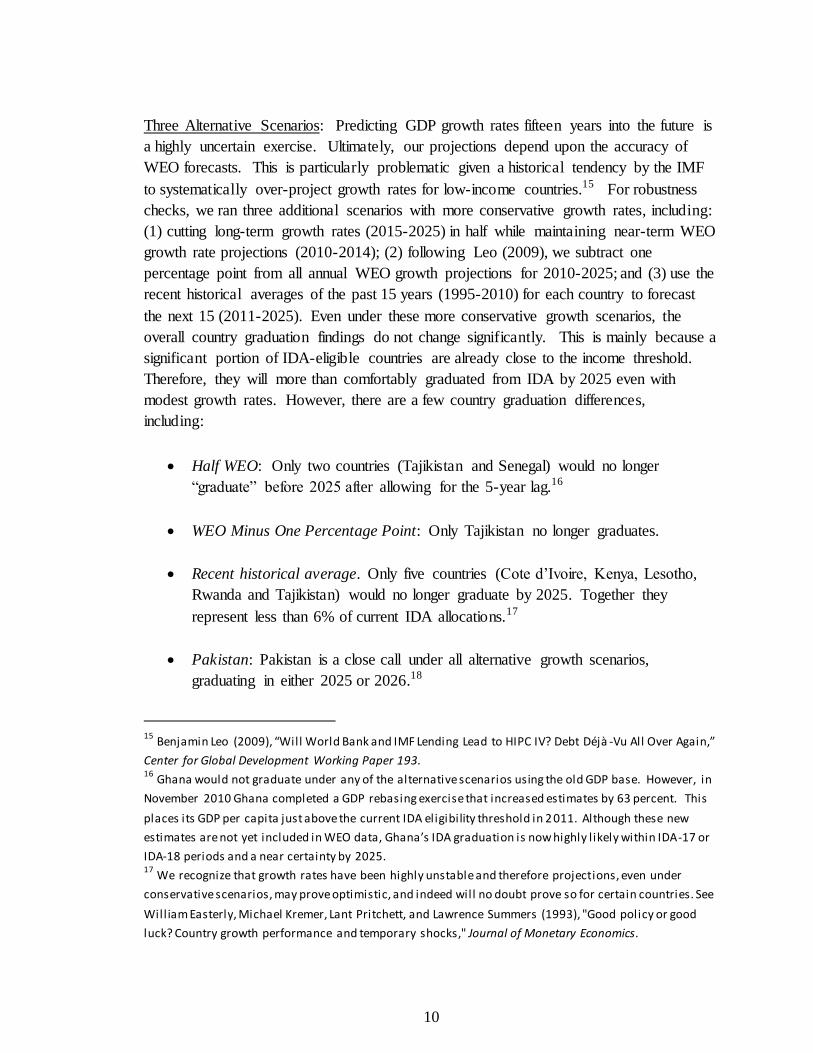
Note on Shocks and Reverse Graduation: Our analysis makes an additional simplifying
assumption that countries will not fall into conflict or experience a significant economic
shock – either of which would impact growth rates, IDA graduation prospects, and the
possibility of ―reverse graduation‖. Historically, eight out of IDA’s 35 previous
graduates eventually reverse graduated. This would suggest that countries face a roughly
one-quarter chance of falling back over time. Thus, it seems reasonable to assume that
several countries projected to graduate by 2025 will experience some type of shock that
prevents them from doing so. However, most IDA-eligible countries are relatively small
in size and their failure to graduate would not have a significant impact on the resource
demand projections. Of the current IDA-eligible countries, only a major crisis in India,
Vietnam, Nigeria, or Pakistan would have a meaningful effect on IDA’s overall
operational and financial projections.
Table 4: Graduation Predictions, Selected Countries19
Graduation Predictions (with 5-year lag)
Country WEO Real GDP
growth rate 2015 WEO Baseline WEO-1 Half WEO
Bangladesh 6.2 2029 - -
Cambodia 6.8 2022 2022 2024
Cameroon 3.5 2016 2017 2016
Côte d'Ivoire 6.0 2019 2019 2019
Ghana 4.8 2022 2026 2029
India (B) 8.1 2016 2016 2016
Kenya 6.5 2020 2020 2020
Kyrgyz Rep. 3.4 2019 2018 2019
Laos 9.2 2020 2021 2020
Lesotho 12.6 2022 2023 2024
Mauritania 4.7 2018 2020 2018
Nicaragua 4.0 2021 2024 2021
Nigeria 6.0 2015 2015 2015
Pakistan (B) 6.0 2022 2025 2026
Papua New Guinea (B) 5.0 2019 2019 2019
Senegal 5.0 2021 2025 2027
Tajikistan 5.0 2023 2027 2029
Vietnam (B) 7.5 2016 2016 2016
Yemen, Rep. 4.6 2015 2015 2015
Zambia 6.5 2015 2015 2015
18
Under the WEO baseline scenario, Pakistan would cross the threshold in 2017 and thus “graduate” in
2022, ahead of the 2025 deadline. 19
Shading denotes that the country would not graduate under the respective alternative real GDP per
capita growth scenario. As per footnote 17 above, Ghana is l ikely to graduate in IDA 17 or 18.
12
Conclusion: Based on the above analysis, the composition of IDA’s client base will
change dramatically over the next 15 years. The vast majority of its clients will be in
Africa, and the majority either will be considered fragile states or newly emerged from
fragility. Importantly, these projections are not dependent on rosy growth scenarios, but
remain likely even under more conservative assumptions.
III. IMPLICATIONS FOR IDA AND ITS SHAREHOLDERS
A. OPERATIONAL IMPLICATIONS
Such a dramatic shift in IDA’s client base has serious implications for the institution’s
future and how the World Bank operates overall. Two operational implications come
immediately to mind: (1) the fragile states conundrum; and (2) division of labor with the
African Development Bank (AfDB).
Grappling with the Fragile States Conundrum: Although some of the remaining IDA
countries will likely improve performance over time, it seems probable that the average
country performance level will drop. The current IDA model is to focus on high-
performing countries and also to have special side facilities for post-conflict, poorly-
performing, or fragile states. This dynamic may reverse by 2025, with fragile states
forming the majority of IDA’s client base in terms of total countries. This may raise
alarm bells since the World Bank has long identified the difficulties of working and
staffing in fragile states. To date, it has made little progress in meeting these challenges.
The World Bank’s own evaluation group noted that efforts in fragile states was focused
on areas of ―traditional weakness‖, showed a lack of selectivity, and have not yet
overcome human resource problems.20
Thus, the IDA of 2025 will face serious hurdles in terms of its strategic model, use of
performance incentives, and staffing. For instance, Gelb (2011) suggests that the current
performance based-allocation system does not create sufficient incentives for either staff
or recipient country officials in countries with IRAI scores below 3.25 due to time lags
and other factors.21 He suggests that IDA should augment its performance-based
allocation system with a short-term feedback portfolio score to enable quicker response to
successful projects and to shut down failing ones. This problem is no longer a marginal
and lagging side business, but rather becomes almost the raison d’être of IDA.
20
Independent Evaluation Group (2007), Engaging with Fragile States: An IEG Review of World Bank
Support to Low-Income Countries under Stress. 21
Alan Gelb (2010), “How Can Donors Create Incentives for Results and Flexibil ity for Fragile States? A
Proposal for IDA,” Center for Global Development Working Paper 227.

13
Rationalizing the Relationship with the African Development Bank: Currently, the
justification for having both a World Bank and an African Development Bank is that they
each bring special strengths. IDA is a global institution, while the African Development
Fund (AfDF) is able, as an African institution, to bring regional expertise. But in a world
where IDA is overwhelmingly African, this distinction begins to disappear. The old
model of cooperation where the AfDF simply co-financed IDA-prepared projects is
already dying. The AfDB has focused its portfolio on infrastructure and deliberately
withdrawn from sectors, such as health and education, where it is not perceived to have a
comparative advantage. In this context, IDA will need to pursue two objectives:
(1) A clearer division of labor with its sister AfDF by focusing on its core
competencies and withdrawing from sectors where others have the lead. Without
prejudging this outcome, one illustrative example could be that the AfDF would
assume the lead on infrastructure and private sector development while IDA
would focus on financial management and the social sectors.
(2) A new way of collaborating. At the strategic and operational levels, IDA must
find a way of working more closely with the AfDF in a regular and coordinated
manner rather than ad hoc arrangements.
B. FINANCIAL IMPLICATIONS
The projected evolution of IDA’s client base over time will raise a number of financial
considerations both for the institution’s management and its donor country shareholders.
For example, does it make sense for countries like Ethiopia or Tanzania to receive
billions of dollars every year from IDA? If yes, then should donor governments consider
reducing bilateral and other multilateral engagements (i.e., letting IDA own these
countries)? If not, then should donor governments scale back their replenishment
contribution levels over time with the declining pool of IDA-eligible countries? Also,
does ensuring full financing for the Multilateral Debt Relief Initiative (MDRI) really
remain important anymore?
Before turning to these strategic issues, we first briefly forecast IDA’s future lending
capacity based upon a variety of input variables – including: donor contributions, credit
reflows, IBRD and IFC net income transfers, and income generated from IDA’s
substantial liquidity.
Baseline Financial Scenario: The baseline scenario draws upon the respective input
variables and assumptions included in the World Bank’s recent IDA-16 replenishment
14
paper (see appendix II for details).22 This entails an increase of IDA’s commitment
capacity of roughly 2.7 percent per annum between 2011 and 2028. Under this scenario,
IDA would have an estimated commitment capacity of roughly $49 billion in real terms
during the IDA-21 replenishment period (approximately $67 billion in nominal terms).
Illustrative Performance-Based Country Allocations: Next, we estimate country-by-
country allocations for the IDA-21 period utilizing a scaled-down performance-based
allocation (PBA) system (see appendix III for details). For the sake of simplicity, we
remove the existing PBA exceptions – such as, exceptional allocations for post-conflict
and reengaging countries, grant volume discounts, and MDRI netting out requirements.23
In addition, we utilize a second simplifying assumption – that countries’ performance
rating scores in 2009 will remain constant over the subsequent time period.24 On
average, country ratings tend to fluctuate modestly in the near-term, but may change by a
significant amount over time.25 Given this, we would expect to see material differences
in respective countries’ performance ratings between 2009 and 2025. As such, our PBA
allocation estimates should be viewed as purely illustrative.
Despite the methodological simplifications, this exercise highlights overall assistance
volume trends. Given IDA’s projected commitment capacity, eligible countries could
receive roughly $17 per capita annually (in real terms) during the IDA-21 period. This is
22
IDA (2010), A Review of IDA’s Long Term Financial Capacity and Financial Instruments. See
www.worldbank.org/ida . While every effort is made to ensure consistency with IDA’s internal model, we
have not incorporated IDA’s existing usage of advance commitment authority. This authority allows IDA
to provide programmatic commitments in the near term, which are backed by resources received over
the life of the specific project or program (i.e., repayments from other IDA loans). In contrast, our analysis
follows a pure cash flow model. Among other things, this methodological difference impacts IDA’s
projected liquidity and, by extension, the income generated off these resources. IDA invests
approximately 60 percent of its l iquid assets in bond instruments, such as U.S. Treasuri es. Historically, it
has earned a 5 percent annualized return on these investments. Source: Ibid., p. 5. 23
Under IDA’s existing PBA system, countries may receive significantly larger assistance allocations if they
as categorized as “post-conflict” or “reengaging”. For additional details on these exceptions, see
Benjamin Leo (2010), “Inside the World Bank's Black Box Allocation System: How Well Does IDA Allocate
Resources to the Neediest and Most Vulnerable Countries?” Center for Global Development Working
Paper 216. We exclude these PBA exceptions for several reasons – ranging from methodological
simplicity to the difficulty in projecting which countries (if any) would be classified as “post-conflict” or
“reengaging” in 2025. The same reasoning applies to IDA’s grant volume reduction. 24
While we do not attempt to project countries’ future performance ratings, we do util ize population
projections for 2025 from the United Nations. See United Nations (2009), World Population Prospects:
The 2008 Revision. 25
Alan Gelb (2010), “How Can Donors Create Incentives for Results and Flexibil ity for Fragile States? A
Proposal for IDA,” Center for Global Development Working Paper 227.

15
roughly twice the level that IDA actually committed to these countries in per capita terms
between 2007 and 2009.26 Several individual country cases are particularly striking –
both in terms of the sheer volume of projected IDA assistance and the relative increase
over current levels (see appendix IV for additional details).
Bangladesh could receive well over $3 billion annually in real terms during the
IDA-21 period – more than three times the average IDA commitment level
between 2007 and 2009. Moreover, this would exceed what Bangladesh received
from all OECD-DAC reporting donor organizations combined in 2009.27
Burkina Faso could receive nearly $1 billion annually during the IDA-21 period –
roughly four times the average IDA commitment level between 2007 and 2009.
Ethiopia could receive almost $2.5 billion annually – more than twice the size of
average IDA commitments in recent years.
Niger could receive $500 million per year – greater than what it received from all
OECD-DAC reporting organizations combined in 2009.
Table 5: Indicative IDA-21 Allocations, Ten Largest Country Recipients28
Source: World Bank , OECD-DAC, and authors calculations
26
Source: OECD.Stat 27
This includes nearly 60 bilateral and multilateral donor organizations. The respective figures include
gross IDA commitments in 2009 for comparison purposes. 28
Projected IDA-21 assistance envelopes are rounded to the nearest $100 mill ion. The percentage change
figures compare the estimated IDA-21 envelopes to total IDA commitments provided between 2007 and
2009 (in current U.S. dollars).
Largest IDA Recipients IDA21 Volume (real terms) % of IDA-21 Total Envelope % Change vs 2007-2009
Bangladesh $9,800 20% 423%
Ethiopia $7,400 15% 247%
Tanzania $6,300 13% 328%
Uganda $4,200 9% 291%
Burkina Faso $2,800 6% 436%
Mozambique $2,600 5% 409%
Nepal $1,800 4% 233%
Madagascar $1,800 4% 574%
Malawi $1,600 3% 522%
Niger $1,500 3% 578%
Mali $1,500 3% 271%
TOTAL $41,300 86% -
16
Given the sheer volumes of projected IDA assistance, World Bank management and
donor governments should begin considering a range of financial options – such as those
listed above. Should donor governments seek to maintain constant assistance volumes in
real per capita terms for the overall pool of countries that remain IDA-eligible (i.e.,
decrease contributions commensurate with country graduation trends)? If not, then
should they consider reducing bilateral and other multilateral engagements (i.e., letting
IDA own these countries)? Alternatively, should IDA donors relax their financing
commitments for offsetting the cost of foregone repayments associated with HIPC/MDRI
debt relief or IDA grants over time?
Constant Real Per Capita Assistance Volumes: Under this approach, donor governments
would adjust their so-called regular replenishment commitments29 to ensure that recipient
countries, on average, receive constant IDA assistance volumes.30 For the IDA-21
period, this could mean reducing the overall replenishment envelope by more than one-
half compared to the baseline financial scenario – thereby ensuring that countries would
still receive roughly $8 per capita annually in real terms (versus $17 per capita
annually).31 Strikingly, this would mean that donors could almost cease to provide
regular contributions during the IDA-21 period. However, they would need to continue
to offset the foregone revenue associated with the provision of debt relief and grants (see
Figure 4).
Debt Relief and Grant Financing Considerations: According to IDA, foregone revenues
associated with HIPC and MDRI debt relief and grant financing will total nearly $10
billion (nominal terms) during the IDA-21 period.32 Given the reduced demand for IDA
assistance following country graduations, donor governments could decide to halt
compensatory contributions that offset this impact during the IDA-21 period (or even
before). Assuming IDA management’s other baseline assumptions, then recipient
countries still would receive real assistance volumes of roughly $15 per capita annually.33
As such, donor governments also could reduce their regular contributions while still
delivering massive increases for recipient countries.
29
Per IDA operational practices, regular donor contributions exclude additional financial commitments to
offset the foregone revenue associated with the provision of debt relief a nd grants. 30
In practice, this is a very conservative assumption since several countries currently receive exceptional
post-conflict or reengaging country allocations – which would expire prior to the IDA-21 period. 31
According to our i l lustrative estimates, the IDA-21 envelope would decline from $67 bil l ion in nominal
terms ($49 bil l ion in real terms) to roughly $20 bil l ion in nominal terms (nearly $15 bil l ion in real terms). 32
See IDA (2010), Debt Relief Provided by IDA under the MDRI and HIPC Initiative: Update on Costs and
Donor Financing as of June 30, 2010. 33
Most importantly, that regular donor contributions would increase by 2 percent per year.

17
Figure 4: Projected IDA Donor Contributions Required to Maintain Per Capita
Allocations in Real Terms, by Replenishment Period
Note – Green bars indicate projected donor contributions (both regular and
compensatory) required to maintain annual per capita allocation constant, on average, for
IDA recipient countries. Yellow bars indicate the projected ―savings‖ compared to IDA
management’s financial baseline scenario.
IV. CONCLUSION: OPTIONS FOR IDA GOING FORWARD
Given the operational and financial implications outlined above, this leaves IDA with
three broad options:
(1) Stay the Course and Hope for the Best: IDA could maintain its current allocation
system and continue to argue every three years for replenishments at the current
(or even higher) levels. This would entail justifying significant increases in
country allocations, and defending requests for shareholder contributions against
other development spending options. This option would assume that: (a) the
donor shareholders continue to view IDA as a central and effective mechanism;
(b) that IDA’s country-based allocation model remains the optimal approach to

18
promoting development and fighting poverty; and (c) that increased spending per
country is justified.
(2) Declare Success and Shrink Over Time: Another option is to simply scale IDA
down to meet the needs and size of the smaller client base. If IDA flows were
held constant real per capita terms, then IDA-21 may in fact be the last
replenishment for regular donor contributions. The shareholders, after 65 years of
subsidizing IDA (and many wondering when it all ends) would have an end date
for new contributions and also be able to maintain financing at the current levels.
In pursuing this approach, shareholders might even be able to reclaim depreciated
dividends starting in subsequent periods.
(3) Launch A New Regional/Global Public Goods Window within IDA: A third
option is for IDA to complement – or even replace – its country-based lending
model with a wholly different approach for funding global public goods (GPGs).
The potential arguments in favor of this model are compelling since the number
of low-income countries is rapidly declining and many of the great remaining
challenges – energy, technology, regional infrastructure, agricultural research, and
vaccines – are beyond any single country investment strategy. Moreover, these
important development issues traditionally have been underfunded.34 The
challenge of finding a performance-compatible allocation strategy for GPGs is
significant, but there is time to conceive of new models. In fact, the launching of
a special GPG window may provide an opportunity to update IDA’s governance
structure and draw in some of the recent graduates as active contributors.35
34
Nancy Birdsall (2004), “Underfunded Regionalism in the Developing World,” Center for Global
Development Working Paper Number 49; Nancy Birdsall and Arvind Subramanian (2007), “From World
Bank to World Development Cooperative,” Center for Global Development Essay; Michael Kremer (2006),
“The Missing Mandate: Global Public Goods,” in Nancy Birdsall, ed., Rescuing the World Bank: A CGD
Working Group Report and Selected Essays. 35
See Nancy Birdsall and Kapur (2005) Hardest Job in the World: Five Crucial Tasks for the next president
of the World Bank.
19
BIBLIOGRAPHY
Birdsall, Nancy. 2004. ―Underfunded Regionalism in the Developing World.‖ Center for
Global Development Working Paper Number 49.
Birdsall, Nancy, and Arvind Subramanian. 2007. ―From World Bank to World
Development Cooperative.‖ Center for Global Development Essay.
Birdsall, Nancy, and Devesh Kapur. 2005. Hardest Job in the World: Five Crucial Tasks
for the next president of the World Bank. Washington DC: Center for Global
Development.
Gelb, Alan. 2010. “How Can Donors Create Incentives for Results and Flexibility for
Fragile States? A Proposal for IDA.‖ Center for Global Development Working
Paper 227.
International Development Association. 2010. ―A review of IDA’s Long Term Fiscal
Capacity, and Financial Instruments.‖ http://go.worldbank.org/O5NIRLMEE0.
_____. 2010. Debt Relief Provided by IDA under the MDRI and HIPC Initiative: Update
on Costs and Donor Financing as of June 30, 2010.
http://go.worldbank.org/O5NIRLMEE0.
_____. 2010. IDA’s Performance Based Allocation System: Review of the Current System
and Key Issues for 2010. . http://go.worldbank.org/O5NIRLMEE0
International Monetary Fund. 2010-4. World Economic Outlook Database: April 2010.
http://www.imf.org/external/ns/cs.aspx?id=28.
Independent Evaluation Group. 2007. ―Engaging with Fragile States: An IEG Review of
World Bank Support to Low-Income Countries Under Stress,‖ World Bank.
Leo, Benjamin. 2009. ―Will World Bank and IMF Lending Lead to HIPC IV? Debt Déjà-
Vu All Over Again.‖ Center for Global Development Working Paper 193.
_____. 2010. ―Inside the World Bank's Black Box Allocation System: How Well Does
IDA Allocate Resources to the Neediest and Most Vulnerable Countries?‖ Center
for Global Development Working Paper 216.
Kremer, Michael. 2006. ―The Missing Mandate: Global Public Goods,‖ in Nancy
Birdsall, ed., Rescuing the World Bank: A CGD Working Group Report and
Selected Essays. Washington DC: Center for Global Development.
United Nations, Department of Economic and Social Affairs. 2009. World Populations
Prospects: 2008 Revision, Vol. 1 Comprehensive Tables. New York: United
Nations Publication.

20
APPENDIX I: HISTORICAL GRADUATIONS AND REVERSE GRADUATIONS FROM IDA36
Country Last IDA credit Reverse Graduation Notes
Albania FY08
Botswana FY74 -
Cameroon FY81 FY94
Chile FY61 -
China FY99 -
Colombia FY62 -
Congo FY82 FY94
Costa Rica FY62 -
Cote d'Ivoire FY73 FY92
Dominican
Republic
FY73 -
Ecuador FY74 -
Eq. Guinea FY93 - Remained IDA-eligible until FY99.
Egypt FY81; FY99 (FY91) Graduated again in FY99.
El Salvador FY77 -
Honduras FY80 FY91
Indonesia FY80-FY08 FY99 Re-entered on 11/03/98. Graduated again
in FY08.
Jordan FY78 -
Korea FY73 -
Mauritius FY75 -
Macedonia, FYR FY02 - Graduated from IDA as of June 30,
2001. Last IDA credit in FY02.
Montenegro FY08 Graduated from IDA as of July 6, 2007.
Last IDA credit in FY08.
Morocco FY75 -
Nicaragua FY81 FY91
Nigeria FY65 FY89
PNG FY83 FY03 Became blend in FY03.
Paraguay FY77 -
Philippines FY79; FY93 (FY91) Graduated again in FY93.
Serbia FY07
St. Kitts FY94 -
Swaziland FY75 -
Syria FY74 -
Thailand FY79 -
Tunisia FY77 -
Turkey FY73 -
Zimbabwe FY83 FY92
IDA Graduates Between Fiscal Years 1961-2010 = 35
IDA Net Reverse Graduates = 8
Total Net IDA Graduates = 27
36
World Bank (2010), “List of IDA Graduates.” See www.worldbank.org/ida/.

21
APPENDIX II: IDA FINANCIAL CAPACITY PROJECTIONS: BASELINE ASSUMPTIONS
Regular Donor Contributions 2 percent annual increase from the level committed for the IDA-16 replenishment.
Debt Relief CostsAdditional donor contributions on a pay-as-you-go basis to cover all foregone
credit reflows associated with HIPC and MDRI debt relief.
IDA Grant Costs
Additional donor contributions on a pay-as-you-go basis to offset foregone loan
principal repayments. Foregone loan charge income is financed through volume
discounts on IDA grants.
IDA Grant Share Constant at 20 percent of total IDA commitments.
Non-Accruals Remain stable at 5 percent of IDA's total credit portfolio.
Loan ChargesFixed service charge of 75 basis points; commitment charge reset annually
between 0 and 50 basis points as required to cover any annual income gap.
Administrative Expenses Flat in real terms, in line with IBRD corporate assumptions.
IBRD/IFC Transfers Constant at $3.9 billion per replenishment period ($1.3 billion annually).
Inflation Constant at 2 percent per annum.

22
APPENDIX III: SIMPLIFIED IDA PERFORMANCE-BASED ALLOCATION
METHODOLOGY
Country Performance Rating (Step #1): The country performance rating is based upon
two sub-components – Country Policy and Institutional Assessment (CPIA) ratings and
IDA project/program portfolio quality ratings. The CPIA assesses each IDA-eligible
country’s performance according to 16 policy and institutional quality criteria.37 These
criteria are grouped into four equally weighted clusters: (A) economic management; (B)
structural policies; (C) policies for social inclusion and equity; and (D) public sector
management and institutions (commonly referred to as the ―governance cluster‖). World
Bank country staff collects this information through an annual questionnaire.38 Second,
IDA staff utilizes the World Bank’s Annual Report on Portfolio Performance (ARPP) to
determine each country’s quality and management of IDA projects and programs.
Country Performance Rating = [0.24 * (Average Score of CPIA Clusters A-C)] + [0.68 *
CPIA Cluster D] + [0.08 * Portfolio Quality]
Country Allocation Score (Step #2): IDA utilizes exponents to apply relative weightings
to each of the three variables in the PBA formula. The country performance rating
currently has an exponent of 5.0 and the population variable has an exponent of 1.0.
Lastly, IDA applies an exponent of -0.125 to the GNI per capita variable. This is
designed to modestly reduce IDA allocations for countries with relatively higher per
capita income levels. In doing so, the PBA has a methodological favoring toward
countries with greater needs (with income as a proxy measure).
IDA Country Allocation Scorei = (Country performance ratingi5.0
, Populationi1.0
,
GNI/capitai-0.125
)
Relative Country Allocation Share (Step #3): IDA then determines the relative allocation
share for each country. The relative share is calculated by dividing each country’s IDA
allocation score by the total allocation score of all eligible countries.
37
Country performance for each CPIA criteria is rated between 1 (lowest) and 6 (highest). 38
To ensure CPIA rating consistency within and across regions, the World Bank extensively reviews and
vets CPIA assessments for 12 “benchmark” countries.
IDA Country Allocation Score i
∑ IDA Country Allocation ScoresRelative Country Allocation Share i =
23
Preliminary Country Allocation (Step #4): IDA arrives at each country’s preliminary
allocation by multiplying its relative share by the total available IDA replenishment
envelope.
IDA Country Allocationi = Country Allocation Relative Sharei * IDA Replenishment
Envelope
24
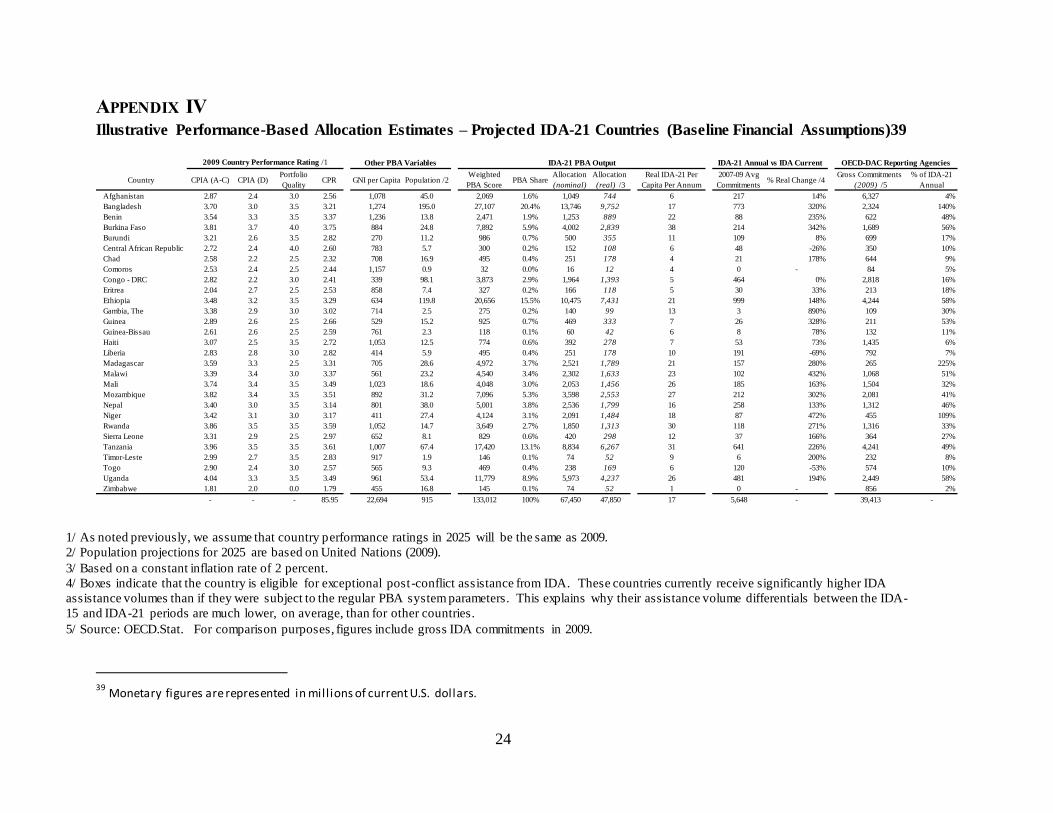
APPENDIX IV Illustrative Performance-Based Allocation Estimates – Projected IDA-21 Countries (Baseline Financial Assumptions)39
1/ As noted previously, we assume that country performance ratings in 2025 will be the same as 2009.
2/ Population projections for 2025 are based on United Nations (2009).
3/ Based on a constant inflation rate of 2 percent.
4/ Boxes indicate that the country is eligible for exceptional post-conflict assistance from IDA. These countries currently receive significantly higher IDA
assistance volumes than if they were subject to the regular PBA system parameters. This explains why their assistance volume differentials between the IDA-
15 and IDA-21 periods are much lower, on average, than for other countries.
5/ Source: OECD.Stat. For comparison purposes, figures include gross IDA commitments in 2009.
39
Monetary figures are represented in mill ions of current U.S. dollars.
Country CPIA (A-C) CPIA (D)Portfolio
QualityCPR GNI per Capita Population /2
Weighted
PBA ScorePBA Share
Allocation
(nominal)
Allocation
(real) /3
Real IDA-21 Per
Capita Per Annum
2007-09 Avg
Commitments% Real Change /4
Gross Commitments
(2009) /5
% of IDA-21
Annual
Afghanistan 2.87 2.4 3.0 2.56 1,078 45.0 2,069 1.6% 1,049 744 6 217 14% 6,327 4%
Bangladesh 3.70 3.0 3.5 3.21 1,274 195.0 27,107 20.4% 13,746 9,752 17 773 320% 2,324 140%
Benin 3.54 3.3 3.5 3.37 1,236 13.8 2,471 1.9% 1,253 889 22 88 235% 622 48%
Burkina Faso 3.81 3.7 4.0 3.75 884 24.8 7,892 5.9% 4,002 2,839 38 214 342% 1,689 56%
Burundi 3.21 2.6 3.5 2.82 270 11.2 986 0.7% 500 355 11 109 8% 699 17%
Central African Republic 2.72 2.4 4.0 2.60 783 5.7 300 0.2% 152 108 6 48 -26% 350 10%
Chad 2.58 2.2 2.5 2.32 708 16.9 495 0.4% 251 178 4 21 178% 644 9%
Comoros 2.53 2.4 2.5 2.44 1,157 0.9 32 0.0% 16 12 4 0 - 84 5%
Congo - DRC 2.82 2.2 3.0 2.41 339 98.1 3,873 2.9% 1,964 1,393 5 464 0% 2,818 16%
Eritrea 2.04 2.7 2.5 2.53 858 7.4 327 0.2% 166 118 5 30 33% 213 18%
Ethiopia 3.48 3.2 3.5 3.29 634 119.8 20,656 15.5% 10,475 7,431 21 999 148% 4,244 58%
Gambia, The 3.38 2.9 3.0 3.02 714 2.5 275 0.2% 140 99 13 3 890% 109 30%
Guinea 2.89 2.6 2.5 2.66 529 15.2 925 0.7% 469 333 7 26 328% 211 53%
Guinea-Bissau 2.61 2.6 2.5 2.59 761 2.3 118 0.1% 60 42 6 8 78% 132 11%
Haiti 3.07 2.5 3.5 2.72 1,053 12.5 774 0.6% 392 278 7 53 73% 1,435 6%
Liberia 2.83 2.8 3.0 2.82 414 5.9 495 0.4% 251 178 10 191 -69% 792 7%
Madagascar 3.59 3.3 2.5 3.31 705 28.6 4,972 3.7% 2,521 1,789 21 157 280% 265 225%
Malawi 3.39 3.4 3.0 3.37 561 23.2 4,540 3.4% 2,302 1,633 23 102 432% 1,068 51%
Mali 3.74 3.4 3.5 3.49 1,023 18.6 4,048 3.0% 2,053 1,456 26 185 163% 1,504 32%
Mozambique 3.82 3.4 3.5 3.51 892 31.2 7,096 5.3% 3,598 2,553 27 212 302% 2,081 41%
Nepal 3.40 3.0 3.5 3.14 801 38.0 5,001 3.8% 2,536 1,799 16 258 133% 1,312 46%
Niger 3.42 3.1 3.0 3.17 411 27.4 4,124 3.1% 2,091 1,484 18 87 472% 455 109%
Rwanda 3.86 3.5 3.5 3.59 1,052 14.7 3,649 2.7% 1,850 1,313 30 118 271% 1,316 33%
Sierra Leone 3.31 2.9 2.5 2.97 652 8.1 829 0.6% 420 298 12 37 166% 364 27%
Tanzania 3.96 3.5 3.5 3.61 1,007 67.4 17,420 13.1% 8,834 6,267 31 641 226% 4,241 49%
Timor-Leste 2.99 2.7 3.5 2.83 917 1.9 146 0.1% 74 52 9 6 200% 232 8%
Togo 2.90 2.4 3.0 2.57 565 9.3 469 0.4% 238 169 6 120 -53% 574 10%
Uganda 4.04 3.3 3.5 3.49 961 53.4 11,779 8.9% 5,973 4,237 26 481 194% 2,449 58%
Zimbabwe 1.81 2.0 0.0 1.79 455 16.8 145 0.1% 74 52 1 0 - 856 2%
- - - 85.95 22,694 915 133,012 100% 67,450 47,850 17 5,648 - 39,413 -
OECD-DAC Reporting AgenciesIDA-21 PBA Output IDA-21 Annual vs IDA Current2009 Country Performance Rating /1 Other PBA Variables

25
Illustrative Performance-Based Allocation Estimates – Projected IDA-21 Countries (Donor Contribution Growth of 15
Percent)40
1/ As noted previously, we assume that country performance ratings in 2025 will be the same as 2009.
2/ Population projections for 2025 are based on United Nations (2009).
3/ Based on a constant inflation rate of 2 percent.
4/ Boxes indicate that the country is eligible for exceptional post-conflict assistance from IDA. These countries currently receive significantly higher IDA
assistance volumes than if they were subject to the regular PBA system parameters. This explains why their a ssistance volume differentials between the IDA-
15 and IDA-21 periods are much lower, on average, than for other countries.
5/ Source: OECD.Stat. For comparison purposes, figures include gross IDA commitments in 2009.
40
On average, donor contributions grew by more than 15 percent annualized between 2000 and 2010. Applying this growth going fo rward would
mean a total IDA-21 envelope of nearly $180 bil l ion (in real terms).
Country CPIA (A-C) CPIA (D)Portfolio
QualityCPR GNI per Capita Population /2
Weighted
PBA ScorePBA Share
Allocation
(nominal)
Allocation
(real) /3
Real IDA-21 Per
Capita Per Annum
2007-09 Avg
Commitments% Real Change /4
Gross Commitments
(2009) /5
% of IDA-21
Annual
Afghanistan 2.87 2.4 3.0 2.56 1,078 45.0 2,069 1.6% 3,742 2,655 20 217 308% 6,327 14%
Bangladesh 3.70 3.0 3.5 3.21 1,274 195.0 27,107 20.4% 49,029 34,782 59 773 1400% 2,324 499%
Benin 3.54 3.3 3.5 3.37 1,236 13.8 2,471 1.9% 4,469 3,170 77 88 1096% 622 170%
Burkina Faso 3.81 3.7 4.0 3.75 884 24.8 7,892 5.9% 14,274 10,126 136 214 1478% 1,689 200%
Burundi 3.21 2.6 3.5 2.82 270 11.2 986 0.7% 1,783 1,265 38 109 287% 699 60%
Central African Republic 2.72 2.4 4.0 2.60 783 5.7 300 0.2% 542 384 22 48 164% 350 37%
Chad 2.58 2.2 2.5 2.32 708 16.9 495 0.4% 896 635 13 21 891% 644 33%
Comoros 2.53 2.4 2.5 2.44 1,157 0.9 32 0.0% 59 42 15 0 - 84 17%
Congo - DRC 2.82 2.2 3.0 2.41 339 98.1 3,873 2.9% 7,006 4,970 17 464 257% 2,818 59%
Eritrea 2.04 2.7 2.5 2.53 858 7.4 327 0.2% 592 420 19 30 374% 213 66%
Ethiopia 3.48 3.2 3.5 3.29 634 119.8 20,656 15.5% 37,360 26,504 74 999 785% 4,244 208%
Gambia, The 3.38 2.9 3.0 3.02 714 2.5 275 0.2% 498 353 48 3 3432% 109 108%
Guinea 2.89 2.6 2.5 2.66 529 15.2 925 0.7% 1,672 1,186 26 26 1426% 211 187%
Guinea-Bissau 2.61 2.6 2.5 2.59 761 2.3 118 0.1% 213 151 22 8 535% 132 38%
Haiti 3.07 2.5 3.5 2.72 1,053 12.5 774 0.6% 1,399 993 27 53 519% 1,435 23%
Liberia 2.83 2.8 3.0 2.82 414 5.9 495 0.4% 895 635 36 191 11% 792 27%
Madagascar 3.59 3.3 2.5 3.31 705 28.6 4,972 3.7% 8,993 6,379 74 157 1256% 265 802%
Malawi 3.39 3.4 3.0 3.37 561 23.2 4,540 3.4% 8,212 5,826 84 102 1799% 1,068 182%
Mali 3.74 3.4 3.5 3.49 1,023 18.6 4,048 3.0% 7,321 5,194 93 185 838% 1,504 115%
Mozambique 3.82 3.4 3.5 3.51 892 31.2 7,096 5.3% 12,834 9,105 97 212 1333% 2,081 146%
Nepal 3.40 3.0 3.5 3.14 801 38.0 5,001 3.8% 9,045 6,417 56 258 730% 1,312 163%
Niger 3.42 3.1 3.0 3.17 411 27.4 4,124 3.1% 7,459 5,291 64 87 1939% 455 388%
Rwanda 3.86 3.5 3.5 3.59 1,052 14.7 3,649 2.7% 6,600 4,682 106 118 1223% 1,316 119%
Sierra Leone 3.31 2.9 2.5 2.97 652 8.1 829 0.6% 1,499 1,064 44 37 850% 364 97%
Tanzania 3.96 3.5 3.5 3.61 1,007 67.4 17,420 13.1% 31,507 22,352 111 641 1062% 4,241 176%
Timor-Leste 2.99 2.7 3.5 2.83 917 1.9 146 0.1% 263 187 33 6 971% 232 27%
Togo 2.90 2.4 3.0 2.57 565 9.3 469 0.4% 849 602 22 120 68% 574 35%
Uganda 4.04 3.3 3.5 3.49 961 53.4 11,779 8.9% 21,305 15,114 94 481 947% 2,449 206%
Zimbabwe 1.81 2.0 0.0 1.79 455 16.8 145 0.1% 263 186 4 0 - 856 7%
- - - 85.95 22,694 915 133,012 100% 240,578 170,670 62 5,648 - 39,413 -
OECD-DAC Reporting AgenciesIDA-21 PBA Output IDA-21 Annual vs IDA Current2009 Country Performance Rating /1 Other PBA Variables