ID Basics: Antibiotic Susceptibility Testing/Reporting ... · Antibiotic Susceptibility...
71
ID Basics: Antibiotic Susceptibility Testing/Reporting Antibiotic Pharmacodynamics Pharmacy Morning Report September 2016 Dimple Patel, Pharm.D., BCPS-AQ ID Clinical Pharmacist – Infectious Diseases
Transcript of ID Basics: Antibiotic Susceptibility Testing/Reporting ... · Antibiotic Susceptibility...

ID Basics:
Antibiotic Susceptibility Testing/Reporting
Antibiotic Pharmacodynamics
Pharmacy Morning Report
September 2016
Dimple Patel, Pharm.D., BCPS-AQ ID
Clinical Pharmacist – Infectious Diseases

Microbiology: Basics
Organism Identification
• Growth characteristics on selective media
o Shape, size, color, smell
• Gram stain – initial step in identification
o Gram-positive
» Thick peptidoglycan layer of cell
wall retains crystal violet stain
o Gram-negative
» Thin peptidoglycan layer of cell wall
does not retain stain –
counterstained with safranin to
characterize morphology
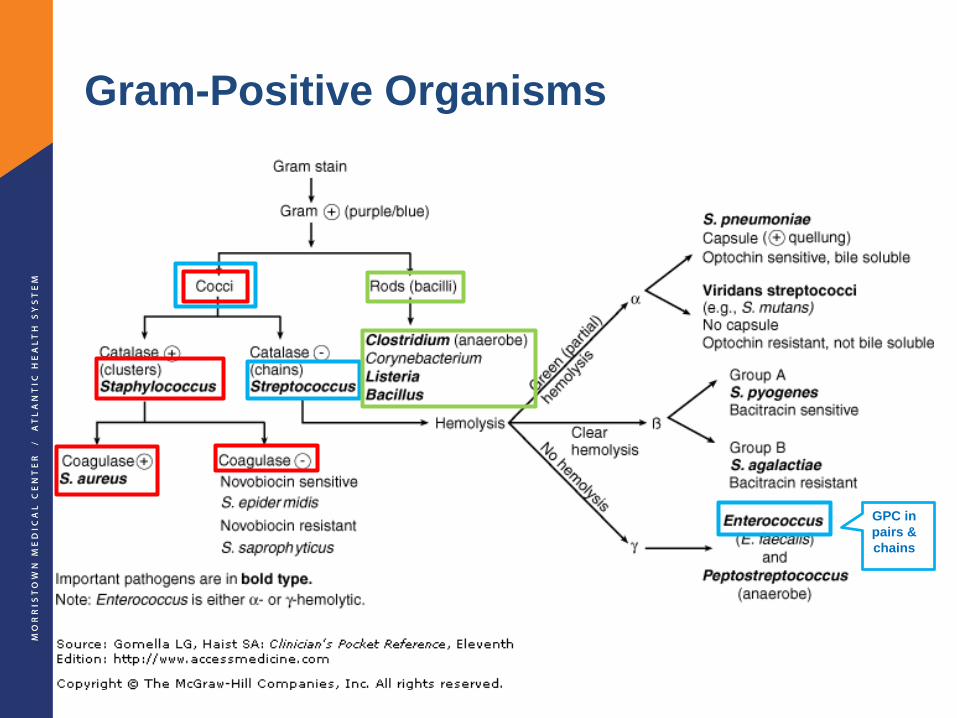
Gram-Positive Organisms
GPC in
pairs &
chains

Gram-Negative Organisms
Acinetobacter
StenotrophomonasMay look like cocco-bacilli
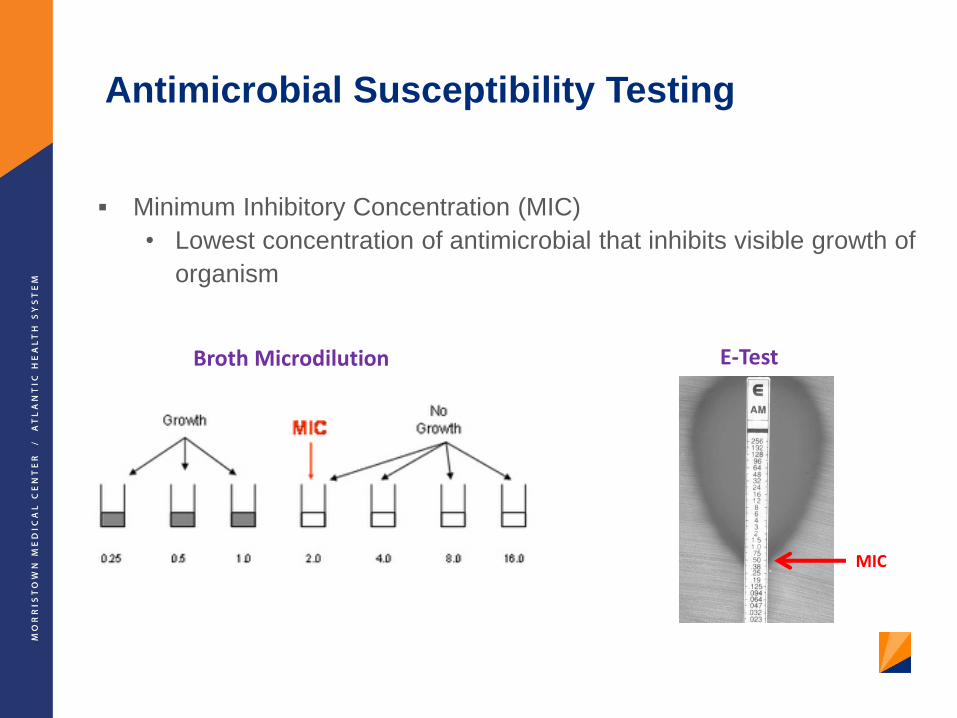
Antimicrobial Susceptibility Testing
Minimum Inhibitory Concentration (MIC)
• Lowest concentration of antimicrobial that inhibits visible growth of
organism
Broth Microdilution E-Test
MIC

Clinical Microbiology Labs
Automated Susceptibility Testing devices
• Perform organism identification and antibiotic susceptibility testing
for many antibiotics in 1 step

MALDI-TOF
Matrix-assisted laser desorption ionization – time of flight mass
spectrometry
7Patel R. Clin Infect Dis 2013;57:564-72.
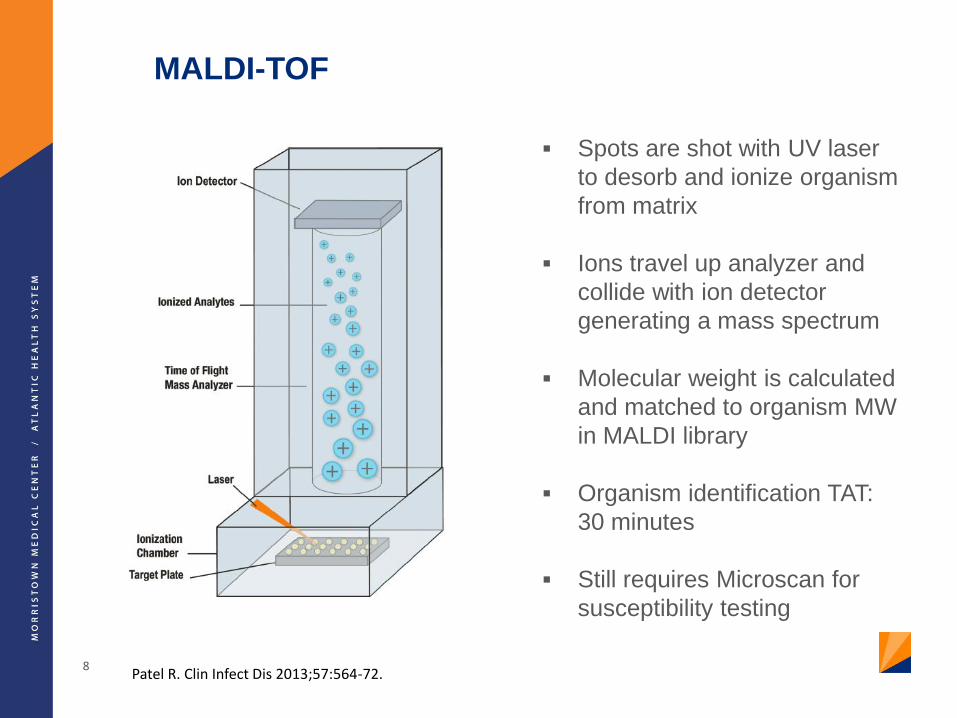
MALDI-TOF
Spots are shot with UV laser
to desorb and ionize organism
from matrix
Ions travel up analyzer and
collide with ion detector
generating a mass spectrum
Molecular weight is calculated
and matched to organism MW
in MALDI library
Organism identification TAT:
30 minutes
Still requires Microscan for
susceptibility testing
8Patel R. Clin Infect Dis 2013;57:564-72.

How do we know if the MIC is “good enough”?
Breakpoints for susceptibility
• Developed for each bug-drug combination
• Based on achievable blood levels of the drug when
administered at normal doses
Factors considered in breakpoint determination
• PK-PD
• Typical dosing
• Wild-type organism distribution
• Penetration into various body sites (for site-specific
breakpoints)
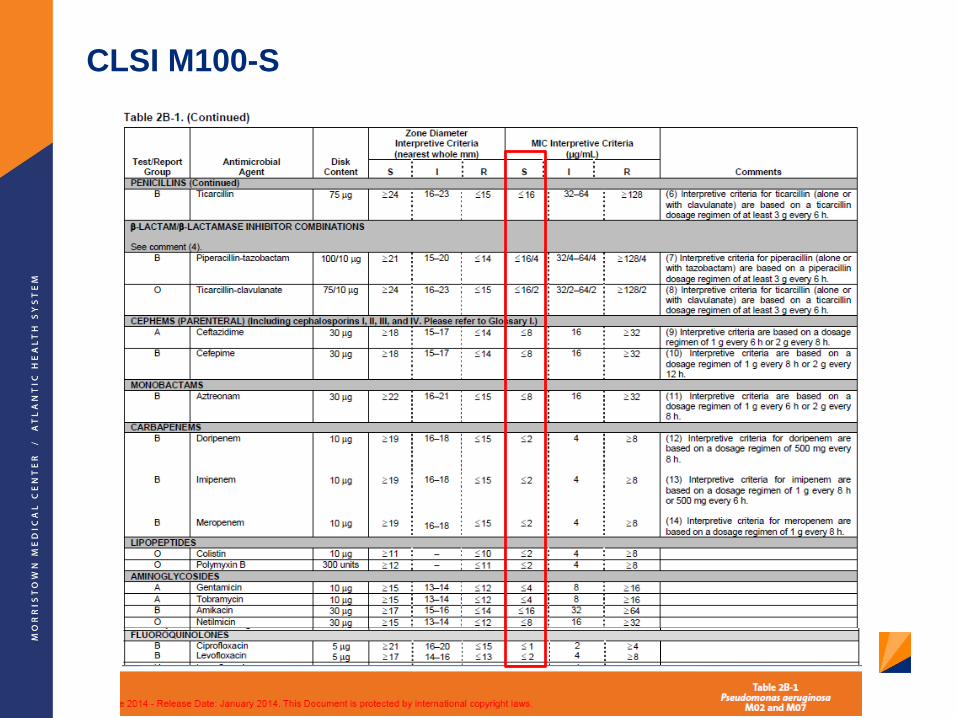
CLSI M100-S

True/False:
When selecting definitive antibiotic therapy, it is
appropriate to choose the agent with the lowest
reported MIC
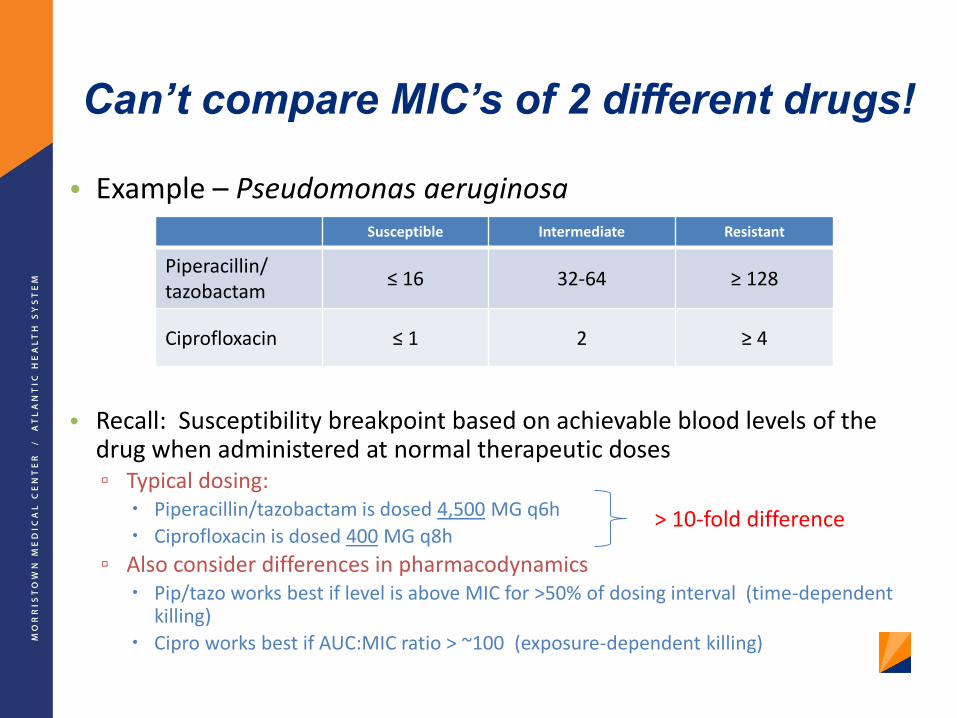
Can’t compare MIC’s of 2 different drugs!
• Example – Pseudomonas aeruginosa
• Recall: Susceptibility breakpoint based on achievable blood levels of the drug when administered at normal therapeutic doses▫ Typical dosing:
Piperacillin/tazobactam is dosed 4,500 MG q6h
Ciprofloxacin is dosed 400 MG q8h
▫ Also consider differences in pharmacodynamics Pip/tazo works best if level is above MIC for >50% of dosing interval (time-dependent
killing)
Cipro works best if AUC:MIC ratio > ~100 (exposure-dependent killing)
Susceptible Intermediate Resistant
Piperacillin/tazobactam
≤ 16 32-64 ≥ 128
Ciprofloxacin ≤ 1 2 ≥ 4
> 10-fold difference

Which antibiotic to choose for definitive therapy?

Which antibiotic to choose for definitive therapy?
Consider drug factors: Clinical studies
Tissue penetration
Resistance potential
Collateral damage • narrow-spectrum
therapy is ideal
Cost
Consider patient factors: Allergies
Drug interactions
Renal/hepatic function
Severity of illness
Etc.

Reporting of MIC Values

ESBL Reporting
16
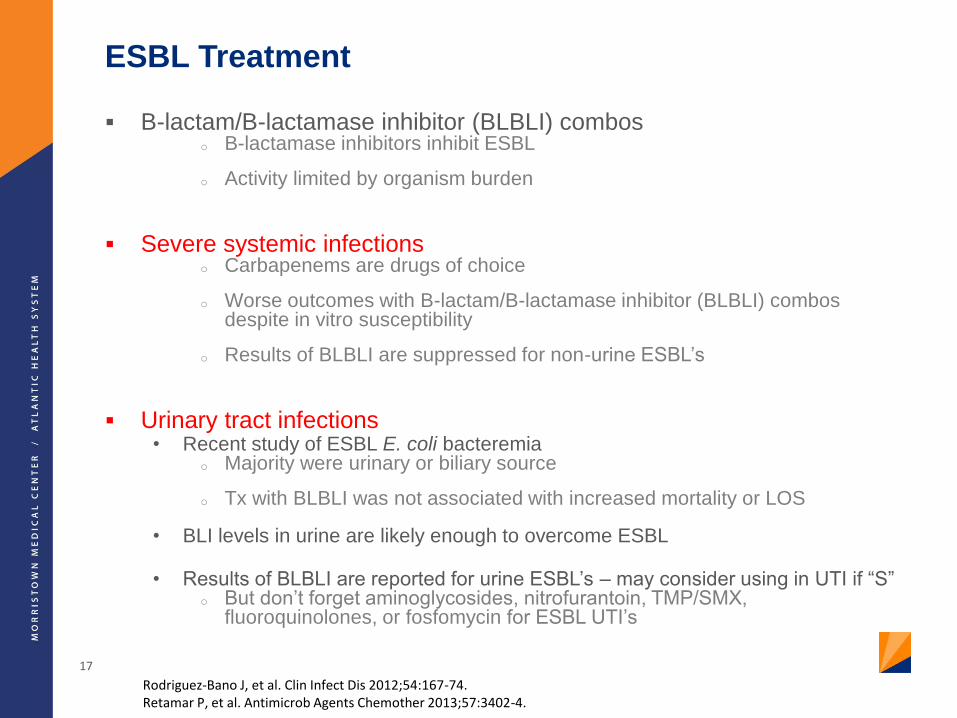
ESBL Treatment
B-lactam/B-lactamase inhibitor (BLBLI) comboso B-lactamase inhibitors inhibit ESBL
o Activity limited by organism burden
Severe systemic infectionso Carbapenems are drugs of choice
o Worse outcomes with B-lactam/B-lactamase inhibitor (BLBLI) combos despite in vitro susceptibility
o Results of BLBLI are suppressed for non-urine ESBL’s
Urinary tract infections• Recent study of ESBL E. coli bacteremia
o Majority were urinary or biliary source
o Tx with BLBLI was not associated with increased mortality or LOS
• BLI levels in urine are likely enough to overcome ESBL
• Results of BLBLI are reported for urine ESBL’s – may consider using in UTI if “S”o But don’t forget aminoglycosides, nitrofurantoin, TMP/SMX,
fluoroquinolones, or fosfomycin for ESBL UTI’s
17
Rodriguez-Bano J, et al. Clin Infect Dis 2012;54:167-74.Retamar P, et al. Antimicrob Agents Chemother 2013;57:3402-4.
18
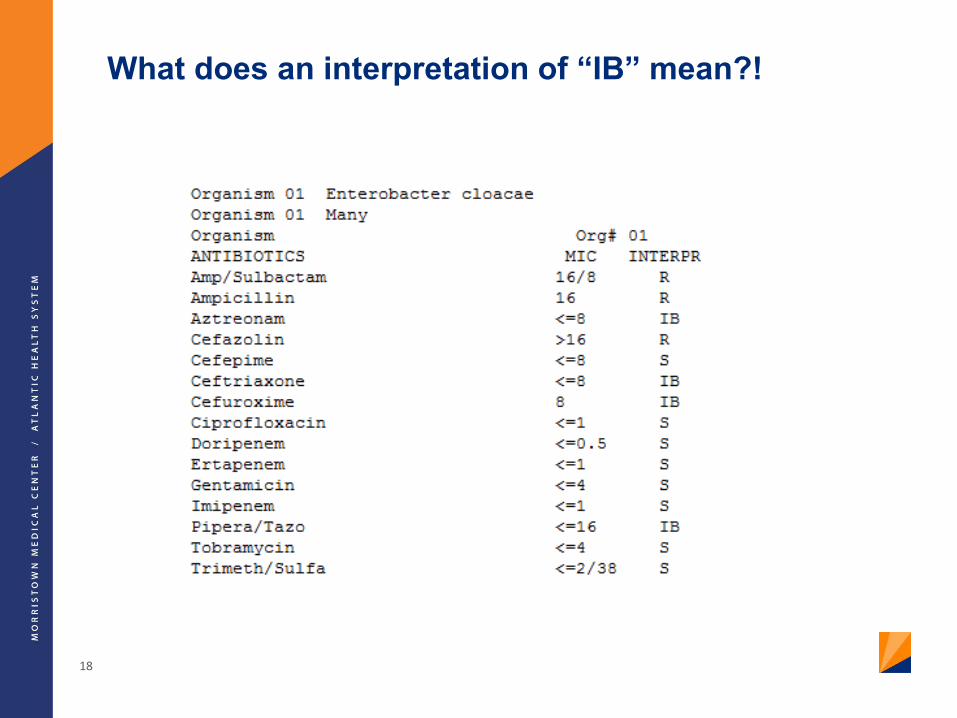
What does an interpretation of “IB” mean?!
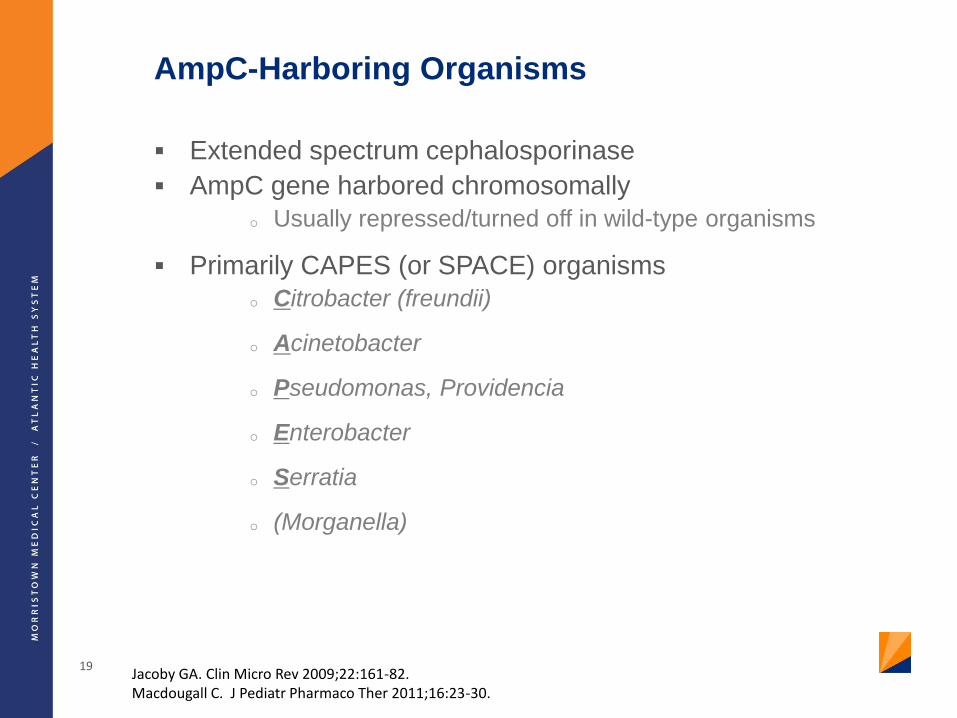
AmpC-Harboring Organisms
Extended spectrum cephalosporinase
AmpC gene harbored chromosomally
o Usually repressed/turned off in wild-type organisms
Primarily CAPES (or SPACE) organisms
o Citrobacter (freundii)
o Acinetobacter
o Pseudomonas, Providencia
o Enterobacter
o Serratia
o (Morganella)
19Jacoby GA. Clin Micro Rev 2009;22:161-82.Macdougall C. J Pediatr Pharmaco Ther 2011;16:23-30.
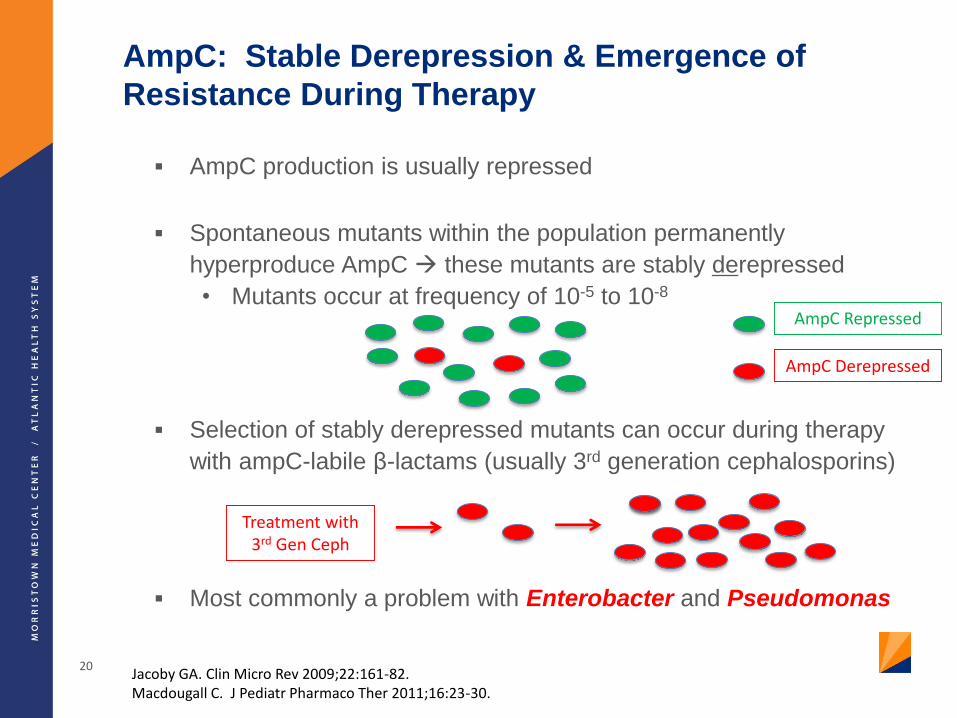
AmpC: Stable Derepression & Emergence of
Resistance During Therapy
AmpC production is usually repressed
Spontaneous mutants within the population permanently
hyperproduce AmpC these mutants are stably derepressed
• Mutants occur at frequency of 10-5 to 10-8
Selection of stably derepressed mutants can occur during therapy
with ampC-labile β-lactams (usually 3rd generation cephalosporins)
Most commonly a problem with Enterobacter and Pseudomonas
20Jacoby GA. Clin Micro Rev 2009;22:161-82.Macdougall C. J Pediatr Pharmaco Ther 2011;16:23-30.
Treatment with 3rd Gen Ceph
AmpC Repressed
AmpC Derepressed
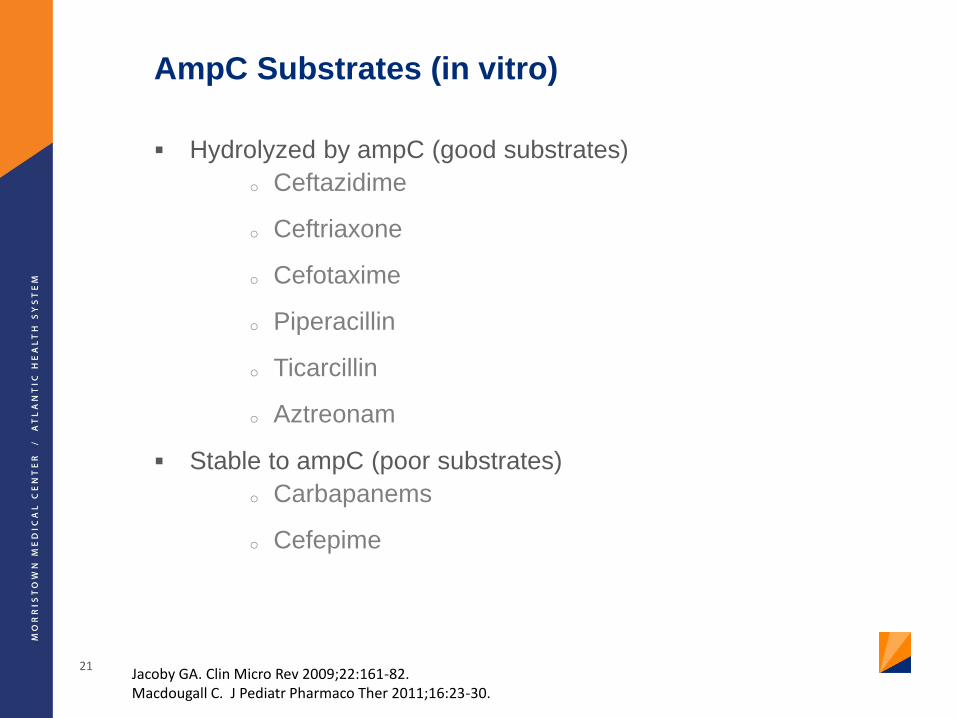
AmpC Substrates (in vitro)
Hydrolyzed by ampC (good substrates)
o Ceftazidime
o Ceftriaxone
o Cefotaxime
o Piperacillin
o Ticarcillin
o Aztreonam
Stable to ampC (poor substrates)
o Carbapanems
o Cefepime
21Jacoby GA. Clin Micro Rev 2009;22:161-82.Macdougall C. J Pediatr Pharmaco Ther 2011;16:23-30.
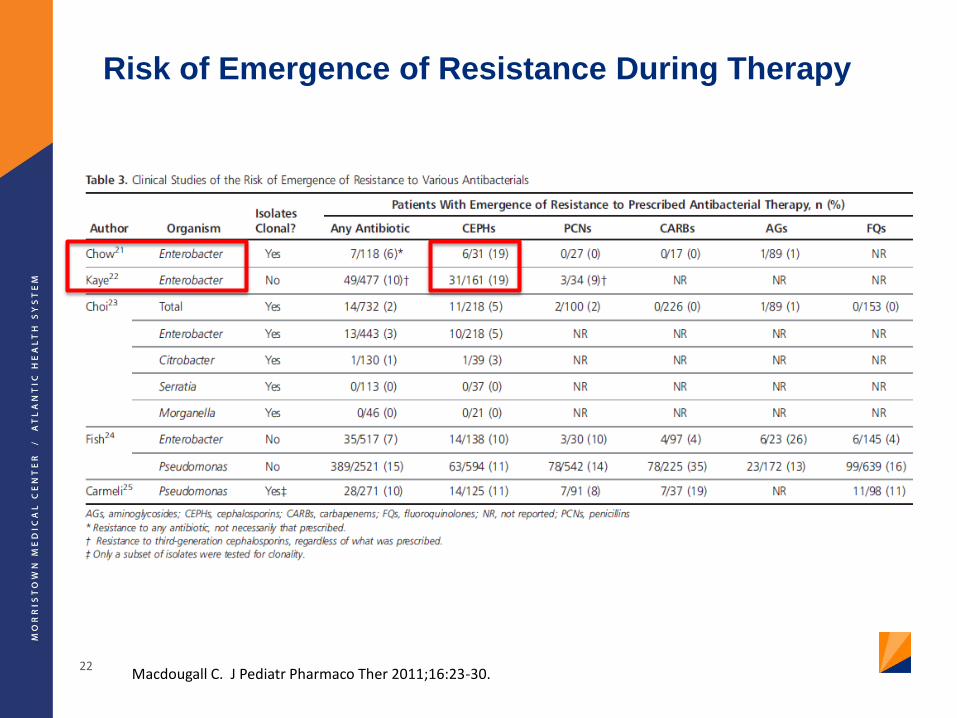
Risk of Emergence of Resistance During Therapy
22Macdougall C. J Pediatr Pharmaco Ther 2011;16:23-30.
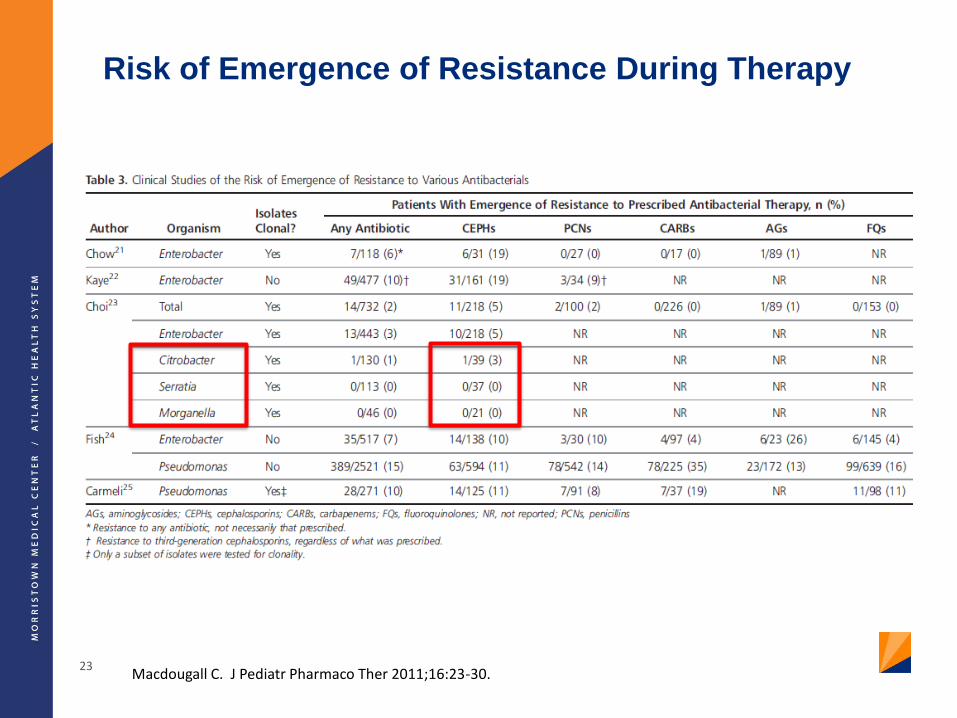
Risk of Emergence of Resistance During Therapy
23Macdougall C. J Pediatr Pharmaco Ther 2011;16:23-30.
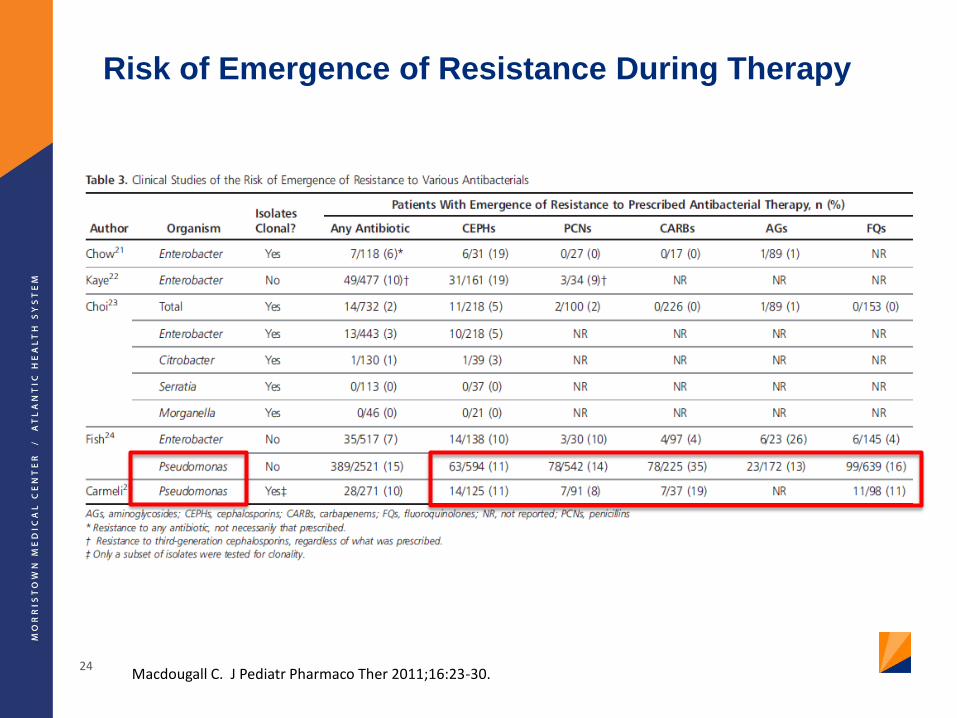
Risk of Emergence of Resistance During Therapy
24Macdougall C. J Pediatr Pharmaco Ther 2011;16:23-30.
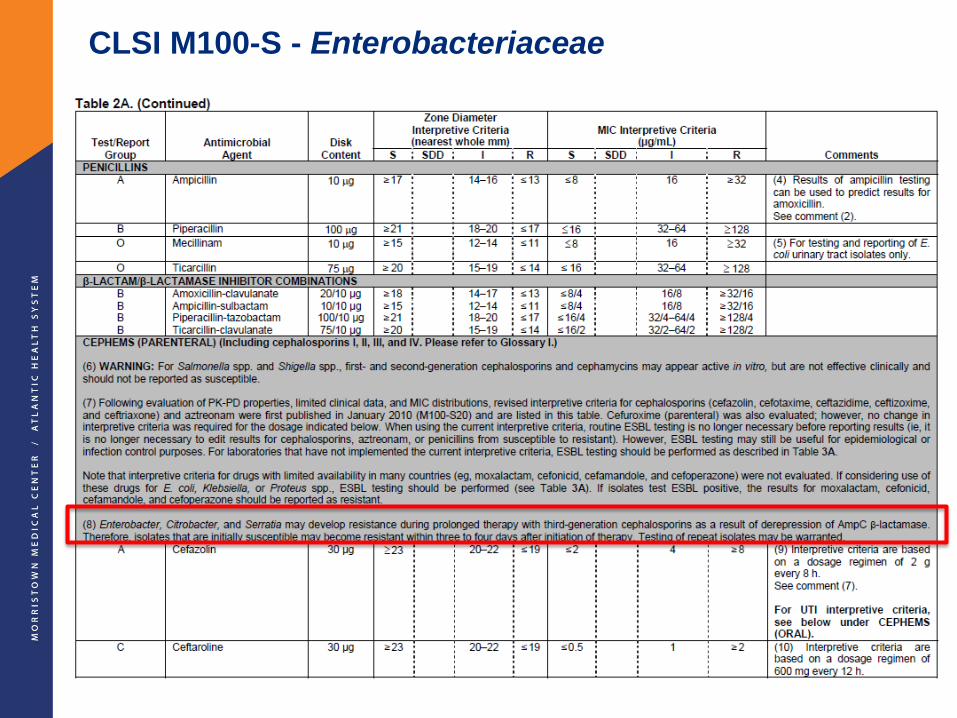
CLSI M100-S - Enterobacteriaceae
25
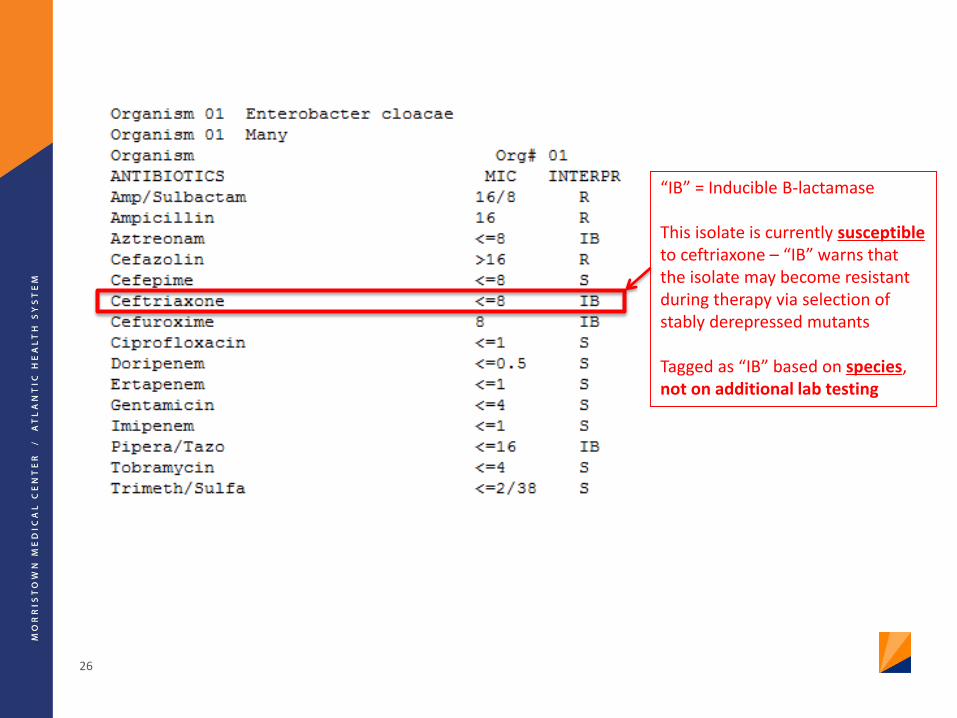
26
“IB” = Inducible B-lactamase
This isolate is currently susceptibleto ceftriaxone – “IB” warns that the isolate may become resistant during therapy via selection of stably derepressed mutants
Tagged as “IB” based on species, not on additional lab testing

27
This isolate is already resistant to ceftriaxone
AmpC is likely already stably derepressed in this population
• CAPES organism• Not a KPC

28
Note: Cefepime retains susceptibility in both isolates
29
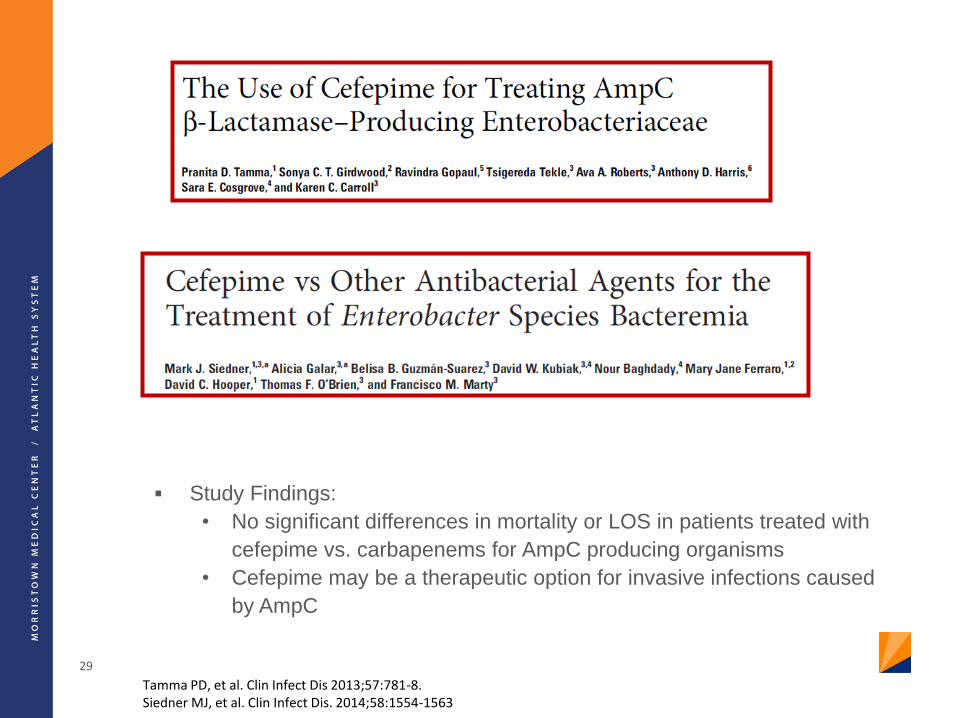
Tamma PD, et al. Clin Infect Dis 2013;57:781-8.Siedner MJ, et al. Clin Infect Dis. 2014;58:1554-1563
Study Findings:
• No significant differences in mortality or LOS in patients treated with
cefepime vs. carbapenems for AmpC producing organisms
• Cefepime may be a therapeutic option for invasive infections caused
by AmpC

Conclusions
Cefepime appears to be a good option for treatment of infections
due to organisms that harbor ampCo Carbapenem-sparing
o Appropriate dosing is a must
– CrCl >60: 2 g IV q8-12h
– CrCl 30-60: 2 g IV q12-24h
– CrCl 11-29: 1-2g IV q24h
– HD: 0.5-1 g IV q24h (or 1-2 g after each HD)
Reasonable to use cefepime to treat these infections, especially in
non-critically ill patients
AmpC hyperproduction may be less of an issue for Citrobacter,
Serratia, Providencia, and Morganella
30
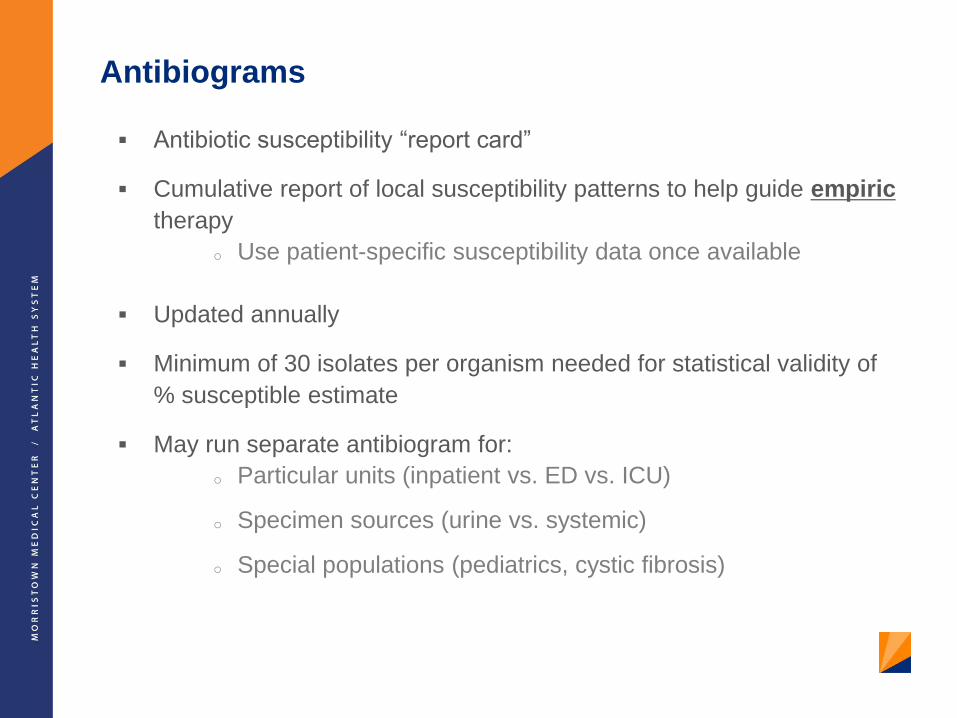
Antibiograms
Antibiotic susceptibility “report card”
Cumulative report of local susceptibility patterns to help guide empiric
therapy
o Use patient-specific susceptibility data once available
Updated annually
Minimum of 30 isolates per organism needed for statistical validity of
% susceptible estimate
May run separate antibiogram for:
o Particular units (inpatient vs. ED vs. ICU)
o Specimen sources (urine vs. systemic)
o Special populations (pediatrics, cystic fibrosis)

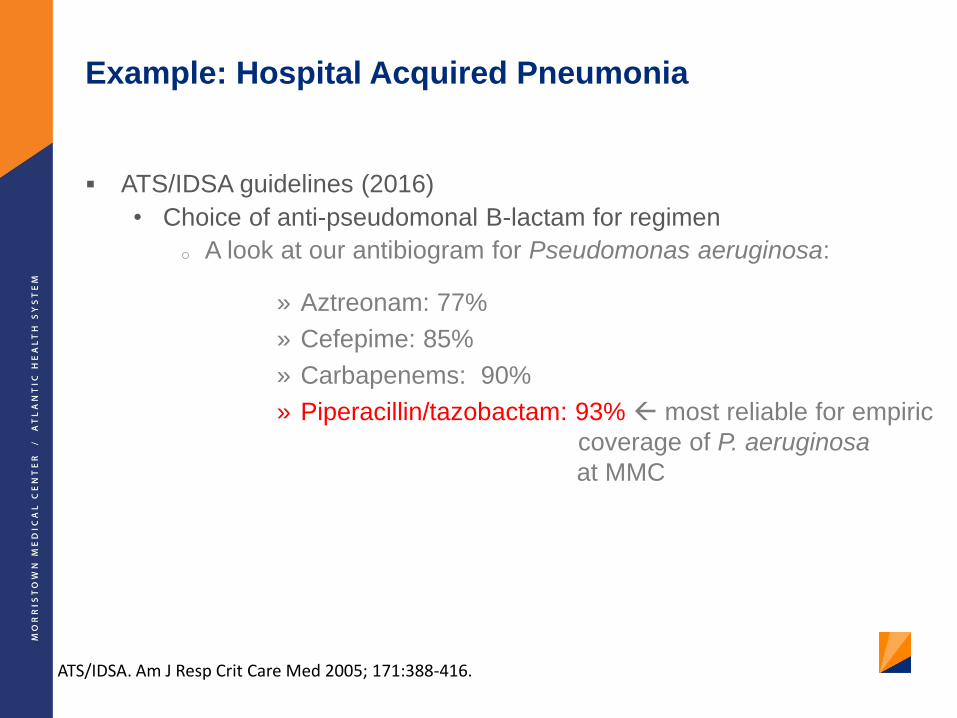
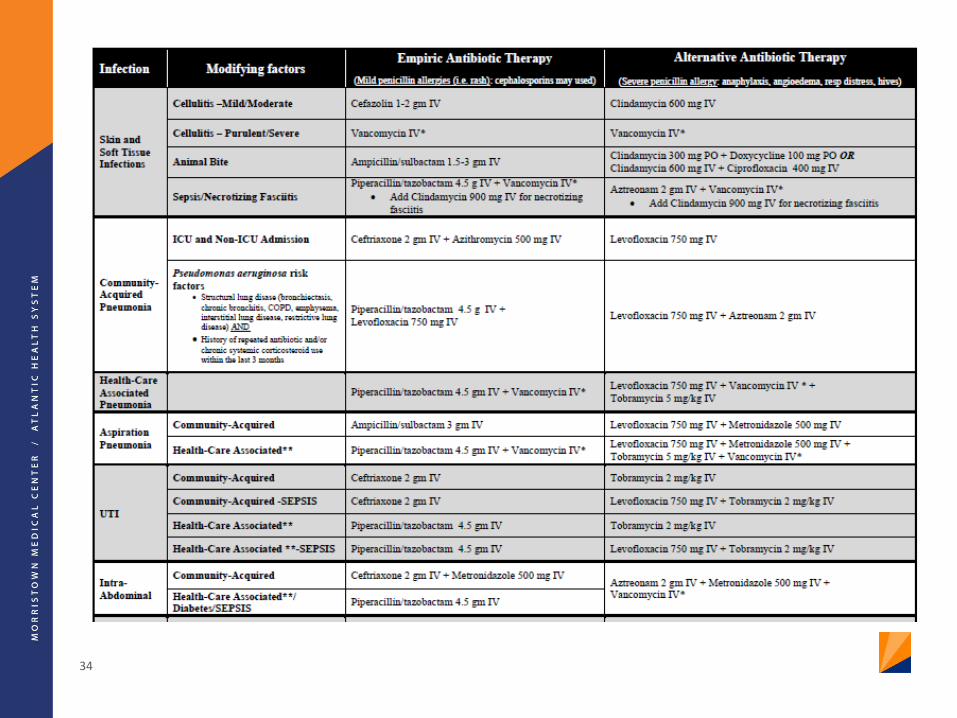
Example: Hospital Acquired Pneumonia
ATS/IDSA guidelines (2016)
• Choice of anti-pseudomonal B-lactam for regimen
o A look at our antibiogram for Pseudomonas aeruginosa:
» Aztreonam: 77%
» Cefepime: 85%
» Carbapenems: 90%
» Piperacillin/tazobactam: 93% most reliable for empiric
coverage of P. aeruginosa
at MMC
ATS/IDSA. Am J Resp Crit Care Med 2005; 171:388-416.
34

Antibiotic
Pharmacodynamics
(“what the drug does to the body/bug”)

Antibiotic Pharmacodynamics
Minimum Inhibitory Concentration (MIC)
o Antimicrobial concentration that inhibits visible microbial
growth in vitro after an incubation period
o Measure most often used historically to characterize
antimicrobial activity
Lodise TP, Lomaestro BM and Drusano GL. Pharmacotherapy 2006;26(9):1320-32

Antibiotic Pharmacodynamics
Limitations of MIC for characterizing antimicrobial activity:o Doesn’t account for changes in drug concentration throughout
dosing interval
o Does not account for interpatient pharmacokinetic (PK)
variability
o Does not provide info on rate of kill (static vs. cidal)
Combining MIC with PK parameters overcomes many of
these limitationso Provides more useful info for predicting outcomes
Lodise TP, Lomaestro BM and Drusano GL. Pharmacotherapy 2006;26(9):1320-32

Antimicrobial PD Overview
Roberts JA, Kruger P, Paterson DL, et al. Crit Care Med 2008;36:2433-2440.
Reproduced for educational purposes
vancomycin
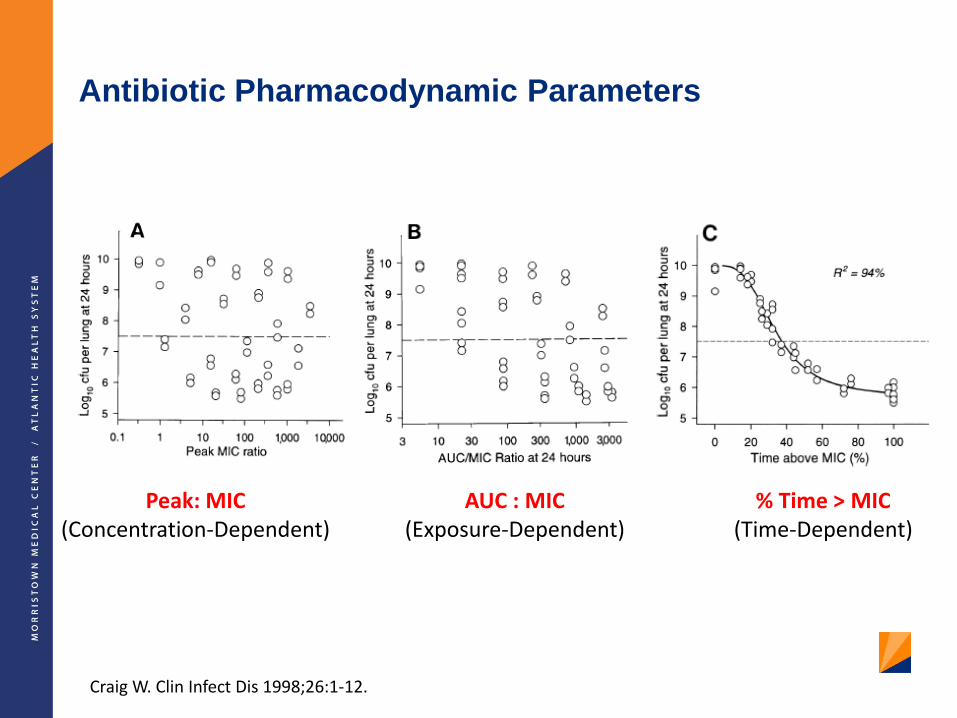
Antibiotic Pharmacodynamic Parameters
Peak: MIC(Concentration-Dependent)
AUC : MIC(Exposure-Dependent)
% Time > MIC(Time-Dependent)
Craig W. Clin Infect Dis 1998;26:1-12.
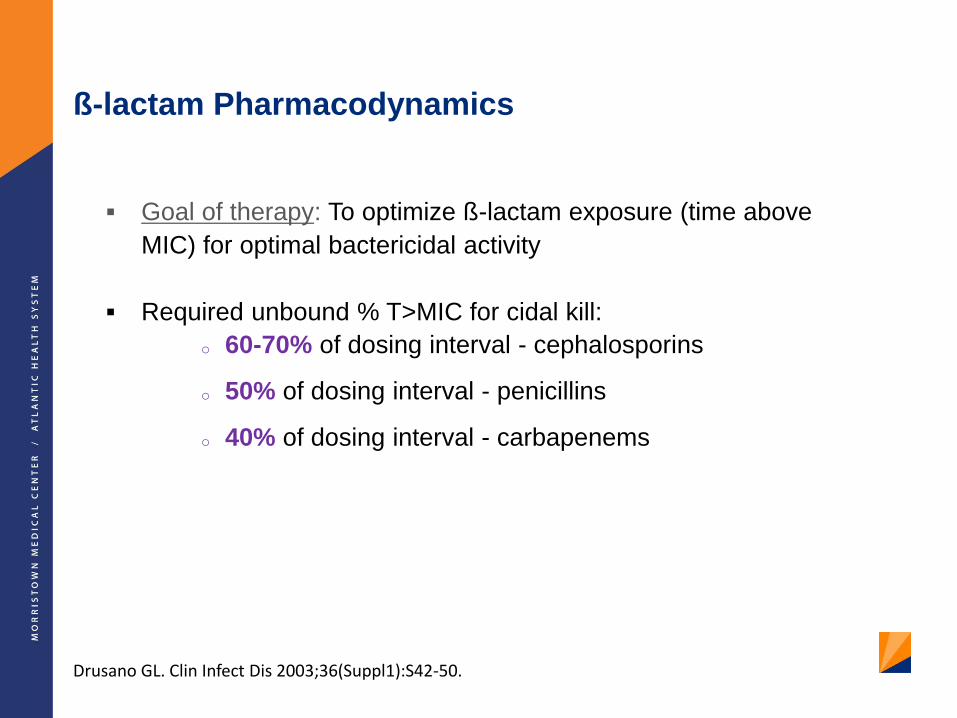
Goal of therapy: To optimize ß-lactam exposure (time above
MIC) for optimal bactericidal activity
Required unbound % T>MIC for cidal kill:
o 60-70% of dosing interval - cephalosporins
o 50% of dosing interval - penicillins
o 40% of dosing interval - carbapenems
ß-lactam Pharmacodynamics
Drusano GL. Clin Infect Dis 2003;36(Suppl1):S42-50.
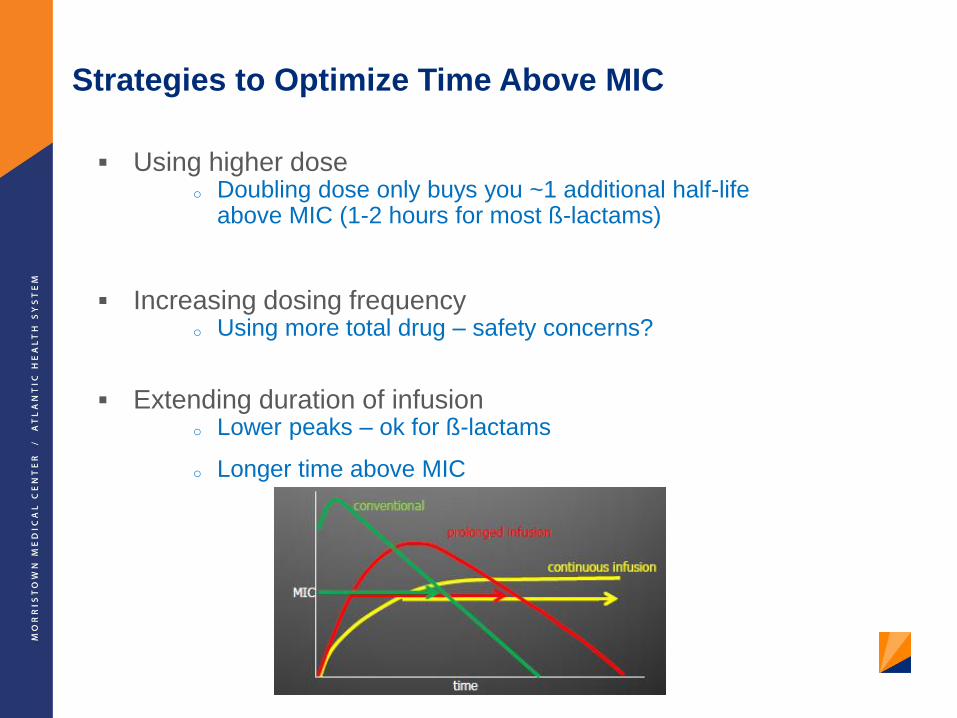
Strategies to Optimize Time Above MIC
Using higher doseo Doubling dose only buys you ~1 additional half-life
above MIC (1-2 hours for most ß-lactams)
Increasing dosing frequencyo Using more total drug – safety concerns?
Extending duration of infusiono Lower peaks – ok for ß-lactams
o Longer time above MIC

Piperacillin/Tazobactam Dosing
Kim A, Sutherland CA, Kuti JL, et al. Pharmacotherapy 2007;27(11):1490-7.
New Breakpoint Old Breakpoint
What is the most widely ordered antibiotic at MMC?
a. Cefepime
b. Vancomycin
c. Metronidazole
d. Piperacillin/tazobactam
e. MMCacillin
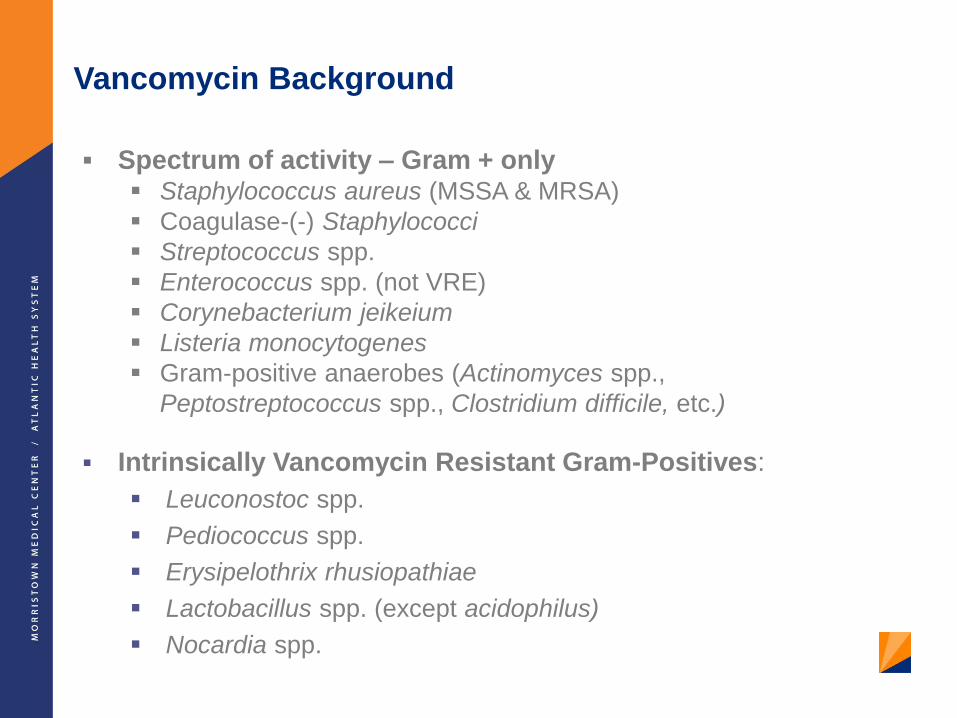
Vancomycin Background
Spectrum of activity – Gram + only Staphylococcus aureus (MSSA & MRSA)
Coagulase-(-) Staphylococci
Streptococcus spp.
Enterococcus spp. (not VRE)
Corynebacterium jeikeium
Listeria monocytogenes
Gram-positive anaerobes (Actinomyces spp.,
Peptostreptococcus spp., Clostridium difficile, etc.)
Intrinsically Vancomycin Resistant Gram-Positives:
Leuconostoc spp.
Pediococcus spp.
Erysipelothrix rhusiopathiae
Lactobacillus spp. (except acidophilus)
Nocardia spp.

Vancomycin Pharmacokinetics
Absorption:
o Negligible oral absorption
o Severe colitis po vanco for severe C. difficile may result in significant
absorption
Distribution:
o Penetration into most tissues increases with inflammation (i.e. CNS, lung, etc)
o Penetration into skin tissue is significantly lower in diabetics vs. non-diabetics
o Distributes well into adipose tissue – dose based on actual body weight
o Protein biding: ~50%
Metabolism:
o Negligible
Elimination:
o Unchanged via kidneys by glomerular filtration when given IV
o Elimination half life (t1/2) ~4-6 hours in normal renal function
o Oral doses are eliminated in the feces

Vancomycin Pharmacodynamics
Roberts JA, Kruger P, Paterson DL, et al. Crit Care Med 2008;36:2433-2440.
Reproduced for educational purposes only.
vancomycin
Recommendations for Dosing and
Monitoring of Vancomycin
Guidelines can be accessed here: http://www.ajhp.org/content/66/1/82.full
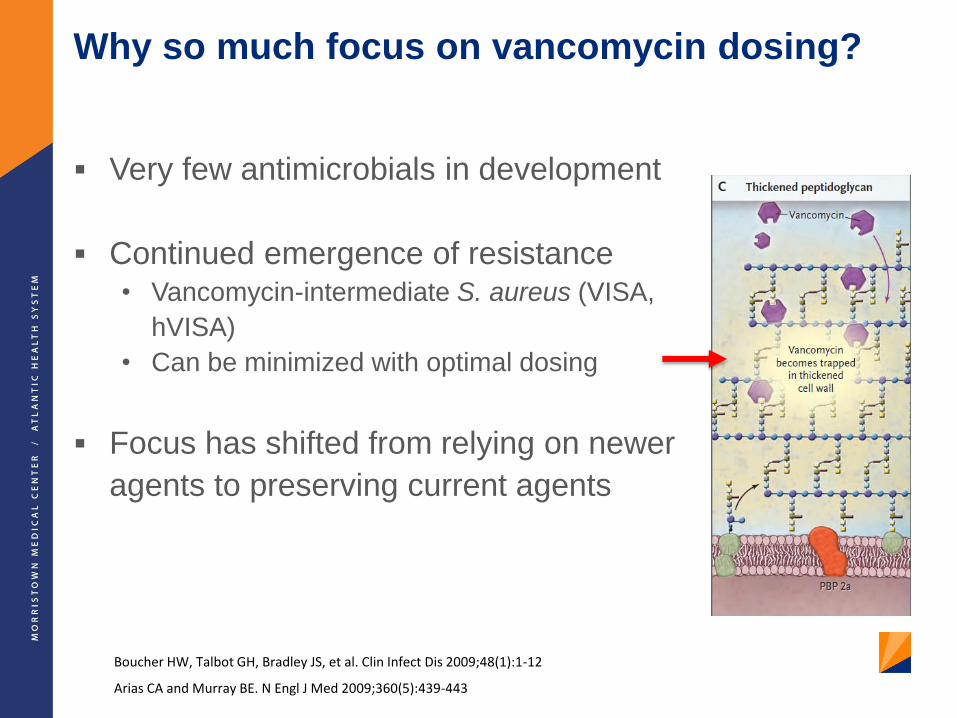
Why so much focus on vancomycin dosing?
Very few antimicrobials in development
Continued emergence of resistance • Vancomycin-intermediate S. aureus (VISA,
hVISA)
• Can be minimized with optimal dosing
Focus has shifted from relying on newer
agents to preserving current agents
Boucher HW, Talbot GH, Bradley JS, et al. Clin Infect Dis 2009;48(1):1-12
Arias CA and Murray BE. N Engl J Med 2009;360(5):439-443

AUC/MIC ≥ 400 - target for clinical effectiveness for MRSA– Correlates to trough 15-20 mcg/mL when MIC ≤ 1
Vancomycin penetration is limited into various body tissues. For patients with serious, deep-seated infections, a trough of 15-20 mcg/mL should be targeted:
– Pneumonia– Osteomyelitis– Meningitis– Endocarditis– Bacteremia
Trough target of 10-15 mcg/mL is appropriate in less severe infections where vancomycin penetration is adequate
– Cellulitis– Urinary tract infection
Rationale for Monitoring Vancomycin Levels: Efficacy
Rybak M, Lomaestro B, Rotschafer JC, et al. Am J Health-Syst Pharm. 2009;66:82-98.

• Most common adverse effects are unrelated to drug
levels:o Infusion-related reactions: fever, chills, phlebitis
o “Red man syndrome”: histamine-mediated flushing of face, neck,
upper torso due to rapid infusion
» Minimized by infusing 1 gram/hour
» May administer antihistamine prior to infusion
» NOT considered an allergy!!!
Rationale for Monitoring Vancomycin Levels: Toxicity
Rybak M, Lomaestro B, Rotschafer JC, et al. Am J Health-Syst Pharm. 2009;66:82-98.
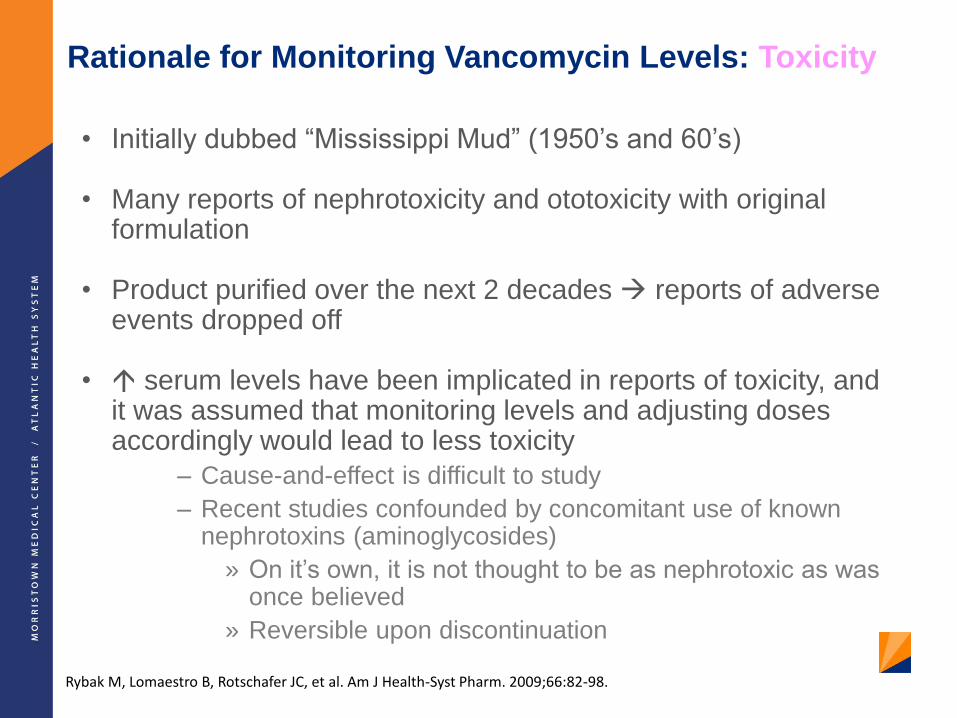
• Initially dubbed “Mississippi Mud” (1950’s and 60’s)
• Many reports of nephrotoxicity and ototoxicity with original formulation
• Product purified over the next 2 decades reports of adverse events dropped off
• serum levels have been implicated in reports of toxicity, and it was assumed that monitoring levels and adjusting doses accordingly would lead to less toxicity
– Cause-and-effect is difficult to study
– Recent studies confounded by concomitant use of known nephrotoxins (aminoglycosides)
» On it’s own, it is not thought to be as nephrotoxic as was once believed
» Reversible upon discontinuation
Rationale for Monitoring Vancomycin Levels: Toxicity
Rybak M, Lomaestro B, Rotschafer JC, et al. Am J Health-Syst Pharm. 2009;66:82-98.
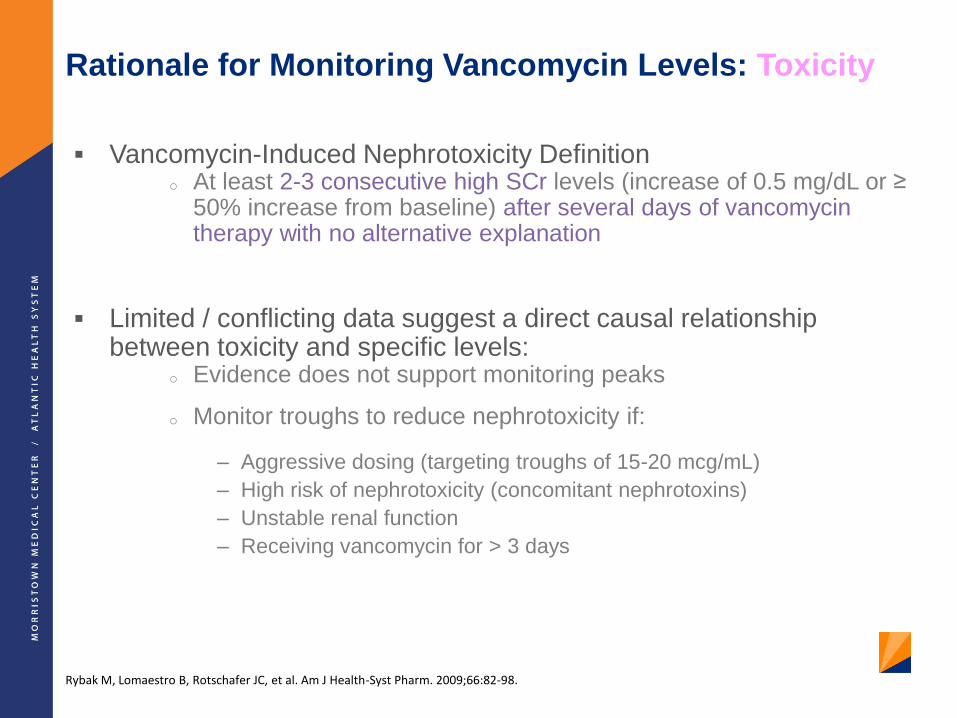
Vancomycin-Induced Nephrotoxicity Definitiono At least 2-3 consecutive high SCr levels (increase of 0.5 mg/dL or ≥
50% increase from baseline) after several days of vancomycin therapy with no alternative explanation
Limited / conflicting data suggest a direct causal relationship between toxicity and specific levels:
o Evidence does not support monitoring peaks
o Monitor troughs to reduce nephrotoxicity if:
– Aggressive dosing (targeting troughs of 15-20 mcg/mL)
– High risk of nephrotoxicity (concomitant nephrotoxins)
– Unstable renal function
– Receiving vancomycin for > 3 days
Rationale for Monitoring Vancomycin Levels: Toxicity
Rybak M, Lomaestro B, Rotschafer JC, et al. Am J Health-Syst Pharm. 2009;66:82-98.

Ototoxicity
• Majority of cases were from early reports and were attributed to
impurities in formulation or concomitant ototoxins
• RARE incidence of ototoxicity has not consistently correlated
with serum vancomycin concentrations
• Monitoring of vancomycin levels to prevent ototoxicity is not
recommended
Rationale for Monitoring Vancomycin Levels: Toxicity
Rybak M, Lomaestro B, Rotschafer JC, et al. Am J Health-Syst Pharm. 2009;66:82-98.
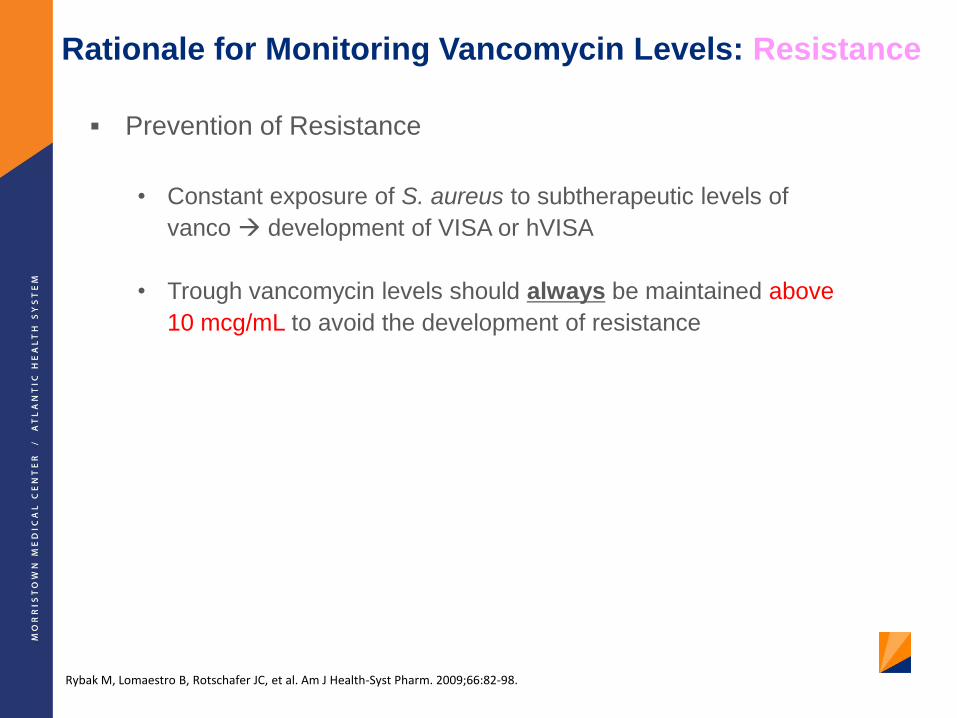
Prevention of Resistance
• Constant exposure of S. aureus to subtherapeutic levels of
vanco development of VISA or hVISA
• Trough vancomycin levels should always be maintained above
10 mcg/mL to avoid the development of resistance
Rationale for Monitoring Vancomycin Levels: Resistance
Rybak M, Lomaestro B, Rotschafer JC, et al. Am J Health-Syst Pharm. 2009;66:82-98.

Question 1
Vancomycin ________ levels are monitored to _____________.
a) Trough; ensure efficacy
b) Trough; prevent ototoxicity
c) Peak; ensure efficacy
d) Peak; prevent nephrotoxicity
55
56
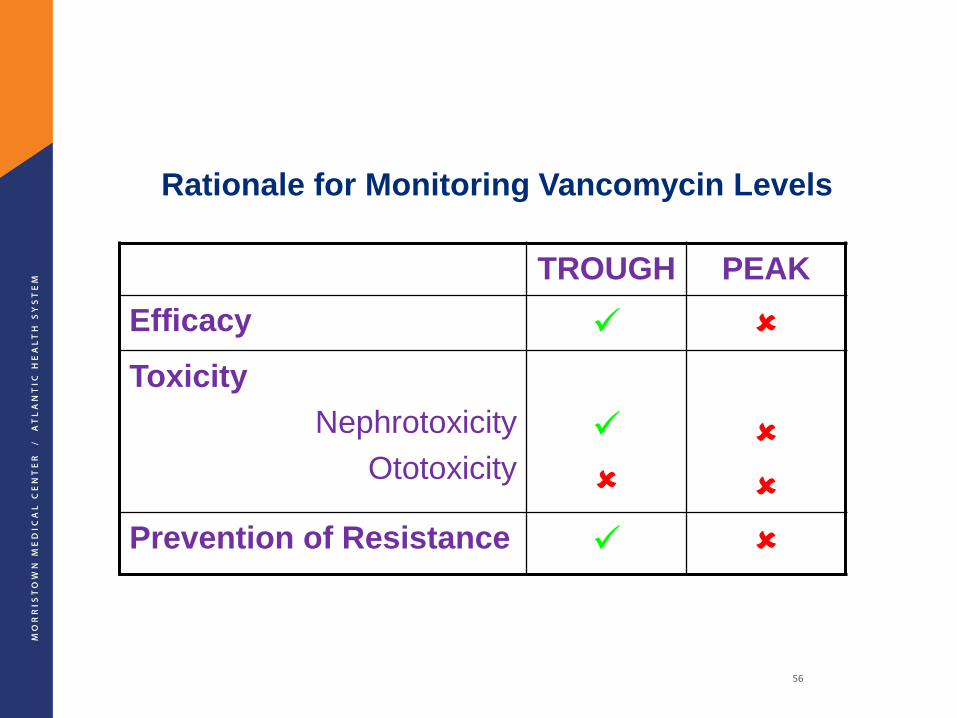
Rationale for Monitoring Vancomycin Levels
TROUGH PEAK
Efficacy
Toxicity
Nephrotoxicity
Ototoxicity
Prevention of Resistance

Question 2
What are the ideal vancomycin trough levels that maximize
efficacy when treating serious infections due to MRSA?
a) 5-10 mcg/mL
b) 5-15 mcg/mL
c) 10-15 mcg/mL
d) 15-20 mcg/mL
57

Recommendations for Vancomycin Dosing
and Monitoring

Initial Vancomycin Dosing: Why isn’t there a standard?
Several dosing nomograms exist for patients with varied
weight/renal function
• Most are old
• Most were validated with targets of 5-10 or 5-15 mcg/mL
• Most were studied using homogenous patient populations
(few critically ill, very old, or obese patients)
No well-validated dosing nomogram has been established to
target troughs of 15-20 mcg/mL
If any one nomogram worked for most patients, we probably
wouldn’t need to monitor levels – lots of interpatient variability!
All vancomycin dosing guidelines provide a first guess and are
often based on population PK estimates
Different Approaches to Initial Dosing….
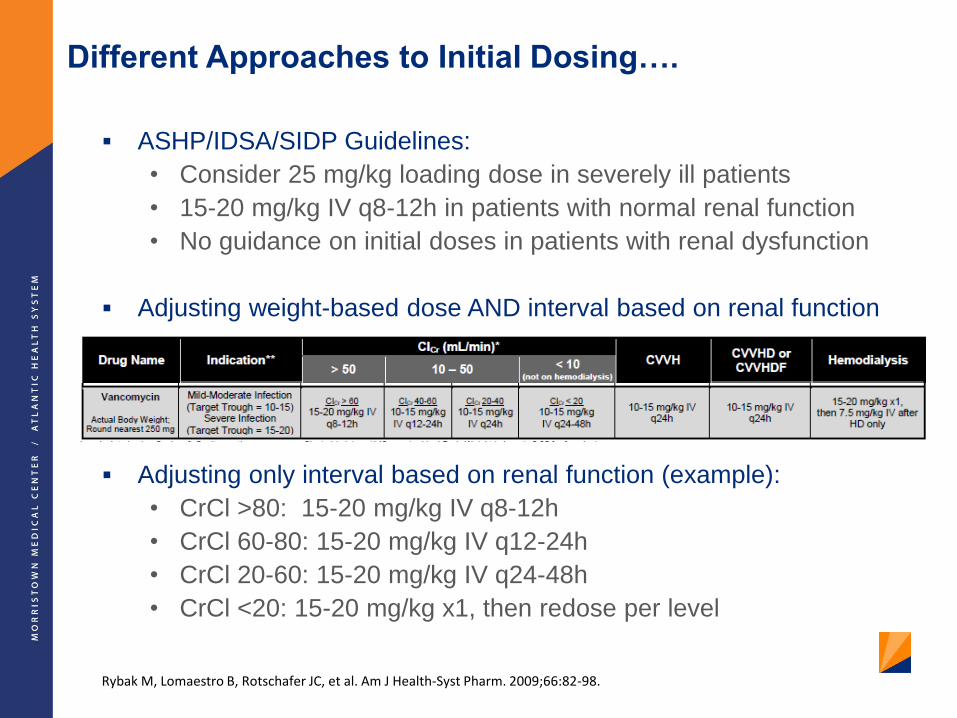
ASHP/IDSA/SIDP Guidelines:
• Consider 25 mg/kg loading dose in severely ill patients
• 15-20 mg/kg IV q8-12h in patients with normal renal function
• No guidance on initial doses in patients with renal dysfunction
Adjusting weight-based dose AND interval based on renal function
Adjusting only interval based on renal function (example):
• CrCl >80: 15-20 mg/kg IV q8-12h
• CrCl 60-80: 15-20 mg/kg IV q12-24h
• CrCl 20-60: 15-20 mg/kg IV q24-48h
• CrCl <20: 15-20 mg/kg x1, then redose per level
Rybak M, Lomaestro B, Rotschafer JC, et al. Am J Health-Syst Pharm. 2009;66:82-98.

Vancomycin Monitoring
Monitor trough levels at steady state
(3-5 half-lives)
o Typically within 30 minutes prior
to the 4th dose
o Ensure the level is a “true”
trough!
Do not order levels if therapy is not
expected to continue beyond 3 days

Nuances to Interpreting Vancomycin Trough Levels
Must always assess appropriateness of timing of level relative
to the time of the dose:
• If level drawn too soon after dose (not a true “trough”)
will result in a high level but dose adjustment based on this
level may not be appropriate
o Example: Patient receiving 1250 mg IV q12h
Date/Time of Dose Level and Date/Time of Level
Dose 1: 12/10 2200
“Trough” results as 27.4 mcg/mL; Drawn 12/12 0443 (~5 hours too early; Do not hold or adjust dose based on this level; draw trough within 30 minutes prior to next dose)
Dose 2: 12/11 1000
Dose 3: 12/11 2200
Dose 4: 12/12 1000

Vancomycin Trough Level Errors
Specifying the date and time the trough level should be drawn
should minimize most errors related to inappropriately timed levels
63
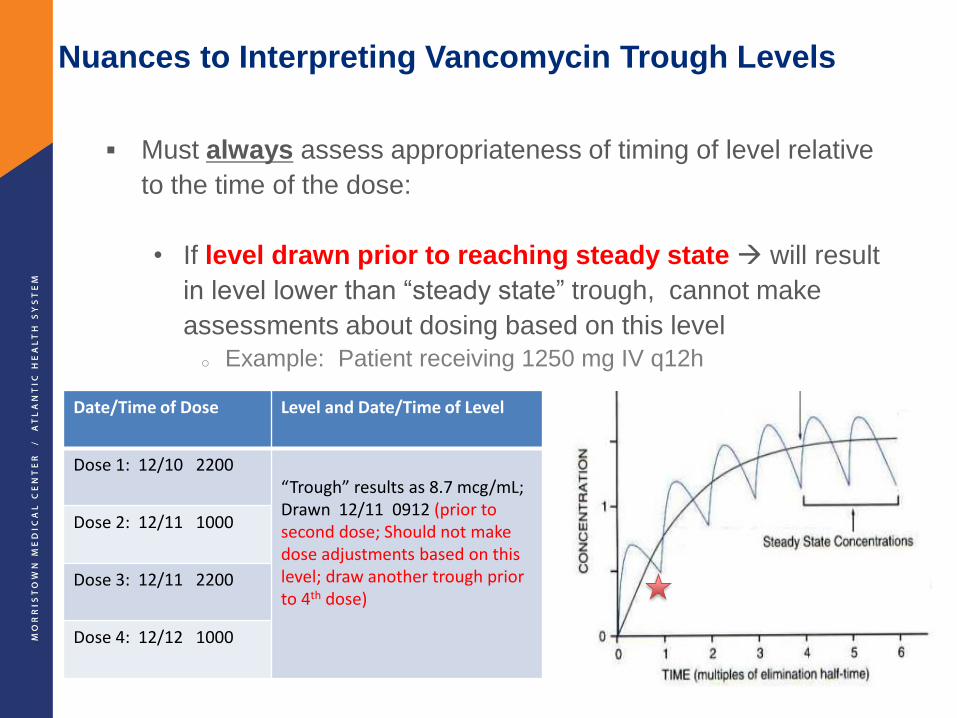
Nuances to Interpreting Vancomycin Trough Levels
Must always assess appropriateness of timing of level relative
to the time of the dose:
• If level drawn prior to reaching steady state will result
in level lower than “steady state” trough, cannot make
assessments about dosing based on this level
o Example: Patient receiving 1250 mg IV q12h
Date/Time of Dose Level and Date/Time of Level
Dose 1: 12/10 2200“Trough” results as 8.7 mcg/mL; Drawn 12/11 0912 (prior to second dose; Should not make dose adjustments based on this level; draw another trough prior to 4th dose)
Dose 2: 12/11 1000
Dose 3: 12/11 2200
Dose 4: 12/12 1000
Random Levels
• Should only be ordered in patients without standing vancomycin
orders being “dosed per level”
– Typically used in patients with CrCl <20 mL/min
– Typically ordered ~24-48 hours after dose
• May be ordered in patients whose initial standing vancomycin
dose resulted in a supra-therapeutic level
– Subsequent dose held
– Random level monitored to determine when standing vancomycin
should be restarted
• Hemodialysis patients
– Random levels should be ordered on the day of dialysis prior to the
dialysis session
» This is essentially a “trough”
» Inaccurate level if drawn during or after HD due to ~6 hour vancomycin
redistribution phase post HD
Vancomycin Dose Adjustment Guidelines
First assess whether level is accurate and drawn correctly
In general, vancomycin displays fairly linear pharmacokinetics (double the total dose, double the trough)
• One approach to adjusting dose:o Set up a proportion and solve for New Daily Dose:
Observed Trough = Current Daily DoseTarget Trough New Daily Dose
o Divide this new daily dose q8h, q12h, q24h, etc.
o Note – changing the dosing interval tends to have more of an impact on the trough vs. changing the dose
• There will always be exceptions to this – must use judgment when deciding whether to be more aggressive or conservative with dose adjustments
Re-check trough at steady state on the new regimen

67

Vancomycin Dose Adjustment Guidelines
Hemodialysis Patients
• High-flux hemodialysis (HD) removes ~30% of vancomycin in
body
• Post-HD dose of 7.5 mg/kg (500 mg in most patients) will
replace what was removed during dialysis
• Subsequent post-HD doses may be adjusted using the
proportion method based on pre-HD level

Pearls for Vancomycin Dosing
Initial Dosing
• One dose does not fit all o Must take patient weight and renal function into account
• All weight-based doses are based on Actual Body Weight
• Doses should be rounded to the nearest 250 mg in adults
Monitoring Levels
• Must always assess timing of level relative to dose
• Trough Targets o 15-20 mcg/mL for serious infections
o 10-15 mcg/mL for mild-moderate infections (cellulitis, UTI)
Dose Adjustments
• The proportion method is a good starting point for guiding dose
adjustments
• Changes to the interval impacts the trough more than changes to
the dose
• Should re-check trough at steady state after each dose adjustment

MMC Adult Antimicrobial Guidelines