iculum. 117p. - Education Resources Information Center · between relatively unlimited wants and...
117
ED 421 402 AUTHOR TITLE INSTITUTION PUB DATE NOTE PUB TYPE EDRS PRICE DESCRIPTORS IDENTIFIERS ABSTRACT DOCUMENT RESUME Day, Harlan R. Trading around the Middle School Curr Indiana State Dept School Improvement 1993-00-00 117p. Guides - Non-Classroom (055) MF01/PC05 Plus Postage. Economics; *Economics Education; Global Education; Instructional Materials; Intermediate Grades; *International Relations; *International Trade; Junior High Schools; *Middle Schools; Social Studies; State Curriculum Guides; *World Affairs Indiana SO 028 917 World. Introducing Economics into the iculum. . of Education, Indianapolis. Center for and Performance. This booklet is to help Indiana middle school t :achers fill the gap in economics education in their curriculum by supplementing world geography and world history courses. The booklet is composed of five different teaching units: (1) "Economic Survival: Resources, Production, and Scarcity"; (2) "Working and Living Together: The Importance of Trade"; (3) "Gross Domestic Product: Measuring the Income of Nations"; (4) "Productivity: The Key to Increasing the Wealth of Nations"; and (5) "Economic Systems: How Nations Organize Their Economies." Each unit is composed of a basic teaching instruction section to explain economic concepts, student handouts, worksheet with questions to master, and a group activity that reinforces the concepts introduced. Individual projects comprise a final part of the unit with students applying the knowledge gained in the earlier sections. Teachers also can use the mastery test on unit concepts to evaluate students. (EH) ******************************************************************************** Reproductions supplied by EDRS are the best that can be made from the original document. ********************************************************************************
-
Upload
dinhkhuong -
Category
Documents
-
view
213 -
download
0
Transcript of iculum. 117p. - Education Resources Information Center · between relatively unlimited wants and...
ED 421 402
AUTHORTITLE
INSTITUTION
PUB DATENOTEPUB TYPEEDRS PRICEDESCRIPTORS
IDENTIFIERS
ABSTRACT
DOCUMENT RESUME
Day, Harlan R.Trading around theMiddle School CurrIndiana State DeptSchool Improvement1993-00-00117p.
Guides - Non-Classroom (055)MF01/PC05 Plus Postage.Economics; *Economics Education; Global Education;Instructional Materials; Intermediate Grades; *InternationalRelations; *International Trade; Junior High Schools;*Middle Schools; Social Studies; State Curriculum Guides;*World AffairsIndiana
SO 028 917
World. Introducing Economics into theiculum.. of Education, Indianapolis. Center forand Performance.
This booklet is to help Indiana middle school t :achers fillthe gap in economics education in their curriculum by supplementing worldgeography and world history courses. The booklet is composed of fivedifferent teaching units: (1) "Economic Survival: Resources, Production, andScarcity"; (2) "Working and Living Together: The Importance of Trade"; (3)"Gross Domestic Product: Measuring the Income of Nations"; (4) "Productivity:The Key to Increasing the Wealth of Nations"; and (5) "Economic Systems: HowNations Organize Their Economies." Each unit is composed of a basic teachinginstruction section to explain economic concepts, student handouts, worksheetwith questions to master, and a group activity that reinforces the conceptsintroduced. Individual projects comprise a final part of the unit withstudents applying the knowledge gained in the earlier sections. Teachers alsocan use the mastery test on unit concepts to evaluate students. (EH)
********************************************************************************Reproductions supplied by EDRS are the best that can be madefrom the original document.
********************************************************************************
00CN1OO
1
PERMISSION TO REPRODUCE ANDDISSEMINATE THIS MATERIAL HAS
BEEN GRANTED BY
a_aabaso.TO THE EDUCATIONAL RESOURCES
INFORMATION CENTER (ERIC)
U.S. DEPARTMENT OF EDUCATIONOffice of Educational Research and Improvement
EDUCATIONAL RESOURCES INFORMATIONCENTER (ERIC)
II This document has been reproduced asreceived from the person or organizationoriginating it.
Minor changes have been made toimprove reproduction quality.
° Points of view or opinions stated in thisdocument do not necessarily representofficial OERI position or policy.
Introducing ,Eco,nomics i ot Middle 3eoo ui

?RAD:NG AROUNHD T W011111,111
Introducing Economics Intothe Middle School Curriculum
Written by
Harlan R. Day, Ph.DEconomic Education Consultant
INDIANA DEPARTMENT OF EDUCATIONCenter for School Improvement and Performance
Office of School Assistance
1993
The Indiana Department of Education wishes to thank the following individuals fortheir helpful comments and suggestions on the Trading Around the World curriculum:
David BallardIndiana Department of Education
Leslie DavidsonIndiana Department of Education
Jody HealyRoosevelt Middle School
Twin Lakes School Corporation
Sally PetroMartin T. Krueger Junior High School
Michigan City Area Schools
Chris McGrewCarroll Junior-Senior High School
Carroll Consolidated School Corporation
A special thanks is also extended to the students in geography classes at the followingschools for allowing us to field test the lessons in this curriculum.
Martin T. Krueger Junior High School
Roosevelt Middle School
Carroll Junior-Senior High School

Tra.dfing Around the Wm-Id
Introducing Economics Intothe Middle School Curriculunpt--
,11Introduction
The Importance of Trade
It is hard to overestimate the importance of trade in today's world. Your students wearclothing produced in Singapore. They wear shoes produced in Korea or Brazil. Theywatch televisions made in Japan. They eat food produced in Central America.
Similarly, people in other countries use the products that your students' parentsproduce. People in these countries buy our computers, our grain, our chemicals, and ourtractors. The world would be much different, and much poorer, without trade.
Almost certainly, international trade will grow even more important as our world"shrinks" because of breathtaking advances in communication and transportationtechnology. In today's world, our students simply cannot afford to be ignorant of thisimportant subject.
Sadly, the topic of trade, and economics in general, is much neglected in the middleschool social studies curriculum, especially in Grades 6 and 7. In these grades, Indianastudents typically study the geography and history of various parts of the world. Thetextbooks usually mention trade and other related economic concepts, however, thecoverage is very shallow and fragmented. Students leaving these courses lack even arudimentary understanding of economics.
This booklet will help teachers fill this gap in the curriculum. It is designed tosupplement the existing world geography and world history courses. This may soundoverwhelming to the dedicated teacher who already has far too much material to cover.However, we firmly believe that using the teaching units in this booklet will give yourstudents a much more complete understanding of the countries that are studied in yourgeography and world history courses. Understanding the basic economic conceptspresented in this booklet will greatly enrich the rest of the curriculum that you presentto your students. In short, it will be worth your time to use these teaching units.
Teaching Philosophy and Instructional Design
Economics traditionally has been known as the "dismal science." And for those whohave suffered through a sometimes "dismal" college economics course, this descriptionof economics probably seems accurate. However, we believe that the instructionaldesign and the creative teaching activities of these lessons will make economics comealive for your students.
5

This booklet is composed of five different teaching units:
Unit 1: Economic Survival: Resources, Production, and Scarcity
Unit 2: Working and Living Together: The Importance of Trade
Unit 3: Gross Domestic Product: Measuring the Income of Nations
Unit 4: Productivity: The Key To Increasing the Wealth of Nations
Unit 5: Economic Systems: How Nations Organize Their Economies
Each unit, in turn, is composed of three different parts.1 The first part is the I:. asicInstruction (131). After reading several pages of text explaining the economic concepts,and after receiving additional instruction from you using other appropriate teachingmaterials, students complete the Questions to Master worksheet. Discuss the answerswith your students, clarifying any difficult concepts.
Next, the students are ready for the Group Activity (GA). The group activity reinforcesthe concepts introduced in the Basic Instruction. The activities are not difficult, and areinteresting enough to encourage all students to participate. Rotate the jobs of groupleader and group recorder so that all students can gain this experience. To encourageparticipation, you may want to require each student in the group to be a "recorder" andcomplete the Group Response Sheets.
The final part of the unit is the Individual Project (IP). In this part, students must applythe knowledge learned in the Basic Instruction and the Group Activity. Students mustwork independently, sometimes using outside resources. Teachers probably will want touse the IP in students' evaluations, since the IP reflects how well students have learnedthe concepts introduced in the unit. Teachers can also use the Mastery Test on UnitConcepts to evaluate students.
In summary, these lessons contain many pedagogical features that make them effectivein the classroom: stressing of basic concepts, group learning, creative teaching activities,emphasis on higher level thinking skills, and an emphasis on independent learning usingoutside resources. We are confident that using these lessons will result in a moreinteresting and worthwhile curriculum.
1 The design of these units is based on the instructional model presented in The Three-Stage Model ofCourse Design, by John F. Feldhusen. This book was published in 1980 by Educational TechnologyPublications, Inc., Englewood Cliffs, New Jersey 07632.
26

ablle ©2 Contents
Introduction 1
Unit 1: Economic Survival:Resources, Production, and Scarcity 3
Unit 2: Working and Living Together:The Importance of Trade 21
Unit 3: Gross Domestic Product:Measuring the Income of Nations 43
Unit 4: Productivity:The Key To Increasing the Wealth of Nations 63
Unit 5: Economic Systems:How Nations Organize Their Economies 91
Resources 117
Appendix A: Social Studies Economics Proficiences 119
Appendix B: Data Tables 120

UNIT 1
-1,coffilomfic Sall-vivak
Reso.allmes, PToductfolla, amd. Scarcfity
Teaching Instructions

Tezchfamg linstmearoDille Ulinfit
Economic Survive: Resources, Production, and ScarcityTeaching Objectives:
Students will:
1. Define productive resources and will identifythe productive resources used to producecertain goods and services.
2. Define scarcity and explain why productiveresources are scarce.
3. Understand that some productive resourcesare more scarce than others and that this isreflected in the prices of the resources.
4. Define opportunity cost and explain why everydecision has an opportunity cost.
5. Use features on a map to identify how peoplework and earn income in a community.
Teaching the Economic Concepts:It is very important that students understand thebasic concepts introduced in this unit. While theconcepts are not extremely difficult or complex,they still can give students some difficulty. Hereare some key points to emphasize:
1. ScarcityStudents have difficulty believingthat scarcity exists in affluent societies wherethere seems to be an abundance of goodsand services. However, even in affluentsocieties, people still want more goods andservices. Scarcity exists in any society orsituation where there is an imbalancebetween relatively unlimited wants and thelimited resource available to satisfy thosewants.
It is quite difficult to think of things that arenot scarce. Some examples might includesand and water at the beach or the airyouarc breathing at this moment. But even air isscarce to a scuba diver or astronaut, andcertainly clean air is scarce to the inhabitantsof large cities. In fact, even the air you arebreathing right now is scarce if it is heated orcooled. It takes scarce resources to installheating or air conditioning.
2. Opportunity CostIt is very common forstudents to think that opportunity cost is thesum of all possible alternative choices. Thisis not true, of course. Because of scarcity, allof the possible alternatives cannot bechosen. Only the alternative that is notchosen when making a decision is theopportunity cost.
How Map Features identify How People Workand Earn Income in a CommunityBeforegiving students the IP you should explainhow geographic features influence economicactivity in a community.
Analyze a community map and discuss some ofthe obvious relationships. For example,factories usually are located near majortransportation routes or near naturalresources used in production. Homes maynot be located immediately around factoriesbecause of aesthetic reasons, however,poorer housing sometimes is located there.Farmland usually is located on flat, fertileland near rivers or in valleys. Hilly land isused for forests, for grazing, or is leftunused. Hospitals, shopping districts, andschools are located in cities and towns,where they are more readily accessible.Discuss other examples. Let students givetheir ideas and make inferences.
,3.
Required Materials:1. A transparency showing a fairly large scale
map of a community or town would behelpful. You would not need this if such amap is available in a student text or on achart.
2. The other obvious need for this and theother teaching units is paper. If paper andphotocopying capability are greatly limited,you may have to do more oral instructionand omit photocopying parts of the teachingunit, especially the BI. To save paper, collectand reuse certain parts of this andsubsequent units, such as the BI and GAinstructions.

Extending the Unit:Give and Take video "You Choose: Scarcity andPersonal Decision Making."
Lesson 1: "Scarcity," and Lesson 6: "AnEconomics Hunt," in the Master CurriculumGuide booklet, Strategies for Teaching Economics(Junior High Level).
6
The teaching activity Blue Jeans to Income, from"Resources for the Marketplace," an issue ofThe Elementary Economist.
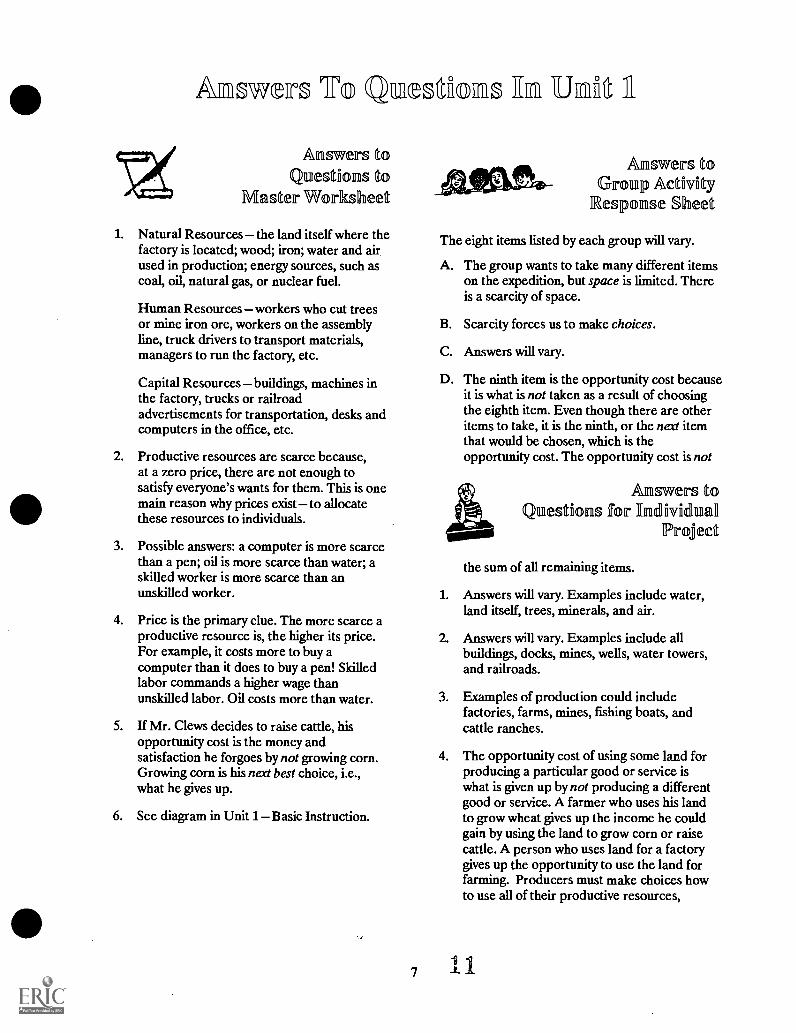
Anoweirs "cci Qulleetfieno :11ll infit
Answers toQuestions to
Master Worksheet
1. Natural Resources the land itself where thefactory is located; wood; iron; water and airused in production; energy sources, such ascoal, oil, natural gas, or nuclear fuel.
Human Resourcesworkers who cut treesor mine iron ore, workers on the assemblyline, truck drivers to transport materials,managers to run the factory, etc.
Capital Resources buildings, machines inthe factory, trucks or railroadadvertisements for transportation, desks andcomputers in the office, etc.
2. Productive resources are scarce because,at a zero price, there are not enough tosatisfy everyone's wants for them. This is onemain reason why prices exist to allocatethese resources to individuals.
3. Possible answers: a computer is more scarcethan a pen; oil is more scarce than water; askilled worker is more scarce than anunskilled worker.
4. Price is the primary clue. The more scarce aproductive resource is, the higher its price.For example, it costs more to buy acomputer than it does to buy a pen! Skilledlabor commands a higher wage thanunskilled labor. Oil costs more than water.
5. If Mr. Clews decides to raise cattle, hisopportunity cost is the money andsatisfaction he forgoes by not growing corn.Growing corn is his next best choice, i.e.,what he gives up.
6. See diagram in Unit 1Basic Instruction.
Answers toGrotuip Activity
Response Sheet
The eight items listed by each group will vary.
A. The group wants to take many different itemson the expedition, but space is limited. Thereis a scarcity of space.
B. Scarcity forces us to make choices.
C. Answers will vary.
D. The ninth item is the opportunity cost becauseit is what is not taken as a result of choosingthe eighth item. Even though there are otheritems to take, it is the ninth, or the next itemthat would be chosen, which is theopportunity cost. The opportunity cost is not
Answers toQuestfons for ffndilviduall
Project
the sum of all remaining items.
1. Answers will vary. Examples include water,land itself, trees, minerals, and air.
2. Answers will vary. Examples include allbuildings, docks, mines, wells, water towers,and railroads.
3. Examples of production could includefactories, farms, mines, fishing boats, andcattle ranches.
4. The opportunity cost of using some land forproducing a particular good or service iswhat is given up by not producing a differentgood or service. A farmer who uses his landto grow wheat gives up the income he couldgain by using the land to grow corn or raisecattle. A person who uses land for a factorygives up the opportunity to use the land forfarming. Producers must make choices howto use all of their productive resources,
.1

including land. These choices will alwaysentail opportunity costs.
5. The presence of factories, complex farmholdings, highways, etc., indicates that highlyskilled, and therefore highly productivelabor resources are present in the economy.These kinds of skills require high levels ofeducation and training.
6. There are many examples. If a town is locatednext to a lake or sea, inhabitants mightengage in fishing. If there is a natural harbor,shipping and commerce would be common.If flat, rich land is abundant, farming wouldbe prevalent. If the land is hilly, cattle andsheep might be raised. If there are abundantminerals, inhabitants would be engaged inmining.
Arrnswers toTest on Unfit 11
Concepts
1. Natural Resources: Steel, oil, aluminum, land,water, various chemicals, etc.
Human Resources: Workers who mine ironand mineral ores, assembly line workers,truck drivers, maintenance persons,accountants, secretaries, etc.
Capital Resources: All the necessary equipment,tools, machines, and buildings.
2. A resource or good is scarce if there is notenough to satisfy all the wants for it at a zeroprice. Because of scarcity, prices arenecessary to allocate resources and goods.
3. Gold is more scarce than water. A brainsurgeon is more scarce than a teacher. Atractor is more scarce than a shovel.
4. Price. A productive resource that has a lowprice (hammer) is less scarce than one thathas a higher price (drill press).
5. The benefits he gives up by not growing corn.Every economics decision has anopportunity cost.
6. See production diagram in Basic Information.
UNIT 1
4 conenffitc SuL117fivallg
Resoulces, Production, =IL Scarctty
Student Handouts

N . . . . ,
0/111A II1 01: Ax.NIA IP' WaMIONIS. itn, 11 I+ AnN a arum In ii %%JO/ WM).
IL A #01
IMP IMAr villnr VIII1,v n!, :..1:" --4,ii
Trading Around the World
Introducing Economics Into theMiddle School Curriculum
STUDENTS: As you study the history and geography of different countries of the world,you will have the opportunity to learn about the subject of economics. This is animportant subject that affects you in many ways. It also affects people living in countrieseverywhere. Understanding basic economics will help you understand the history andcultures of the many countries you will study this year.
HOW YOU WILL LEARN ECONOMICS: Your teacher will give you several economicunits during the year for you to do. Each unit has three parts. The first part is called theBasic Instruction, or BI. By studying this part you will learn basic economic concepts.
The second part of each economics unit is the Group Activity, or GA. The GA will giveyou practice applying concepts introduced in the BI. Your teacher will divide you intoseveral groups. You must complete the activity or activities as a group. Your group willreceive a Pass or Not Pass grade.
The last part of each economics unit is the Individual Project, or IP. You will be givenan assignment which you must complete yourself. You probably will receive a grade onthe project, so do your best work.
After you have completed the three parts of the economics unit, your teacher will giveyou a Mastery Test covering all the concepts you have learned.
,<1
II we

//a SU Oroh 4
pRIBIIII. 0.111/1111,..",411WNW II 11111JOI IMM41/
k .011111
UV/ \u/ Imo WOtr,
Basic Instruction (BI) Unit 1Economic Survival: Resources, Production, and Scarcity
Have you ever entered a large store like K-Mart and marveled at the thousands ofthings you can buy? Where did all of the products on the shelves come from? How didthey get there? Why are there certain kinds of products and not others? Who decideswhat price to charge? One thing is certain the products don't appear by accident. Theyhave to be produced, and then they have to be delivered to the store for you to buy. Thesubject of economics will help you understand how all this takes place.
Productive Resources: What We Need to Produce Goods and Services
What does it take to produce a product, such as a pair of blue jeans? Well, economistswill tell you that it takes resources, productive resources to be exact. That's a mouthful,but it's really not that difficult. There are three basic productive resources: naturalresources, human resources, and capital resources. Natural resourcesare things such as minerals, water, trees, and land itself. Several typesof natural resources are used to make a pair of jeans. It takes land togrow cotton. It takes metal for the zipper and snaps. Can you identifyany other natural resources needed to produce blue jeans?
Human resources, or labor, refer to the human effort and energyused in production. Think of all the kinds of human resources it takesto make a pair of jeans! Farmers, truck drivers, factory workers,secretaries, and many others all are important in the productionprocess.
Capital resources refer to the buildings, machines, tools, and equipment used inproduction. It takes an incredible amount and variety of capital to make a pair of jeans.In fact, it would be impossible to make blue jeans without using some kinds of capital.What kinds of capital would you need?
NaturalResources
The Production Process
Human CapitalResources Resources
= Goodsand Services
(Inputs) (Output)
12

Many economists also list a fourth basic productive resource entrepreneurship. Thisrefers to the skill, foresight, and determination it takes to start a business and produce aproduct. Entrepreneurs purchase natural, human, and capital resources and use them toproduce goods and services. The entrepreneur hopes that many consumers will buy thegoods and services so that he can make a profit.
Scarcity: There's No Such Thing as a Free Lunch (Or a Free Pair of Jeans!)
Why does it take money to get a pair of jeans? In fact, why does it take money to get justabout anything? The reason is that the productive resources used to produce goods andservices, including blue jeans, are scarce. Now this is a very important concept ineconomics. A good, service, or productive resource is scarce if there is not enough to satisfyall that people want at a zero price.
For example, how long do you think jeans would remain on the clothing racks at adepartment store if they were free? Right! Not very long! What about hammers, if theywere free? Right again! Not very long! Everyone would rush to get them. At a zero pricethere would not be enough for everyone to have all that they want. Blue jeans andhammers are scarce. Can you think of anything that is not scarce?
Because jeans and hammers are scarce, people are willing to pay to get them. It's a goodthing, too. The money that people pay for the jeans is what motivates the entrepreneurto produce them. After all, the entrepreneur could produce other things with hisproductive resources, like tennis shoes, or bow ties, or maybe tents for camping.
Opportunity Cost: Every Choice Has One!
Economists have invented another fancy term you need to know opportunity cost.When you make a decision, your opportunity cost is the value of your next bestalternative. For a producer, the opportunity cost of producing a particular good orservice is what is given up by not producing another.
Suppose that an entrepreneur named Mr. Jones believes that blue jeans and tennisshoes are two products that consumers really want to buy. However, because theproductive resources needed to produce blue jeans and tennis shoes are scarce, Mr.Jones cannot produce both. If he produces tennis shoes he cannot produce blue jeans.The blue jeans would be his opportunity cost. If he decides to produce blue jeans, thenhe cannot produce tennis shoes. Tennis shoes would be his opportunity cost. It'simportant to realize that there is an opportunity cost to every producer's decision.
00
More Or Less Scarce; Why Michael Jordon is a Millionaire
One more point and then you can get busy and answer the questions. Even though allproductive resources are scarce, some are more scarce than others. This is pretty muchcommon sense. Oil is more scarce than sand. A doctor is more scarce than a factoryworker. A tractor is more scarce than a hammer. As you might guess, the more scarcesomething is, the more it costs. A productive resource that is very scarce has a higherprice than one that is not very scarce. This is why the owners of the Chicago Bulls payMichael Jordan so much for his labor as a basketball player. His talent is very scarceindeed.
Well, that's enough for now. Here are the key points to remember:
KEY POINTS TO REMEMBER!
1. All countries have scarce productive resources natural, human, and capital.Some resources are more scarce than others. The more scarce theresource, the higher its price.
2. All countries use scarce productive resources to produce goods and services.
3. There is always an opportunity cost when a country uses its productiveresources. The opportunity cost is the next best use for those resources.
14 17

Questions To Master1. In the blanks below, identify some of the productive resources used to produce the
desk or chair in which you are sitting.
Natural Resources Human Resources Capital Resources
2. In economics we learn that all productive resources are scarce. Explain what itmeans in economics for something to be scarce.
3. Some productive resources are more scarce than others. Give an example of oneproductive resource that is more scarce than another.
4. What is the primary clue that tells us whether one productive resource is more scarcethan another? Explain briefly.
5. Mrs. Rodman can use her productive resources to open a computer store or start apizza restaurant. If she decides to open the computer store, what is theopportunity cost of her decision? Explain briefly.
6. In the space below or on the back, carefully diagram the production process. Labelyour diagram correctly.

Group Activity (GA) Unit 1
Economic Survival: Resources, Production, and Scarcity
Survival In the Jungle!SITUATION: It is 1857 in England. You are very excited because your explorationgroup has just been selected by the English government to explore a remote jungleregion of Africa. Below is the message you received from the government outlining yourmission.
MISSION
Your group is hereby commissioned by Her Majesty the Queen to explore a remotejungle region of West Africa. We know there are native peoples there, but we are notsure if they will be hostile to outsiders. Your mission is to establish trading contactswith these people. You also should record natural resources and animal life found inthe region. The Queen also wants you to record information about importantgeographical features. Medical experts report that the climate is tropical, withconsiderable chances for illness and disease. Make every effort to insure the safereturn of group members.
YOUR GROUP TASK: Since space is very limited on the expedition, you must makesome difficult decisions about what supplies to take. Your group of explorers hasalready packed many important basic supplies, including food, tents, and basic clothing.Unfortunately, there now remains room for only eight more items. You must chooseeight items from the list below (a pack of items, such as a pack of six knives, counts asone item.)
Rifle with ammunition
compass
pistol with ammunition
a pack of pens andpaper
fishing equipment
LIST OF ITEMS:
ponchos (rain clothing)
clay pots
a pack of six knives
a pack of medicalsupplies
a pack of six machetes
a book entitled Treating Tropical Diseases
16
mosquito netting
colorful jewelry
a bundle of rope
burlap sacks
candles and flint
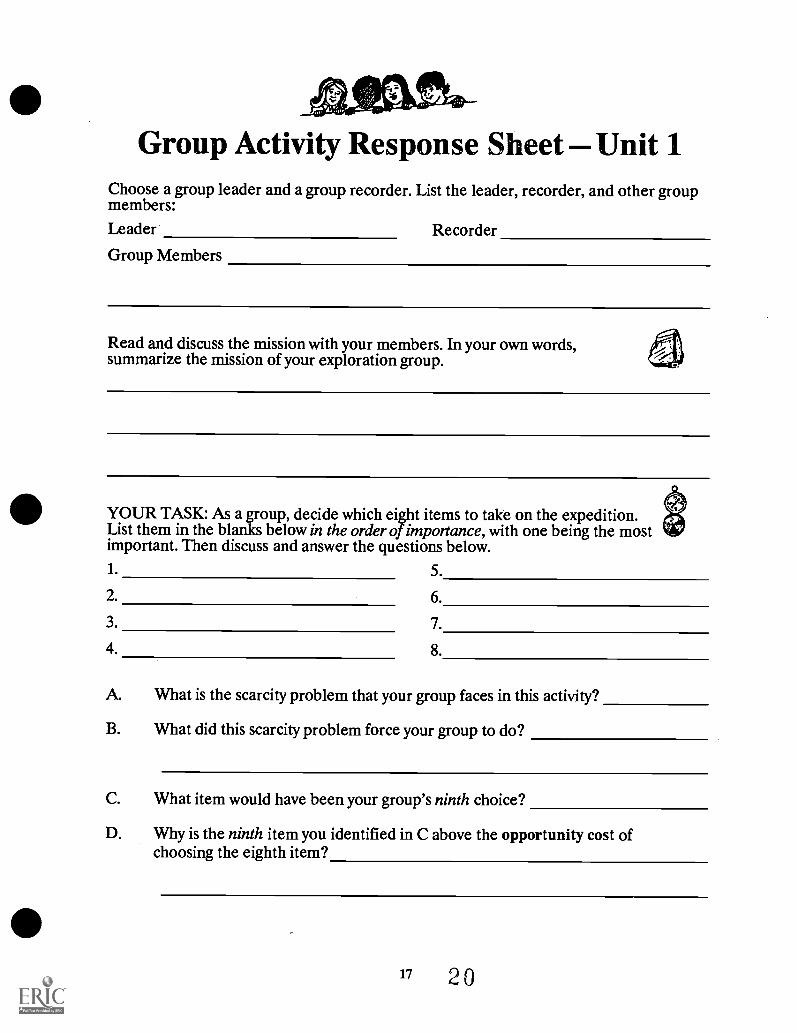
Group Activity Response Sheet Unit 1Choose a group leader and a group recorder. List the leader, recorder, and other groupmembers:
Leader
Group Members
Recorder
Read and discuss the mission with your members. In your own words,summarize the mission of your exploration group.
YOUR TASK: As a group, decide which eight items to take on the expedition.List them in the blan. ks below in the order of importance, with one being the mostimportant. Then discuss and answer the questions below.1. 5.
2. 6.
3. 7.
4. 8.
A. What is the scarcity problem that your group faces in this activity?
B. What did this scarcity problem force your group to do?
C. What item would have been your group's ninth choice?
D. Why is the ninth item you identified in C above the opportunity cost ofchoosing the eighth item?
17 2©

Individual Project (IP) Unit 1
Economic Survival: Resources, Production, and Scarcity
( CREATE A MAP)Project Description:
You should enjoy doing this Individual Project (IP). Your basic assignment is to draw amap of a town or village and its surroundings. This assignment will give you thechance to apply the economic and geographic concepts you have learned. Youalso will see how these concepts fit together.
Specific Project Tasks:
Task 1: Choose a particular real or imaginary country. Your teacher may require you topick a country or time period you have been studying.
Task 2: On a sheet of white paper create a map of a typical prosperous town or village inyour country. Also show the surrounding countryside. The area represented byyour map should not be more than 100 square miles. You must follow the specificdirections below very carefully!
Task 3: Answer the "Questions for Individual Project" worksheet and turn it in withyour map.
Specific Directions For Your Map:
a. Your map must have a title, scale, compass symbol, and legend (key) explaining mapfeatures.
b. Your map must have various kinds of features. You must have at least one kind ofwater feature, such as river, harbor, or lake. Also show other features such asroads, wells, water towers, swamps, hills, forests, buildings, factories, railroads,mines, or hospitals.
c. Use color to identify features and make your map more attractive.
d. Place your features logically, thinking how geography and economic factors fittogether. For example, you wouldn't have a factory or grain elevator where therewas no transportation (roads, railroad, river). You probably wouldn't put a watertower in a level area if there was a hill close by that would result in better waterpressure. You wouldn't place a mine in the middle of a swamp.
2118
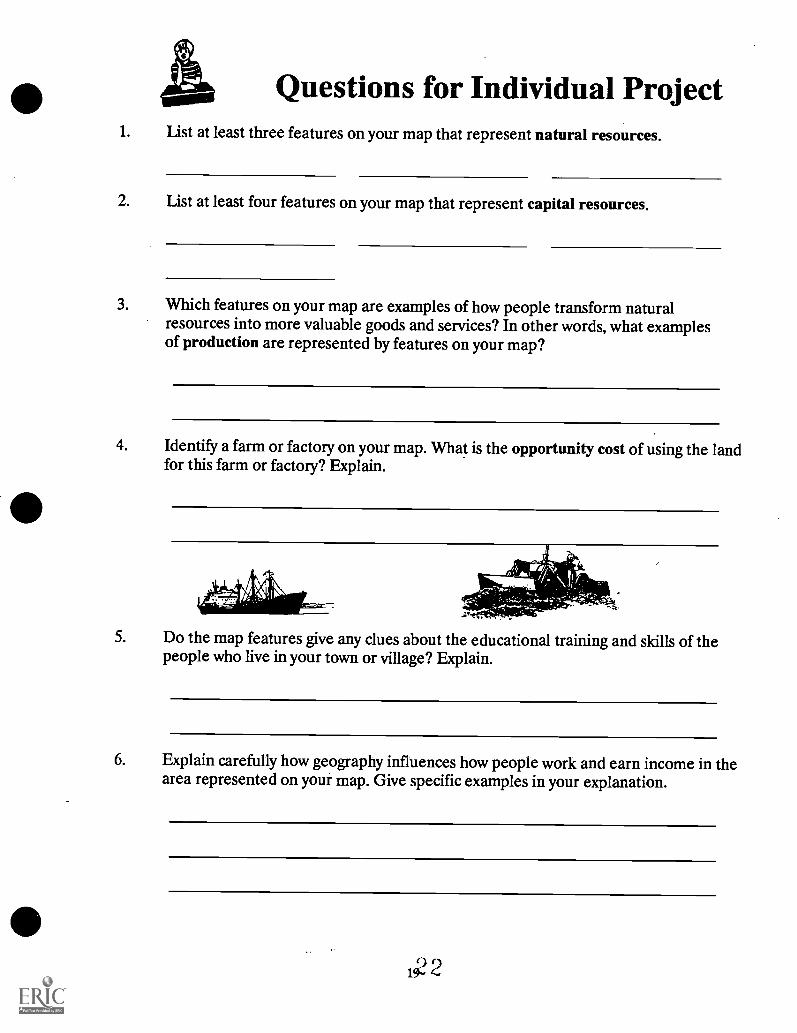
Questions for Individual Project1. List at least three features on your map that represent natural resources.
2. List at least four features on your map that represent capital resources.
3. Which features on your map are examples of how people transform naturalresources into more valuable goods and services? In other words, what examplesof production are represented by features on your map?
4. Identify a farm or factory on your map. What is the opportunity cost of using the landfor this farm or factory? Explain.
5. Do the map features give any clues about the educational training and skills of thepeople who live in your town or village? Explain.
6. Explain carefully how geography influences how people work and earn income in thearea represented on your map. Give specific examples in your explanation.
2

Test On Unit 1 Concepts1. In the blanks below, identify some of the productive resources used to produce a car.
Natural Resources Human Resources Capital Resources
2. In economics we learn that all productive resources and all goods and services arescarce. Explain what it means for something to be scarce.
3. Some productive resources are more scarce than others. Give an example of oneproductive resource that is more scarce than another.
4. What is the primary clue that tells us whether one productive resource is more scarcethan another? Explain briefly.
5. Mr. Clews can use his scarce land either to grow corn or to raise cattle. If he decides toraise cattle, what is the opportunity cost of his decision? Explain briefly.
6. In the space below or on the back, carefully diagram the production process. Labelyour diagram correctly.
03
UNIT 2
Warlitmg zffild ITAfivfilln4 r2ogether,he DaTmillentauce a: amde
Teaching Instructions
24

Teachfing Ermstillzetiiams Unfit 2
Working an Living Together: The Importance of Trade
Teaching Objectives:Students will:1. Explain why individuals and countries
specialize in the production of goods andservices.
2. Explain how specializing and then tradingbenefit individuals and countries.
3. Understand that voluntary trade benefits bothparties in a transaction.
4. Explain how specialization and trade result ingreater interdependence.
5. Understand how quotas and tariffs are barriersto trade.
6. Identify countries that export goods to theUnited States and identify the specific goodsthat are exported.
Teaching the Economic Concepts:There are several key points to emphasize whileteaching the economic content of Unit 2.
1. Specialization One key point is thatgeography and climate greatly influenceproduction choices, leading countries tospecialize in those products that can beproduced most efficiently. By specialising inwhat it produces efficiently, and then tradingwith other countries to obtain what it cannotproduce as efficiently, a country greatlyincreases the goods and services available toits citizens. Without trade everyone would bemuch poorer. Admittedly, self-sufficiencygrants a person or country a measure ofindependence, but it does not result in themost efficient use of productive resources.
2. Mutual Benefits of Trade Another crucialpoint to emphasize is that voluntary tradebenefits both parties in a transaction. Thereis not a winner and a loser. Both partiesgain, otherwise they would not trade in thefirst place. Point out that we are assumingthat both trading parties have accurateinformation about the goods being traded.For example, if you purchase a hair dryerand it is defective and carries no warrantee,
you certainly have not benefited from thistrade. This sometimes happens. However,when the parties in the trade have accurateinformation, trade is mutually beneficial.
3. Interdependence Another key point toemphasize is the increasing interdependenceof countries in today's world. This hasoccurred largely because of tremendousadvances in technology, especiallycommunication and transportationtechnology. Consider how much thetelephone and the computer have affectedtrade. Business people now know almostinstantly the prices of global competitors'new products, the prices of importantproductive resources, changes ingovernment policies, or whether asalesperson across the globe has beensuccessful in making a sale. Goods aretransported rapidly around the world usingmodern highways, super tankers, and jetairplanes. These trends have accelerated thepace of specialization and trade, andtherefore have increased globalinterdependence.
4. Free Trade Some students may feel that freetrade among nations is not beneficial sincesome Americans will lose their jobs. Pointout that it is true that some workers inparticular industries which do not remaincompetitive will lose jobs. However,economists have shown that free tradecauses standards of living to rise and that thesociety as a whole benefits. Individuals andcountries constantly must seek to producethose goods and services that they canproduce most efficiently. They must remaincompetitive in world markets. This maymean ceasing or reducing the production ofone type of good or service and beginning orincreasing the production of another. Thissometimes results in hardship on the part ofsome workers, and that is why the issue offree trade is controversial.
Teaching Su estions:1. Introduce this unit by using the WHERE IN
THE WORLD? transparency. Havestudents guess the home country of the listedcompanies.
2. Make sure your students thoroughlyunderstand the GROUP TASK directionsbefore beginning group work. Some teachersmay prefer discussing questions 11- 15 onthe Group Activity Response Sheet with thewhole class.
3. You may wish to have each group membercomplete the Group Activity ResponseSheet.
Required Material's:1. You will need a world map to put on a bulletin
board. Each group needs 10 colored pins,each group having a different color. If youcan write on your map with different colorederasable markers, then the colored pins andbulletin board are not necessary.
24
2. For the IP, students need access to referencebooks or database software which providebasic information and simple trade data onvarious countries.
Extending the Unit:"Trade," Lesson 6 in Play Dough Economics.
Return to Mocha video and accompanyingteaching activities.
The teaching activity Islands of Trade, in"International Marketplace," an issue of theElementary Economist.
"Reliance Alliance," Lesson 89 in Worldways:Bringing the World into the Classroom.
"World of Food," Lesson 45 in Worldways:Bringing the World into the Classroom.
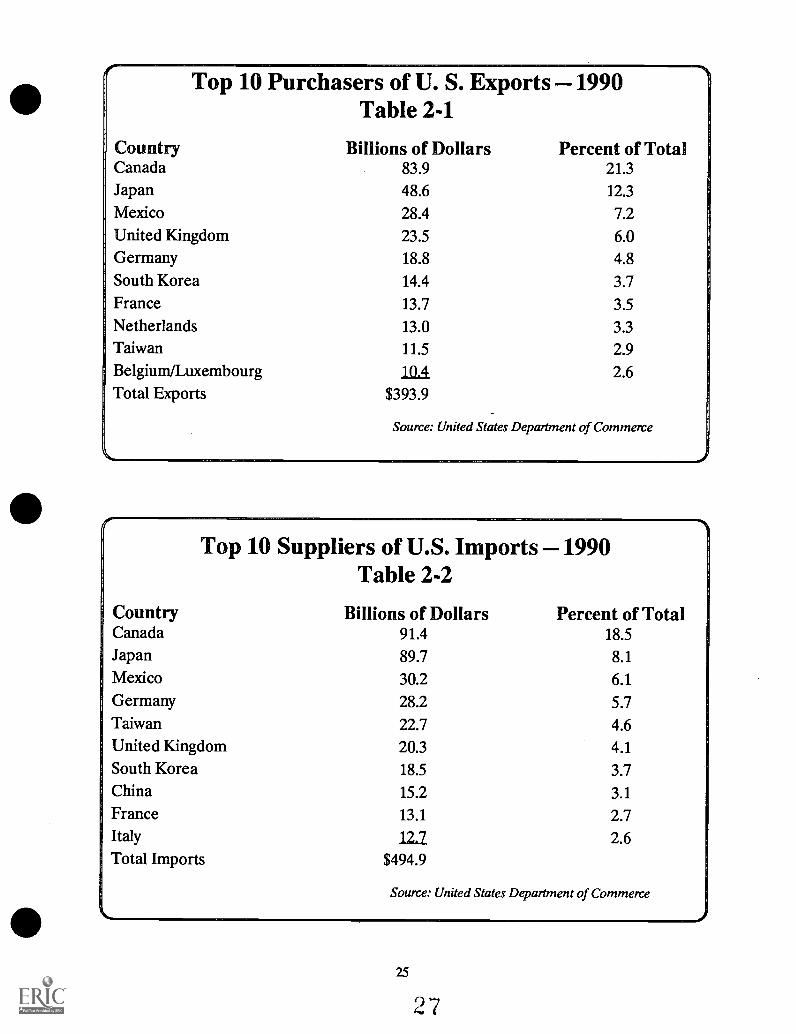
Top 10 Purchasers of U. S. Exports - 1990Table 2-1
Country Billions of Dollars Percent of TotalCanada 83.9 21.3Japan 48.6 12.3
Mexico 28.4 7.2United Kingdom 23.5 6.0Germany 18.8 4.8South Korea 14.4 3.7France 13.7 3.5Netherlands 13.0 3.3Taiwan 11.5 2.9Belgium/Luxembourg 1114 2.6Total Exports $393.9
Source: United States Department of Commerce
Top 10 Suppliers of U.S. Imports a 1990Table 2-2
Country Billions of Dollars Percent of TotalCanada 91.4 18.5Japan 89.7 8.1Mexico 30.2 6.1
Germany 28.2 5.7Taiwan 22.7 4.6United Kingdom 20.3 4.1
South Korea 18.5 3.7China 15.2 3.1France 13.1 2.7Italy 11.2 2.6Total Imports $494.9
Source: United States Department of Commerce
25

AVM .11t/'' 4%%
1111111a, NM nisial...."--3aum lli, 11 it 1l /I/ %%MP
il.1,0A11
U,, 11A.M/ 111111/./ Inti WHERE IN THE WORLD?
What Are the Home Countries of These Companies?
Nestle Volvo
Shell Sony
Lipton Magnavox
Baskin-Robbins Tropicana
Green Giant TV Guide
Firestone CBS Records
Ragu Vaseline
Friskies Bayer
Nike Chicken of the Sea
Hardees
26
28

Answeirs
SSA .IIM I,Ola II AU"
..077A%4111LIIIII4114-. A,0111%
ellf110M1111 R1111..._,,,ISIWO II AI WI /ON SIAM/MP SUNS %WO 11111110
Answers toWHERE IN THE
WORLD?
NestleSwitzerlandVolvo SwedenShellNetherlands/Great BritainSonyJapanLipton Great BritainMagnavoxNetherlandsBaskin-RobbinsGreat BritainTropicana (fruit juices) CanadaGreen Giant Great BritainTV GuideAustraliaFirestone JapanCBS RecordsJapanRagu Great Britain/NetherlandsVaselineGreat Britain/NetherlandsFriskies Switzerland (owned by Nestle)Bayer GermanyNikeUnited StatesChicken of the Sea IndonesiaHardees Canada
c7xAnswers to
Questions toMaster Worksheet
1. When individuals or countries specialize, theyconcentrate their work efforts in producing afew types of goods or services, instead ofproducing a wide variety of different types ofgoods or services.
2. Japan specializes in electronics andautomobiles, Argentina in producingagricultural products, and Iceland inproducing (catching) fish. There are manyexamples.
3. Why individuals specialize:a.) A person might enjoy producing aparticular good or service.b.) A person may have a special talent orskill in producing a particular good orservice.
estfions lErm -ink 2
27
0 04,
Why countries specialize:a.) Geographic influences, such as kinds ofnatural resources or type of terrain.b.) Climatic influences, such as weatherpatterns.c.) Educational and skill level of humanresources.
4. To be interdependent means depending onother individuals or countries to provide thegoods and services you want. For example, asick or injured person goes to the doctor,who has the knowledge and skill to help oneget well. The doctor, in turn, depends onother people to provide the goods andservices he needs.
The same principal is true for countries. TheUnited States depends on Brazil for coffeeand shoes. Brazil depends on the UnitedStates for computer equipment andchemicals.
5. Exports: goods sold to other countries.
Imports: goods purchased from othercountries.
Tariff: a tax levied on imports.
Quota: a specific limit on the number ofimports that may enter a country.
6. Answers will vary. Use this question to helpstudents consider what skills or aptitudesthey may have, and what type of work theymay enjoy.
Answers toGroup Activity
Response SheetThe answers to some of these questions may bedifficult for your students. However, thequestions will force students to think carefullyabout new ideas and issues. Don't expect perfectanswers. Use the questions to challenge yourstudents to think.
1-10. Students will fmd articles of clothing anditems from all over the world.

11. Geography and climate greatly influence whata country produces. A sweater may comefrom Scotland because the hilly land andrelatively mild climate are ideal for raisingsheep. However, students will discover thatwool sweaters may come not from Scotland,but from Asian countries such as China,Taiwan, Korea, and other countries notnoted for sheep and wool production! Whyis this? It is because low cost, labor notnatural resources provides the greatadvantage. These countries can purchasewool from other countries who specialize insheep production (Scotland?) and thenmake the sweaters themselves. This isespecially possible today, with the incredibleadvances in information and transportationtechnology. Countries today are less and lessconstrained in their production by thenatural resources defined by their physicalgeography.
12. Some patterns may emerge. For example, nogoods at all may come from certain parts ofthe world. Electronic equipment may comemostly from Asian countries such as Taiwan,Japan, Korea, or Singapore. Shoes maycome from Brazil, Taiwan, Italy, or Korea.
13. In economics, we learn that when two partiestrade, both benefit. Each exchangessomething he values less for something hevalues more. Both are better off after thetrade. (Of course, one assumes accurateknowledge on the part of the traders.) Thus,if a student purchases a sweater produced inKorea, the student is better off, since he orshe gets a sweater, and the Korean companyand other retailers are better off since theyhave made a sale.
14. The correct answer is more. By specializing inproduction and then trading to get productswe don't produce ourselves, we becomewealthier, yet more dependent on othercountries.
15. Being dependent is helpful since countriesbecome wealthier through trade. Also, whencountries are greatly dependent on eachother through trade, it lessens the chancesfor disputes turning into war. There are
possible disadvantages, however. When acountry is dependent on another country, it
Answers toQuestions for
Endividuzi Projectmay find itself without key products andresources if war occurs. Or, a country maybe faced with huge and sudden priceincreases in key products, such as oil.
PART I: What's In A Name
A. Names from the telephone directory will vary.
B. The exact definition will vary depending on thedictionary. Below is the type of workassociated with each name.1. Chamberlain attendant or chief officer
2. Cooper person who repairs or makeswooden casks or tubs
3. Fletcher maker of arrows4. Wright someone who works with wood,
usually in shipbuilding
5. Mason a worker who lays stone or brick
6. Chandler a maker or seller of candles
7. Scrivner someone who copies or writes.
PART II: Country Display
Make sure students have completed each part ofeach assigned task. It is easy to forget to do oneof the tasks.
Questions A.-F. answers will vary depending onthe country chosen. Question C. could presentsome difficulty. Most answers will identify theproductive resources that enable a country toproduce certain goods and services veryefficiently. For example, the climate, soil, andexpertise of Brazilian farmers are what influenceus to trade with Brazil for coffee. Brazilproduces coffee more efficiently than the UnitedStates, so we trade what we produce efficientlyfor Brazilian coffee. Location is also a factor. Forexample, one reason the United States tradeswith Mexico and Canada is their proximity.
3028

Answers toTest on Unit 2
Concepts1. When a country specializes, it produces only
certain kinds of goods and services, those itcan produce most efficiently. The countrydoes not try to be self-sufficient. Japanspecializes in electronic equipment,Germany in chemicals, Brazil in coffee, etc.
2. Japan specializes in electronic equipmentbecause it can produce this equipmentefficiently, that is, it has a cost advantage(comparative advantage) in producingelectronic equipment. This is because Japanhas the productive resources that give it acost advantage especially skilled labor andsophisticated capital.
3. The statement is true. Specialization and tradeforce countries to depend on other countriesfor many different goods and services.
4. Imports: goods purchased from othercountries.
Exports: goods sold to other countries.
Tariff: a tax levied on imports.
Quota: a specific limit on the number ofimports that may enter a country.
5. The United States trades with Japan, Brazil,Argentina, Canada, and many others. Majorproduct answers will vary.
29
31

UNIT 2
Wonlifing wild ::,tvfin.: `12egethenn
_11-a.dehe ffmipartienace o:11
,Th
Student Handouts
IA 1 L' AN./NA, .IIII /// 41IL
OMR, oh lima mmiau,-aaMLA .111111
MM. 11 is 1111.141 WM/IMF Vas sip/ IMO% Basic Instruction (BI) Unit 2
Living and Working Together: The Importance of Trade
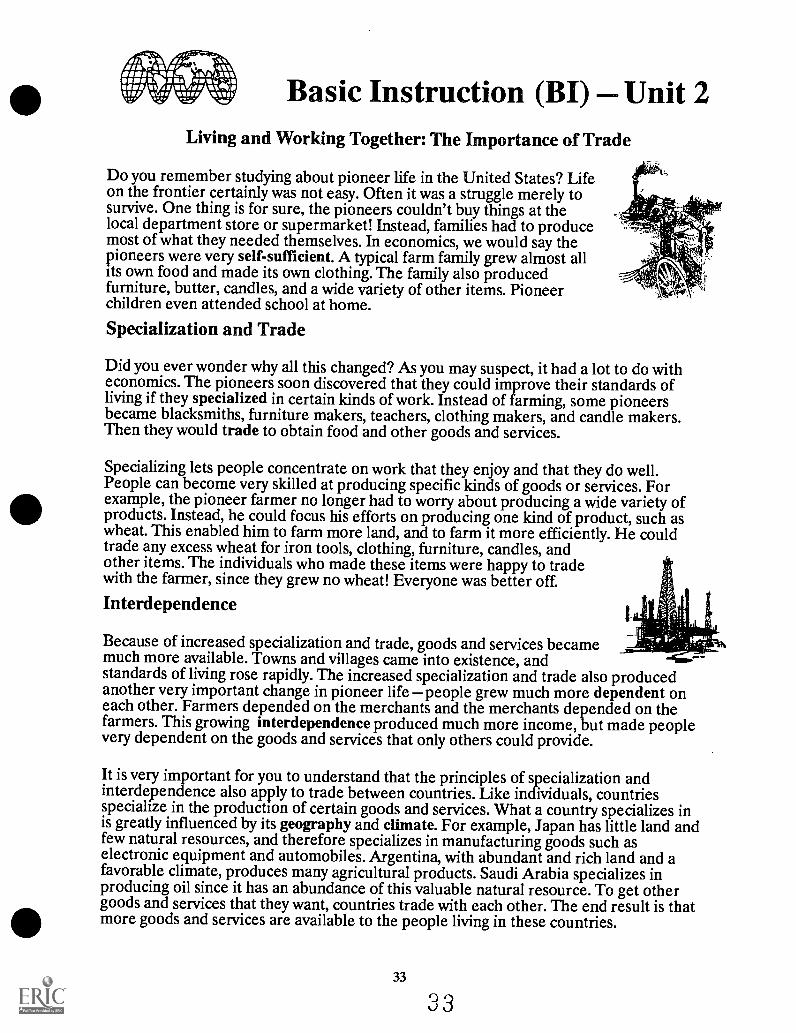
Do you remember studying about pioneer life in the United States? Lifeon the frontier certainly was not easy. Often it was a struggle merely tosurvive. One thing is for sure, the pioneers couldn't buy things at thelocal department store or supermarket! Instead, families had to producemost of what they needed themselves. In economics, we would say thepioneers were very self-sufficient. A typical farm family grew almost allits own food and made its own clothing. The family also producedfurniture, butter, candles, and a wide variety of other items. Pioneerchildren even attended school at home.
Specialization and Trade
Did you ever wonder why all this changed? As you may suspect, it had a lot to do witheconomics. The pioneers soon discovered that they could improve their standards ofliving if they specialized in certain kinds of work. Instead of farming, some pioneersbecame blacksmiths, furniture makers, teachers, clothing makers, and candle makers.Then they would trade to obtain food and other goods and services.
Specializing lets people concentrate on work that they enjoy and that they do well.People can become very skilled at producing specific kinds of goods or services. Forexample, the pioneer farmer no longer had to worry about producing a wide variety ofproducts. Instead, he could focus his efforts on producing one kind of product, such aswheat. This enabled him to farm more land, and to farm it more efficiently. He couldtrade any excess wheat for iron tools, clothing, furniture, candles, andother items. The individuals who made these items were happy to tradewith the farmer, since they grew no wheat! Everyonewas better off.
Interdependence
Because of increased specialization and trade, goods and services becamemuch more available. Towns and villages came into existence, andstandards of living rose rapidly. The increased specialization and trade also producedanother very important change in pioneer life people grew much more dependent oneach other. Farmers depended on the merchants and the merchants depended on thefarmers. This growing interdependence produced much more income, but made peoplevery dependent on the goods and services that only others could provide.
It is very important for you to understand that the principles of specialization andinterdependence also apply to trade between countries. Like individuals, countriesspecialize in the production of certain goods and services. What a country specializes inis greatly influenced by its geography and climate. For example, Japan has little land andfew natural resources, and therefore specializes in manufacturing goods such aselectronic equipment and automobiles. Argentina, with abundant and rich land and afavorable climate, produces many agricultural products. Saudi Arabia specializes inproducing oil since it has an abundance of this valuable natural resource. To get othergoods and services that they want, countries trade with each other. The end result is thatmore goods and services are available to the people living in these countries.
33
33
Specialization and trade also make countries very dependent on each other. The UnitedStates depends on Japan for VCRs and televisions, on Brazil for coffee, and on theMiddle East for oil. These countries in turn depend on us for various products. Themore our world has grown and developed, the more interdependent it has become. Inthe future, it will be even more so.
It is an unavoidable fact of economics the more specialization and trade there is, themore people must depend on each other. One advantage of this is a much higher standardof living. Another advantage is that people who are dependent on each other are morelikely to cooperate with each other. Instead of using force when disputes arise, tradingpartners are more likely to solve their disputes peaceably.
Trade BarriersSometimes people complain about trade. They say that too much trade causes workersto lose jobs. Therefore countries sometimes try to limit trade by creating trade barriers.The most common types of trade barriers are tariffs and quotas. A tariff is a tax onimports. Imports are goods purchased from their countries. Exports are goods we sell toother countries. A quota is a specific limit placed on the number of imports that mayenter a country.
Should countries create trade barriers that limit trade? People often disagree on thisquestion. It is true that some workers in certain industries may be hurt by trade. Forexample, some American clothing workers have had to change jobs during the past 20years because many clothes now are imported from other countries. However, this tradeallows Americans to buy quality clothing imports at good prices. This results in a higherstandard of living for the United States and for our trading partners. For this reason,most economists agree that it is good to let countries trade as much as possible.
KEY POINTS TO REMEMBER!
1. When individuals and countries specialize, more goods and services areproduced.
2. When individuals and countries specialize, they must trade to obtain thedifferent kinds of goods and services they want.
3. Specialization and trade always cause individuals and countries to be moredependent on each other.
4. Countries sometimes try to limit trade to protect the jobs of some workers.However, most economists believe that it is best to let countries tradeas much as possible.
343 4
Questions To Master1. What does it mean for an individual or country to specialize in the production of
goods or services?
2. Give an example of a country specializing in the production of a good or service.
3. Give two reasons why individuals or countries specialize in the production ofcertain goods and services.
a.
b.
4. What does it mean to be interdependent? Give an example.
5. Define these terms:
a. Exports:
b. Imports:
c. Tariff:
d. Quota:
6. What type of work would you like to specialize in after you are finished with highschool or college? Why?
,3535

Group Activity (GA) Unit 2
Working and Living Together: The Importance of Trade
LABEL SEARCH!
OVERVIEW: In this activity your group must conduct a "label search" in yourclassroom. This activity will help you realize how much we trade with other countries.The activity also will help you realize how much we benefit from trade.
YOUR GROUP TASK: Here's how to do your "label search."
Step 1: Choose a group leader and recorder. Each group member must search theclassroom and identify at least five articles of clothing or other items that havebeen produced in another country. (Try to identify clothing or items that havenot been identified by members of another group.) Use scrap paper to recordthe name of the items and the country. Be specific with your descriptions. Forexample, instead of recording just "coat," give a more precise response, suchas "John's blue coat."
Step 2: After your group members have conducted their search, meet together as a groupand complete the "Group Activity Response Sheet." Using your newlygathered information, list ten articles of clothing or items that have beenproduced in ten different countries.
Step 3: Using different colored pins or erasable markers, your group recorder shouldlocate each of your ten countries on the world map in your classroom. Theother group recorders will do likewise. (There will be more than one pin incertain countries.)
Step 4: Discuss and answer Questions 11-16.
36
Group Activity Response SheetLeader
Group Members
Recorder
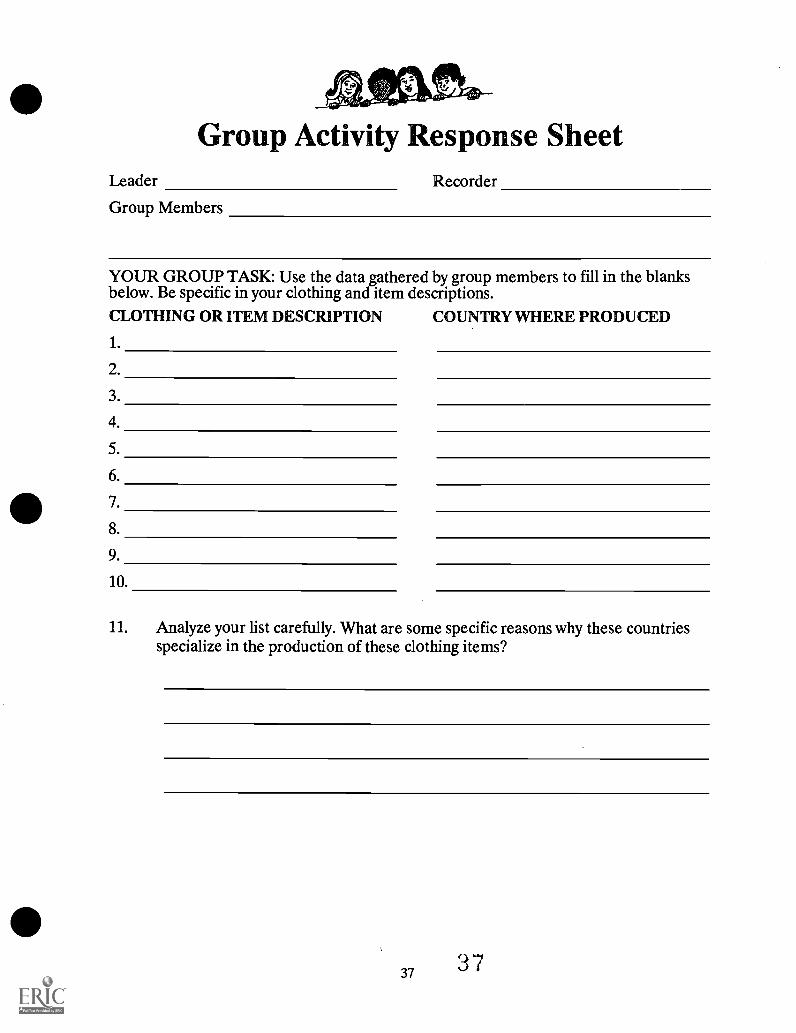
YOUR GROUP TASK: Use the data gathered by group members to fill in the blanksbelow. Be specific in your clothing and item descriptions.
CLOTHING OR ITEM DESCRIPTION COUNTRY WHERE PRODUCED
1.
2.
3.
4.
5.
6.
7.
8.
9.
10.
11. Analyze your list carefully. What are some specific reasons why these countriesspecialize in the production of these clothing items?
37 37
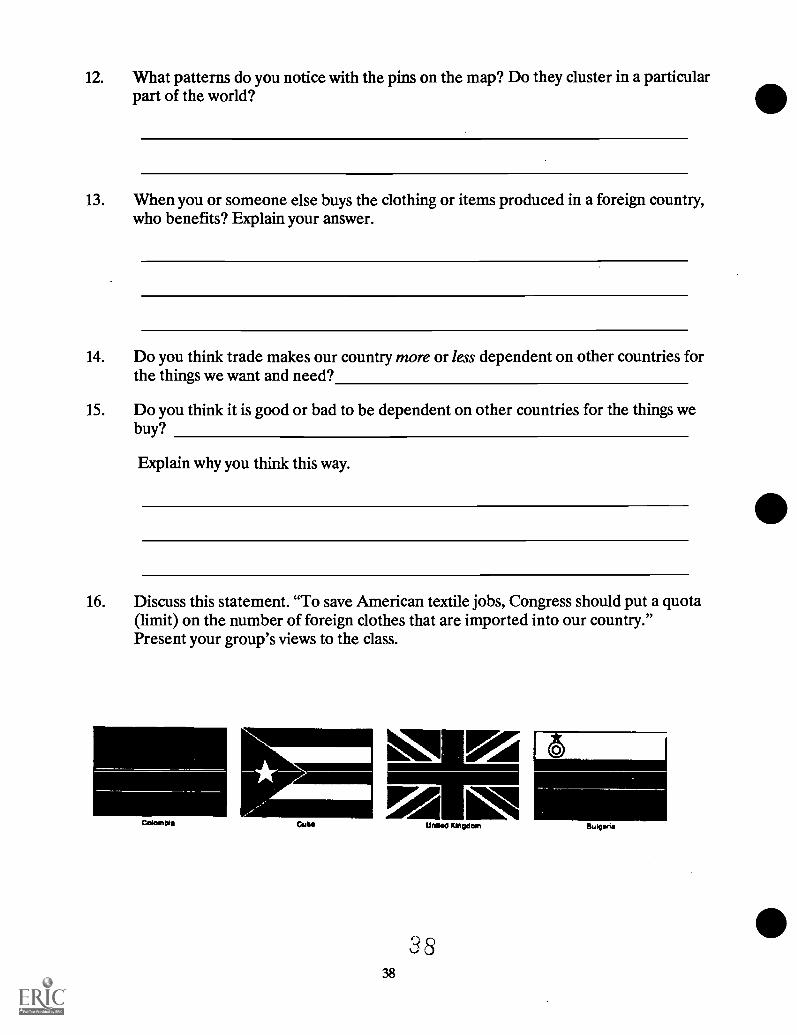
12. What patterns do you notice with the pins on the map? Do they cluster in a particularpart of the world?
13. When you or someone else buys the clothing or items produced in a foreign country,who benefits? Explain your answer.
14. Do you think trade makes our country more or less dependent on other countries forthe things we want and need?
15. Do you think it is good or bad to be dependent on other countries for the things webuy?
Explain why you think this way.
16. Discuss this statement. "To save American textile jobs, Congress should put a quota(limit) on the number of foreign clothes that are imported into our country."Present your group's views to the class.
Co11.
C.4106
111111
Uniie0 Kingdom Buiowis
Individual Project (IP) Unit 2Working and Living Together: The Importance of Trade
WHAT'S IN A NAME? and COUNTRY DISPLAY
Project Description:
This IP has two parts. In Part I you will search a phone directory to discover howmany names illustrate the jobs that people once did. In Part II, you will make adisplay/report about the products of a particular country. You will have toresearch the country on your own. Write neatly and do your best work. Use avariety of resource materials.
Specific Project Tasks:
Part I: WHAT'S IN A NAME. Complete the "What's In a Name?" worksheet. You willneed a telephone directory and a dictionary.
Part II: COUNTRY DISPLAY
A. Choose a country to investigate. Draw or copy a map of your country, also showingthe region of the world where your country is located. Identify the location of thecountry using the latitude and longitude grid system.
B. Make a display of at lease three important products that are produced by that country.You may bring actual products, pictures of products, or you may draw pictures ofproducts. You may want to make clay sculptures/models of typical products. Becreative! Make your display as colorful and as interesting as possible.
C. Label each product in your display. On each product label your teacher gives you,write a brief description of the product and explain why the country specializes inthe production of the product. On the label also list some of the differentproductive resources that are used to produce the product. Put an asterisk (*) bythe productive resource that you think is the most scarce.
D. List some of the important trading partners of your country. Explain why yourcountry trades with these particular-countries (Hint: A country's location and itsproductive resources will give you some clues.)
E. Your display also must include at least one chart or bar graph; illustrating how yourcountry compares with other countries in the production of a particular product.You will have to use an encyclopedia or some other reference source to gatherthe data. You may include other charts and graphs in your display.
F. (Optional) Give a two- to five-minute oral presentation describing your display.
39

What's In A Name Worksheet
A. Search a phone directory to find eight names that represent the type of work thatpeople did. For example, Smith is a short form of blacksmith, someone whoworked with metal. Do not use any of the names found in Part B below. Use yourdictionary to help you if necessary.
1. 2.
3. 4.
5. 6.
7. 8.
B. Below are some names that represent the type of work that people did. Find the noun meaning ofthese words in a dictionary. In the blanks, identify the type of work associated with each name.
1. Chamberlain
2. Cooper
3. Fletcher
4. Wright
5. Mason
6. Chandler
7. Scrivener
40
40

:roduct: ]
of the productive resources
Mali Resources ital Resourc
41

Test On Unit 2 Concepts1. What does it mean for a country to specialize in the production of goods or services?
Give an example in your explanation.
2. Why does Japan specialize in producing electronic equipment like VCRs andtelevisions?
3. A famous economist once said, "Specialization and trade make our world moreinterdependent." Is this true or false? Explain your answer.
4. Define the following:
Imports:
Exports:
Tariff:
Quota:
5. List four countries that trade with the United States, and identify a major product thatwe get from each country.
Country Product
42 4 2

UNIT 3
Gilooss Domestfic ED11-achilcf,.
Mersimirtng the Hic©m ©:!) Haltom
Teaching Instructions
43

TeschilEng Ilimstralidflorms o Malt 3
Giros Domestfic Product:Memsuitrfing the Encome of Natilons
Product (GNP) as the primary means ofmeasuring national income/production. Thetwo measurements are roughly equal, andcan be considered so in this unit. GDP isnow used because it (1) is more consistentwith other indicators of United Stateseconomic performance (2) is the primarymeasure of production in most of the rest ofthe world, and (3) is easier to measure in atimely manner.
2. Ee cal versus Current (Money) GDP: PlayDough Economics Lesson 15, "GDP:Measuring What We Produce," teachesdifference between real and current GDP.The basic idea is that a country's currentGDP may increase, not because of anincrease in the production of goods orservices, but because of an increase in theprices of goods and services. Students needto know that they must use prices from aspecific base year in order to make validGDP comparisons. On graphs and chartsthat show real GDP the base year is usuallyindicated.
Unit Overview:
The most common measure of the income levels ofdifferent countries is Gross Domestic Product(GDP). A firm understanding of GDP will helpstudents in various social studies courses, and thisis why this entire teaching unit is devoted to it.
To teach the concept of GDP in this unit, youwill use Lesson 15 from the Play DoughEconomics curriculum. It is a motivating andconcrete way to learn this concept and yourstudents will enjoy it. The lesson is included inthis teaching unit.
Teaching Objectives:Students will:
1. Define Gross Domestic Product (GDP).
2. Understand how GDP is computed.
3. Understand how per capita GDP is computed.
4. Identify difficulties in using GDP to measureand compare income levels of countries.
5. Identify patterns in levels of GDP in countriesthroughout the world.
Teaching the Economic Concepts:
Below are some key points to emphasis as youteach this unit.
1. Computing GDP: GDP measures the marketvalue of the goods and services produced inan economy in a year. To avoid counting thesame production twice, economists use onlyfinal products in GDP calculations. Forexample, the flour used in making a loaf ofbread is not a final product, and the marketvalue of this flour is not counted in GDPcalculations. However, the flour's value iscaptured in the fmal price of the bread. Theflour that consumers purchase in asupermarket is a final good, and would becounted in GDP.
Important Note: Gross Domestic Product(GDP) recently replaced Gross National
3. Problems with Making Comparisons UsingGDP Data: Students should realize thatGDP data is rather imprecise, and must beused very carefully when makingcomparisons. These are some of the keypoints to mention:
a. GDP data is frequently very rough. Manycountries have inadequate or incomplete datacollection techniques. This is especially true indeveloping countries, where much economicactivity does not occur in developed marketswhere it can be counted easily. Thus, the GDPof developing countries tends to be relativelyunderstated compared to the GDP ofindustrial countries. For example, in 1990 theaverage per capita GDP in Ethiopia was $120,while in the United States it was $21,000.Although the average Ethiopian is very poorcompared to the average American, thedifference is not as extreme as these figuresindicate. One major reason is becauseEthiopian farmers consume much of what theyproduce. Their produce is not traded in the
4544

markets where it could (possibly) becounted.
b. Per capita GDP is an average measurement.It does not measure distribution of income ina country. As an extreme example, a countrywith a per capita GDP of $12,000 could havehalf of its population with an income of$20,000 and half with an income of only$4,000!
c. GDP is only a measure of material wellbeing, and not necessarily a measure ofhappiness. People who have less materialpossessions may in fact have a happier, morecontent life style than wealthy persons,although extreme poverty is an existence fewpeople would want.
4. Looking Ahead to the Next UnitThisteaching unit will end with students askingthe obvious question "Why are there suchgreat differences in GDP throughout theworld?" Units 4 and 5 will help studentsunderstand the answers to this difficult andperplexing question.
Teaching Suggestions:
1. Basic Instruction (BI):
a. When you use Play Dough EconomicsLesson 15 to teach GDP, you can omit thepart of the lesson which stresses thedifference between current GDP and realGDP. To do the GA and the IP students donot have to understand this difference.However, most students can understand realversus current GDP, and it is something youprobably will want to teach.
b. In this unit it is best to assign the Questionsto Master Worksheet after students havecompleted the Group Activity.
2. Group Activity (GA):
a. It is best if each student in the group is arecorder and completes a Group ActivityResponse Sheet.
b. Read the directions with your students.Groups must complete questions 1 to 4before receiving any play dough. Stress thatthe answers to questions 3 and 4 on theResponse Sheet should be logical. For
46
example, a low-income country wouldprobably not specialize in the production ofcommercial aircraft.
c. Students should use small amounts ofplay dough to make their products. Otherwisetoo much play dough is required.
d. In the discussion following the GA, makethe following points:
(1) The GDP of groups that were "high-income countries" was more than the GDPof the "low-income countries." Why?(Because the goods the HCs chose toproduce had much higher prices, reflecting ahigher value.)
(2) This exercise shows that GDP is an averagefigure. However, individuals within eachgroup that produced a lot would earn morethat those who did not! Income would not beevenly distributed.
e. For additional practice, create more GDPworksheets. Or, have your students createGDP problems and exchange them withtheir classmates.
3. Individual Project (IP):
a. Some students may want to do a similaractivity for other types of data listed in thedata tables. Let the students determine the"break points" for the color code. Studentsmay want to use more that just three colors.
b. Invite someone from another country to yourclassroom to discuss the lifestyle/incomedifferences between their country and theUnited States.
c. Have students bring articles from newspapersor magazines that mention GDP. Make abulletin board display using these articles.
Required Materials:
1. Each student will need play dough to make atleast four or five small goods. The followingrecipe makes a small bag of play dough:
45
Pllay Dough Recllpe1 cup flour 1/2 cup salt1 T. oil 2 t. cream of tartar1 cup water food coloring
Cook over medium heat until a ball forms.Knead in a large zip -lock bag for a few minutes.Remove air from bag and zip shut.
2. To do the IP, students will need blacklinemasters of the continent or region beingstudied. (This activity works best using amap of the world, using continents like Asia,which show a wide variety of low-, middle-,and high-income countries.) Students alsowill need colored pencils or crayons.
3. To receive current GDP data, request thebooklet, National Economic Trends, fromthe Federal Reserve Bank of St. Louis, P.O.Box 442, St. Louis, MO 63166. To receivedata about other industrial countries requestthe booklet, International EconomicConditions, from the same address.
Extending the Unit:1. Lesson 10, "Economic Growth," in Strategies
for Teaching Economics: Junior High SchoolLevel.
2. The Development Data Book, published by theWorld Bank.
3. PC Globe is a software database program thatgives students access to a multitude of dataabout all the countries of the world. It is anexcellent source for this unit. Available inIBM PC compatible, Macintosh, or AppleHg versions.
Iii,11,104101111k111.1111,117T-
li_ .7,411111.1,1'611,111i1.111i
I
..-
47 4 6
salmi RS Maly Dough EcOIMOMfiCS
GDP: Measluming What We 'ft-volume
Teaching Objectives:
1. To teach the meaning of Gross DomesticProduct.
2. To teach that real GDP, not money GDP, isthe more significant measure of GDP.
Economic Concepts/Vocabulary:
Gross Domestic Produce (GDP), Real GDP,Current (Money) GDP, Inflation
Time Allowed:
40-45 minutes
Materials:Enough play dough for each student to make twosmall sculptures
Discussiorra:
Gross Domestic Product (GDP) measures themarket value of all the goods and servicesproduced in the economy in a year. Economistsuse GDP data to measure the economy's growth.Historically, in the United States GDP has grownon average about three percent per year.
When GDP is computed using current dollarprices, it is referred to as money GDP, or currentGDP. The problem with using money GDP isthat inflation makes it difficult to determine howmuch real GDP growth has actually occurred.Money GDP may grow substantially, but thatgrowth may be primarily the result of higherprices, not of actual growth in the amount ofgoods and services produced. To compare realGDP growth from year to year, economistscompute GDP in terms of the dollar prices of aprevious base year.
Two shortcomings of GDP as a measure ofeconomic growth are that it does not measureincreases in leisure time (more holidays,vacations, shorter work hours, etc.) and itmeasures only market activity. Productive activity
48
done by families, such as housework or lawnwork, is not reflected in GDP.
Teaching Tips:
1. GDP may appear to be a rather complicatedconcept for middle school students. Actuallythe concept is rather simple, and studentswho perform this activity should gain a basicconceptual understanding without muchdifficulty.
Teaching Procedure:
1. Ask students if they would like to do aneconomics activity using play dough to learna concept that university students learn. Passout enough play dough for each student tomake two small sculptures.
2. Tell the students that the next five to eightminutes will represent all of 1992 (or thepresent year). During this time each studentmust produce two of the following goods:shirt, calculator, telephone, doll, book, orbasket of apples. Students can produce twodifferent types of goods if they wish.
3. After the production period, students mustplace their goods on a table in front of theroom. On the board, draw a GDPCalculation Chart. (See example below.)Write the names of the goods in the firstcolumn. Count how many of each good wereproduced, and write these totals in the"Number Produced" column.
4. Have the class estimate separate prices foreach type of the goods, and then write theprices in the "Price" column. Multiply thenumber of each good produced by the priceof the good (as decided by the class) tocomplete the "Revenues" column. Tocompute the GDP, add the last column.Explain what GDP means.
47
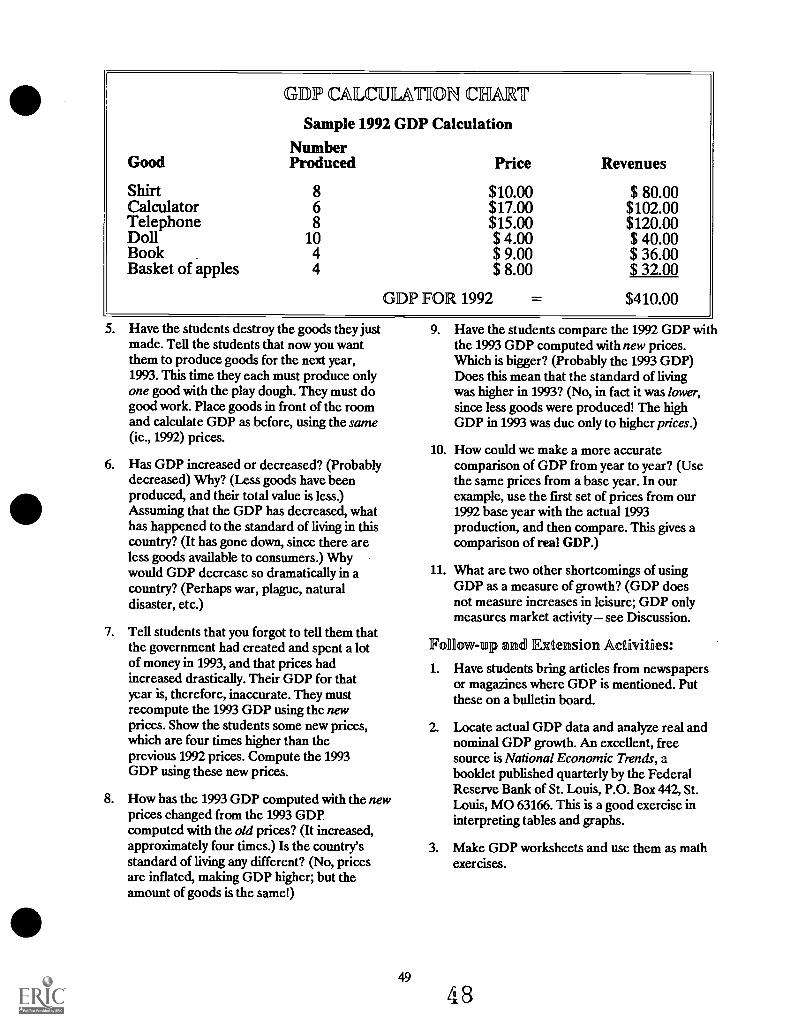
GDP CALCULATION CHART
Sample 1992 GDP CalculationNumber
Good Produced Price Revenues
Shirt 8 $10.00 $ 80.00Calculator 6 $17.00 $102.00Telephone 8 $15.00 $120.00Doll 10 $ 4.00 $ 40.00Book 4 $ 9.00 $ 36.00Basket of apples 4 $ 8.00 $ 32.00
GDP FOR 1992 = $410.00
5. Have the students destroy the goods they justmade. Tell the students that now you wantthem to produce goods for the next year,1993. This time they each must produce onlyone good with the play dough. They must dogood work. Place goods in front of the roomand calculate GDP as before, using the same(ie., 1992) prices.
6. Has GDP increased or decreased? (Probablydecreased) Why? (Less goods have beenproduced, and their total value is less.)Assuming that the GDP has decreased, whathas happened to the standard of living in thiscountry? (It has gone down, since there areless goods available to consumers.) Whywould GDP decrease so dramatically in acountry? (Perhaps war, plague, naturaldisaster, etc.)
7. Tell students that you forgot to tell them thatthe government had created and spent a lotof money in 1993, and that prices hadincreased drastically. Their GDP for thatyear is, therefore, inaccurate. They mustrecompute the 1993 GDP using the newprices. Show the students some new prices,which are four times higher than theprevious 1992 prices. Compute the 1993GDP using these new prices.
8. How has the 1993 GDP computed with the newprices changed from the 1993 GDPcomputed with the old prices? (It increased,approximately four times.) Is the country'sstandard of living any different? (No, pricesare inflated, making GDP higher; but theamount of goods is the same!)
9. Have the students compare the 1992 GDP withthe 1993 GDP computed with new prices.Which is bigger? (Probably the 1993 GDP)Does this mean that the standard of livingwas higher in 1993? (No, in fact it was lower,since less goods were produced! The highGDP in 1993 was due only to higher prices.)
10. How could we make a more accuratecomparison of GDP from year to year? (Usethe same prices from a base year. In ourexample, use the first set of prices from our1992 base year with the actual 1993production, and then compare. This gives acomparison of real GDP.)
11. What are two other shortcomings of usingGDP as a measure of growth? (GDP doesnot measure increases in leisure; GDP onlymeasures market activity see Discussion.
Follow -nip and Extension Activities:
1. Have students bring articles from newspapersor magazines where GDP is mentioned. Putthese on a bulletin board.
2. Locate actual GDP data and analyze real andnominal GDP growth. An excellent, freesource is National Economic Trends, abooklet published quarterly by the FederalReserve Bank of St. Louis, P.O. Box 442, St.Louis, MO 63166. This is a good exercise ininterpreting tables and graphs.
3. Make GDP worksheets and use them as mathexercises.
AnswarsAnswers to
Questions toMaster Worksheet
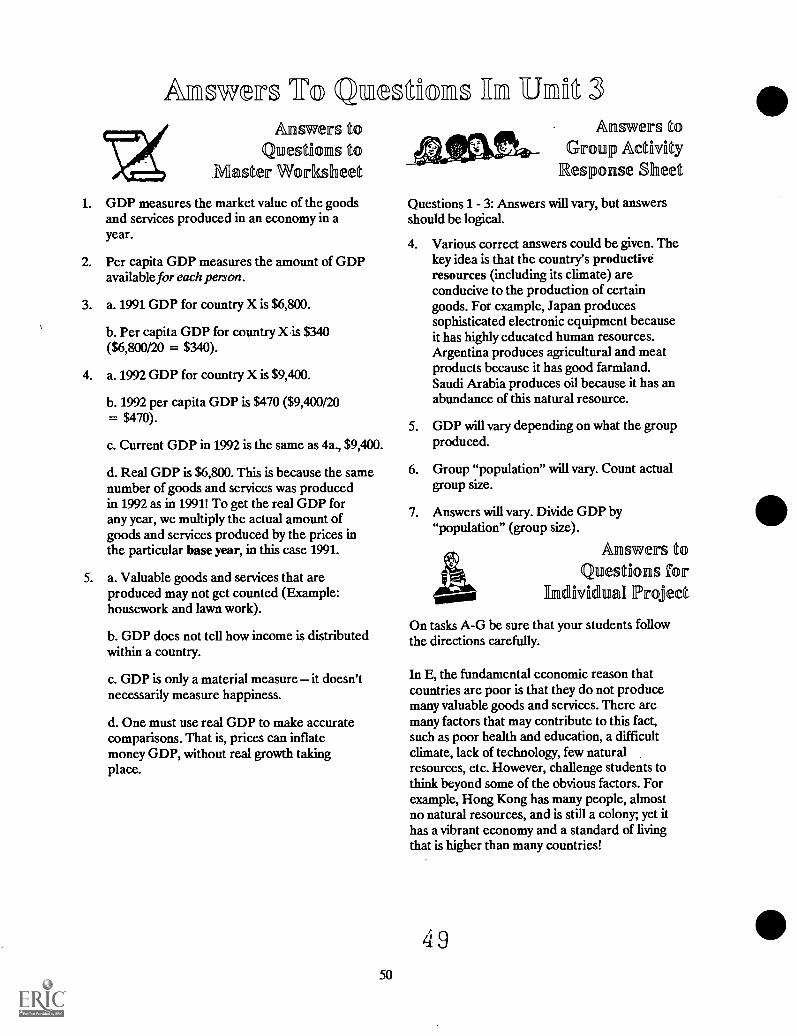
1. GDP measures the market value of the goodsand services produced in an economy in ayear.
ecttons 111 -JEER 3
2. Per capita GDP measures the amount of GDPavailable for each person.
3. a. 1991 GDP for country X is $6,800.
b. Per capita GDP for country Xis $340($6,800/20 = $340).
4. a. 1992 GDP for country X is $9,400.
b. 1992 per capita GDP is $470 ($9,400/20= $470).
c. Current GDP in 1992 is the same as 4a., $9,400.
d. Real GDP is $6,800. This is because the samenumber of goods and services was producedin 1992 as in 1991! To get the real GDP forany year, we multiply the actual amount ofgoods and services produced by the prices inthe particular base year, in this case 1991.
5. a. Valuable goods and services that areproduced may not get counted (Example:housework and lawn work).
b. GDP does not tell how income is distributedwithin a country.
c. GDP is only a material measure it doesn'tnecessarily measure happiness.
d. One must use real GDP to make accuratecomparisons. That is, prices can inflatemoney GDP, without real growth takingplace.
50
Answers toGroup Activity
Response Sheet
Questions 1- 3: Answers will vary, but answersshould be logical.
4. Various correct answers could be given. Thekey idea is that the country's productiveresources (including its climate) areconducive to the production of certaingoods. For example, Japan producessophisticated electronic equipment becauseit has highly educated human resources.Argentina produces agricultural and meatproducts because it has good farmland.Saudi Arabia produces oil because it has anabundance of this natural resource.
5. GDP will vary depending on what the groupproduced.
6. Group "population" will vary. Count actualgroup size.
7. Answers will vary. Divide GDP by"population" (group size).
Answers toQuestions for
Individual Project
On tasks A-G be sure that your students followthe directions carefully.
In E, the fundamental economic reason thatcountries are poor is that they do not producemany valuable goods and services. There aremany factors that may contribute to this fact,such as poor health and education, a difficultclimate, lack of technology, few naturalresources, etc. However, challenge students tothink beyond some of the obvious factors. Forexample, Hong Kong has many people, almostno natural resources, and is still a colony; yet ithas a vibrant economy and a standard of livingthat is higher than many countries!
49

NIAnswers t®
Test of 'net 3Concepts
1. GDP measures the market value of the goodsand services produced in an economy in ayear.
2. Per capita GDP measures the amount of GDPavailable for each person.
3. a. GDP of country Y is $5,100.
b. Per capita GDP of country Y is $170($5,100/30).
4. Country A has the higher per capitaGDP $240.
5. a. Valuable goods and services that areproduced may not get counted (example,housework and lawn work).
b. GDP does not tell how income isdistributed within a country.
c. GDP is only a material measure itdoesn't necessarily measure happiness.
d. One must use a base year (compute realGDP) to make accurate comparisons. Pricescan inflate GDP, without real growth takingplace.
6. Answers will vary.
UNIT 3
Gll© ameette ED11-®d uctMersErfing the :income a: NEtrions
Student Handouts
5L

siWsasavamein.M. In LkaillLW IL tal
1117 1W° " : Basic Instruction (BI) Unit 3
Gross Domestic Product: Measuring the Income of Nations
How do you measure how much income a person has? Typically we measure how muchmoney a person has. But money isn't really the most basic way to measure income, sincea person's money can be worthless unless there is something tobuy. For example, in Germany after World War I a person with 6trillion marks could only buy one loaf of bread! Money was soworthless that it was used as fuel to heat homes and cook food.
A more accurate way to measure a person's income is todetermine how many goods and services can be bought with themoney that a person has earned. After all, the reason we wantmoney is because it enables us to buy the goods and services wewant.
Similarly, when economists want to know the income of a certaincountry, the economists are interested in how many goods andservices are available to the people of the country. There is a special term thateconomists use to measure a country's income gross domestic product. Usually it isabbreviated GDP. Here is the important definition:
Gross Domestic Product (GDP) measures the market value of all final goods andservices produced in an economy in a year.
Cam Pao
(This definition isn't really as difficult as it may seem. Your teacher will do a classactivity to help you better understand what GDP means.) The United States GDPmeasures the dollar value of all the goods and services produced in our economy duringa year. As you can imagine, this is a pretty large amount. In the United States, forexample, the 1990 GDP was over 5.5 trillion dollars!
Per Capita GDP
GDP data helps economists compare the income levels of different countries. However,to make more accurate comparisons, economists use another term percapita GDP.
Per capita GDP measures the amount of GDP that is available for eachperson.
For example, suppose country A has a GDP of $5,000, and country Bhas a GDP of $2,000. In which country do the people have higher levelsof income and a higher standard of living? Answer: You can't really tellsince you don't know how many people live in the countries!
55
52

Suppose country A has a population of 50, while country B has a population of only 10.The average amount of GDP for each person in country A would be $100 ($5,000/50 =$100). The average amount available for each person in country B would be $200($2,000/10 = $20). Even though country B has a lower total GDP it has a higher percapita GDP.
Economists classify countries into groups according to income, or per capita GDP.High-income countries (HCs) have high standards of living with many goods andservices. These countries usually rely on manufacturing, although some high-incomecountries, like Kuwait, are wealthy because of huge oil reserves. Middle-incomecountries (MCs) and low- income countries (LCs) rely more on agriculture, and havelower standards of living. These countries are sometimes called Third World orDeveloping Countries.
Problems with GDP
Although GDP data is very helpful it is not a perfect measure of how wealthy a countryis. For one thing, certain valuable goods and services are not counted when figuringGDP. For example, GDP does not include the value of housework or lawn work done bya family. Or, in a developing country a poor farmer's family may eat practically all thefood produced on the farm. That food would not be counted as part of GDP.
Another problem with GDP is that it doesn't tell us how the income is distributed withina country. If a country has a per capita GDP of $8,000 a year, this doesn't mean thateveryone earns that much income. It means that $8,000 is the average income. In thiscountry, some people could be very rich, while others could be very poor.
Also, GDP only measures material wealth. It is not a measure of genuine happiness orcontentment. People who have much wealth are not always happier than those who haveless. Perhaps you know someone who has a lot of money, but who is not very happy.
Gross Domestic Product (GDP) is probably a new concept for you. At first, it may bedifficult to understand, but it is a very important concept to learn. GDP helps us tounderstand the different standards of living of people throughout the world.
Key Points to Remember:
1. Gross Domestic Product (GDP) measures the market value of the goodsand services produced in a country in a year.
2. Per capita GDP measures the amount of GDP that is available for eachperson.
3. GDP is not a perfect measure for making comparisons. Valuable servicessuch as housework or lawn work are not counted. GDP doesn't measurehow income is distributed in a country, and GDP isn't necessarily ameasure of happiness.
56 53
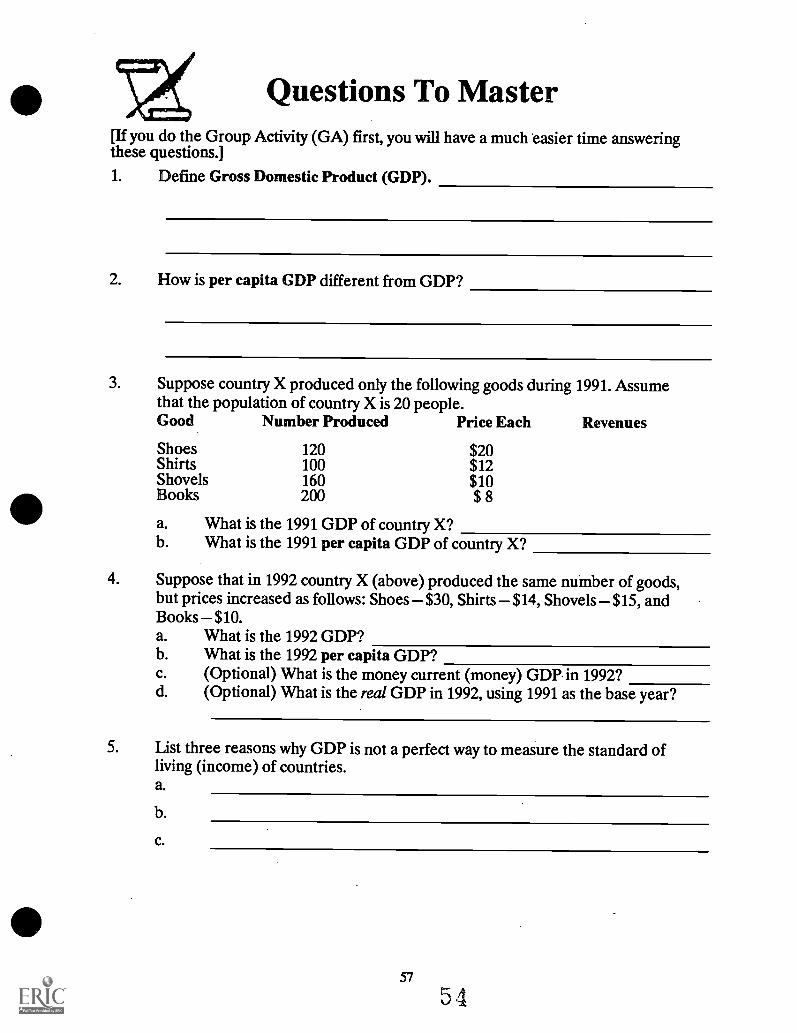
Questions To Master[If you do the Group Activity (GA) first, you will have a much easier time answeringthese questions.]1. Define Gross Domestic Product (GDP).
2. How is per capita GDP different from GDP?
3. Suppose country X produced only the following goods during 1991. Assumethat the population of country X is 20 people.Good Number Produced Price Each Revenues
Shoes 120 $20Shirts 100 $12Shovels 160 $10Books 200 $ 8
a. What is the 1991 GDP of country X?b. What is the 1991 per capita GDP of country X?
4. Suppose that in 1992 country X (above) produced the same number of goods,but prices increased as follows: Shoes $30, Shirts $14, Shovels $15, andBooks $10.a. What is the 1992 GDP?b. What is the 1992 per capita GDP?c. (Optional) What is the money current (money) GDP-in 1992?d. (Optional) What is the real GDP in 1992, using 1991 as the base year?
5. List three reasons why GDP is not a perfect way to measure the standard ofliving (income) of countries.a.
b.
c.
57
54
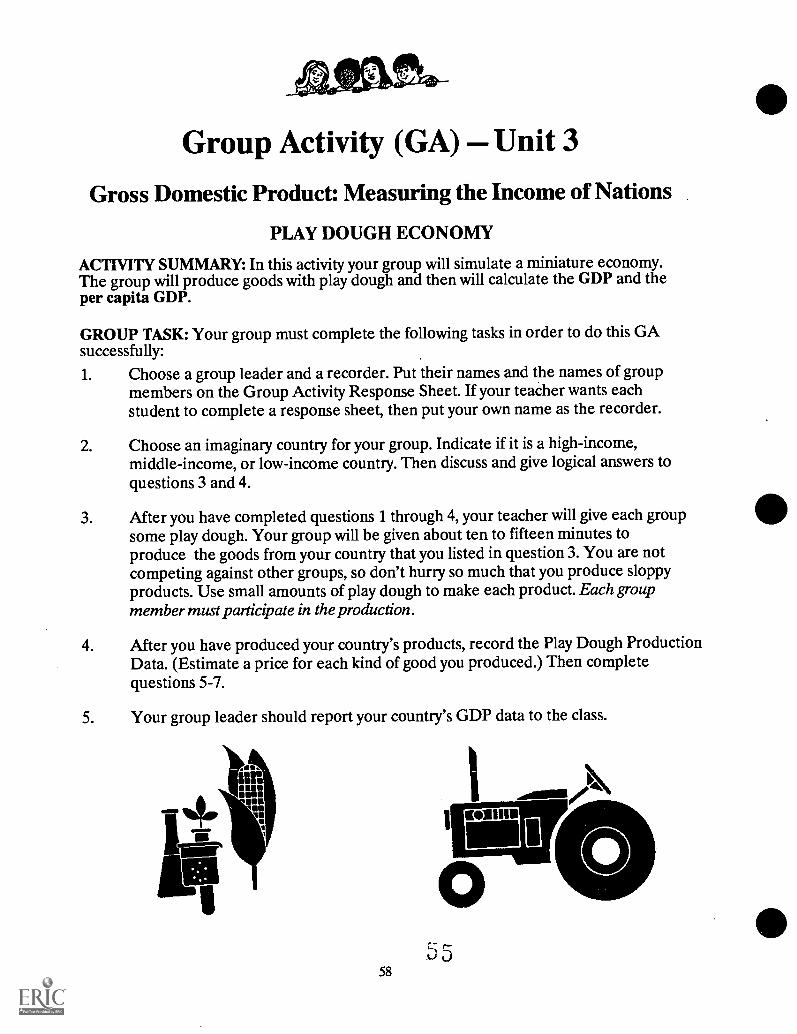
Group Activity (GA) Unit 3
Gross Domestic Product: Measuring the Income of Nations
PLAY DOUGH ECONOMY
ACTIVITY SUMMARY: In this activity your group will simulate a miniature economy.The group will produce goods with play dough and then will calculate the GDP and theper capita GDP.
GROUP TASK: Your group must complete the following tasks in order to do this GAsuccessfully:
1. Choose a group leader and a recorder. Put their names and the names of groupmembers on the Group Activity Response Sheet. If your teacher wants eachstudent to complete a response sheet, then put your own name as the recorder.
2. Choose an imaginary country for your group. Indicate if it is a high-income,middle-income, or low-income country. Then discuss and give logical answers toquestions 3 and 4.
3. After you have completed questions 1 through 4, your teacher will give each groupsome play dough. Your group will be given about ten to fifteen minutes toproduce the goods from your country that you listed in question 3. You are notcompeting against other groups, so don't hurry so much that you produce sloppyproducts. Use small amounts of play dough to make each product. Each groupmember must participate in the production.
4. After you have produced your country's products, record the Play Dough ProductionData. (Estimate a price for each kind of good you produced.) Then completequestions 5-7.
5. Your group leader should report your country's GDP data to the class.
11116 11 )4\:iii.....
.. mu,.
-,T.--, gs, k
%.,/i
58

Group Activity Response Sheet Unit 3Leader Recorder
Group Members
1. What country does your group represent?
2. Is this country considered a high-income, middle-income, or low-income country?
3. List at least four products that are produced by your country.
4. Give two basic reasons why your country might specialize in the production of theseparticular products.
Play Dough Production Data
Type of Good Number Produced Price Revenues
5. What is your country's (group's) GDP?
6. What is your country's (group's) "population?"
7. What is your country's per capita GDP? Show your math.
5s5

Individual Project (IP) Unit 3
Gross Domestic Product: Measuring the Income of Nations( ANALYZING DATA TABLES
PROJECT DESCRIPTION: In this project you will analyze data tables that list the percapita GDP of different countries. You will label each country as either high-income,middle-income, or low-income. Then you will answer questions about one low-incomecountry.
TASKS TO COMPLETE:
A. Choose a continent or geographical region to investigate. (Your teacher may assignthis.) You will receive a blackline map of the continent.
B. Neatly print the name of each country in ink on the map. You may use your text,encyclopedia, or other reference books to help you.
C. Your teacher will give you some data tables. Use these tables to classify the countriesin the continent into three groups, based on per capita GDP. Use the followinglevels to classify the countries:
Per Capita GDP Classification$0 to $499 Low-income Country (LC)$500 to $4,999 Middle-income Country (MC)$5,000 and above High-income Country (HC)
Using colored pencils, color each country on your map based on its per capita GDPclassification. For example, all LCs should be one color, all MCs one color, andall HCs one color. Be sure you put the color code in the map's legend.
D. Choose one LC country to investigate. Answer the following questions on a piece ofpaper. (Use a reference book to help you.)1. What is the name of the LC?2. What is the location? (longitude and latitude)3. What are some of the LCs natural resources?4. What is the climate of the LC? How does the climate affect the goodsand services produced in this LC?
E. Write a paragraph explaining why you think the people of this LC have such a low percapita GDP? In other words, why are many of the people in this country poor?
F. (Optional) Write a paragraph explaining the reasons why you would or would not liketo live in this LC.
G. (Optional) Complete more color coded maps using other types of data For example,create a color coded map showing life expectancy at birth data You will have todecide how to break down the data into different color categories.
60 5 7

0 Test of Unit 3 Concepts1. Define Gross Domestic Product (GDP).
2. How is per capita GDP different from GDP?
3. Suppose country Y produced only the following goods during 1991. The populationof country Y is 30.Good Number Produced Price Each
Pants 100 $20Hammers 50 $10Telephones 80 $20Tables 20 $50
a. What is the GDP of country Y?
b. What is the per capita GDP of country Y?
4. Country Z has a GDP of 20,000 and a population of 100. Country A has a GDP of12,000 and a population of 50. Which country has the higher per capita GDP?(Show your work on the back.)
5. List three reasons why GDP is not a perfect way to measure the income of countries.
a.
b.
c.
6. Name three countries that are low-income countries (LCs). LCs have a per capitaGDP from $0 to $499.
a.
b.
c.
61
58
0
UNIT 4
ProdulleAvfar The Key to :mac Tezefing theWealth o'Nztfions
Teaching Instructions

_eadafinOISTO
Hullet nuctfien inft 4
Prod.ullethfityg The Key To ErfficTemsfilffig Weed off' NEtfiamsUnit Overview
In this unit students learn that increasingproductivity is the key to increasing the wealth ofnations. Students examine two fundamental waysto increase productivity: investments in newcapital/technology and investments in education/training.
Teaching Objectives
Students will:1. Explain that wealthy nations produce many
valuable goods and services, while poorcountries do not.
2. Define and apply the concept of productivity.
3. Explain how technology and education/training can increase productivity.
4. Avoid errors in thinking about why nationsare wealthy or poor.
5. State how different levels of education/training affect income levels of nations.
Teaching the Economic Concepts
Below are some of the key points to emphasizeas you teach this unit.
Wealth Comes From Production: This is asimple, but crucial concept to stress. Goods andservices come into existence only throughproduction. Nations become wealthy only as theybecome proficient at producing valuable goodsand services.
Increasing Productivity: To become proficient atproducing valuable goods and services, nationsmust increase their productivity. This comesabout primarily through the application of newforms of technology. However, improving theeducation and training of workers is also animportant way to increase productivity. This is
especially true in today's world, wheresophisticated manufacturing processes requirebetter educated employees.
Explain to students that one can increaseproductivity by getting more output from thesame inputs, or by getting the same output fromfewer inputs. Emphasize that increasingproductivity helps nations become moreefficient, thereby conserving scarce productiveresources.
Errors in Thinking that Students SometimesMake: These three errors in thinking arecommon among adults, not just students. It isimportant to discuss them with your class.
Error #1: "When one country becomes wealthieranother country must become poorer." Acommon error originates from the belief thatthere is a winner and a loser whenever avoluntary trade is made. As we learned inUnit 2, both parties benefit from voluntarytrade, otherwise the trade would not takeplace. For example, when a wealthy nationsells manufactured goods to a poorer nationin exchange for natural resources bothnations benefit. There is no exploitation insuch a transaction. The poorer nation hasnot been made poorer. Through trade, allnations can increase their per capita incomesimultaneously.
Error #2: "Countries are poor mainly becausethey lack natural resources." The text of theBI makes it clear that having abundantnatural resources is not a prerequisite ofhigh per capita income. Highly motivatedand educated individuals operating in anenvironment of economic and politicalfreedom will enable a nation to prosper andgrow, even if the nation does not possessabundant natural resources. Former SovietPresident Mikhail Gorbachev echoed this
6 065
truth when he said: "The Soviet Union issuffering from a spiritual decline. We wereamong the last to understand that in the ageof information technologies the mostvaluable asset is knowledge, which springsfrom individual imagination and creativity.We will pay for our mistake for many yearsto come. "1
Error #3: "A large population causes a countryto be poor." The issue of population andeconomic growth is a complex one. At themiddle school level, it is sufficient to showthat a dense population does not necessarilymean low-income and poverty. Thefundamental concept to emphasize is thatpeople are producers, not just consumers. Itis true that young children are not veryproductive, and consume more than theyproduce. However, as adults they are avaluable and scarce economic resourcelabor. In the long run, the increasedproductivity, income, and savings generatedby people have consistently far outstrippedthe increased consumption needs of agrowing population.
Looking Ahead to the Next Unit
In the next unit your students will learn about thedifferent types of economic systems, and howeach answers fundamental questions that everysociety faces. Students will investigate which kindof economic system best enables nations toincrease productivity and wealth.
Teaching Suggestions
Basic Instruction (BI):1. If time permits, invite a local businessperson to
share how his or her business attempts toincrease productivity.
2. The video "A Key to Productivity," from theGive and Take series is excellent forintroducing the concept of productivity tomiddle school students.
Group Activity (GA):
1. Allow five minutes to work on the ProductivityWorksheet. Be sure that each student doeshis or her own work.
2. Provide calculators for each student in thesecond round.
3. As in the other GIs, it is best if each member ofthe group completes a ProductivityWorksheet.
4. Point out that in Round 1 an accountant'sproductivity was especially a function ofhuman capital (what math skills, includingspeed and accuracy, the student possessed.)In Round 2, technology was more of a factor.
Individual Project (IP):
Part I1. The abbreviations/words mean the following:
pounds
Circa (c) about or around
WP word processing
A Level advanced level high school exam. Onemust receive a good grade in two or three ALevel exams in specific subject areas to enter auniversity.
0 Level an ordinary high school exam. Apassing grade in five or more Level exams isroughly equivalent to a high school diploma inthe United States
EC European Community (Common Market)
CV curriculum vitae a resume that one submitswhen applying for a job
K thousand
PR Public Relations
2. To compute pounds to dollars multiply theexchange rate by the number of pounds. Forexample, if the rate for a pound quoted indollars is $1.70, then one pound is worth$1.70. A job paying 12,000 pounds would beequivalent to 12,000 x $1.70 = $20,400.Explain that this rate changes daily, and overa period of time can fluctuate significantly.
1 Quoted in George Gilder, "Freedom and the High Tech Revolution," Imprimis, Vol. 19, No. 11(November 1991), p. 1.
6166

Part II newspaper. The Sunday edition usually isbest for this (IP).
1. Show your students examples of color codedmaps done by previous classes.
2. In Part II it works best if students use theregion of Asia, which has a wide variety ofeducational and GDP levels.
3. Invite someone from another country to visityour classroom and share how students areeducated in his or her country.
Rea:Tared Mafia-figs
1. Calculators for each student (GA).
2. The classified advertisements from a
67
3. Blackline masters of the world, regions, orcontinents (IP).
4. Data Tables from Appendix A (IP).
5. Colored pencils or crayons (IP).
Curriculum Materials for ReinforcingEconomic Concepts
1. "Where Do Jobs Come From?" and "A Key toProductivity," Programs 5 and 6 in the Giveand Take video series.
62
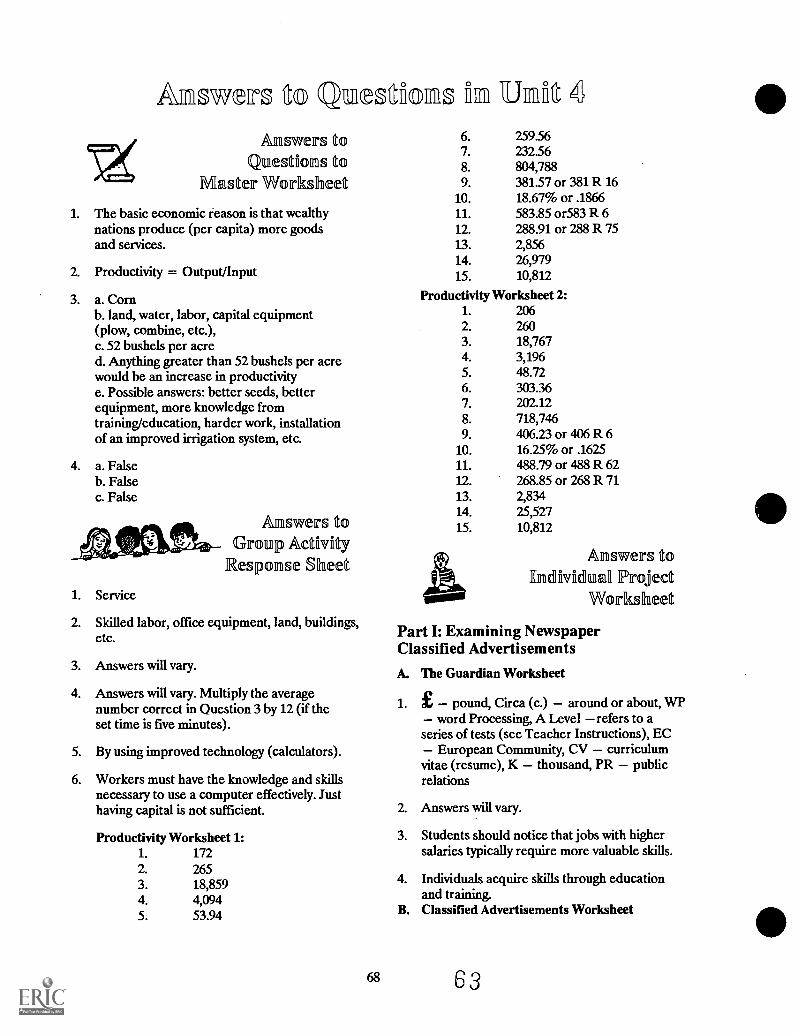
c2
Answars Co Quileet;fione lall :JED; 6
Answers toQuestions to
Master Worksheet
1. The basic economic reason is that wealthynations produce (per capita) more goodsand services.
2. Productivity = Output/Input
3. a. Cornb. land, water, labor, capital equipment(plow, combine, etc.),c. 52 bushels per acred. Anything greater than 52 bushels per acrewould be an increase in productivitye. Possible answers: better seeds, betterequipment, more knowledge fromtraining/education, harder work, installationof an improved irrigation system, etc.
4. a. Falseb. Falsec. False
1. Service
Answers toGroup Activity
Response Sheet
2. Skilled labor, office equipment, land, buildings,etc.
3. Answers will vary.
4. Answers will vary. Multiply the averagenumber correct in Question 3 by 12 (if theset time is five minutes).
5. By using improved technology (calculators).
6. Workers must have the knowledge and skillsnecessary to use a computer effectively. Justhaving capital is not sufficient.
Productivity Worksheet 1:1. 1722. 2653. 18,8594. 4,0945. 53.94
6.7.8.9.
259.56232.56804,788381.57 or 381 R 16
10. 18.67% or .186611. 583.85 or583 R 612. 288.91 or 288 R 7513. 2,85614. 26,97915. 10,812
Productivity Worksheet 2:1. 2062. 2603. 18,7674. 3,1965. 48.726. 303.367. 202.128. 718,7469. 406.23 or 406 R 6
10. 16.25% or .162511. 488.79 or 488 R 6212. 268.85 or 268 R 7113. 2,83414. 25,52715. 10,812
Answers toEndividuall Project
Worksheet
Part I: Examining NewspaperClassified Advertisements
A. The Guardian Worksheet
1. pound, Circa (c.) around or about, WP- word Processing, A Level - refers to aseries of tests (see Teacher Instructions), EC- European Community, CV - curriculumvitae (resume), K thousand, PR publicrelations
2. Answers will vary.
3. Students should notice that jobs with highersalaries typically require more valuable skills.
4. Individuals acquire skills through educationand training.
B. Classified Advertisements Worksheet
68 63

a. Jobs with higher salaries typically requirehigher levels of education.
b. Jobs with higher salaries typically require morevaluable skills.
c, d, e. Answers will vary. Emphasize that to get agood job, education and training are moreessential today than ever before.
Part II: Comparing Education Levelsand GDPA. Education and GDP Worksheet1. Students will notice that countries with very
low percentages of Secondary Educationattainment tend to have low levels ofGDP/income.
2. It is difficult because education requires scarceproductive resources. Also, in poorercountries people may not value education asmuch as in wealthier countries. For example,parents sometimes want their children tohelp farm instead of getting a bettereducation.
B. Com ring Education and Levels of GDP ofa Continent or Region1. & 2. Self explanatory
3. Students should see a positive correlationbetween education and GDP.
Answellm toTest on
Unfit 4 Concepts
1. The basic economic reason is that Zaire doesnot produce as many valuable goods orservices, per capita, as Switzerland.
2. Productivity = Output/Input
3. Juan would increase his productivity if heproduced more than 10 bowls a day with thesame or less productive services.
4. a. More capitalb. Better technologyc. Better education and training.
5. a. Falseb. Falsec. True
6. The mechanic has more skills. Skilled labor ismore scarce (and more valuable) thanunskilled labor.

UNIT 4
IEDiroduactfivfitr The K "o _illaremetullg theWe RIME Nano Ras
Student Handouts
65.

alArS;;;;W:
1,03%11
s asic Instruction (BI) Unit 4
rodunctilvity: T e Key To Increasing the Wealth of NationsIn Unit 3 we learned that some countries have a much higher standard of living (percapita GDP) than others. Why is this true? Why do the citizens of some countries enjoythe use of many goods and services, while citizens in other countries do not? In this unitwe will begin to mvestigate this very important question.
IP at akes a Coul try °ch or Poor?
People in countries everywhere want goods and services. However, in Unit 1, welearned this simple but important truth we live in a world of scarcity. The goods andservices that people want are not freely available they must be produced. The problemall countries face is deciding how best touse their scarce productive resources toproduce goods and services. Figure 4-1 illustrates the productive process.
NaturalResources
The Production Process
Human CapitalResources Resources
= Goodsand Services
(Inputs) (Output)
The basic economic reason why wealthy countries havea higher per capita standard ofliving is that they produce many valuable goods and services. The basic economic reasonwhy some nations are poor is that they do not produce many valuable goods or services.Why is this? To understand the answer to this question we must examine an importanteconomic concept productivity.
Increasing Productivity: How to Get a Higher Standard of Living
Economists call the goods and services that are produced the output of production. Thescarce productive resources are the inputs. Productivity measures how much output isproduced relative to the inputs used. It is expressed as a ratio:
Productivity = Output/Input
Increasing productivity means getting more output from the same inputs. (Another wayof saying this is getting the same output from less inputs.)
73

Here's a simple example. Suppose that a shoemaker usinghand tools can make one pair of shoes a day in his small shop.His productivity is one pair of shoes (output) per day (laborinput). If the shoemaker buys a new machine that enables himto produce two pairs of shoes a day, this doubles hisproductivity. The shoemaker's production is now moreefficient (productive), since more goods (shoes) are producedin the same amount of time (one day). Countries that havehigh levels of productivity have high standards of living.People have many goods and services, health care is good, andthere is a high life expectancy.
Ways to Increase Productivity:
There are several basic ways to increase productivity and help raise standards of living.
1. Increased Amounts of Capital: To achieve high levels of productivity, workers musthave an adequate supply of capital. A farmer using a tool such as a hoe is moreproductive than a farmer using only his hands.
2. Improvements in Technology: Improvement in technology is probably the mostimportant factor in increasing productivity. A farmer who uses a tractor is muchmore productive than a farmer who uses only a hoe, even if the farmer using thehoe works a lot harder.
3. Improvement in the Quality of Labor: Labor that is better trained and educated ismore productive that unskilled labor. The increase in skills that one gets fromeducation and training is called human capital. By being in school, you areincreasing your human capital, and therefore your productivity.
The key idea for you to understand is this: In order to attain a higher standard of living fortheir people, poorer countries must increase their productivity.
Errors in Thinking that Students Sometimes Make:
There are several errors in thinking that students often make when studying why nationsare rich or poor. Some of these are discussed below.
Error #1: "When one country becomes wealthier, another country must becomepoorer."
If one country becomes wealthy, this does not causeanother country to become poor. In past history thismay have been true to a large extent. Nations andempires often became wealthy by using force to takeproductive resources and goods from other nations.Indeed, cities used to be built with high walls aroundthem for protection against invading armies. Today weknow that countries can become wealthy withouttaking the wealth of other countries. By specializingand trading, all countries can grow together.
74 6 7
TICSIC1DES
1310 TICS
Error #2: "Countries are poor mainly because they lack natural resources."
It is certainly true that having abundant natural resources can help a nation tobecome wealthy. A good example is Saudi Arabia, which has gained much wealthbecause of its huge oil reserves. But it is a mistake to think that having manynatural resources is necessary for a country to become wealthy. Hong Kong,Taiwan, Singapore, and Japan have few natural resources, yet have relativelyhighstandards of living. Brazil and the former Soviet Union have much lowerstandards of living, even though they have many valuable natural resources.
Error #3: "A large population causes a country to be poor."
A large and rapidly growing population certainly can be a problem for poorercountries. However, it is a mistake to think that a large population by itselfmakes a country poor. Singapore, Japan, and Hong Kong are very crowded andyet are very prosperous. Jordon, Ethiopia, and Brazil are much less crowded, andyet are much poorer.
KEY POINTS TO REMEMBER!
1. The basic reason that countries have a high standard of living is that theyproduce (per capita) many valuable goods and services. Poor countriesdo not produce (per capita) many valuable goods and services.
2. Increasing productivity means producing more goods and services fromthe same amount of scarce productive resources. Countries mustincrease their productivity in order to attain a higher standard of living.
3. If one country becomes wealthier it does not mean that some othercountry has become poorer. Countries can grow and become wealthiertogether.
4. Countries that have large populations and that lack natural resourcesare not necessarily poor.
6875

Questions To Master1. What is the basic economic reason why some nations are poor and some nations are
wealthy?
2. Define productivity.
3. Mr. Navarro owes a small corn farm in Mexico. He gets 52bushels of corn from each acre.a. What is the output of this farm?
b. What are some of the inputs Mr. Navarro uses in his corn production?
c. What is the corn productivity of his farm?
d. Give a numerical example of an increase in productivity on this farm?
e. Describe three specific ways that Mr. Navarro could increase theproductivity of his corn production.
(1)
(2)
(3)
4. True or False?a. "When one country becomes wealthier, another country becomes poorer."
b. "Countries are poor mainly because they lack natural resources."
c. "A large population causes a country to be poor."
76

Group Activity (GA) Unit 4
Productivity: The Key To Increasing the Wealth of Nations
ACCUSERVE, INC.
SITUATION: It is 1995, and your accounting firm, AccuServe, Inc. is trying to secure alarge contract from Saudi Arabia, a wealthy Middle East oil producing country. Youhave just received the following letter from All Nabobi, Minister of Financial Services inSaudi Arabia.
Dear Sir or Madame:
Our country is accepting bids for a three million dollar accounting contract.Because of the large size of this contract, we must get the best, most productiveaccounting firm possible. Firms from around the world are competing for thisbusiness. To help us in our selection process we must get as much information aspossible about your firm's capabilities. Please have your accountants complete theattached productivity worksheets and return them to us. Of course, all informationwill be kept strictly confidential. We look forward to receiving these worksheets, andwish you the best success in winning this lucrative contract.
Sincerely yours,
att. 0.1.Y15-6-L-
Ali Nabobi
Your Group Task:
1. Choose a president for your firm.
2. Each accountant (including the president) in your group must have a pencil and anAccounting Worksheet.
3. Absolutely no helping each other in this exercise. Each accountant must do his or herown work.
4. Do not start until your teacher tells you. You will have only a set time to finish. Doas many problems as you can in the set time. Remember, only correct answers willcount when you compute your productivity. Do your best work!
5. You will do a second round of computing. Your teacher will give you furtherdirections how to do this next round.

Productivity Worksheet1. Does your accounting firm provide a good or a service?
sa
2. List five productive resources needed by a real accounting firm.
Accountant Name
Production Data
# Correct Round 1 # Correct Round 2
Total Correct
3. For each round, compute the average number correct per accountant.
4. For each round, compute the per hour productivity of the "average accountant" in yourfirm. (Use answer to question 3 to help you.)
Round 1 Productivity
Round 2 Productivity
5. How was productivity increased in Round 2?
6. Computers make workers more productive. However, would workers be productive ifthey did not have the knowledge or skills necessary to use the computer? Explain.
78
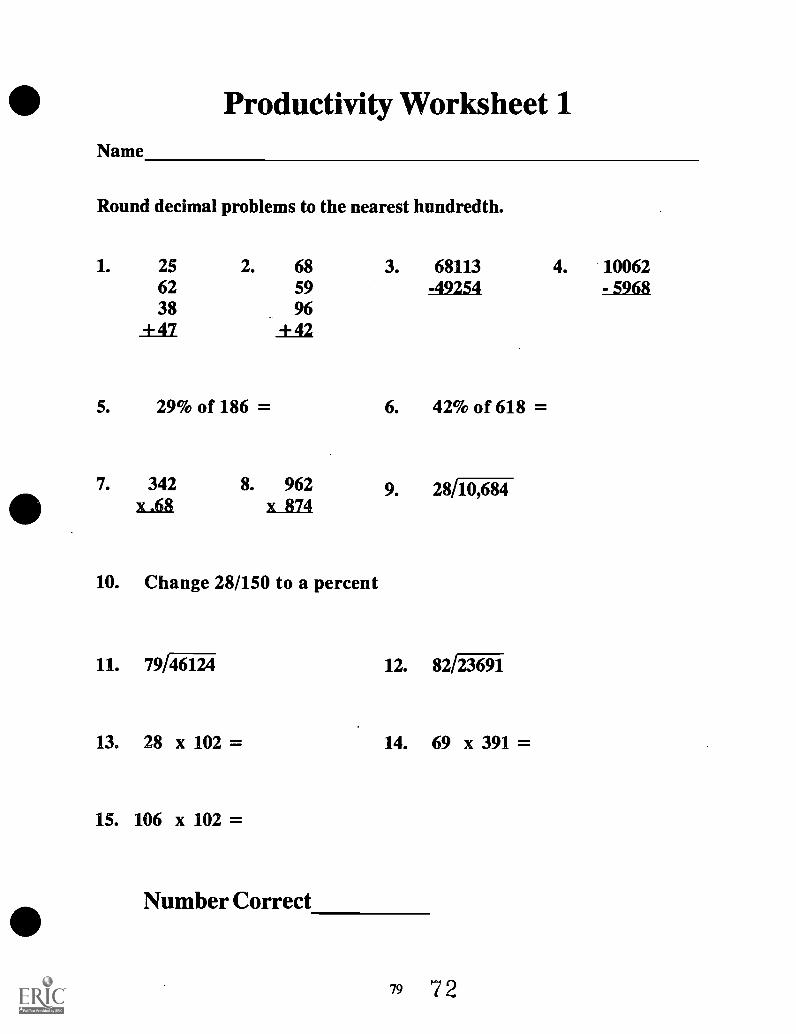
Name
Productivity Worksheet 1
Round decimal problems to the nearest hundredth.
1. 25 2. 68 3. 68113 4. 1006262 59 -49254 - 596838 96
+47 +42
5. 29% of 186 = 6. 42% of 618 =
7. 342 8. 962 9. 28 10,684L.6$ x 874
10. Change 28/150 to a percent
11. 79461T4 12. 82/H1.-
13. 28 x 102 = 14. 69 x 391 =
15. 106 x 102 =
Number Correct
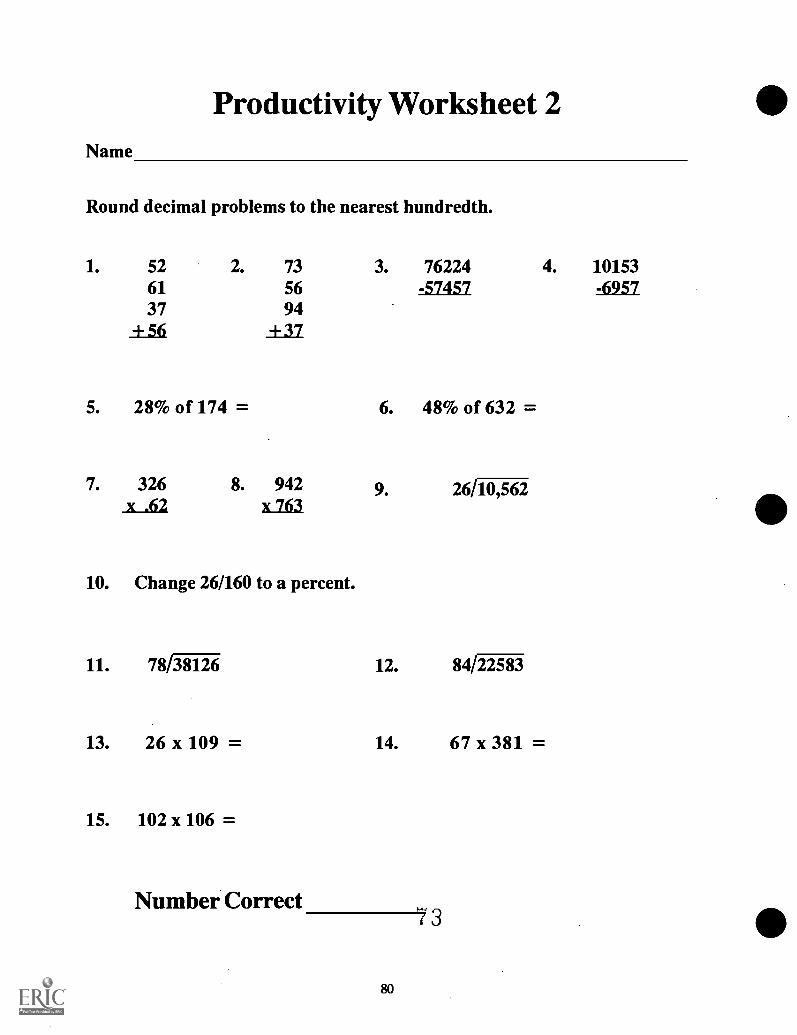
Name
Productivity Worksheet 2
Round decimal problems to the nearest hundredth.
1. 52 2. 73 3. 76224 4. 1015361 56 -57457 -695737 94.56 +37
5. 28% of 174 = 6. 48% of 632 =
7. 326 8. 942 9. 26/117),x .62 x 763
10. Change 26/160 to a percent.
11. 38126 12. 22583
13. 26 x 109 = 14. 67 x 381 =
15. 102 x 106 =
Number Correct7 3
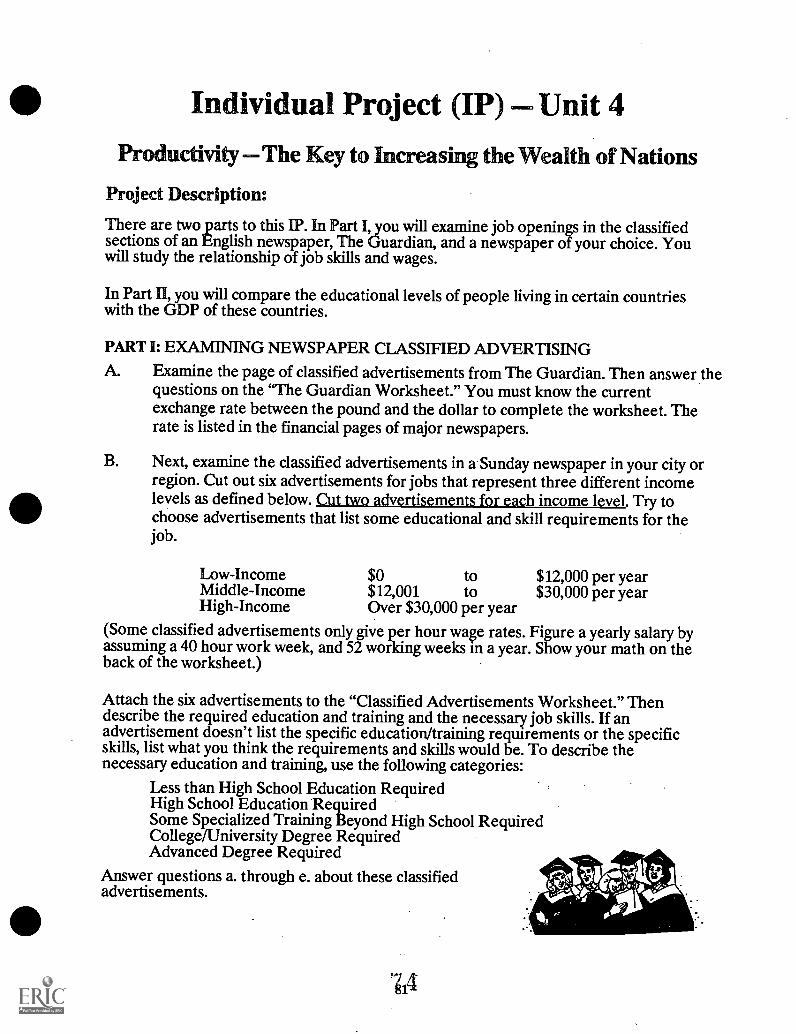
Individual Project (IP) Unit 4Productivity The Key to Increasing the Wealth of Nations
Project Description:
There are two parts to this IP. In Part I, you will examine job openings in the classifiedsections of an English newspaper, The Guardian, and a newspaper of your choice. Youwill study the relationship of job skills and wages.
In Part II, you will compare the educational levels of people living in certain countrieswith the GDP of these countries.
PART I: EXAMINING NEWSPAPER CLASSIFIED ADVERTISINGA. Examine the page of classified advertisements from The Guardian. Then answer the
questions on the "The Guardian Worksheet." You must know the currentexchange rate between the pound and the dollar to complete the worksheet. Therate is listed in the financial pages of major newspapers.
B. Next, examine the classified advertisements in a Sunday newspaper in your city orregion. Cut out six advertisements for jobs that represent three different incomelevels as defined below. Cut two advertisements for each income level. Try tochoose advertisements that list some educational and skill requirements for thejob.
Low-Income $0 to $12,000 per yearMiddle-Income $12,001 to $30,000 per yearHigh-Income Over $30,000 per year
(Some classified advertisements only give per hour way rates. Figure a yearly salary byassuming a 40 hour work week, and 52 working weeks in a year. Show your math on theback of the worksheet.)
Attach the six advertisements to the "Classified Advertisements Worksheet." Thendescribe the required education and training and the necessary job skills. If anadvertisement doesn't list the specific education/training requirements or the specificskills, list what you think the requirements and skills would be. To describe thenecessary education and training, use the following categories:
Less than High School Education RequiredHigh School Education RequiredSome Specialized Training Beyond High School RequiredCollege/University Degree RequiredAdvanced Degree Required
Answer questions a. through e. about these classifiedadvertisements.

Filtont
BRITISH PORTS FEDERATION
COMMUNICATIONSMANAGERc £20,000 + benefits
An exciting, London-based opportunity for a highlymotivated graduate with a Public Affairs background todevelop the communications of one of the country'sleading trade associations.My client, the British Ports Federation, needs effectivecommunications with its members. the UK Government andParliament, all the institutions of the EC and the media.The successful candidate will possess the ability to exercisesound judgement on a wide range of sensitive policyissues, significant organisational abilities and provencommunication skills, both written and verbal. Knowledgeof another EC language would be useful.The Communications Manager will work closely with, andreport directly to, the Managing Director.
Please call or write to Peter Childs
PRIV)(.. COUNSELRecruittnent into Public Affairs
14 South Melton Street Landon WIY IDE 071-495 4944
GLASGOW COLLEGEA SCOTTISH POLYTECHNIC
EDUCATION OFFICERSALARY UP TO £17K
The PUBLIC RELATIONS UNIT requires a newteam member with superb organisational skillsand experience of the range of PR techniquesemployed in Higher Education.
Involving frequent travel and public speakingengagements throughout Scotland, you willbe expected to liaise with schools, maturestudents, careers offices and parent teacherorganisations. You will already possess a portfoliodemonstrating your abilities in copywriting,print-buying and advertising.
If you are a confident, articulate and intelligentperson with good self-presentation skills, coupledwith the ability to sustain long periods in a high-pressure environment, then we would like to hearfrom you. A.clean driving licence is essential.
Application form and further details may beobtained from the PERSONNEL DEPARTMENT,GLASGOW COLLEGE, COWCADDENS ROAD,GLASGOW G4 OEM (Tel: 041-331 3817) to bereturned by MONDAY 4 MARCH 1991.
SECRETARY/PArequired for Director of established Christiancharitable organisation, working with singlehomeless people: Excellent audio-typing andword processor skills required. A flexible andmature approach to work essential.
Salary c.f15,000 depending on age andexperience.
Closing date: 1st March, 1991.Details and application form from:Providence Row, 50 Crispin Street,
London El 6H0.(Telephone 071-247 4030).
We are committed to an Equal OpportunitiesPolicy. This organisation is funded by the
London Boroughs Grant Committee.
Timer row AVAILABLE
Hutton PictureCompany
PICTUREADMIN.
ASSISTANTIAst be educated to A Navelor above, familiar with com-puters, good communicationMills, From C0.000 accordingto experience. Contact AdeleB linston on 071-266 2660 byWednesday 20th February.
DESIGN CONSULTANCYNEAR WATERLOO
is looking for a well presented.enthusiastic
RECEPTIONISTAgo 18-25. varied range ofduties inc. WP typing. Mon-arch SB. And greetingclients. Common sense isessential for this busy posi-tion.Salary 01.000.
Tel: Sandra /PaulaOT1.928 2344
SECRETARIALASSISTANT
The BTUC is the secretariat of a federation oftrade unions which represent staff in BritishTelecom.WP skills (will cross train) and a goodgrounding in basic office routines areessential. We are seeking someone brightwith an affable personality, who is also reliableand meticulous in his/her work.Other duties include the ordering and controlof stationery stocks and assisting the PA to theBTUC National Secretary in such tasks assetting up meetings and preparing committeebriefs,The Starting salary is £11,871 plus £2,260London Weighting and annual leaveentitlement is 25 days.For further details and an application form,please contact Donna Mills at the BTUC on071-628 0626 or write to us at 14-15Bridgewater Square, London EC2Y BBS.The closing date for the return ofapplications is Friday, February 22,1991.
THE NATIONAL TRUST'
SECRETARY TO THEHOUSEKEEPER
circa 011,500 paThe Housekeeper Is the conservator responsible forpreventative conservation at 200 historic house and fortraining staff in day-to-clay care of their contents.She is looking for an experienced secretary with audioskills, who is an efficient administrator, meticulousrecord-keeper, able to compose his/her own lettersand who enjoys working as part ate team but with lislesupervision.The Housekeeper Is often away from the office 3 days aweek so this position offers scope for initiative and .considerable responsibility.If you'd like to apply, please send a stampedaddressed envelope for an application form and Witherdetails to:
Martine Pestle, Personnel OfficerThe National Trust. 36 Queen Anne's Gate
London, SW1H ASClosing date for completed application forms is FridayIS March.
SecretaryInstitute of Financeand AccountingSalary 113,100London Business School needs aconfident, bright person, educatedto 'A' level and with some workexperience in a finance/businessenvironment, to provide secretarialsupport to 3 academics and assist inthe running of the Risk MeasurementService, which provides informationabout *UK equities to investors andfinancial managers.Secretarial duties will include prepara-tion and distribution of teachingmaterials, liaison with postgraduatestudents and PA work. You will alsobe responsible for updating the clientdatabase for the School's RiskMeasurement Service, and dealingwith telephone enquiries.The successful applicant will have anexcellent telephone manner, the abilityto work to deadlines, experience ofWordPerfect and a wide knowledgeof software including at least 2 of thefollowing: Harvard Graphics, Lotus1-2-3 and DBase IV.To apply for this post please send yourCV to Ms Lyndon Hoare, PersonnelManager, at the address above by26 February 1991.No agencies
LendonBusiness-School .
Sussex PlaceRegent's PMLondonNWI 4SAWTelephone071-262 5050Facsimile071-724 7875
Fitton Avenue Bristol BS12 7ATTel: Bristol (0272) 694217 Fax: (0272) 236450
PRINCIPALSalary Group E - Circa £40,000
The Governors of this successful college are seeking applicationsfrom suitably qualified and experienced persons for this seniormanagement post from 1 September 1991.Filton College serves the needs of the local community for furthereducation, and training. With 1,100 full-time students andapproximately 8,000 part-time students, the College Is large enoughto offer a rich variety of education and training courses andprogrammes, but small enough to foster an environment in whichindividuals retain their own Identity.You will need:
A sound knowledge of the education sceneHigh level management and leadership skillsExceptional strategic planning and development IdeasProven qualities of sound business and entrepreneurial skillsThe ability to deliver, maintain and promote a quality provisionresponsive to changing needs and demands.
The Governors are prepared to consider applications fromcandidates currently outside the educational field, as well as within.For further information, an application form and details of therelocation package contact
Clerk to the Governorsaddress as above
Closing date for receipt of applications: -15 March 1991
TRAINING SUPERVISORc£20,000 +
Age 25+ CITYLeading Arm of international lawyers seek a SeniorAdministrator to assist in co-ordinating and developing thelegal training programme for over 400 lawyers.Experience of managing a small team in an educational.professional or commercial body combined with energy.initiative and excellent organisational and communicationskills are essential. Experience in organising trainingprogrammes is desirable. Responsibility will also be takenfor the supervision of a small team of assistants.
Call Jane Morgan on 071-258 6888.
LOVE & TATE APPOINTMENTS
s5
SECRETARY/ADMINISTRATORMature and competent person required for smallmarketing and promotion company (some artsclients). We need someone who is articulate.personable. and enthusiastic, with a systematicapproach and an ability to work on own initiatiThe job will entail typing and general secreteduties as well as client liaison and help wpromotions. WP experience preferable. but Nsaccurate typing essential. Non-smoking care.Salary c.£11.000.Send letter plus CV immediately to: Lynne Burton.The Marketing Office, 15/17 Old Compton Street,London WIV SPS or fax: 071.734 5304 (no agenciesl.

The Guardian Worksheet1. The following abbreviations and words appear in the advertisements. What do you
think they mean? Discuss with the class. Write the meanings below.
a. £- e. ECb. Circa (abbreviated c) f. CVc. WP - Kd. A Level t. PR
2. What is the current exchange rate for dollars and pounds? (How many dollarsdoes it take to buy one pound?)
3. Identify three different jobs from the advertisements. Then complete the followinginformation about the jobs.
Job Title
Salary in Pounds
Necessary Education
Necessary Skills
Job Title
Salary in Pounds
Necessary Education
Necessary Skills
Compute Salary in Dollars
Compute Salary in Dollars
Job Title
Salary in Pounds Compute Salary in Dollars
Necessary Education
Necessary Skills
4. Examine these and other jobs in the advertisements. What relationship do younotice between salary and job skills required?
5. How do individuals acquire the skills they need for jobs?

Name:
1.
Classified Advertisements Worksheet
ClassifiedAdvertisements(attach below)
Education/TrainingRequirements
NecessarySkills
Yearly Salary
2.
Yearly Salary
3.
Yearly Salary
84
Classified Ads(attach below)
4.
Education/ rainingRequirements
NecessarySkills
Yearly Salary
5.
Yearly Salary
6.
Yearly Salary
85 8

Classified Advertisements: Answer these questions.
a. What relationship do you see between the job salary and the requirededucation/training requirements?
b. What relationship do you see between the job salary and the required skills?
c. What kind of work or job do you want to do when you are an adult?
d. What education and/or training will you need?
e. What kind of skills will you need?
86 7 0
Ott..
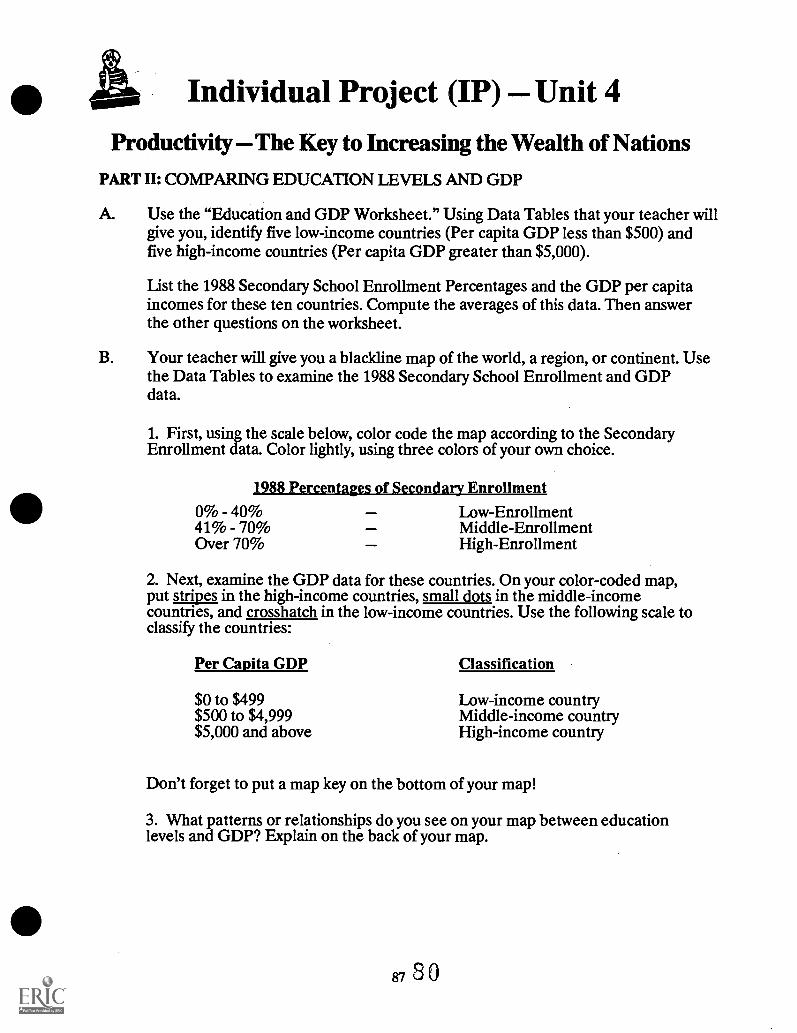
Individual Project (IP) Unit 4
Productivity The Key to Increasing the Wealth of NationsPART II: COMPARING EDUCATION LEVELS AND GDP
A. Use the "Education and GDP Worksheet." Using Data Tables that your teacher willgive you, identify five low-income countries (Per capita GDP less than $500) andfive high-income countries (Per capita GDP greater than $5,000).
List the 1988 Secondary School Enrollment Percentages and the GDP per capitaincomes for these ten countries. Compute the averages of this data. Then answerthe other questions on the worksheet.
B. Your teacher will give you a blackline map of the world, a region, or continent. Usethe Data Tables to examine the 1988 Secondary School Enrollment and GDPdata.
1. First, using the scale below, color code the map according to the SecondaryEnrollment data. Color lightly, using three colors of your own choice.
1988 Percentages of Secondary Enrollment
0% - 40% Low-Enrollment41% - 70% Middle-EnrollmentOver 70% High-Enrollment
2. Next, examine the GDP data for these countries. On your color-coded map,put stripes in the high-income countries, small dots in the middle-incomecountries, and crosshatch in the low-income countries. Use the following scale toclassify the countries:
Per Capita GDP Classification
$0 to $499$500 to $4,999$5,000 and above
Low-income countryMiddle-income countryHigh-income country
Don't forget to put a map key on the bottom of your map!
3. What patterns or relationships do you see on your map between educationlevels and GDP? Explain on the back of your map.
87 3 0

Name
Education and GDP Worksheet
Low-Income Percent of Secondary GDPCountries (LCs) Enrollment
Average
High-Countries (HCs) Percent of Secondary GDPEnrollment
Average
1. What patterns/relationships do you see in your data? Explain.
2. Why do you think it is difficult raising the educational levels of people living inlow-income countries?
88 81

0 Test On Unit 4 Concepts1. Zaire is a poor country. Switzerland is a wealthy country. What is the basic economic
reason for this difference?
2. Define productivity.
3. Juan produces 10 pottery bowls a day in his pottery shop. Explain what it means forJuan to increase productivity in his shop. Give a simple numerical example inyour explanation.
III 4. To raise GDP, nations try to increase productivity. What are three basic ways toincrease a nation's productivity?
a.
b.
c.
5. True or False?a. If a country becomes wealthier through trade this means that another
country has become poorer.
b. A country that does not have many natural resources is a poor country.
c. A large and growing population does not mean that a country will be poor.
6. Explain why an automobile mechanic typically earns more than a person whomows lawns for a lawn mowing company.

UNIT 5
cononutic Systems IHI©w NvIfi©i Omgazllfzeherr __...L'comaamtes
Teaching Instructions
33

rliezellufirmg IlEasanueflorms o Urge 5
}Economic Systems: How Nations 0
Tindal Eng Objectives:
Students will:1. Explain the difference between traditional,
command, market, and mixed economies.
2. Explain why every country must have aneconomic system.
3. Explain the behavior of buyers and sellers in amarket.
4. Explain how a market price is determined.
5. Explain the effects of a price floor and a priceceiling.
6. Identify and explain different economic andsocial goals.
Teaching the Economic Concepts:Below are some of the key concepts toemphasize as you teach this lesson.
1. The Difference Between the Various Types ofEconomic Systems Stress that while nocountry's economy is purely traditional,command, or market, nevertheless one ofthese types of systems will predominate.Economic systems are necessary becausescarcity forces every society to decide what,how, and for whom to produce.
2. Which Economic System is Best? Most agreethat economic systems that stress a marketapproach do the best job in preservingindividual freedom and raising standards ofliving. It is important to realize that in amarket system one does not have thefreedom to harm or defraud individuals.Even in a "pure" market system there arelaws against theft, cheating, and fraud. Also,proponents of a market system admit thatthere is a proper roll for government inproviding for public goods like nationaldefense and a court system, correcting forthe harmful spillover effects of pollution,and making sure there is competition in themarketplace. Opponents of the marketsystem point out that there is more incomeinequality in market systems. Market systemproponents counter that even in command
I :1! saullize Their Economies
economies those in power invariably have farmore than the average citizen.
3. The Behavior of Buyer and Sellers in aMarket Students understand that in amarket buyers try to buy goods and servicesat the lowest possible price. Sellers try tosell at the highest possible price. Point outthat as buyers and sellers interact in amarket, buyers compete against other buyersas they try to purchase goods and services.Sellers compete against other sellers. Whileit is true that buyers haggle with sellers tonegotiate the best possible price, buyers donot compete against sellers.
4. How a Market Price is Determined Marketprices are determined by the interaction ofbuyers and sellers in the market place. Asbuyers attempt to buy at low prices andsellers at high prices, a sort of compromiseprice is determined, called a market price,or equilibrium price. Buyers who insist on-avery low price will lose out to other buyerswho will accept somewhat higher prices.Sellers who insist on very high prices willlose out to other sellers who will acceptlower prices. A key point to emphasize isthat no authoritative agency sets the marketprice it occurs naturally as buyers andsellers interact. The natural market priceequalizes the amounts that sellers want tosell and the amounts buyers want tobuy automatically, without the aid ofgovernment.
5. The Affect of Price Floors and PriceCeilings When governments impose pricecontrols on markets there are predictableresults. A mandated price set above the truemarket price, called a price floor, will causesellers to want to sell more and buyers to buyless. The result is a surplus. A mandatedprice set below the true market price, calleda price ceiling, has the opposite result.Buyers will want to buy more, but sellers willwant to sell less. The result is a shortage.Economists generally agree that pricecontrols misallocate a country's productiveresources, and therefore should be avoided.
93 84
6. Economics and Social GoalsThe importantthing to stress is that these goals oftencontradict. In public policy decisions thereare usually trade-offs between conflictinggoals. Point out that a society's emphasis oncertain goals will change over time.Currently, environmental protection is a goalthat is receiving much emphasis. In the early1980s, price stability was emphasized, sincethe late 1970s experienced much inflation.
Teaching Suggestions:
1. Review the BI with your students.
2. Study the teacher instructions, "How to Playthe Corn Game." Then review gamedirections with your students using "TheCorn Market Game" Student InstructionSheet. It takes about 45 minutes to play anddebrief the game, so you may want to reviewthe directions in the previous class period.
94
Required Mateirialls:
1. You will need to prepare various materials forthe GI "The Corn Market Game." Theyare listed in the following How to Play theCorn Market Game directions sheet.
2. Black line master of the nations of the world,pre-1990.
Extending the Unit:
1. Give and Take video Program 9: "MarketPrices: Supply and Demand," reinforces theconcepts presented in this unit.
2. Muni to Mocha, an animated video programwith teaching activities, emphasizes thedifferent types of economic systems anddifferent economic/social goals.
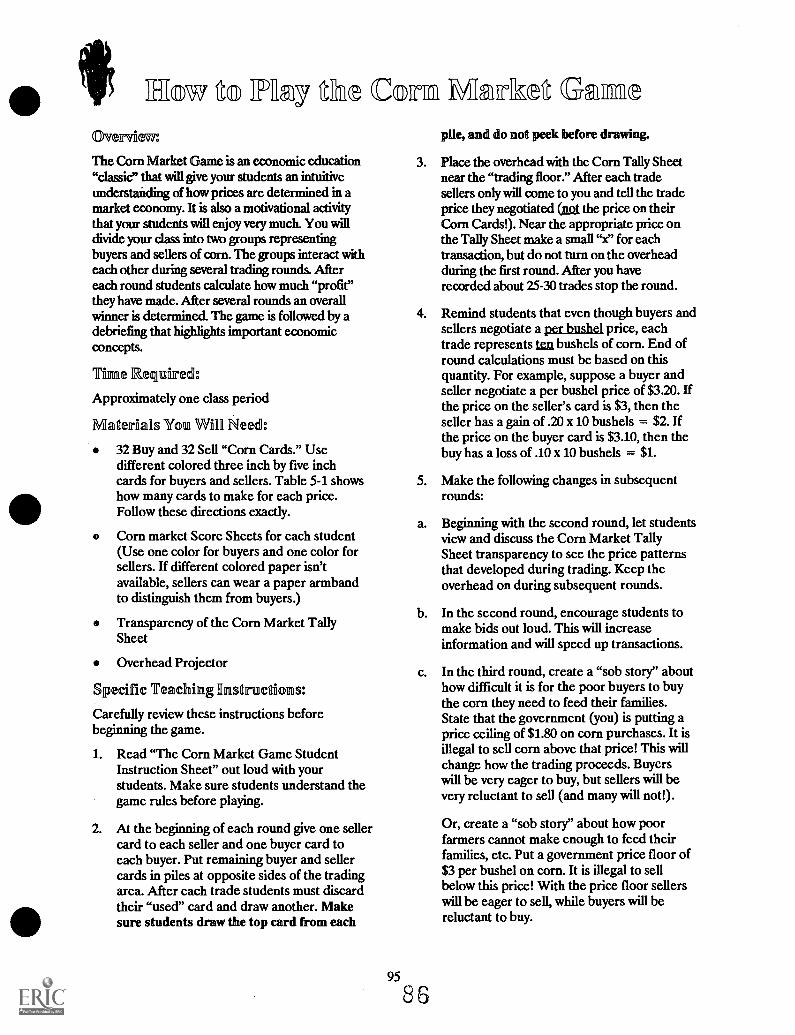
H©w TRE.y the C©i Market GameOverview:
The Corn Market Game is an economic education"classic" that will give your students an intuitiveunderstanding of how prices are determined in amarket economy. It is also a motivational activitythat your students will enjoy very much. You willdivide your class into two groups representingbuyers and sellers of corn. The groups interact witheach other during several trading rounds. Aftereach round students calculate how much "profit"they have made. After several rounds an overallwinner is determined. The game is followed by adebriefing that highlights important economicconcept&
Time Required:
Approximately one class period
Materials You Will Need:
pile, and do not peek before drawing.
3. Place the overhead with the Corn Tally Sheetnear the "trading floor." After each tradesellers only will come to you and tell the tradeprice they negotiated a the price on theirCorn Cards!). Near the appropriate price onthe Tally Sheet make a small "x" for eachtransaction, but do not turn on the overheadduring the first round. After you haverecorded about 25-30 trades stop the round.
4. Remind students that even though buyers andsellers negotiate a per bushel price, eachtrade represents ten bushels of corn. End ofround calculations must be based on thisquantity. For example, suppose a buyer andseller negotiate a per bushel price of $3.20. Ifthe price on the seller's card is $3, then theseller has a gain of .20 x 10 bushels = $2. Ifthe price on the buyer card is $3.10, then thebuy has a loss of .10 x 10 bushels = $1.32 Buy and 32 Sell "Corn Cards." Use
different colored three inch by five inchcards for buyers and sellers. Table 5-1 showshow many cards to make for each price.
5.
Follow these directions exactly.a.
Corn market Score Sheets for each student(Use one color for buyers and one color forsellers. If different colored paper isn'tavailable, sellers can wear a paper armbandto distinguish them from buyers.)
Transparency of the Corn Market Tallyb.
Sheet
Overhead Projectorc.
Specific Teaching Ifinstranctions:
Carefully review these instructions beforebeginning the game.
1. Read "The Corn Market Game StudentInstruction Sheet" out loud with yourstudents. Make sure students understand thegame rules before playing.
2. At the beginning of each round give one sellercard to each seller and one buyer card toeach buyer. Put remaining buyer and sellercards in piles at opposite sides of the tradingarea. After each trade students must discardtheir "used" card and draw another. Makesure students draw the top card from each
Make the following changes in subsequentrounds:
Beginning with the second round, let studentsview and discuss the Corn Market TallySheet transparency to see the price patternsthat developed during trading. Keep theoverhead on during subsequent rounds.
In the second round, encourage students tomake bids out loud. This will increaseinformation and will speed up transactions.
In the third round, create a "sob story" abouthow difficult it is for the poor buyers to buythe corn they need to feed their families.State that the government (you) is putting aprice ceiling of $1.80 on corn purchases. It isillegal to sell corn above that price! This willchange how the trading proceeds. Buyerswill be very eager to buy, but sellers will bevery reluctant to sell (and many will not!).
Or, create a "sob story" about how poorfarmers cannot make enough to feed theirfamilies, etc. Put a government price floor of$3 per bushel on corn. It is illegal to sellbelow this price! With the price floor sellerswill be eager to sell, while buyers will bereluctant to buy.

Questions for Debriefing:1. At what price was the most corn sold in each
round? (Examine data on Corn MarketTally Sheet.)
2. During which round was the spread of pricesthe greatest? (This almost always occursduring the first round, because more priceinformation is available in subsequentrounds, creating more competition. Thiscompetition drives the prices toward amarket, or equilibrium price.)
3. Who determined the market price for corn?(No one person. The price was determinedby the interaction of buyers and sellers inthe marketplace.)
4. Why were some students able to make moreprofits than others? (They drew "better"cards. They were better traders. They mademany trades, each with a small margin ofprofit.)
5. Who was the "competition" for sellers? (Othersellers.) Who was the "competition" for
buyers? (Other buyers.)
6. In what way is calling out prices similar toadvertising? (Calling out prices, likeadvertising, gives information to buyers andsellers.)
7. What is the opportunity cost of continuing toseek a better price? (Giving up the chance tomake many trades, students must continuallydecide if it is worth the time it takes to get abetter price. As the game goes on and themarket price range narrows, students willdiscover it is not worth taking a lot of time tofmd a slightly better price.)
8. How did setting a price ceiling below themarket price affect trading? (Sellers wereinclined not to sell. Some remained at theirdesks. The price clustered right at the ceilingprice.)
9. How did setting a price floor (above themarket price) affect trading? (Buyers wereinclined not to buy. Some remained at theirdesks. The price clustered at the price floor.)
TABLE 5-1HOW TO ORGANIZE "CORN CARDS"
Follow these directions for making the SELL Cards:Price on Card Number of Cards Having This Price
$3.40 2
$3.20 2
$3.00 2
$2.80 2
$2.60 2
$2.40 4
$2.20 4
$2.00 4
$1.80 4
$1.60 4
Follow these directions for making the BUY Cards:
Price on Card Number of Cards Having This Price$3.40 4
$3.20 4
$3.00 4
$2.80 4
$2.60 4
$2.40 2
$2.20 2
$2.00 2
$1.80 2
$1.60 2
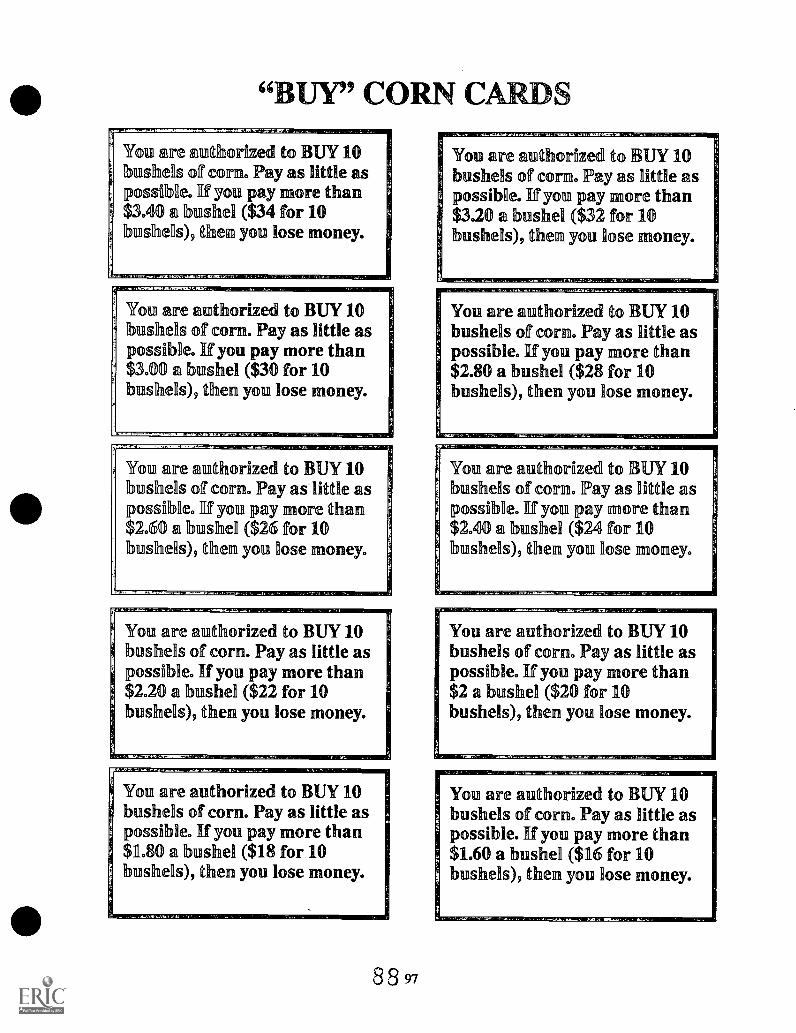
44 UY" CORN C
You are authorized to BUY 10bushels off corn. P y as little aspossible. If you pay ore than$3.40 bushel ($34 for 10bushels), then you lose money.
You are i ititthorized to BUY 10bushels of corn. Pay as little aspossible. If you pay more than$3.00 a bushel ($30 for 10bushels), then you lose money.
IYou are authorized to BUY 10bushels of corn. Pay as little aspossible. If you pay more than$2.60 a bushel ($26 for 10bushels), then you lose money.
You are authorized to BUY 10bushels of cor . Pay as little aspossible. If you pay more than$2.20 a bushel ($22 for 10bushels), then you lose money.
rYou are authorized to BUY 10bushels of corn. Pay as little aspossible. If you pay more than$1.80 a bushel ($18 for 10bushels), then you lose money.
88 97
S
You are authorized to UY 10bushels of corn. Pay s little aspossible. If you pay more than$3.20 a bushel ($32 for 10bushels), then you lose money.
You are authorized to UY 10bushels of corn. Pay as little aspossible. If you pay more than$2.80 a bushel ($28 for 10bushels), then you lose money.
You are authorized to it UY 10bushels of corn. Pay as little aspossible. If you pay more than$2.40 a bushel ($24 for 10bushels), then you lose money.
You are authorized to BUY 10bushels of corn. Pay as little aspossible. If you pay more than$2 a bushel ($20 for 10bushels), then you lose money.
You are authorized to BUY 10bushels of corn. Pay as little aspossible. If you pay more than$1.60 a bushel ($16 for 10bushels), then you lose money.

"SELL" CORN CARDS
You are authorized to SELL10 bushels of corn. Get asmuch as possible. If you getless than $3.40 a bushel ($34for 10 bushels), then you losemoney.
You are authorized to SELL10 bushels of corn. Get asmuch as possible. If you getless than $3 a bushel ($30 for10 bushels), then you losemoney.
You are authorized to SELL10 bushels of corn. Get asmuch as possible. If you getless than $2.80 a bushel ($28for 10 bushels), then you losemoney.
You are authorized to SELL10 bushels of corn. Get asmuch as possible. If you getless than $2.20 a bushel ($22for 10 bushels), then you losemoney.
You are authorized to SELL10 bushels of corn. Get asmuch as possible If you getless than $1.80 a bushel ($18for 10 bushels), then you losemoney.
98
You are authorized to SELL10 bushels of corn. Get asmuch as possible. If you getless than $3.20 a bushel ($32for 10 bushels), then you losemoney.
You are authorized to SELL10 bushels of corn. Get asmuch as possible. If you getless than $2.60 a bushel ($26for 10 bushels), then you losemoney.
You are authorized to SELL10 bushels of corn. Get asmuch as possible. If you getless than $2.40 a bushel ($24for 10 bushels), then you losemoney.
You are authorized to SELL10 bushels of corn. Get asmuch as possible. If you getless than $2 a bushel ($20 for10 bushels), then you losemoney.
You are authorized to SELL10 bushels of corn. Get asmuch as possible. If you getless than $1.60 a bushel ($16for 10 bushels), then you losemoney.
89

CORN MARKET TALLY SHEETPrice Per Round 1 Round 2 Round 3 Round 4
$3.60
$3.40
$320
$3.00
$2.80
$2.60
$2.40
$2.20
$2.10
$2.00
$1.80
$1.60
$1.40J
9990
WO
RL
D'P
OLI
TIC
AL-
9192
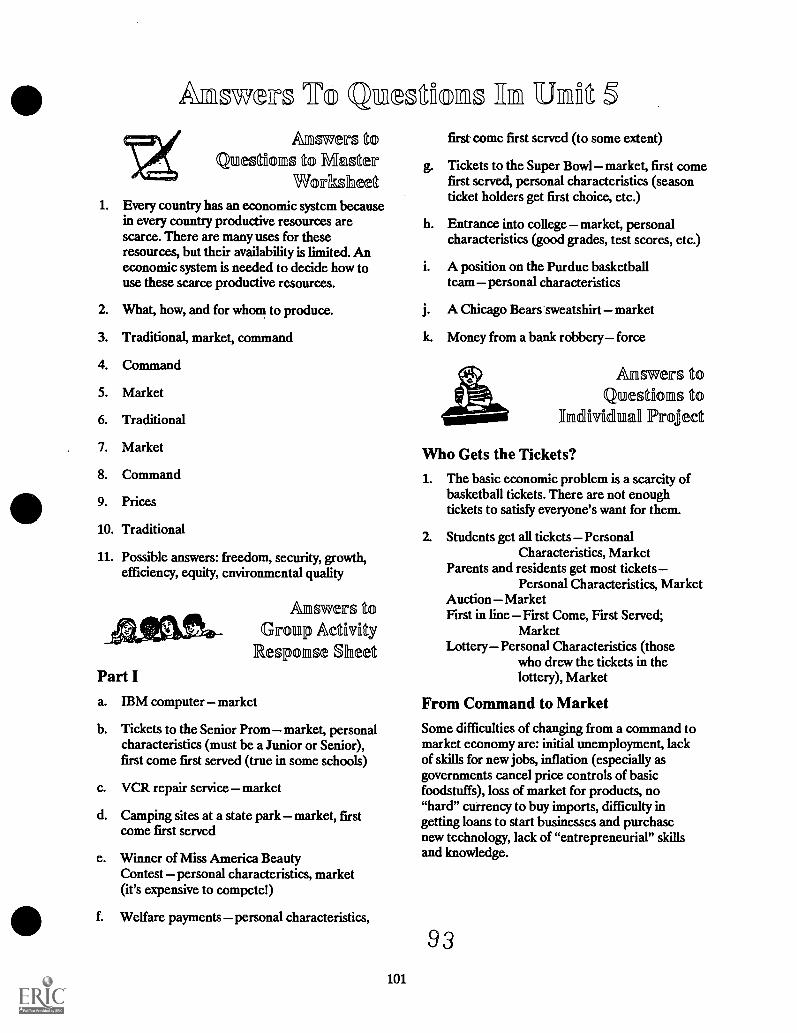
Bowe r® Queotfiellao -ila Matt 5Answers to
Questno ®s to MaterWorksheet
1. Every country has an economic system becausein every country productive resources arescarce. There are many uses for theseresources, but their availability is limited. Aneconomic system is needed to decide how touse these scarce productive resources.
2. What, how, and for whom to produce.
3. Traditional, market, command
4. Command
5. Market
6. Traditional
7. Market
8. Command
9. Prices
10. Traditional
11. Possible answers: freedom, security, growth,efficiency, equity, environmental quality
Part I
Answers toGroup Actftvlity
Response sheet
a. IBM computer market
b. Tickets to the Senior Prom market, personalcharacteristics (must be a Junior or Senior),first come first served (true in some schools)
c. VCR repair service market
d. Camping sites at a state park market, firstcome first served
e. Winner of Miss America BeautyContest personal characteristics, market(it's expensive to compete!)
f. Welfare payments personal characteristics,
101
first come first served (to some extent)
g. Tickets to the Super Bowlmarket, first comefirst served, personal characteristics (seasonticket holders get first choice, etc.)
h. Entrance into college market, personalcharacteristics (good grades, test scores, etc.)
i. A position on the Purdue basketballteam personal characteristics
A Chicago Bears sweatshirt market
k. Money from a bank robbery force
Answers toQuestrions to
ThmEllilvf[dunall Project
Who Gets the Tickets?
1. The basic economic problem is a scarcity ofbasketball tickets. There are not enoughtickets to satisfy everyone's want for them.
2. Students get all tickets PersonalCharacteristics, Market
Parents and residents get most ticketsPersonal Characteristics, Market
Auction MarketFirst in line First Come, First Served;
MarketLotteryPersonal Characteristics (those
who drew the tickets in thelottery), Market
From Command to MarketSome difficulties of changing from a command tomarket economy are: initial unemployment, lackof skills for new jobs, inflation (especially asgovernments cancel price controls of basicfoodstuffs), loss of market for products, no"hard" currency to buy imports, difficulty ingetting loans to start businesses and purchasenew technology, lack of "entrepreneurial" skillsand knowledge.
93

Answers toTest on Unfit 5
Concepts
1. What, how, and for whom to produce
2. Market, command, traditional
3. Command
4. Market
5. Traditional
102
6. Command
7. Market
8. First come, first served, lottery, personalcharacteristics
9. Prices are determined by the interaction ofbuyers and sellers in the market place.
10. Freedom, security, justice, environmentalquality, growth, equity, efficiency

UNIT 5
7,4 conomac Systems HHI©w Nzttons OrrgamfizehetR° acmomies
Student Handouts
.95
Basic Instruction (BI) Unit 5Economic Systems: How Nations Organize Their Economies
Scarcity and Economic Systems:
We have learned that all the different countries of the world specialize in the kinds ofgoods and services they produce. For example, Argentina specializes in producing beef,Israel in producing oranges, and Japan in producing VCRs. But who decides what eachcountry will produce? And who decides how the goods and services will be producedand who will get to use them? The answer to these questions depends on what kind oneconomic system a country has.
An economic system describes how a country's economy is organized. Every country,rich or poor, has an economic system. This is because in every country there is a scarcityof productive resources (natural resources, labor resources, and capital resources.) Thismeans that there are not enough productive resources to provide all the goods andservices wanted by citizens of a country. Because of the problem of scarcity, eachcountry needs an economic system to determine how to use its productive resources.
An economic system must answer these three basic questions:
WHAT TO PRODUCE? (What kinds of goods and services should beproduced?)
HOW TO PRODUCE? (What productive resources are used to producegoods and services?)
FOR WHOM T PRODUCE? (Who gets to have the goods and services?)
This is true no matter where a country is located or how wealthy or poor a country is.
Kinds of Economic Systems:
There are three basic kinds of economic systems used to answer the questions of what,how, and for whom to produce: traditional, command, and market systems.
Traditional Economies: In this type of economic system, economic decisions arebased primarily on custom and tradition. For example, in African tribal societiesthe jobs that people have are based primarily onwhat their ancestors or parents did. In rural India, apersons economic status is still strongly influencedby the caste, or rank, into which the person is born.
Command. Economies: In a command system, thegovernment usually owns most of the property, andgovernmental planning groups make the basiceconomic decisions. These groups determine such
105

things as the prices of goods and services and the wages of workers. This kind ofeconomic system has not been very successful, and fewer and fewer countries arerelying on it. Poland is an example of a country who is abandoning the commandeconomy. Cuba and North Korea still have command economies, but arebeginning to change.
Market Economies: There are many names for a market system, includingcapitalism, laissez-faire, and free enterprise. In a market system most of theresources are owned by private citizens. Citizenscan own their own busmesses and can keep theprofits they earn from them. The importanteconomic questions are not answered by thegovernment, but by individuals themselves as theytake part in the economy. For example, thegovernment does not tell people what job theymust do. Instead, people have the freedom tomake that choice themselves. Likewise, thegovernment does not tell a business what productsit must produce and what price it must charge.
When individuals make decisions in a market system they are guided primarily bychanging prices. For example, suppose the wage rate for skilled automobilemechanics is very high, say $35 per hour! This high wage indicates that skilledmechanics are in great demand. The high wage provides a strong incentive forindividuals to get the training necessary to become a mechanic. Likewise, if ahigh price for strawberries results in high profits for strawberry growers, thiswould encourage producers to grow more strawberries. The key idea is that it isthe price that guides workers, businesses, and consumers, not the government.
Social Goals and Economic Systems
The economic decisions of individuals and governments reflect broad social goals.Economists have identified several of these goals:
Freedom the liberty of action individuals have to pursue economicdecisions, such as what work to pursue; and where, what goods, and servicesto consume.
Efficiency using the least expensive methods to produce goods and services.
Growth the long term increase in the goods and services available toindividuals.
Security protection against economic risks such as inflation, unemployment,and poverty.
Equity the issue of "fairness" in the marketplace and in the distribution ofincome.
Environmental Quality concern for a nation's environment and naturalresources.
1069 7
Sometimes these goals work against each other. For example, in a command economythe government may assign everyone a job, but the jobs may be very boring andinefficient. In this case, there may be job security, but growth, freedom, and efficiencysuffer. Another example is environmental protection. Laws which protect theenvironment restrict the freedom of businesses and may hinder growth.
In situations where goals work against each other, final economic policies usuallyinvolve trade-offs. For example, if environmental laws are passed which limit oilexploration in some wilderness areas, the society is trading-off the benefits of more oilfor a more beautiful environment. In this case, the society accepts less efficiency,freedom, and growth, but gains more environmental quality.
Which Economic System is Best?
Individuals differ on the answer to this question. However, economics systems thatemphasize the market approach certainly have proven to be best in promoting the goalsof growth, efficiency, and freedom. This is because in a market system citizens are freeto own their own property and use it in the most efficient and profitable way. Commandand traditional systems sometimes offer more security, but are not nearly so strong inefficiency, growth, freedom, and environmental quality.
98107

72 Questions To Master1. Explain why every country must have an economic system?
2. What are the three basic economic questions that every country must answer?
3. What are the three basic kinds of economic systems?
4. The former Soviet Union was an example of what kind of economic system?
5. Which kind of economic system is the best for raising the living standards (GDP) ofindividuals?
6. Which economic system is characterized by the least change?
7. Which economic system allows for the most individual freedom?
8. In which economic system is the government most influential?
9. In the market system what factor guides economic activity?
10. In which economic system do individuals do things based on how they have alwaysbeen done?
11. List five economic/social goals that nations use to guide individual and governmentdecisions.
108
09
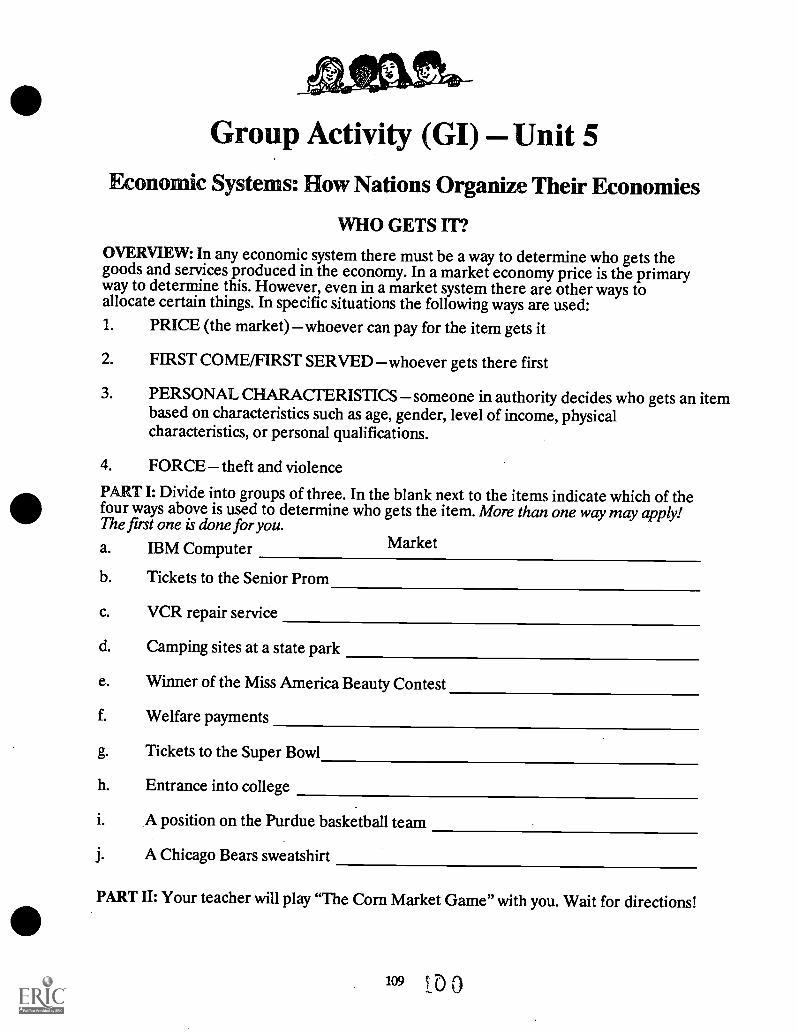
Group Activity (GI) Unit 5Economic Systems: How Nations Organize Their Economies
WHO GETS IT?
OVERVIEW: In any economic system there must be a way to determine who gets thegoods and services produced in the economy. In a market economy price is the primaryway to determine this. However, even in a market system there are other ways toallocate certain things. In specific situations the following ways are used:1. PRICE (the market) whoever can pay for the item gets it
2. FIRST COME/FIRST SERVED whoever gets there first
3. PERSONAL. CHARAC1ERISTICS someone in authority decides who gets an itembased on characteristics such as age, gender, level of income, physicalcharacteristics, or personal qualifications.
4. FORCE theft and violence
PART I: Divide into groups of three. In the blank next to the items indicate which of thefour ways above is used to determine who gets the item. More than one way may apply!The first one is done for you.
a. IBM Computer Market
b. Tickets to the Senior Prom
c. VCR repair service
d. Camping sites at a state park
e. Winner of the Miss America Beauty Contest
f. Welfare payments
g. Tickets to the Super Bowl
h. Entrance into college
i. A position on the Purdue basketball team
j. A Chicago Bears sweatshirt
PART II: Your teacher will play "The Corn Market Game" with you. Wait for directions!
109 ID 0

The Corn Market Game Student Instruction SheetOVERVIEW: In this game each student tries to make as much moneyas possible buying or selling corn. Your teacher will divide the classinto two groups representing buyers and sellers. There will be onewinner from each group. Before you begin you must understand therules of the game thoroughly. Read them carefully.
RULES:
1. The class will be divided into two groups, representing cornbuyers and corn sellers. Students remain either buyers orsellers during the whole game. Each student gets a CornMarket Score Sheet, with a different color paper for buyersand sellers.
2. Each person also will begin the game with a "Corn Card." Each card represents 10
bushels of corn. The Buy Corn Card will read: "You are authorized to BUY 10bushels of corn. Pay as little as possible. If you pay more than per bushel,for ten bushels, then you loss money." (There will be prices in the blanks.)
The Sell Corn Card will read: "You are authorized to SELL 10 bushels of corn. Get asmuch as possible. If you receive less than per bushel, for ten bushels, thenyou lose money." (There will be prices in the blanks.)
3. When your teacher says "Begin," you will try to make a trade with another person inthe class. Buyers trade with sellers and vice versa. You will have several minutesto make trades, and may make as many trades as you wishin the time period. Tryto negotiate the best trade possible. Buyers try to buy at the lowest possible price,sellers try to sell at the highest possible price. When haggling, the per bushelprice must be in increments of at least 10 cents. IMPORTANT: ASYOU MAKETRADES DO NOT REVEAL THE PRICE ON YOUR CORN CARD!
4. After each trade write the negotiated trade price on your Corn Card Score Sheet.Then put your Corn Card on the bottom of the correct pile and draw a new card.Take the card on top, and then proceed to make more trades. IMPORTANT:Sellers have an additional responsibility. After each trade tell your teacher thenegotiated trade price (not the price on the card!). Your teacher will keep arecord of these trade prices.
5. When your teacher says "Stop," sit down or continue making your last trade. Use yourCorn Market Score Sheets to record your profit or loss for the round. If you are abuyer you make a gain if you buy at a price lower than the amount on your card. Ifyou are a seller you make a gain if you sell at a price higher than the amount onyour card.
6. You will play several rounds, with your teacher varying the rules slightly after each round.The seller and the buyer with the highest profit after all rounds are the winners.
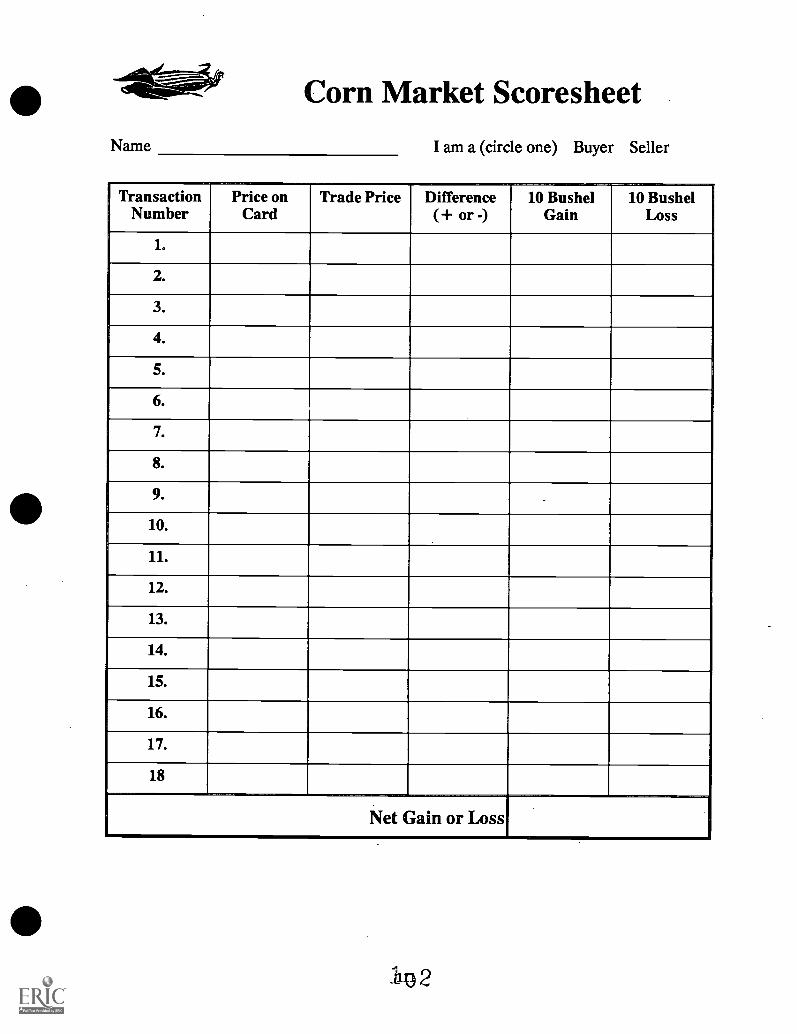
Name
Corn Market Scoresheet
I am a (circle one) Buyer Seller
TransactionNumber
Price onCard
Trade Price Difference(+ or -)
10 BushelGain
10 BushelLoss
1.
2.
3.
4.
5.
6.
7.
8.
9.
10.
11.
12.
13.
14.
15.
16.
17.
18
Net Gain or Loss
11j2
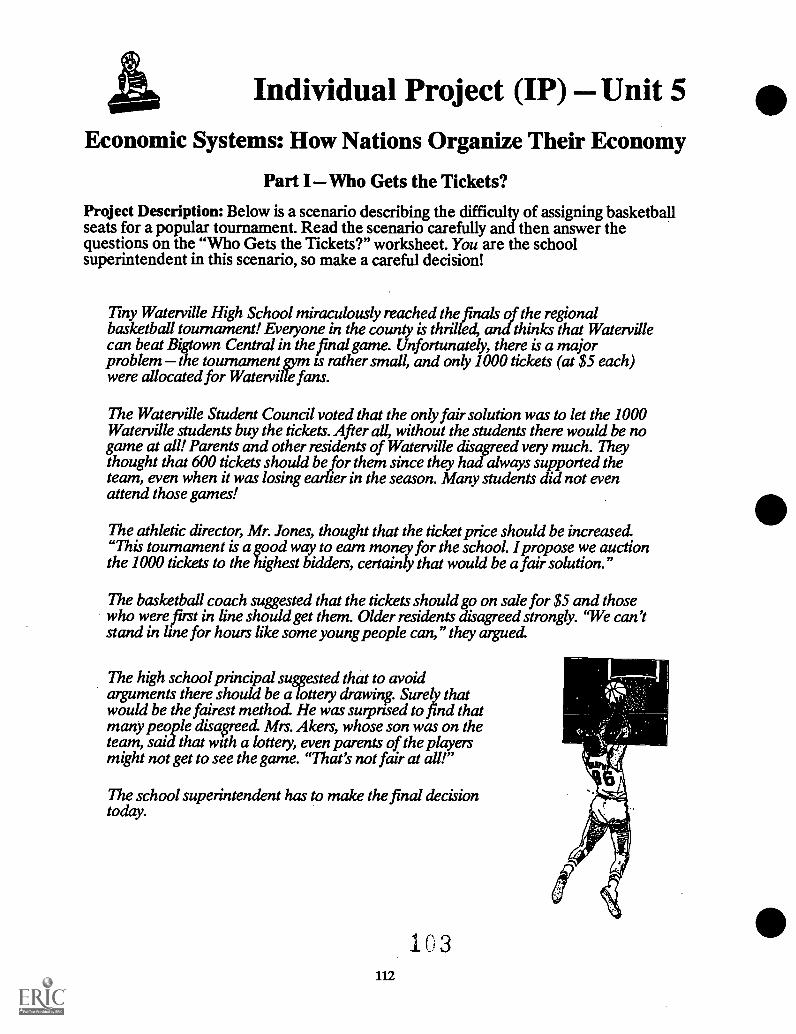
Individual Project (IP) Unit 5
Economic Systems: How Nations Organize Their Economy
Part I Who Gets the Tickets?
Project Description: Below is a scenario describing the difficulty of assigning basketballseats for a popular tournament. Read the scenario carefully and then answer thequestions on the "Who Gets the Tickets?" worksheet. You are the schoolsuperintendent in this scenario, so make a careful decision!
Tiny Waterville High School miraculously reached the finals of the regionalbasketball tournament! Everyone in the county is thrilled, and thinks that Watervillecan beat Bigtown Central in the final game. Unfortunately, there is a majorproblem the tournament gvm is rather small, and only 1000 tickets (at $5 each)were allocated for Waterville fans.
The Waterville Student Council voted that the only fair solution was to let the 1000Waterville students buy the tickets. After all, without the students there would be nogame at all! Parents and other residents of Waterville disagreed very much. Theythought that 600 tickets should be for them since they had always supported theteam, even when it was losing earlier in the season. Many students did not evenattend those games!
The athletic director, Mr. Jones, thought that the ticket price should be increased."This tournament is a good way to earn money for the school. I propose we auctionthe 1000 tickets to the highest bidders, certainly that would be a fair solution."
The basketball coach suggested that the tickets should go on sale for $5 and thosewho were first in line should get them. Older residents disagreed strongly. "We can'tstand in line for hours like some young people can," they argued.
The high school principal suggested that to avoidarguments there should be a lottery drawing. Surely thatwould be the fairest method. He was surprised to, nd thatmany people disagreed. Mrs. Akers, whose son was on theteam, said that with a lottery, even parents of the playersmight not get to see the game. "That's not fair at all!"
The school superintendent has to make the final decisiontoday.
103112

Who Gets the Tickets?Questions to Answer:
1. What is the basic economic problem in this scenario?
2. List the various suggestions for solving the economic problem. Also list the type ofsolution: a. Price b. First Come First Served or c. Personal Characteristics.(Remember, some solutions will be combinations of a, b, and c.)
Solution Type of Solution
III3. You are the school superintendent. Carefully describe your plan for allocating the
tickets. Explain why you chose this plan, and explain why you think it is fair. Usethe back if necessary.
104
113

Individual Project (IP) Unit 5
Economic Systems: How Nations Organize Their Economy
Part 11: From Command To Market
Project Description: This assignment will help you learn some of the countries of theworld that used to have command economies. You will also learn some of thedifficulties involved when changing from a command to a market economy.
You will receive a world map from your teacher. The map reflects the world in 1990,before the break up of the Soviet Union and the reunification of Germany. Thefollowing countries are listed in groups according to the kind of economic system thatthe countries had in 1989. (As you have learned, no country is perfectly market,command, or traditional.)
Command Market Traditional
Soviet Union Japan Bangladesh
Cuba Australia Ethiopia
North Korea France Haiti
Vietnam South Korea Sudan
East Germany West Germany Nepal
Albania England Zaire
Czechoslovakia Singapore Somalia
Bulgaria United States Papua New Guinea
Canada
Tasks to Complete:
A. First label these countries on the map. Then color these countries according to theirbasic type of economic system. Use red for command, blue for market, and greenfor traditional. (Don't forget to make a key on your map.)
B. Recently many command economies have attempted to change to a market economicsystem. These changes have not been easy. Search news magazines such as Timeor Newsweek for articles that describe some of the specific difficulties the peoplein these countries have had changing to a market system. Cut out or copy fourarticles. Underline sentences that illustrate these difficulties.
r r-114
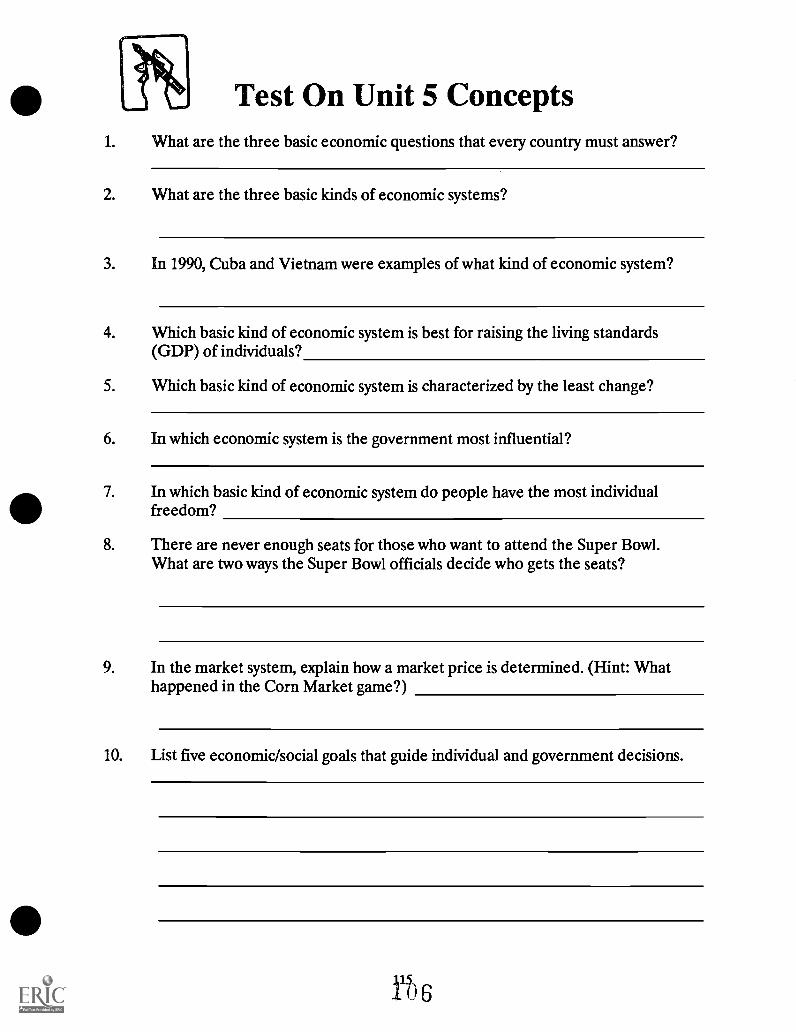
e Test On Unit 5 Concepts1. What are the three basic economic questions that every country must answer?
2. What are the three basic kinds of economic systems?
3. In 1990, Cuba and Vietnam were examples of what kind of economic system?
4. Which basic kind of economic system is best for raising the living standards(GDP) of individuals?
5. Which basic kind of economic system is characterized by the least change?
6. In which economic system is the government most influential?
7. In which basic kind of economic system do people have the most individualfreedom?
8. There are never enough seats for those who want to attend the Super Bowl.What are two ways the Super Bowl officials decide who gets the seats?
9. In the market system, explain how a market price is determined. (Hint: Whathappened in the Corn Market game?)
10. List five economic/social goals that guide individual and government decisions.

Cartuflcuarum ReanurceeThe Development Dear Book
This 16 page booklet gives social and economicstatistics on 129 countries. Statistics include lifeexpectaicy, adult literacy, population, GDP percapita, and merchandise exports. Manycolor-coded maps and charts are provided. Aseparate 52 page teaching guide is available.Approximate cost $6. Set of 11 booklets plusteaching guide costs $10 (1988).
World Bank PublicationsPO Box 7247-8619Philadelphia, PA 19170(908) 225-2165
Elementary Econounistaconomics frorKidsThis publication, published three times eachyear, explains basic economics concepts andhighlights K-6 teaching activities which teach theconcepts. Yearly subscription costs $15. Backissues pertaining to world trade topics areavailable at reasonable cost.
National Council on Economic Education432 Park Avenue SouthNew York, NY 100161(800) 338-1192
Give and Take
This 12 part video series is designed for middleschool and junior high students. Each 15-minutefilm covers a specific economic topic. Theteacher's manual contains students worksheets.Can be purchased through Purdue University for$37 (1982).
Self-Directed Learning Programs101 Young Graduate HousePurdue UniversityWest Lafayette, IN 47906(317) 494-2745
In the Marketplace (Level (C)
These nine comprehensive lessons on the worldeconomic community are designed for middleschool students. The lessons stress resources,trade, and interdependence. Blackline mastersfor students are included. 136 pages.Approximately cost $22 (1990).
National Council on Economic Education432 Park Avenue SouthNew York, NY 100161(800) 338-1192
/maw. Achievement
Junior Achievement's Project Business program,where business consultants visit middle schoolclassrooms to introduce students to business andeconomic concepts, offers an excellent opportunityfor students to question business people abouttheir firm's involvement in international trade.
Junior Achievement1317 North Pennsylvania StreetIndianapolis, IN 46202(317) 634-3519
Master Curriculum Guide: Strate.ul esTOT Teaching Economics Sunior THIigtn
This booklet contains many activities forteaching basic economics to middle and juniorhigh school students. Approximate cost $11(1981).
National Council on Economic Education432 Park Avenue SouthNew York, NY 100161(800) 338-1192
PC GI lobeXac Globe
This software is an enhanced electronicatlas/database. Students can retrieve a wealth ofdata, including maps, on 190 countries. IBMversion requires 512K memory and two drives.Macintosh requires 1 MB RAM and hard disk.Approximate cost $80. Available throughcurriculum software catalogs (1991).
Play Dough Economics
This booklet contains 15 motivational economicslessons for elementary and middle schoolstudents. In each lesson students use play doughto help them learn the concepts. Free to Indianateachers. Cost for out-of-state orders $5 (1988).
Indiana Department of EducationOffice of School AssistanceRoom 229, State HouseIndianapolis, IN 46204-2798(317) 232-9141
IT 7

Return to MochaThis animated cartoon video for middle schoolstudents portray the economics activities ofhumorous characters on make-believe South Seaislands. The key economic concepts presentedare trade, specialization, interdependence, andcomparative advantage. Available throughPurdue University. Approximate cost $25 (1986).
Self-Directed Learning Programs101 Young Graduate HousePurdue UniversityWest Lafayette, IN 47906(317) 494-2745
The Story of Foreign Tradeand ExchangeA simple and motivational explanation of foreigntrade and exchange done in comic-style format.Classroom sets up to 50 copies are sent free.Additional booklets are 150 each. Othereducational materials are available from theFederal Reserve System.
Federal Reserve Bank of New YorkPublic Information Department33 Liberty StreetNew York, NY 10045(212) 720-6134
118
Worild Polpgdation Data Sheet
This small pamphlet provides demographic dataand estimates for the countries and regions ofthe world. It is published by the PopulationReference Bureau, a private, nonprofiteducational organization that publishes othereducational materials on world population.Approximate cost $3 (1991).
Population Reference Bureau, Inc.1875 Connecticut Avenue, Suite 520Washington, DC 10009(202) 483-1100
WorldwaysThis booklet contains a wide variety ofmotivating lessons for making students moreknowledgeable about today's world. 251 pages.Approximate cost $18 (1987).
Addison-Wesley School Division1983 Hicks RoadRolling Meadows, IL 600081(800) 535-4391
C
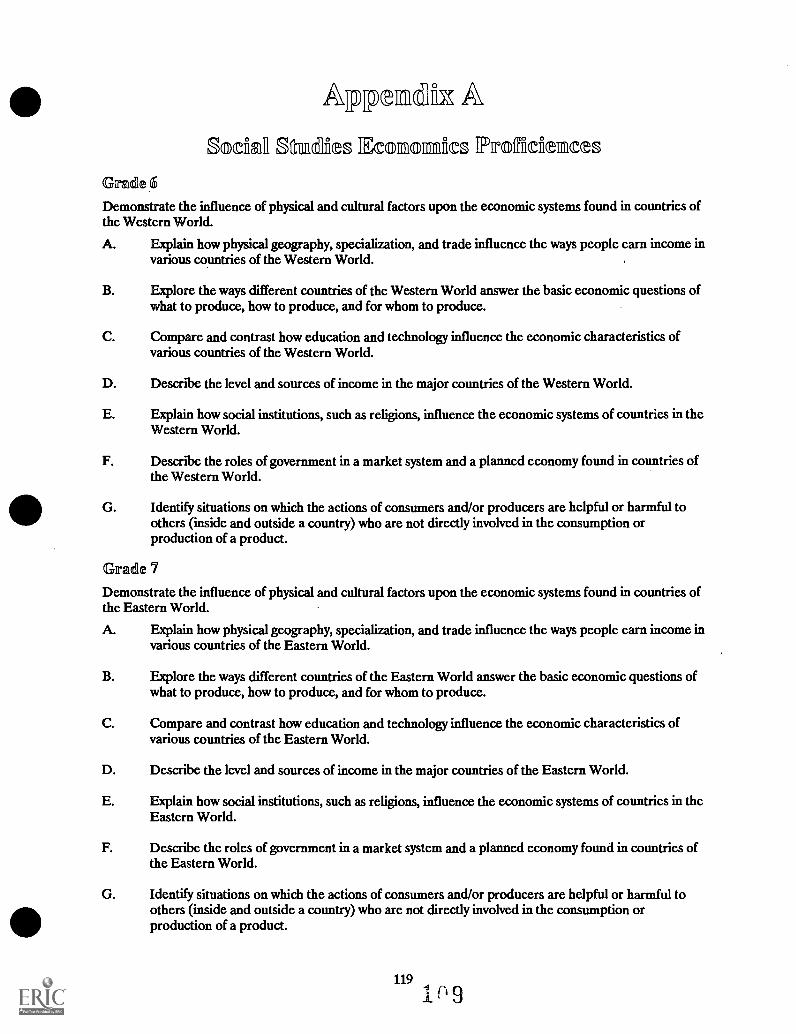
kalgeffildra
aoefie Sgundftes Ecomaornafics Illlocilefiermees
Grade 6Demonstrate the influence of physical and cultural factors upon the economic systems found in countries ofthe Western World.
A. Explain how physical geography, specialization, and trade influence the ways people earn income invarious countries of the Western World.
B. Explore the ways different countries of the Western World answer the basic economic questions ofwhat to produce, how to produce, and for whom to produce.
C. Compare and contrast how education and technology influence the economic characteristics ofvarious countries of the Western World.
D. Describe the level and sources of income in the major countries of the Western World.
E. Explain how social institutions, such as religions, influence the economic systems of countries in theWestern World.
F. Describe the roles of government in a market system and a planned economy found in countries ofthe Western World.
G. Identify situations on which the actions of consumers and/or producers are helpful or harmful toothers (inside and outside a country) who are not directly involved in the consumption orproduction of a product.
Grade 7Demonstrate the influence of physical and cultural factors upon the economic systems found in countries ofthe Eastern World.
A. Explain how physical geography, specialization, and trade influence the ways people earn income invarious countries of the Eastern World.
B. Explore the ways different countries of the Eastern World answer the basic economic questions ofwhat to produce, how to produce, and for whom to produce.
C. Compare and contrast how education and technology influence the economic characteristics ofvarious countries of the Eastern World.
D. Describe the level and sources of income in the major countries of the Eastern World.
E. Explain how social institutions, such as religions, influence the economic systems of countries in theEastern World.
F. Describe the roles of government in a market system and a planned economy found in countries ofthe Eastern World.
G. Identify situations on which the actions of consumers and/or producers are helpful or harmful toothers (inside and outside a country) who are not directly involved in the consumption orproduction of a product.
119
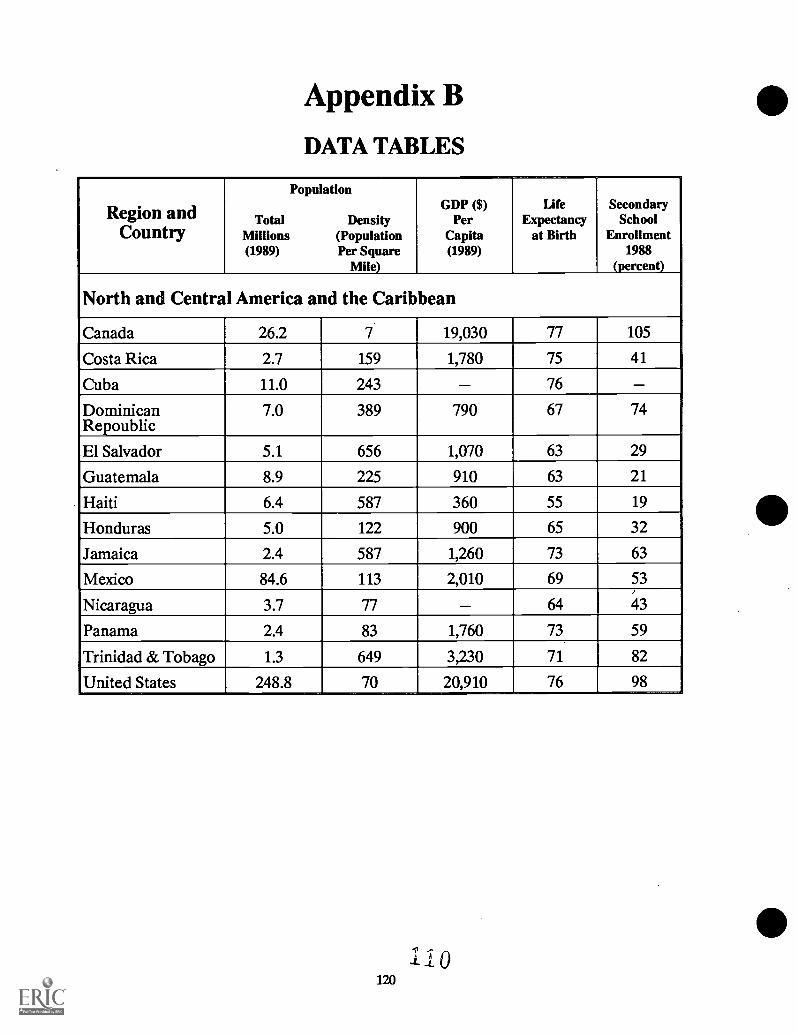
Appendix B
DATA TABLES
Region andCountry
Population
Total DensityMillions (Population(1989) Per Square
Mile)
GDP ($)Per
Capita(1989)
LifeExpectancy
at Birth
SecondarySchool
Enrollment1988
(percent)
North and Central America and the Caribbean
Canada 26.2 7 19,030 77 105
Costa Rica 2.7 159 1,780 75 41
Cuba 11.0 243 76
DominicanRepoublic
7.0 389 790 67 74
El Salvador 5.1 656 1,070 63 29
Guatemala 8.9 225 910 63 21
Haiti 6.4 587 360 55 19
Honduras 5.0 122 900 65 32
Jamaica 2.4 587 1,260 73 63
Mexico 84.6 113 2,010 69 53
Nicaragua 3.7 77 64 43
Panama 2.4 83 1,760 73 59
Trinidad & Tobago 1.3 649 3,230 71 82
United States 248.8 70 20,910 76 98
11120
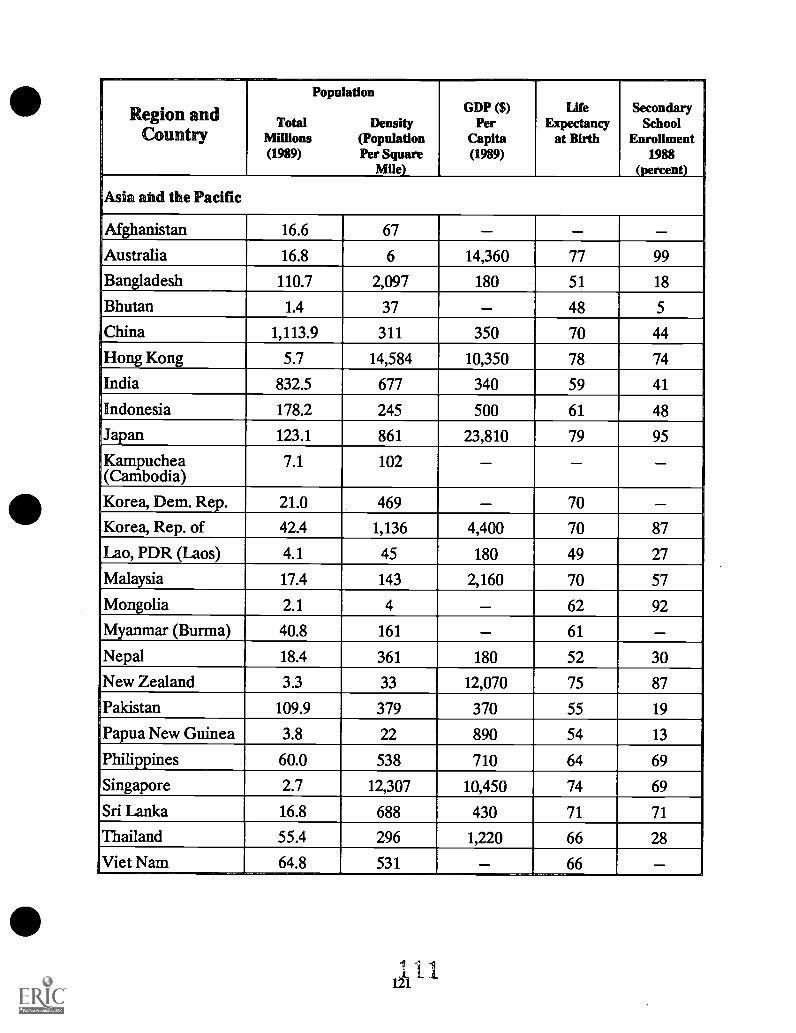
Region andCountry
Population
Total DensityMillions (Population(1989) Per Square
Mile)
GDP ($)Per
Capita(1989)
LifeExpectancy
at Birth
SecondarySchool
Enrollment1988
(percent)
Asia and the Pacific
Afghanistan 16.6 67
Australia 16.8 6 14,360 77 99
Bangladesh 110.7 2,097 180 51 18
Bhutan 1.4 37 48 5
China 1,113.9 311 350 70 44
Hong Kong 5.7 14,584 10,350 78 74
India 832.5 677 340 59 41
Indonesia 178.2 245 500 61 48
Japan 123.1 861 23,810 79 95
Kampuchea(Cambodia)
7.1 102
Korea, Dem. Rep. 21.0 469 70
Korea, Rep. of 42.4 1,136 4,400 70 87
Lao, PDR (Laos) 4.1 45 180 49 27
Malaysia 17.4 143 2,160 70 57
Mongolia 2.1 4 62 92
Myanmar (Burma) 40.8 161 61
Nepal 18.4 361 180 52 30
New Zealand 3.3 33 12,070 75 87
Pakistan 109.9 379 370 55 19
Papua New Guinea 3.8 22 890 54 13
Philippines 60.0 538 710 64 69
Singapore 2.7 12,307 10,450 74 69
Sri Lanka 16.8 688 430 71 71
Thailand 55.4 296 1,220 66 28
Viet Nam 64.8 531 66
121
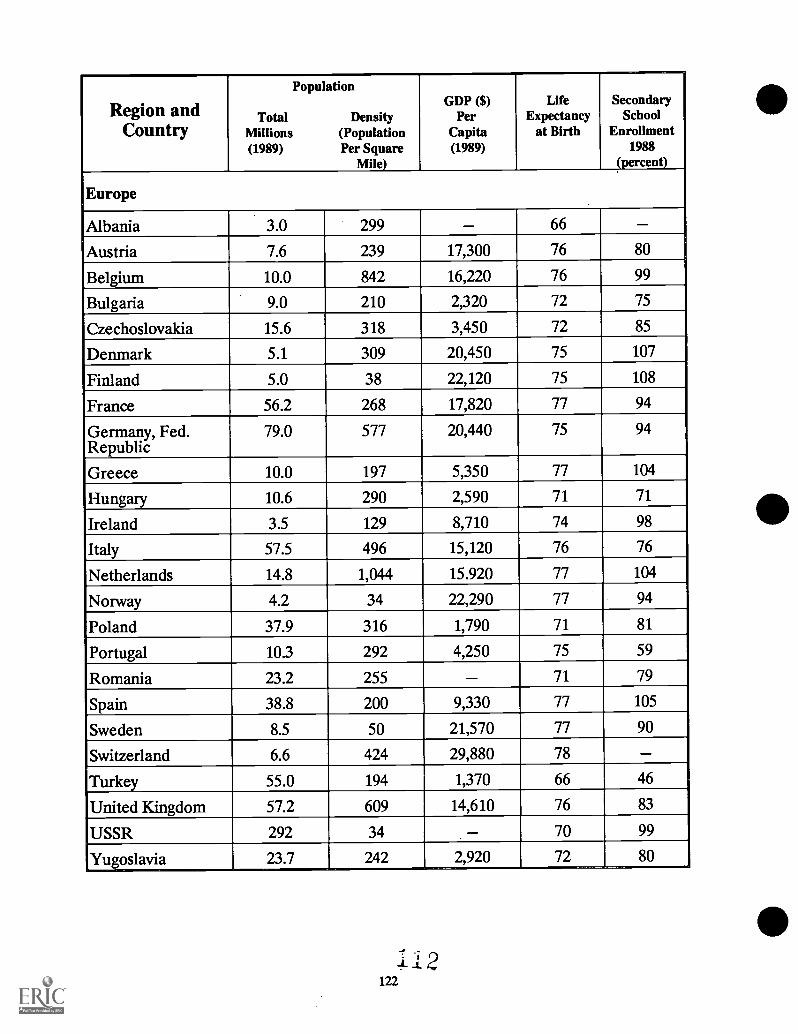
Region andCountry
Population
Total DensityMillions (Population(1989) Per Square
Mile)
GDP ($)Per
Capita(1989)
LifeExpectancy
at Birth
SecondarySchool
Enrollment1988
(percent)
Europe
Albania 3.0 299 66
Austria 7.6 239 17,300 76 80
Belgium 10.0 842 16,220 76 99
Bulgaria 9.0 210 2,320 72 75
Czechoslovakia 15.6 318 3,450 72 85
Denmark 5.1 309 20,450 75 107
Finland 5.0 38 22,120 75 108
France 56.2 268 17,820 77 94
Germany, Fed.Republic
79.0 577 20,440 75 94
Greece 10.0 197 5,350 77 104
Hungary 10.6 290 2,590 71 71
Ireland 3.5 129 8,710 74 98
Italy 57.5 496 15,120 76 76
Netherlands 14.8 1,044 15.920 77 104
Norway 4.2 34 22,290 77 94
Poland 37.9 316 1,790 71 81
Portugal 10.3 292 4,250 75 59
Romania 23.2 255 71 79
Spain 38.8 200 9,330 77 105
Sweden 8.5 50 21,570 77 90
Switzerland 6.6 424 29,880 78
Turkey 55.0 194 1,370 66 46
United Kingdom 57.2 609 14,610 76 83
USSR 292 34 70 99
Yugoslavia 23.7 242 2,920 72 80
122

Region andCountry
Population
Total DensityMillions (Population(1989) Per Square
Mile)
GDP ($)per
capita(1989)
LifeExpectancy
at Birth
SecondarySchool
Enrollment1988
(percent)
Middle East and North Africa
Algeria 24.4 28 2,230 65 61
Egypt 51.0 141 640 60 69
Iran 53.3 92 3,200 63 53
Iraq 18.3 102 63 47
Israel 4.5 606 9,790 76 83
Jordan 3.9 96 1,640 67
Kuwait 2.0 204 16,150 74 81
Lebanon 3.4 843
Libya 4.4 6 5,310 62
Morocco 24.5 152 880 61 36
Oman 1.5 19 5,220 65 42
Saudi Arabia 14.4 19 6,020 64 44
Syrian ArabRepublic
12.1 179 980 66 57
Tunisia 8.0 132 1,260 66 44
United ArabEmirates
1.5 74 18,430 71 62
Yemen, Republic 11.2 49 650 48
_.3
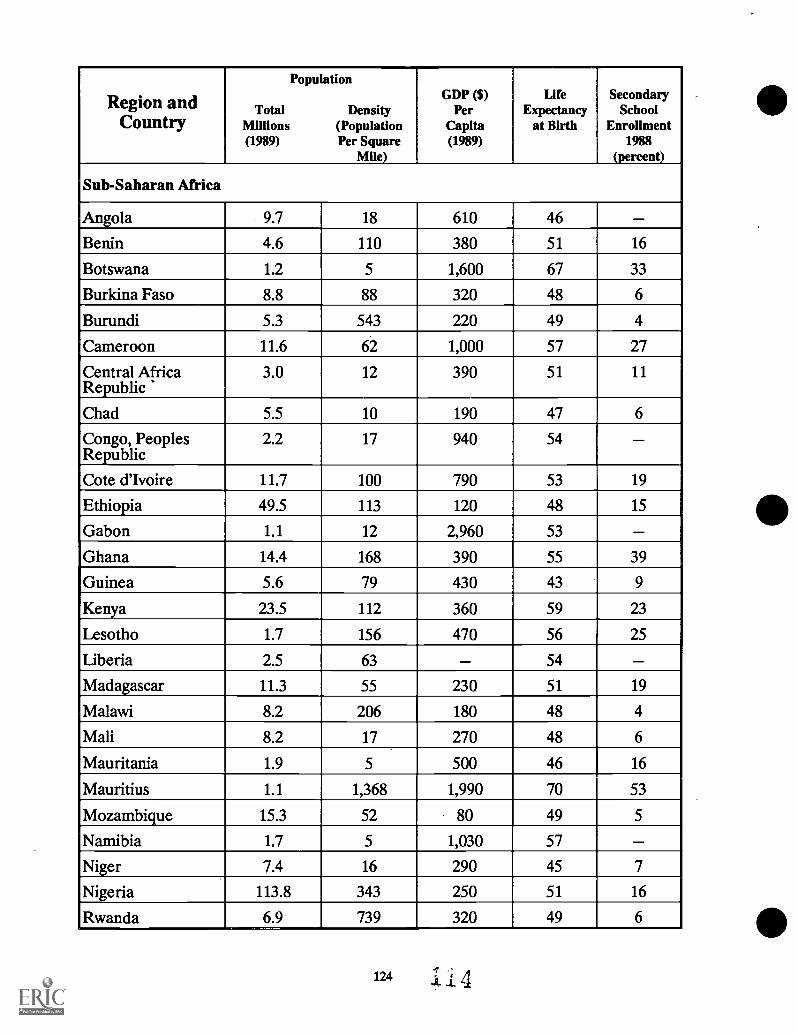
Region andCountry
Population
Total DensityMillions (Population(1989) Per Square
Mile)
GDP ($)Per
Capita(1989)
LifeExpectancy
at Birth
SecondarySchool
Enrollment1988
(percent)
Sub-Saharan Africa
Angola 9.7 18 610 46
Benin 4.6 110 380 51 16
Botswana 1.2 5 1,600 67 33
Burkina Faso 8.8 88 320 48 6
Burundi 5.3 543 220 49 4
Cameroon 11.6 62 1,000 57 27
Central AfricaRepublic
3.0 12 390 51 11
Chad 5.5 10 190 47 6
Congo, PeoplesRepublic
2.2 17 940 54
Cote d'Ivoire 11.7 100 790 53 19
Ethiopia 49.5 113 120 48 15
Gabon 1.1 12 2,960 53
Ghana 14.4 168 390 55 39
Guinea 5.6 79 430 43 9
Kenya 23.5 112 360 59 23
Lesotho 1.7 156 470 56 25
Liberia 2.5 63 54
Madagascar 11.3 55 230 51 19
Malawi 8.2 206 180 48 4
Mali 8.2 17 270 48 6
Mauritania 1.9 5 500 46 16
Mauritius 1.1 1,368 1,990 70 53
Mozambique 15.3 52 80 49 5
Namibia 1.7 5 1,030 57
Niger 7.4 16 290 45 7
Nigeria 113.8 343 250 51 16
Rwanda 6.9 739 320 49 6
124 11 4
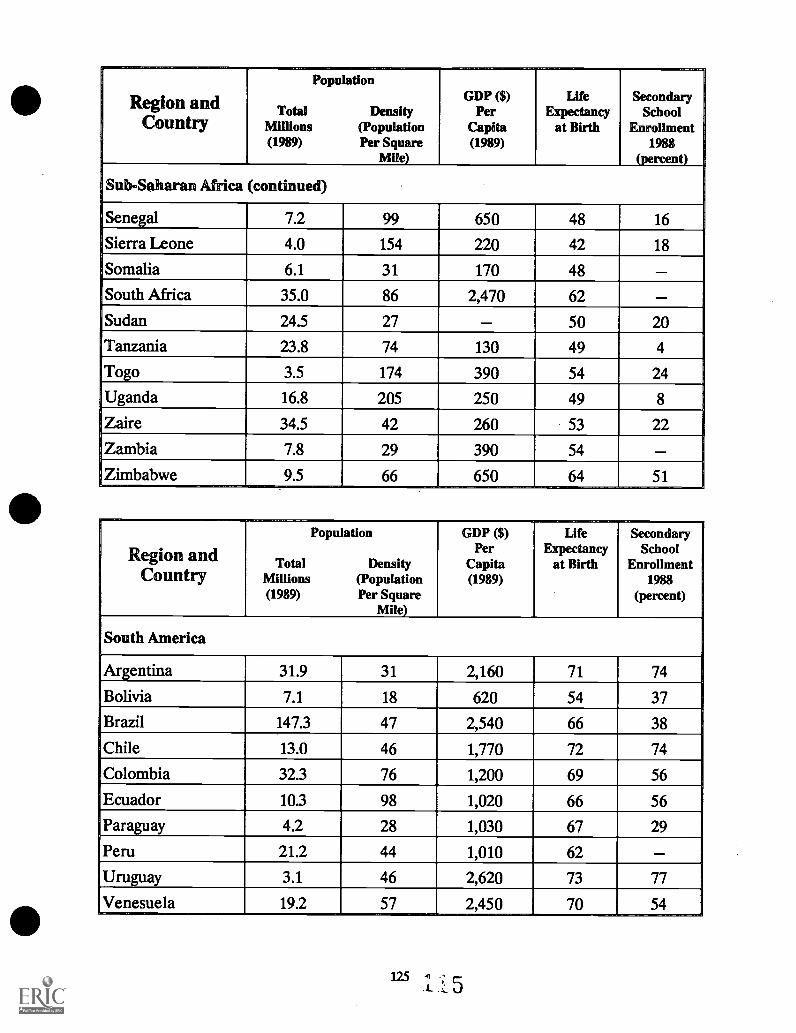
Region andCountry
Population
Total DensityMillions (Population(1989) Per Square
Mile)
GDP ($)Per
Capita(1989)
LifeExpectancy
at Birth
SecondarySchool
Enrollment1988
(percent)
Sub-Saharan Africa (continued)
Senegal 7.2 99 650 48 16
Sierra Leone 4.0 154 220 42 18
Somalia 6.1 31 170 48
South Africa 35.0 86 2,470 62
Sudan 24.5 27 50 20
Tanzania 23.8 74 130 49 4
Togo 3.5 174 390 54 24
Uganda 16.8 205 250 49 8
Zaire 34.5 42 260 53 22
Zambia 7.8 29 390 54
Zimbabwe 9.5 66 650 64 51
Region an dCountry
Population
Total DensityMillions (Population(1989) Per Square
Mile)
GDP ($)Per
Capita(1989)
LifeExpectancy
at Birth
SecondarySchool
Enrollment1988
(percent)
South America
Argentina 31.9 31 2,160 71 74
Bolivia 7.1 18 620 54 37
Brazil 147.3 47 2,540 66 38
Chile 13.0 46 1,770 72 74
Colombia 32.3 76 1,200 69 56
Ecuador 10.3 98 1,020 66 56
Paraguay 4.2 28 1,030 67 29
Peru 21.2 44 1,010 62
Uruguay 3.1 46 2,620 73 77
Venesuela 19.2 57 2,450 70 54
125 5
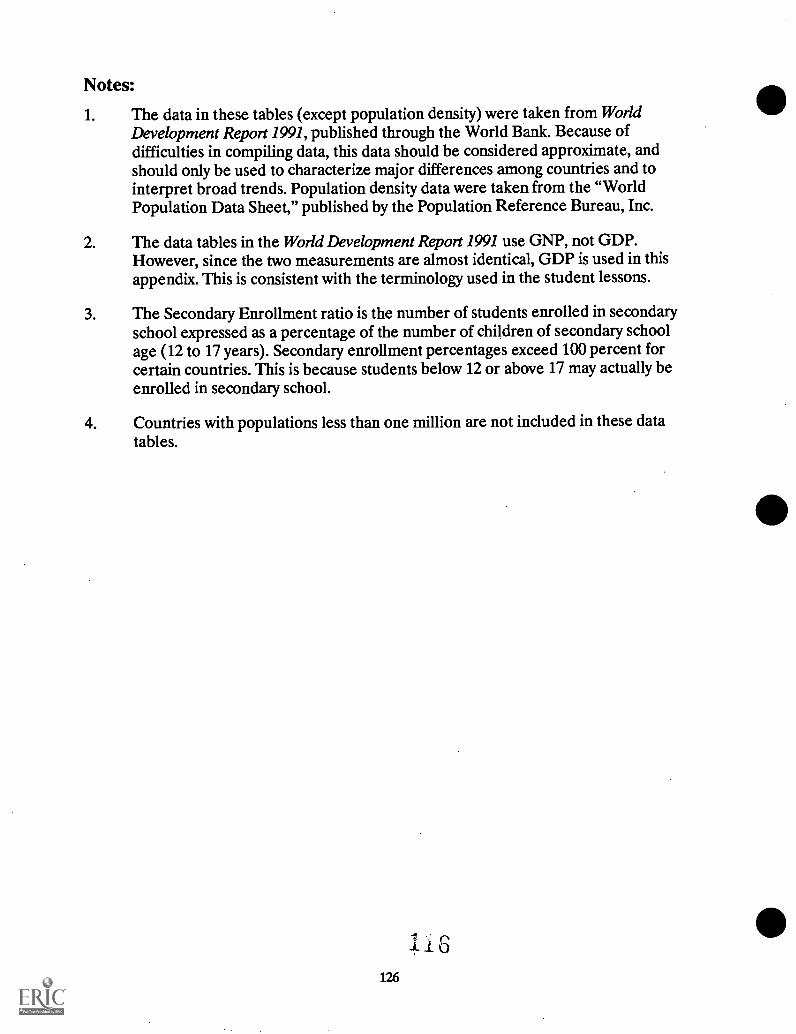
Notes:
1. The data in these tables (except population density) were taken from WorldDevelopment Report 1991, published through the World Bank. Because ofdifficulties in compiling data, this data should be considered approximate, andshould only be used to characterize major differences among countries and tointerpret broad trends. Population density data were taken from the "WorldPopulation Data Sheet," published by the Population Reference Bureau, Inc.
2. The data tables in the World Development Report 1991 use GNP, not GDP.However, since the two measurements are almost identical, GDP is used in thisappendix. This is consistent with the terminology used in the student lessons.
3. The Secondary Enrollment ratio is the number of students enrolled in secondaryschool expressed as a percentage of the number of children of secondary schoolage (12 to 17 years). Secondary enrollment percentages exceed 100 percent forcertain countries. This is because students below 12 or above 17 may actually beenrolled in secondary school.
4. Countries with populations less than one million are not included in these datatables.
126

Policy Notification Statement
It is the policy of the Indiana Department of Education not to discriminate on the basis of race, color,religion, sex, national origin, age, or handicap, in its programs or employment policies as required by theIndiana Civil Rights Act (I.C. 22-9.1), Title VI and VII (Civil Rights Act of 1964), the Equal Pay Act of 1973,Title IX (Educational Amendments), and Section 504 (Rehabilitation Act of 1973).
Inquiries regarding compliance with Title IX may be directed to the Human Resources Director, IndianaDepartment of Education, Room 229, State House, Indianapolis, IN 46204-2798, or to the Director of theOffice of Civil Rights, Department of Health and Human Services, Washington, DC; Dr. Suellen Reed,State Superintendent of Public Instruction.

(9/92)
U.S. DEPARTMENT OF EDUCATIONOffice of Educational Research and Improvement (OERI)
Educational Resources information Center (ERIC)
NOTICE
REPRODUCTION BASIS
I ERIC I
This document is covered by a signed "Reproduction Release(Blanket)" form (on file within the ERIC system), encompassing allor classes of documents from its source organization and, therefore,does not require a "Specific Document" Release form.
This document is Federally-funded, or carries its own permission toreproduce, or is otherwise in the public domain and, therefore, maybe reproduced by ERIC without a signed Reproduction Releaseform (either "Specific Document" or "Blanket").