ICR IL - Global Environment Facility | · Web viewIMPLEMENTATION COMPLETION AND RESULTS...
67
Document of The World Bank Report No: ICR00001422 IMPLEMENTATION COMPLETION AND RESULTS REPORT (TF052981) ON A GLOBAL ENVIRONMENT FACILITY GRANT IN THE AMOUNT OF US$4.87 MILLION TO ALBANIA FOR AN INTEGRATED WATER AND ECOSYSTEMS MANAGEMENT PROJECT June 11, 2010 Sustainable Development Department Southeast Europe Country Unit Europe and Central Asia Region
Transcript of ICR IL - Global Environment Facility | · Web viewIMPLEMENTATION COMPLETION AND RESULTS...
Document of The World Bank
Report No: ICR00001422
IMPLEMENTATION COMPLETION AND RESULTS REPORT(TF052981)
ON A
GLOBAL ENVIRONMENT FACILITY GRANT
IN THE AMOUNT OF US$4.87 MILLION
TO
ALBANIA
FOR AN
INTEGRATED WATER AND ECOSYSTEMS MANAGEMENT PROJECT
June 11, 2010
Sustainable Development DepartmentSoutheast Europe Country UnitEurope and Central Asia Region
CURRENCY EQUIVALENTS(Exchange Rate Effective February 1, 2010)
Currency Unit = LekLek 1.00 = US$0.01US$1.00 = Lek 100
FISCAL YEARJanuary 1 - December 31
ABBREVIATIONS AND ACRONYMS
BOD Biological Oxygen DemandCAS Country Assistance StrategyCTW Constructed Treatment WetlandsEIA Environmental Impact AssessmentEIB European Investment BankEU European UnionEMPF Environmental Management Plan FrameworkGEF Global Environment FacilityIPA Instrument for Pre-Accession (of the European Union)IWEMP Integrated Water and Ecosystems Management ProjectKfW Kreditanstalt für Wiederaufbau (Germany)MoE Ministry of EconomyMEFWA Ministry of Environment, Forestry and Water AdministrationMoF Ministry of FinanceMoTAT Ministry of Territorial Adjustment and TourismMPWTT Ministry of Public Works, Transport and TelecommunicationsNRW Non-Revenue WaterNWRC National Water Regulatory CommissionNWSS National Water Supply and Sanitation StrategyO & M Operations & MaintenancePIU Project Implementation Unit (in the MPWTT)PO Private OperatorWWTP Wastewater Treatment Plant
Vice President: Philippe Le HouerouCountry Director: Jane Armitage
Sector Manager: Wael Zakout Project Team Leader: Michael John Webster
ICR Team Leader Michael John Webster
ALBANIAIntegrated Water and Ecosystems Management Project (IWEMP)
CONTENTS
Data SheetA. Basic InformationB. Key DatesC. Ratings SummaryD. Sector and Theme CodesE. Bank StaffF. Results Framework AnalysisG. Ratings of Project Performance in ISRsH. Restructuring I. Disbursement Graph
1. Project Context, Global Environment Objectives and Design....................................12. Key Factors Affecting Implementation and Outcomes...............................................63. Assessment of Outcomes...........................................................................................104. Assessment of Risk to Development Outcome.........................................................145. Assessment of Bank and Borrower Performance......................................................156. Lessons Learned........................................................................................................177. Comments on Issues Raised by Borrower/Implementing Agencies/Partners...........18Annex 1. Project Costs and Financing...........................................................................19Annex 2. Outputs by Component..................................................................................20Annex 3. Economic and Financial Analysis..................................................................21Annex 4. Bank Lending and Implementation Support/Supervision Processes.............38Annex 5. Beneficiary Survey Results............................................................................40Annex 6. Stakeholder Workshop Report and Results...................................................41Annex 7. Summary of Borrower's ICR and/or Comments on Draft ICR......................42Annex 8. Comments of Cofinanciers and Other Partners/Stakeholders........................43Annex 9. List of Supporting Documents...........................................................................
MAP
I N S E R T
D A T A S H E E T
H E R E
AFTER APPROVAL BY COUNTRY DIRECTOR
AN UPDATED DATA SHEET SHOULD BE INSERTED
MANUALLY IN HARD COPY
BEFORE SENDING A FINAL ICR TO THE PRINT SHOP.
NOTE: The Data Sheet is generated by the system
using the information entered in the Operations Portal
each time you use “Send Draft”, “Print” or “Submit Final” functions.

1. Project Context, Global Environment Objectives and Design
The Integrated Water and Ecosystems Management Project (IWEMP) was originally part of the International Development Association (IDA)-financed Municipal Water and Wastewater Project, but due to the extensive consultation process for the Global Environment Facility (GEF)/European Investment Bank (EIB) project, the World Bank processed the IDA credit in advance of the GEF approval. The IDA-supported Municipal Water and Wastewater Project and the GEF/EIB-supported project, although technically separated into two projects, were still intended to achieve an overarching development objective. The development objective of the GEF/EIB project was to improve municipal wastewater services in the coastal cities of Durres, Lezha, and Saranda. By achieving this objective the project was to contribute to economic growth in these three tourist cities, the continued prosperity of which depends heavily on a healthy coastal environment. To this end, the EIB-financed conventional wastewater plants in each of the three coastal cities.
The GEF financing was designed to meet the global environment objective of improving the health and habitat conditions of globally significant marine and coastal ecosystems along the coastline of Albania in an integrated manner. These global objectives were to be achieved through: (i) reduction of sewage pollution loads through the development and establishment of low-cost water treatment technologies Constructed Treatment Wetlands (CTWs) producing environmental incremental benefits; (ii) promotion of the establishment and improvement of the management of the Kune Vain protected marshland; and (iii) improvement of the dialogue between public institutions and citizens through a public communications program as well as a program of dissemination and replication of project achievements.
1.1 Context at Appraisal
Albania is endowed with water resources of 8,600 m3 per capita and year. This generous allowance helps the country provide high coverage of water supply and sewerage services. Currently the share of the 3.1 million strong population connected to a piped water network is estimated at 87% for the 65 urban municipalities and 47% in the 309 rural communes, or an aggregate of 74% for the total population. The corresponding coverage of sewerage is 68% in the urban municipalities and 3% in the rural communes.
The relatively high coverage is negated by the poor quality of service. It is estimated that the water captured at the source is generally of good quality and only needs disinfection with chlorine. The quality of water available to consumers at their taps is an entirely different matter, because service is rarely continuous. While data on water quality are not fully reliable, it is well known that water quality deteriorates due to the intrusion of surrounding polluted groundwater that enters the periodically empty pipe wherever water is intermittent as is the case in Albania. Wastewater management is in a worse state than water supplies. Whatever wastewater collection exists has not been maintained and is often overloaded due to cross-connections with the rainwater drainage causing periodic flooding of raw sewage. Reportedly there is no well-functioning wastewater treatment plant (WWTP) in Albania.
1

The underlying cause of this dire state is the weakness of the utilities that are subject to political dominance from local municipal councils and from the central government. At the same time, Albania must improve the safety of its water supplies and wastewater management since the country aspires to gain pre-accession status to the European Union. Pre-accession will demand that the country make significant progress towards the EU Water and Wastewater Directives. The country has relied on foreign donors to finance the investments in the water supply and sanitation sector. The main donors have been the KfW, the EIB, and the World Bank with IDA funding.
Initially, the World Bank group financed two emergency repair projects: (i) the Durres Water Supply Rehabilitation Project (DWSRP), approved in May 1994 (total cost US$17.6 million, of which US$11.6 million was financed by IDA and US$5.5 million by the Government); and (ii) the Albania Water Supply Urgent Rehabilitation Project (WSURP), approved in February 2000 (total cost US$14.6 million of which US$10 million was financed by IDA). The World Bank then attempted to focus more on building capacity through financing a Management Contract with investments in Durres, Fier, Lezha, and Saranda under the Municipal Water and Wastewater Project (MWWP) in an amount of US$15 million. The Integrated Water and Ecosystems Management Project became the fourth World Bank project within a ten-year span. It addressed the need for sustainable wastewater management and environmental improvements and took advantage of EIB financing of conventional wastewater treatment in Durres, Lezha, and Saranda and of a GEF grant to introduce innovative, low-cost treatment through Constructed Treatment Wetlands. The intent was to be able to count on the improved capacity to operate and maintain the wastewater systems offered by the expected presence of a private Management Contractor.
1.2 Original Global Environment Objectives (GEO) and Key Indicators
The Project Appraisal Document (PAD) specifies the project development objective (PDO) of the GEF/EIB project as “to improve the municipal wastewater services in the coastal cities of Durres, Lezha and Saranda.” The global environmental objective (GEO) is to improve the health and habitat conditions of globally significant marine and coastal ecosystems along the coastline of Albania in an integrated manner. The GEF Grant Agreement shortens the wording of the objective of the Project to read “to improve the municipal wastewater services in the Recipient’s coastal areas.” For the purposes of the ICR the PAD wording of the objectives has been retained since it makes a clear distinction between the PDO related to wastewater services and the GEOs.
The key performance indicators were to remove 50% for Total Nitrogen (N), 25% for Total Phosphorous (P), and 70% for Biological Oxygen Demand (BOD5) in the wastewaters from the three participating municipalities.
1.3 Revised GEO (as approved by original approving authority) and Key Indicators, and reasons/justification
The GEOs were not changed although the values of performance indicators related to two GEOs were modified during the Mid-Term-Review as follows:
2
GEO, original GEO, revised Reason for change1.Improved health of posidonia oceanic (seagrass) meadows: biomass per surface unit; shoot density, epiphyte growth and area covered.
Monitoring of posidonia oceanica (seagrass) meadows
Sea grass is a suitable long-term indicator. Even with 100% successful implementation it is not expected that effects on seagrass become visible within project lifetime
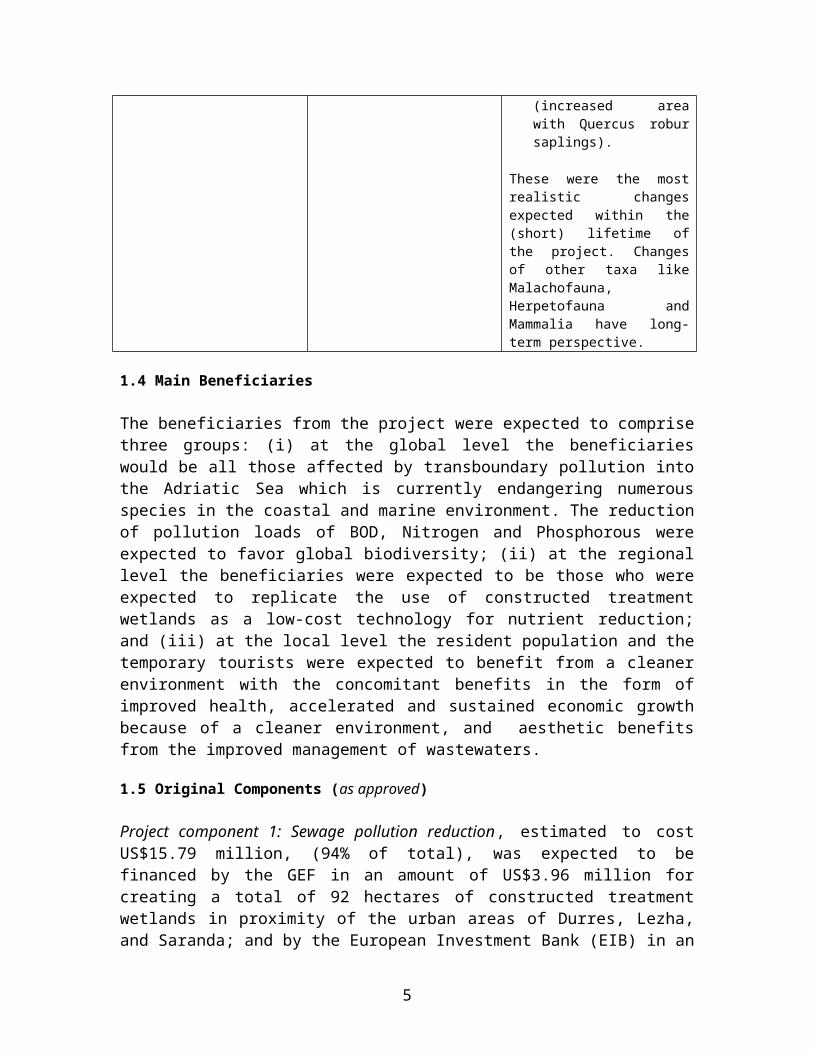
2. Improved biodiversity in Kune Vain Managed Area regarding the following flagship Classes: Malachofauna, Herpetofauna, Avifauna, and Mammalia.
Improved biodiversity in Kune Vain Managed Area regarding flora and fauna
End-of-project target values have been reduced to three basic short-term biodiversity indicators as follows.
Improved baseline for selected short-term indicators:
# of breeding wetland bird species (>12);
# of wintering water birds (>3000); and
recovery of estuarine forests (increased area with Quercus robur saplings).
These were the most realistic changes expected within the (short) lifetime of the project. Changes of other taxa like Malachofauna, Herpetofauna and Mammalia have long-term perspective.
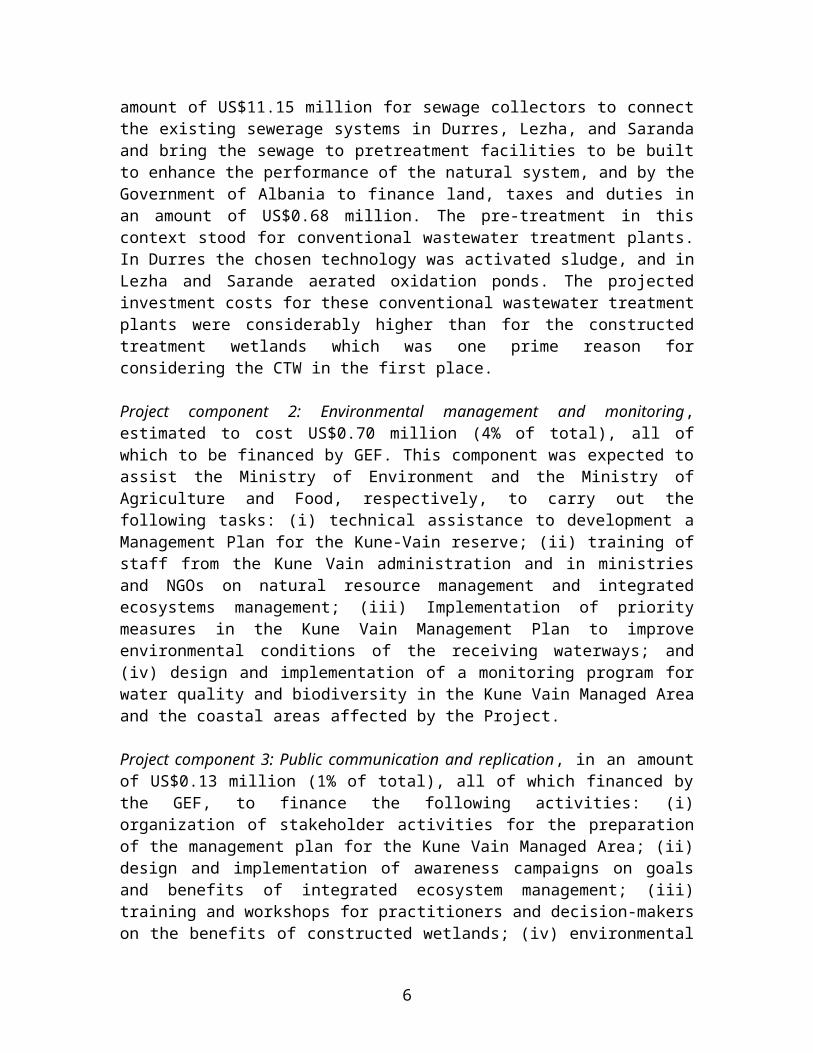
1.4 Main Beneficiaries
The beneficiaries from the project were expected to comprise three groups: (i) at the global level the beneficiaries would be all those affected by transboundary pollution into the Adriatic Sea which is currently endangering numerous species in the coastal and marine environment. The reduction of pollution loads of BOD, Nitrogen and Phosphorous were expected to favor global biodiversity; (ii) at the regional level the beneficiaries were expected to be those who were expected to replicate the use of constructed treatment wetlands as a low-cost technology for nutrient reduction; and (iii) at the local level the resident population and the temporary tourists were expected to benefit from a cleaner environment with the concomitant benefits in the form of improved health, accelerated and sustained economic growth because of a cleaner environment, and aesthetic benefits from the improved management of wastewaters.
1.5 Original Components (as approved)
Project component 1: Sewage pollution reduction, estimated to cost US$15.79 million, (94% of total), was expected to be financed by the GEF in an amount of US$3.96 million for creating a total of 92 hectares of constructed treatment wetlands in proximity of the
3
urban areas of Durres, Lezha, and Saranda; and by the European Investment Bank (EIB) in an amount of US$11.15 million for sewage collectors to connect the existing sewerage systems in Durres, Lezha, and Saranda and bring the sewage to pretreatment facilities to be built to enhance the performance of the natural system, and by the Government of Albania to finance land, taxes and duties in an amount of US$0.68 million. The pre-treatment in this context stood for conventional wastewater treatment plants. In Durres the chosen technology was activated sludge, and in Lezha and Sarande aerated oxidation ponds. The projected investment costs for these conventional wastewater treatment plants were considerably higher than for the constructed treatment wetlands which was one prime reason for considering the CTW in the first place.
Project component 2: Environmental management and monitoring, estimated to cost US$0.70 million (4% of total), all of which to be financed by GEF. This component was expected to assist the Ministry of Environment and the Ministry of Agriculture and Food, respectively, to carry out the following tasks: (i) technical assistance to development a Management Plan for the Kune-Vain reserve; (ii) training of staff from the Kune Vain administration and in ministries and NGOs on natural resource management and integrated ecosystems management; (iii) Implementation of priority measures in the Kune Vain Management Plan to improve environmental conditions of the receiving waterways; and (iv) design and implementation of a monitoring program for water quality and biodiversity in the Kune Vain Managed Area and the coastal areas affected by the Project.
Project component 3: Public communication and replication, in an amount of US$0.13 million (1% of total), all of which financed by the GEF, to finance the following activities: (i) organization of stakeholder activities for the preparation of the management plan for the Kune Vain Managed Area; (ii) design and implementation of awareness campaigns on goals and benefits of integrated ecosystem management; (iii) training and workshops for practitioners and decision-makers on the benefits of constructed wetlands; (iv) environmental education and communication program for local communities; (v) a pilot teachers’ training program in ecology and environmental education in selected schools; and (v) technical assistance to develop a replication strategy of the Constructed Wetlands Treatment in Albania and elsewhere.
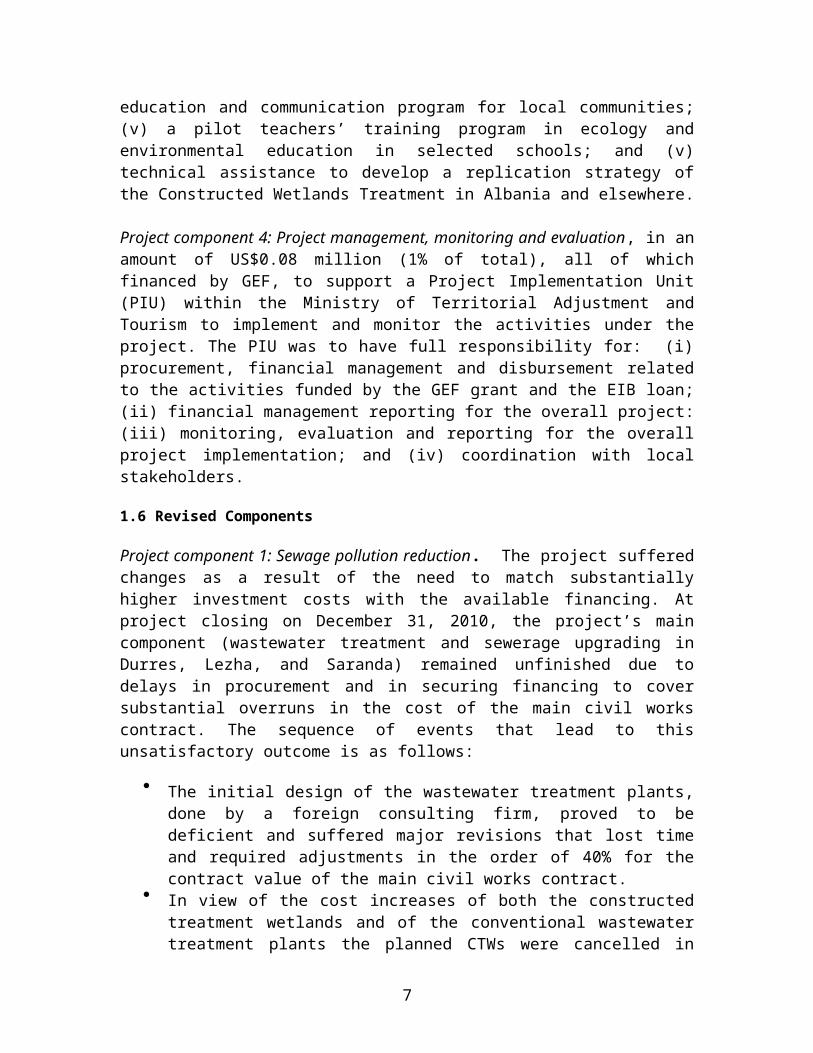
Project component 4: Project management, monitoring and evaluation, in an amount of US$0.08 million (1% of total), all of which financed by GEF, to support a Project Implementation Unit (PIU) within the Ministry of Territorial Adjustment and Tourism to implement and monitor the activities under the project. The PIU was to have full responsibility for: (i) procurement, financial management and disbursement related to the activities funded by the GEF grant and the EIB loan; (ii) financial management reporting for the overall project: (iii) monitoring, evaluation and reporting for the overall project implementation; and (iv) coordination with local stakeholders.
1.6 Revised Components
Project component 1: Sewage pollution reduction. The project suffered changes as a result of the need to match substantially higher investment costs with the available
4
financing. At project closing on December 31, 2010, the project’s main component (wastewater treatment and sewerage upgrading in Durres, Lezha, and Saranda) remained unfinished due to delays in procurement and in securing financing to cover substantial overruns in the cost of the main civil works contract. The sequence of events that lead to this unsatisfactory outcome is as follows:
The initial design of the wastewater treatment plants, done by a foreign consulting firm, proved to be deficient and suffered major revisions that lost time and required adjustments in the order of 40% for the contract value of the main civil works contract.
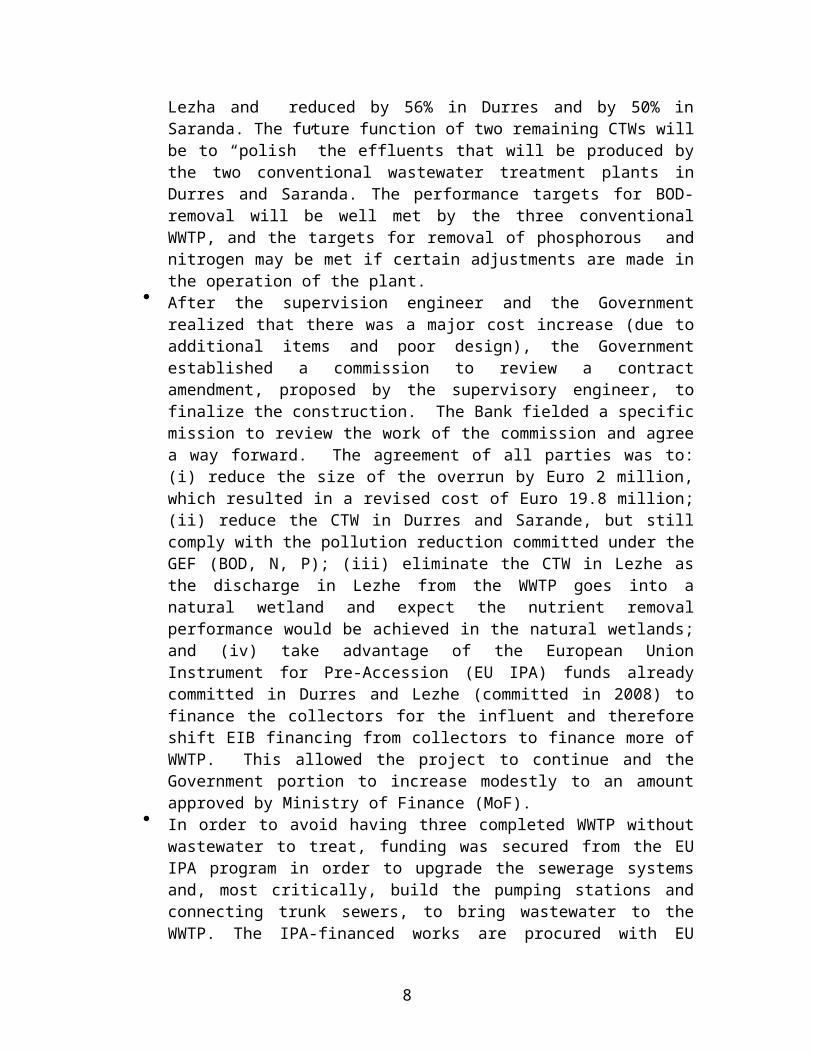
In view of the cost increases of both the constructed treatment wetlands and of the conventional wastewater treatment plants the planned CTWs were cancelled in Lezha and reduced by 56% in Durres and by 50% in Saranda. The future function of two remaining CTWs will be to “polish” the effluents that will be produced by the two conventional wastewater treatment plants in Durres and Saranda. The performance targets for BOD-removal will be well met by the three conventional WWTP, and the targets for removal of phosphorous and nitrogen may be met if certain adjustments are made in the operation of the plant.
After the supervision engineer and the Government realized that there was a major cost increase (due to additional items and poor design), the Government established a commission to review a contract amendment, proposed by the supervisory engineer, to finalize the construction. The Bank fielded a specific mission to review the work of the commission and agree a way forward. The agreement of all parties was to: (i) reduce the size of the overrun by Euro 2 million, which resulted in a revised cost of Euro 19.8 million; (ii) reduce the CTW in Durres and Sarande, but still comply with the pollution reduction committed under the GEF (BOD, N, P); (iii) eliminate the CTW in Lezhe as the discharge in Lezhe from the WWTP goes into a natural wetland and expect the nutrient removal performance would be achieved in the natural wetlands; and (iv) take advantage of the European Union Instrument for Pre-Accession (EU IPA) funds already committed in Durres and Lezhe (committed in 2008) to finance the collectors for the influent and therefore shift EIB financing from collectors to finance more of WWTP. This allowed the project to continue and the Government portion to increase modestly to an amount approved by Ministry of Finance (MoF).
In order to avoid having three completed WWTP without wastewater to treat, funding was secured from the EU IPA program in order to upgrade the sewerage systems and, most critically, build the pumping stations and connecting trunk sewers, to bring wastewater to the WWTP. The IPA-financed works are procured with EU tender rules and have suffered from their initial poor design. At the present time, it is estimated that these works will not be completed until sometime in 2011 for Lezha and Saranda, and sometime in 2012 for Durres. As a consequence, if the three WWTP could be completed by early 2011, conditioned on additional financing, they will be without wastewater to treat for six months to two years depending on the plant;
5
By securing additional IPA grant funds EIB financing were able to be redirected to finance the escalating construction cost of the three conventional WWTP; however, this in turn deprived the upgrading of existing sewerage systems of the needed funding as the IPA funds were delayed.
Project component 2: Environmental management and monitoring was implemented as planned.
Project component 3: Public communication and replication was partially implemented with respect to consultations in order to promote the adoption a Management Plan for the Kune-Vain Managed reserve
Project component 4: Project management, monitoring and evaluation was implemented with respect to project management, but not with due respect to the monitoring and evaluation of the project.
1.7 Other significant changes
Project component 1: Sewage pollution reduction. The changes in project scale, scheduling and funding allocations have been described in section 1.6. In addition, it should be noted that the delayed and slower project implementation increased project costs, due to inflation. The financing plan was further squeezed by the fact that the US dollar, in which the GEF grant is denominated, depreciated during the implementation period with respect to the Euro in which the project expenditures and contracts were denominated. Project implementation was also slowed by late payments from the Government of Albania of contractual counterpart funds.
2. Key Factors Affecting Implementation and Outcomes
2.1 Project Preparation, Design and Quality at Entry
The World Bank financed none of the investments in the IWEMP but was the Implementing Agency for the GEF grant, and relied on EIB financing and on counterpart financing from the Government of Albania to finance the bulk of the investments related to conventional wastewater treatment plants. The IWEMP was originally to have been an integral part of the Municipal Water and Wastewater Project but the need to allow for slower-than-expected processing of the GEF-financed IWEMP caused the World Bank to process the Municipal Water and Wastewater Project alone. The split between the projects might have negatively affected the attention paid to IWEMP. The IWEMP benefited from a GEF project preparation grant, in an amount of US$350,000, approved in 2002, and that helped prepare the project.
In retrospect, it must be concluded that the project was too ambitious in view of the scarce political support and environmental consciousness that prevailed in Albania at the time. This observation is valid both for the selected novel wastewater treatment technology (CTW) and for the environmental management component. Albania’s coastal areas are continuously under pressure and erection of private houses, tourism facilities as
6
well as industrial complexes is an everyday reality. There is little appropriate spatial planning to steer the informal development. On the institutional level, Albania has not yet established a specialized entity for protected areas management. Management of the reserves is done under the Forestry Directorates that are overextended with this task.
Protected areas regulations have not been enforced properly within the last 20 years and the “free” admittance to the country’s natural resources is perceived as a common good. It is not to be expected that this attitude can be changed within the lifetime and restricted means of a five-year project. The importance of a well-managed system of protected areas as well as the importance of coastal wetlands is not readily understood in Albania. Thus the political support for conservation projects in general and the IWEMP in particular was and remains weak.
The project suffered from lack of ownership from side of the Ministry of the Environment, Forestry and Water Administration (MEFWA). The support was further diminished by the fact that procurement for the environmental component 2 was done by the “Water PIU” in the MPWTT. The intention was to have the environmental technical leadership exercised by the MEFWA but this never materialized. Instead it fell on World Bank missions, with the Water PIU in the MPWTT, to supervise the implementation of the project that would have benefited from a strong involvement from the MEFWA.
The same lack of support of the CTW to reduce pollution loads was noticeable. What concerned the city political authorities the most is the lack of a functioning wastewater collection system within their very cities. The project never focused sufficiently on this vital aspect since the attention was mainly on how to prepare, finance and construct the wastewater treatment plants.
The total PIU financing was US$0.08 million with which funding the PIU was expected to implement, monitor and evaluate a project, the total cost of which was about US$30 million. However, the same PIU had additional financing under the Municipal Water and Wastewater Project and did not suffer any shortage of funds to supervise both projects, including the IWEMP.
In summary, the ICR rates the quality at entry as “moderately satisfactory”, given the relative lack of ownership of the country, and the novelty of the project concept in the Albanian socio-economic context.
2.2 Implementation
The project was swiftly declared effective in July 2004, three months after Board presentation. In contrast, the subsequent detailed design and procurement of the main contract to build the three wastewater treatment plants proved time-consuming. Construction did not start until April 2007, three years after Board presentation and was immediately slowed when the consequences of the seriously deficient design became apparent. It became necessary to partly revise the design and adjust the contract sum for a number of omissions. The complementary design and contract adjustments resulted in two contract addenda of which the second one was only signed in February 2009, i.e.,
7
less than one year from the scheduled closing date of December 31, 2009. As a result of the redesign, delayed implementation, and adjustments for omissions, the contract sum rose from Euro 14.4 million to Euro 19.8 million. The renegotiated contract fixed a provisional completion date of September 29, 2010, almost one year beyond the closing date. The World Bank closed the project, as scheduled, which immediately removed the financing of the PIU running costs. At the ICR mission in early February 2010 the main contractor was owed about Euro 3.8 million in overdue payments, and the construction supervision consultants another Euro 0.1 million. In addition, the main contractor had refrained from submitting additional invoices to avoid being liable to pay the Value Added Tax to the Albanian tax authorities without the certainty of eventually being paid by the Government. In view of the substantial unpaid invoices, the Contractor has now slowed project implementation to a minimum to preserve working capital. The conclusion of the main contract to build the three wastewater treatment plants promises to be both uncertain and difficult. In the best of circumstances, the three wastewater treatment plants could be finished by March 2011.
How to transport the wastewater from Durres, Lezha and Saranda to their respective wastewater treatment plants is of equal importance. As noted in section 1.6, the EIB financing, originally intended to finance these works, was instead used to pay for the additional costs of the wastewater treatment plants. At the suggestion of Bank supervision missions, the EU then agreed to provide IPA financing to prepare and implement investments that will intercept the wastewater flows in Durres and Lezha and transport them to the respective wastewater treatment plants that the IWEMP finances.
The Durres and Lezha investments have been tendered but no contract has been signed. The EU supervision consultants have concluded that the designs of the respective investment packages need be modified to correct for deficiencies. Subsequently it will be decided whether negotiations with the indicated bidders are possible or whether the works need be retendered. As a result the completion date for the investments could be the second half of 2011 in the case of Lezha, and late 2012 in the case of Durres. The upshot is that the respective wastewater treatment plants, even if completed, would not have any wastewater to treat until the second half of 2011 in the case of Lezha and the second half of 2012 in the case of Durres. The situation in Saranda is better since it is likely that KfW will finance the necessary works to intercept and bring the wastewater to the town wastewater treatment plant.
Subsequent Bank supervision missions repeatedly alerted the Government to the importance of implementing the sewage interception works and bringing the wastewater to the WWTP. The mid-term review took place in April 2008 and concerned itself mostly with the cost overruns for the WWTPs and with the construction of a breakwater that threatened to undo whatever advances had been made to preserve the Kune Vain Managed reserve. The relatively late timing of the MTR was dictated by the fact the wastewater treatment works were only tendered in April 2007.
8
2.3 Monitoring and Evaluation (M&E) Design, Implementation and Utilization
Many of the performance indicators for the sewage pollution reduction components lacked a baseline at Board presentation and the expectation was to create the baseline during implementation. In reality, it was not until the mid-term review in early 2008, four years after Board presentation, that baseline values for the performance indicators were established.
2.4 Safeguard and Fiduciary Compliance
Around 42 illegal buildings of different size existed in Kune Vain prior to project entry. The presence of these buildings has been a constant source of disturbance, pollution, illegal hunting and other unauthorized activities and poses a big challenge for future management of the reserve. From the conservation point of view it would be necessary to relocate all of these residents, which is not in compliance with World Bank social safeguard policies, unless a resettlement plan is being prepared. However, Albanian law does not allow legalization of buildings inside protected areas, nor does it foresee compensation for them in case of resettlement. The project financed a due diligence social survey among all affected and presented solution models to the GoA as part of the management plan. The Government and the Bank signed an amendment to the GEF Grant Agreement that, in the absence of the planned but delayed Kune-Vain Management Plan, no structure built prior to the Grant effectiveness date of July 27, 2004 would be demolished; that the Management Plan be subject to the Bank’s no-objection to ensure that any adverse impact be mitigated; and that due process be followed if any resettlement take place. Through this amendment the Bank’s social safeguards were complied with.
2.5 Post-completion Operation/Next Phase
There are two key aspects of arrangements for post-completion operations. The first concerns the readiness of the Durres, Lezha, and Saranda utilities to prepare to operate and maintain the respective WWTP that they will take over. This condition is moot at present since no WWTP has been completed. However, the main civil works contractor is contractually obliged to operate and maintain the WWTP for one year following completion, during which period he is also obliged to train utility staff in the operations and maintenance of each plant. The second aspect concerns the adoption of the Management Plan for the Kune-Vain Managed Area. A management plan according to international standards has been finalized but has neither been approved nor implemented. As stipulated in the results framework, the preparation was accompanied by extensive stakeholder consultations, workshops and information dissemination. The Kune Vain Management Board was established and convened twice during the lifetime of the project. It is possible that the Management Plan will soon be adopted through the decision of the Council of Ministers, but political delays cannot be excluded. There is anecdotic information that the National Territorial Planning Council has granted permission for new development within the protected area boundaries, as defined by the Management Plan, thus seriously threatening its adoption and implementation, afterwards.
9
3. Assessment of Outcomes
3.1 Relevance of Objectives, Design and Implementation
The relevance of the project development objective of improving sanitation services in the three participating cities is rated ‘high’. The objective of improving wastewater management is aligned with the second pillar of the joint Bank-International Finance Corporation (IFC) Country Assistance Strategy (CAS) for Albania for FY06-09 which focused on improving public service delivery particularly in the social sectors, with outcomes being improved public infrastructure and access to safe water supply and sanitation.
The relevance of the Environmental management component is also rated “high” since it accords with the Government’s concern with sustainable management of natural resources. The relevance is further strengthened by the need to mitigate the effects of two other public investments that have affected the Kune-Vain reserve in particular. The Kune-Vain Marshland is a complex coastal ecosystem historically built up by the sediment load of the Lezha branch of the Drini River. It is comprised of a big variety of typical Mediterranean wetland and coastal habitats, such as estuarine forests, Mediterranean pine tree forests, sand dunes, salt marshes, and shallow water bodies with varying salinity. Historically two major human interventions changed the hydrology of the entire floodplane. The first was the construction of hydro power dams in the 1950-1970s that diverted the major water flow of Drini River towards Shkodra. The second was the establishment of the drainage system in the Drini flood plain. Still, until 1990 the area remained well protected and habitats and wildlife were outstanding. After the collapse of the command economy in 1990 the area deteriorated rapidly. Informal settlement and construction, uncontrolled hunting, logging, over-fishing, pollution, and beach tourism together with inappropriate management resulted in extensive destruction of habitats and withdrawal of wildlife.
3.2 Achievement of Global Environmental Objectives
GEO and Intermediate Outcome Indicators (IOI). The IWEMP aimed at supporting the recovery of the Kune Vain ecosystem by introducing integrated protected areas management. In the original project design a set of environmental parameters was chosen as GEOs to be monitored during project lifetime. GEOs were subsequently simplified during the mid-term review.
GEO 1: Monitoring of Posidonia oceanica (seagrass) meadows. GEO indicator 1 is fully met by the project. Baseline conditions of Posidonia meadows along the coast of Durres, Lezha, and Saranda have been investigated, markers for future monitoring have been placed on the seafloor, biometric parameters have been taken, and for the first time in Albania a method of quantifying epiphyte growth on Posidonia samples has been applied. The baseline allows monitoring of the seagrass meadows in the coming years. Since Posidonia is a long-term indicator with a very slow growth rate, changes cannot be detected before several years of full operation of the WWTPs. It needs to be stated that no seagrass was found in the coastal waters of Lezha, simply
10
because the sediment composition does not provide the suitable habitat. In addition, it is important to note that even though the monitoring of seagrass was financed under component 2, GEO 1 measures the achievement of activities financed under component 1.
GEO 2: Improved biodiversity in Kune Vain Managed Area regarding flora and fauna. GEO indicator 2 is only partly met by the project. The baseline conditions, as stipulated in the results framework, for birds, mammals, reptiles/amphibians, mollusks, flora, and phytoplankton have been established. Among end-of-project targets only one has been met, namely the natural regeneration of estuarine forests to some extent. Both in Kune forest and at some parts in Vain saplings of Mediterranean oak trees (Quercus robur) can be seen. With appropriate management, these forests stand a chance of recovering. However, the potential area of recovery is significantly reduced as a consequence of erosion and intrusion of sea water. It was anticipated that improvement of the management in Kune Vain would reduce stress factors with subsequent recovery of wintering and breeding bird populations. This did not happen. The number of wintering/resting water birds remained low around 1,500, and the number of typical wetland bird species breeding remained unchanged around 12. While attempts to enforce regulations were made by the Park Administration, many stress factors prevail such as daily illegal hunting, ubiquity of fishing boats on all water bodies in combination with illegal hunting by fishermen, uncontrolled access for sports anglers, cars, beach tourists as well as the lack of strictly protected zones with zero access. The quality of the habitats contributes to the lack of recovery, e.g. deforestation leaves almost no space for the re-establishment of breeding colonies for herons, and poor water quality may influence the availability of food for birds.
GEO Indicator 3: Decrease nutrient load caused by the wastewater to the marine environment in the project area and the Kune Vain tidal marshland as follows: Nitrogen – 115t/a; Phosphorus – 32 t/a. GEO 3 was not met, since the WWTPs are not operative. However, it is likely that this indicator will be met if the WWTP/CTW are completed.
GEO Indicator 4 (IOI 5, and IOI 7): An Integrated Management Plan implemented for Kune Vain Managed Area. GEO indicator 4 has not been met. A management plan according to international standards has been prepared and finalized by the end of the project. As stipulated in the results framework, the preparation was accompanied by extensive stakeholder consultations, workshops and information dissemination. The Kune Vain Management Board was established and convened twice during the lifetime of the project but the Management Plan is neither approved, nor implemented. It is likely, that the plan will soon be adopted through the decision of the Council of Ministers, but political delays cannot be excluded. The capacity to implement the plan is not fully in place. The Park Administration would have to be supplemented with at least one or two expert positions, and stronger political support would be needed from the line Ministries as well as from local administrative bodies.
IOI 6: Implementation of a basic monitoring system of the coastal areas. IOI 1 is partly met. The project financed baseline inventories on mammals, birds, reptiles/amphibians, flora, phytoplankton of lagoon water bodies, mollusks, and seagrass. Additionally, a survey on sea turtles has been initiated along the beaches of Kune Vain and the Patoku-Lagoon. All surveys were conducted by specialists. It was
11
intended to extract a small number of key parameters from each program to create a combined monitoring scheme for Kune Vain to be conducted by the Park Administration on a regular basis. This has only been realized for a very few parameters, in particular the number of wintering/resting birds.
IOI 8: Environmental Education and Communication Program delivered. IOI 2 is partly met. During the project several education activities have been supported. A documentary has been produced and broadcasted on Albanian TV, special broadcasts have been produced for children’s education, students have been brought to the reserve, and stakeholders have been participating on a study tour. The project did not succeed in creating the kind of capacity in the Park Administration, which could make education activities part of their management routine.
IOI 9: Establishment of effective mechanisms to prevent illegal construction. IOI 3 was partly achieved. Throughout project implementation illegal construction remained a serious issue. Repeated attempts to build inside of the reserve were discovered. The Bank team was continuously in dialogue with the key stakeholders in the MEFWA and the Park Administration. Subsequently, the Park Administration succeeded in enforcing regulations and new illegal constructions were demolished by the construction police. Mechanisms are mostly not effective enough to prevent the activities in a very early stage, or sufficient to enforce the rehabilitation of the occupied site. So in every case the ruins, together with an area of filled up and destroyed wetland, remains. It is expected that further attempts to construct in the area will be made, but it is uncertain to what extend the Park Administration is able to withstand the pressure from private investors.
In summary, one GEO indicator was met by the Project, another two GEO indicators were not met, and the remaining indicators were partly met. The ICR rates the achievement of the GEO as “moderately unsatisfactory”. However, in view of the major impact from the (non-project) construction of the unauthorized breakwater at the mouth of the Drini river on the Kune-Vain managed reserve the ICR rates the overall achievement of the GEOs as “unsatisfactory” (see Section 3.5 c). 3.3 Efficiency
The main component, supporting the reduction of sewage flows, was unfinished at the closing date. As a consequence, the Project efficiency is rated “highly unsatisfactory” since this component, accounting for more than 95% of total project costs, involved only costs and but has not yet produced benefits.
3.4 Justification of Overall Outcome RatingRating: Unsatisfactory
The ICR rates the Overall Outcome Rating “unsatisfactory”. The rating is a composite of a “high” relevance, an “unsatisfactory” achievement of the PDOs and the GEOs; and a “highly unsatisfactory” efficiency.
12
3.5 Overarching Themes, Other Outcomes and Impacts
(a) Poverty Impacts, Gender Aspects, and Social Development
Not applicable.
(b) Institutional Change/Strengthening
The Environmental Management and Monitoring component contained US$0.70 million for a series of activities that could have changed and strengthened the local and central agencies and ministries but the ICR estimates that achievements were slight in view of the low amount of funding. Significantly, the Kune Vain Management Plan has not been approved, nor implemented.
(c) Other Unintended Outcomes and Impacts
An example of the weakness of the Park Administration, and of the entire environmental administration of Albania, was the construction of the breakwater at Drini River mouth. At the end of 2007 the Lezha Drainage and Irrigation Board (under the Ministry of Agriculture) utilized state funds to construct a breakwater in combination with dredging works at the river mouth. The construction was unlicensed and neither the Park Administration nor the MEFWA were notified. During several weeks hundreds of truckloads passed through the reserve, bringing crushed stones and boulders, filling up parts of the marshlands to rehabilitate the access road for the construction, interrupting an essential communication channel between Zaje Lagoon and Drini River, filling up marshlands with huge piles of dredging material and finally building a breakwater extending 200 m into the sea.
The MEFWA issued an environmental license after the completed construction and, following a protest from the World Bank team, the Ministry required an EIA. Albanian experts as well the World Bank experts expressed their concerns that the investment might affect the sustainability of the lagoon ecosystem. However, mitigation measures as stipulated in the EIA and requested by the Bank have never been implemented.
The worst expectations of the experts have been confirmed by recent events. The breakwater changed coastal flow patterns that sped up erosion. The entire northern part of the Kune Vain lagoon system is likely to be destroyed. The reported damage so far comprises:
Removal of the littoral from Drini River mouth to Kune Island, exposing the Kune Lagoon to the sea with subsequent extensive ecological changes;
Erosion along the inner shoreline of Kune Lagoon; Rapid withdrawal of the northern Drini River bank that separated the river from
Kune Lagoon; Erosion at the southwest corner of Kune Island; Flooding of agricultural lands and settlements of Ishull Shengjin at high tide
events (as documented in June 2009 and December 2009); and
13
Accelerated erosion along the beach area of Shengjin Bay, affecting a huge volume of tourism investment.
Given the severe impact derived from the breakwater together with the incapability of the entire environmental administration to act in an adequate way, the project’s outcome objectives were impossible to achieve. Bank supervision mission warned of the negative consequences that could be expected from the construction of the breakwater. Yet, all these warnings were ignored and the Lezha Drainage Board under the Ministry of Agriculture went ahead with the construction, causing the negative fall-out.
While the envisaged objectives were not met, there was some positive project impact. The regular presence of the Bank team in discussions with the various stakeholders, as well as the training activities, strengthened the Park Administration and no doubt reduced illegal construction. By the same token, other enforcement activities improved, especially against illegal hunting, though they are not yet fully effective.
3.6 Summary of Findings of Beneficiary Survey and/or Stakeholder Workshops
Not applicable since the main components were unfinished at the Closing date.
4. Assessment of Risk to Development OutcomeRating: High
The ICR rates the risk to development outcome as “high”. The risk assessment amalgamates separate assessments of the completion risks, the operating risks and the financial risks. The risk assessment should separate between component 1 (sewage pollution reduction) and component 2 (environmental management and monitoring).
The completion risk is the first and most serious risk to the development outcome. It is already certain the three wastewater treatment plants will not be finished by the contractual completion date of September 29, 2010. However, there is an additional risk they will not be finished, as now estimated, in early 2011. By the same token, there is uncertainty when the necessary IPA-funded works to upgrade and connect the sewerage system to the three WWTP will be completed. The present completion estimate for these important complementary works is some time in calendar year 2012. The completion risk is compounded by the fact that there is at the present time no assured funding of the Project Implementation Unit in the MPWTT since this component was previously financed by the GEF grant. There is an effort underway to find alternative sources of financing of the PIU, but the outcome of this effort was uncertain at the time of the ICR mission.
Once the WWTP are completed there is the risk the three WWTP may not be well operated. The operating risk is considerable since none of the involved utilities has any experience in the operation of conventional wastewater treatment plants. Wastewater treatment is a novelty in Albania and the three WWTP, once operational, would represent the fourth, fifth, and sixth plants in the country. Reportedly, there is no well-functioning
14
WWTP, attesting to the operational challenge. The activated sludge WWTP in Durres represents a particular problem since it involves digestion of excess sludge which generates explosive gases. The WWTP in Lezha and Saranda would be more robust to operate since they rely on the less sophisticated technology of aerated oxidization ponds.
The risk assessment of the sustainable management of the Kune Vain Protected reserve also signals “high” operating risks in view of the constant infringements of the protected nature of the reserve and of the risks to the sustainability of the shoreline north of the breakwater that was built in blatant disregard to the warnings from ecological experts from Albania and the World Bank.
The financial risks to component 1 (sewage pollution reduction) concern the risks there will not be sufficient funds to operate and maintain the sewerage infrastructure and the three WWTP. Such risks are highly relevant for the Durres activated sludge WWTP that is energy intensive. The ICR rates these financial risks as “high”. Annex 3 provides a full financial analysis of the three utilities that will manage the WWTP in the future. The following aspects are worth noting:
The Durres, Lezha, and Saranda financial working ratios, i.e. the ratio between cash operating costs (without depreciation) and cash operating revenue, i.e. collections, was 1.33; 1.34; and 0.96, respectively in 2009, after five years of a management contract with an international operator. The conclusion is that, except for Saranda, the utilities lose operating cash and depend on operating subsidies from the central Government which is hardly sustainable considering the difficult budget situation of the MPWTT;
The collection rates for the three utilities are 0.55; 0.66; and 0.76, respectively. These low rates do not bode well for the three utilities when they will need to add a sewerage surcharge to pay for the operation of the three WWTP; and
The non-revenue water levels for the three utilities are 71%, 54%, and 85%, respectively. These levels are extraordinarily high and show the inefficiency of the operations and attest to the fact that no utility is financially self-sufficient but depends on continued substantial subsidies from the central Government.
5. Assessment of Bank and Borrower Performance
5.1 Bank
(a) Bank Performance in Ensuring Quality at Entry Rating: Moderately Satisfactory
The ICR rates the Bank performance in ensuring quality at entry as “moderately satisfactory”. The rating reflects the assessment that sufficient resources were devoted to preparing the project, but that the project design was overly complicated, particularly with respect to the weak institutional capacity of the three participating utilities and of the Ministry of the Environment.
15
(b) Quality of Supervision Rating: Satisfactory
The ICR rates the quality of Bank supervision as “satisfactory”. There were only two task team leaders during the two years of preparation and five years of implementation. There were at least two supervision missions annually and some components, such as the environmental component in Kune-Vain, were more frequently supervised during visits of highly specialized environmental consultants. The Bank missions left a full record of their work in aide-memoires with early and clear warnings of the risks to orderly project implementation and to development outcome. In particular, Bank supervision missions strongly warned of the risks there would not be sufficient resources to connect the sewerage systems to the respective WWTP; and of the risks that the unauthorized construction of the break water at the mouth of the Drini river would have on the Kune Vain Managed reserve. In the latter case the Bank threatened to suspend disbursements from the GEF grant if (i) an environmental impact assessment were not prepared, and (ii) further breakwater construction were carried out. Both of these demands were honored, and the Bank did not have to pursue the option of suspending the GEF grant disbursements.
(c) Justification of Rating for Overall Bank PerformanceRating: Moderately Satisfactory
The ICR rates the overall Bank performance as “moderately satisfactory”.
5.2 Borrower
(a) Government PerformanceRating: Unsatisfactory
The ICR rates the Government performance as “unsatisfactory” because of the disregard of the warnings that the construction of the Drini river breakwater would have on the Kune-Vain Managed reserve. The ICR also notes the weakness of the Ministry of Environment in addressing the issue and taking ownership of the environmental component of the Project.
(b) Implementing Agency or Agencies PerformanceRating: Satisfactory
The ICR rates the performance of the PIU in the MPWTT as “satisfactory” whereas the rating of the performance of the MPWTT itself is “marginally satisfactory” in view of the frequent delays in disbursements to finance project implementation.
(c) Justification of Rating for Overall Borrower PerformanceRating: Unsatisfactory
The ICR rates the overall Borrower Performance as “Unsatisfactory” in view of the breach of the Ministry of Agriculture in constructing the breakwater at the mouth of the
16
Drini river in spite of the warnings of the likely environmental damage to the Kune Vain Managed reserve.
6. Lessons Learned
Lesson One. It is unrealistic to expect that a country like Albania, with weak environmental support and understanding of the general population and many within the administration, will, within the limited period of a five-year project implementation period, accept and implement best practice of managed and protected nature reserves. As a result, project objectives must be set realistically with due regard to the time needed to change behavior and culture.
Lesson Two. The financial and implementation risks from projects with multiple financing sources cannot be emphasized enough. The IWEMP counted upon financing from the GEF and from the EIB, both of which have their special limitations and requirements as to preparation and implementation. When the risks of underfinanced investments materialized (as a result of the cost increases of the main construction contract) yet a third source, the EU IPA-financing, was brought in to finance critical connecting interceptors to bring wastewater to the WWTP. However, the IPA-funding came with its particular implementation conditions that might have contributed to further delays.
Lesson Three. The role of the World Bank as a convener of financing from several sources (GEF, EIB, and the EU/IPA) is risky since, without its own sizable financing, it is more difficult for the Bank to adjust the financing to changed needs. The decision of the World Bank not to extend the project closing date might have been prompted by the fact the GEF grant was fully committed by the closing date. Extending the Project closing date would have been hard to justify since the Bank would have used its own scarce operating budget to supervise investments financed by other financiers.
Lesson Four. The project name is Integrated Water and Ecosystems Management Project. Yet, the project failed to apply successfully the integrated nature of wastewater projects that require attention be paid to the (i) connection of buildings to the sewerage system; (ii) the collection of wastewaters to secondary sewers in the streets; (iii) the interception of the collected wastewater and conveyance to the wastewater treatment plants; and (iv) the safe and environmentally disposal of the treated effluents.
Lesson Five. It is risky to rely on a Private Operator to solve the many problems that face water supply and wastewater operations. Specifically, the employment of a private operator presumably meant that the Government was planning to rely on private management in the future which in turn means that the IWEMP expected the Management Operator to guarantee sustainable operations of the sewerage system and of the wastewater treatment plants. After the departure of the Management Operator the capacity to operate and maintain the project infrastructure is uncertain, endangering project sustainability.
17
7. Comments on Issues Raised by Borrower/Implementing Agencies/Partners
(a) Borrower/implementing agencies
No comments were received from the Borrower/Implementing Agencies /Partners of the draft ICR.
(b) Cofinanciers
No comments were received from EIB and the EU on the draft ICR.
(c) Other partners and stakeholders (e.g. NGOs/private sector/civil society)
18
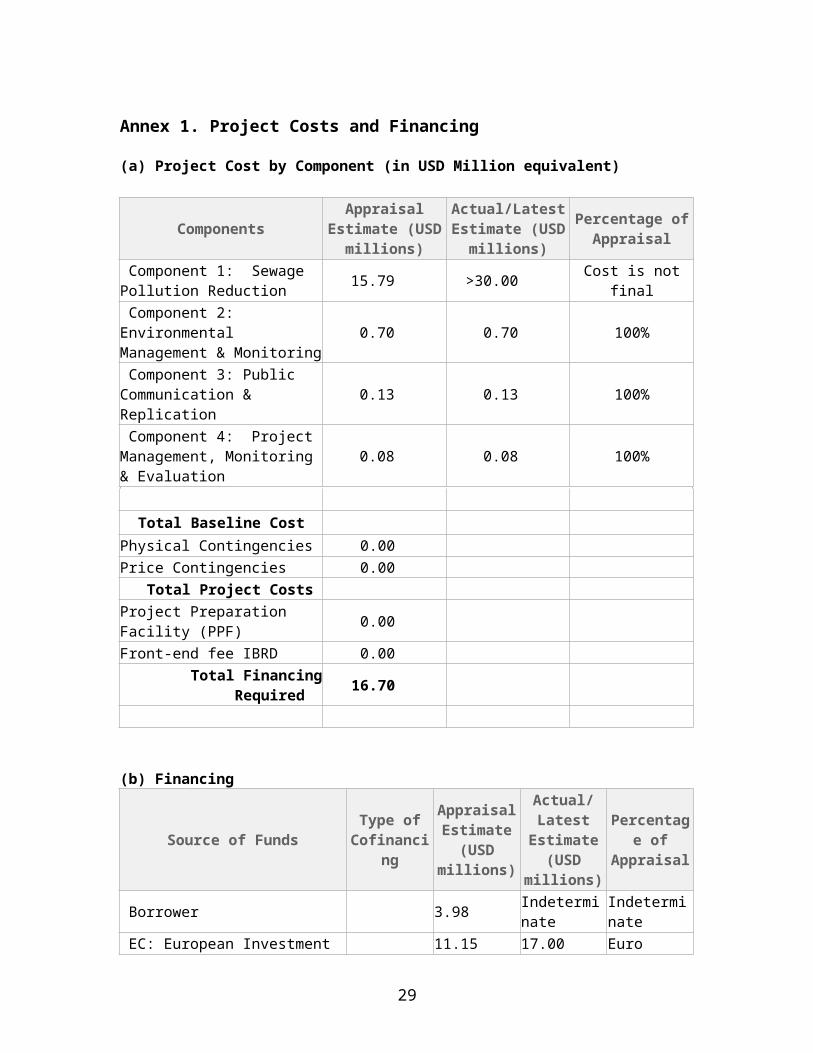
Annex 1. Project Costs and Financing
(a) Project Cost by Component (in USD Million equivalent)
Components Appraisal Estimate (USD millions)
Actual/Latest Estimate (USD
millions)
Percentage of Appraisal
Component 1: Sewage Pollution Reduction 15.79 >30.00 Cost is not final
Component 2: Environmental Management & Monitoring 0.70 0.70 100%
Component 3: Public Communication & Replication 0.13 0.13 100%
Component 4: Project Management, Monitoring & Evaluation
0.08 0.08 100%
Total Baseline Cost Physical Contingencies 0.00Price Contingencies 0.00
Total Project Costs Project Preparation Facility (PPF) 0.00Front-end fee IBRD 0.00
Total Financing Required 16.70
(b) Financing
Source of Funds Type of Cofinancing
Appraisal Estimate
(USD millions)
Actual/Latest Estimate
(USD millions)
Percentage of Appraisal
Borrower 3.98 Indeterminate Indeterminate
EC: European Investment Bank 11.15 17.00 Euro appreciation
Global Environment Facility (GEF) 4.87 4.87 100%
19
Annex 2. Outputs by Component
See main ICR text
20
Annex 3. Economic, Financial and Incremental Cost Analysis
(a) Financial Position of the participating Companies.
The three water and sewerage companies in Durres, Lezha, and Sarande are running losses and their operations depend on the government operating subsidy before the start-up of the project implementation. At the closure of the project the financial position of these companies has improved substantially compare to the base year (2002), and yet their operations are still not financially viable (see Table 1 below). Table 1 indicates that the three companies were not able to cover the increased operation and maintenance costs of water and sanitation services from the increased tariffs during the implementation, let alone the payment of the two sub-loans to the Ministry of Finance. In the last year of project completion (2009) the financial position of the three companies did not change from 2008.
Table 1: Profit and Loss Account (‘000 Lek)
Profit & Loss Durres Lezhe Sarande2003 2008 2003 2008 2003 2008
Revenues 266,893 446,870 43,942 61,522 25,901 71,026Operating expenses 373,812 595,423 112,689 83,479 35,499 67,692EBITDA (106,919) (148,553) (68,747) (21,957) (9,598) 3,334Depreciation &
amortization 186,017 65,027 15,787 21,016 31,272 47,373
Operating Result (EBIT) (292,936) (213,580) (84,534) (42,972) (40,871) (44,039)
Financial expenses 113,398 11,581 892 0Financial revenues 0 0 9 0 24 18Ordinary result (406,334) (225,162) (84,525) (43,865) (40,846) (44,021)Extraordinary
revenue/expenses 0 0 0 0 0 0
Profit before Tax (406,334) (225,162) (84,525) (43,865) (40,846) (44,021)Corporate Tax - 0 - 19Net result (406,334) (225,162) (84,525) (43,884) (40,846) (44,021)
Source: KPMG Audit Report
Equally important is the fact that the three companies are incurring capital cash shortage1
and therefore cannot cover as well capital expenses for replacement and network expansion in the future.
1 The Capital Cash Shortage is calculated as operating cash shortage minus the depreciation and the net financial expenses.
21

A summary of the financial performance indicators is presented in Table 2 below.
Table 2: Summary of Financial Performance Indicators
Unit 2002(Base Year)
2008PAD Actual
DURRESDomestic water tariff Lek/m3 21.0 56.2 38.0Billed revenues Lek million 211 809 431Collected revenues Lek million 74 679 238Collection ratio % 35 84 55Cash operating expenses Lek million 350 566 531Working ratio 4.8 0.8 2.2Current ratio 1.1 4.0Receivables/collected revenues months 10 2.1Payables/cash operating expenses months 6.2 1.6LEZHE Domestic water tariff Lek/m3 15.0 54.5 39.0Billed revenues Lek million 19 135 59Collected revenues Lek million 6 112 39Collection ratio % 34 83 66Cash operating expenses Lek million 43 91 67Working ratio 6.7 0.8 1.7Current ratio 0.7 4.1Receivables/collected revenues months 11.0 1.7Payables/cash operating expenses months 1.1 1.7SARANDA Domestic water tariff Lek/m3 15.0 45.3 40.0Billed revenues Lek million 13 102 47Collected revenues Lek million 5 84 35Collection ratio % 34 83 76Cash operating expenses Lek million 27 75 61Working ratio 6.1 0.9 1.7Current ratio 0.6 2.7Receivables/collected revenues months 15.3 1.8Payables/cash operating expenses months 5.0 1.7
Source: MWWP, PAD, pg. 55, PICC Review, October 2008, IR, pages 26, 29.
Detailed Analysis.
The failure of the companies to achieve the anticipated financial and operations targets by the end of the project implementation was because they did not accomplish the anticipated measures, as follows: (a) adjusting the tariffs as assumed in the Management Contract (MC) and proposed by the Private Operator (PO), (b) reducing non-revenue water, (c) increasing collection efficiency, and (d) improving electricity and personnel costs efficiency.
22
Operating Revenues. Table 3 below shows the trend of the water production and sales.2 According to the table below, the non-revenue water for the three companies on average was 70% in 2002; while in 2009 it went up to 73%. The water production and sales have increased by around 25% and 13% respectively in 2009 compared with the base year for all three companies.
Table 3: Water production and sales (‘000 M2)
DURRES LEZHE SARANDEIndicator 2002 2009 2002 2009 2002 2009
1. Water Production 26,950 32,200 2,616 2,244 4,452 8,0452. Water sales 8,395 9,209 1,157 1,040 661 1,2453. Non revenue water 69% 71% 56% 54% 85% 85%
Source: Implementation Completion Report, Independent Reviewer, June 2008, and Monitoring and Benchmarking Unit of the GDWS/MPWTT.
The increase of the volume of water sales in the three companies is reported by the Independent Reviewer (IR) to be mainly due to the increase of the number of billed customers. The IR Report indicates that the increase of billed customers is: in Durres 69%, in Lezhe 72%, and in Sarande about two times the level of 2002.
The implementation of the metering program is believed to have had reduced water sales. The anecdotal evidence indicates that in Durres, Fier and Sarande during 2nd half of 2007, the metered consumption per family declined on average between 33% and 37% compared to flat rate consumption before meter installation3. The same trend was observed in the decline of the invoiced revenue during the same period. Although the information from the Private Operator reports and the IR reports is limited to make the analysis of the effect of the metered billed consumption for a longer period, the above evidence is a typical result of a metered consumption (at least in short term).
Billing and collection revenues. Based on the volume of water sales increase and of higher tariffs the PAD has assumed a substantial increase of invoiced revenues in the operating revenue. The result would be an increase in utilities’ operating revenues to exceed the operating expenses (Table 4 below).
The three companies were able to generate in 2009 more than two times the amount of operating revenue of 2002. Table 4 below shows that, while in 2002 the billed and collected revenues covered 58% and 20% respectively the operating cost, in 2009 the coverage rate went up to 69% and 39% respectively for all three companies.
The main reason for the low collection as reported by the Independent Reviewer and the Private Operator was lack of support by the local authorities to improve collection from domestic customers, which remained at the lowest level of collection rate compared with 2 The base year (2002) reported by the IR differs from what is estimated in the PAD, which uses the KPMG Study’s data. The IR data are based on the Base year Data Report prepared by the Private Operator in 2004. The volume/physical assumptions in financial analysis presented in Annex 5, Table 7 of the PAD are given for 2001 and 2007, based on the KPMG Study prepared in 2002.3 Note, this does not necessarily reflect a literal decrease in consumption, as the flat rate assumed consumption to be 150 l/c/d, but did not measure actual consumption.
23
public and private institutions. The collection revenues of the four utilities were affected by the low-revenue collection from the rural population in the service area, where the communes were unwilling to support the utilities in the revenue collection.
Table 4: Billing and Collections (million Lek)
DURRES LEZHE SARANDAIndicator 2002 2009 2002 2009 2002 2009
1. Invoiced revenues 211 437 19 65 13 652.Collected revenues 74 234 6 42 5 473.Collection rate 35% 54% 34% 65% 34% 73%4. Operating expenses 350 648 43 87 27 83
Source: Implementation Completion Report, Independent Reviewer, June 2008, and Monitoring and Benchmarking Unit of the GDWS/MPWTT.
Tariffs. Domestic water tariffs although increased in Sarande 54%, in Lezhe 39%, and in Durres 9%, compared with 2003, remain much below the anticipated targets. The main reason was the reluctance of the municipal authorities and of the national water regulator to approve progressively higher tariffs as proposed by the private operator.
Table 5: Domestic Water Tariffs (Lek/m3)
2003 2008 2009DURRESActual 35.0 38.0 38.0LEZHEActual 28.0 39.0 43.0SARANDEActual 26.0 40.0 40.0
Source: Implementation Completion Report, Independent Reviewer, June 2008, and Monitoring and Benchmarking Unit of the GDWS/MPWTT.
Table 6 below shows that average weighted tariffs in 2008 resulted in 2-3 times the level of 2002, and yet those are below the unit operating costs (Table 6).
Table 6: Tariffs and unit operating costs (Lek/m3)
DURRES LEZHE SARANDEIndicator 2002 2009 2002 2009 2002 2009
1. Average weighted tariff 26 47 21 63 9 522.Unit operating cost 43 70 46 84 51 673. Tariff cost recovery 60% 67% 46% 75% 18% 78%
Source: Implementation Completion Report, Independent Reviewer, June 2008, and Monitoring and Benchmarking Unit of the GDWS/MPWTT
Operating and maintenance cost. The project implementation expected that the private operator would be able to turn around operating inefficiency of the companies. This did not happen as shown in Table 7.
24
Table 7: Operating Expenses (million Lek)
DURRES LEZHE SARANDEIndicator 2002 2009 2002 2009 2002 2009
Operating expenses 350 647 43 87 27 83a) Electricity 178 437 23 46 8 35b) Personnel 101 142 17 31 17 26c) Chemicals & materials 33 27 2 2 2 3d) Repair & Maintenance 20 24 0.5 6 0 13e) Other expenses 18 18 0 2 0 6
Source: Implementation Completion Report, Independent Reviewer, June 2008, and Monitoring and Benchmarking Unit of the GDWS/MPWTT
Because the water systems of the four utilities relay on pumped water production, the portion of electricity costs in the operating costs is the highest cost item, accounting for 42% to 67% of operating expenses. The project did not meet the anticipated reduction of the electricity consumption per cubic meter produced. One of the reasons was the higher increase of the electricity price than anticipated at appraisal.
Reducing the share of personnel expenses in the operating costs was another objective of the project, which showed progress at the end of the implementation. Durres, Lezhe and Sarande companies reduced this share respectively from 29% to 22%; 40% to 36%, and 63% to 31% during 2002-2009. This is explained by the improvement of staff productivity ratio as Table 8 shows:
Table 8: Staff productivity ratio and electricity efficiency4
DURRES LEZHE SARANDEIndicator 2001 2009 2001 2009 2001 2009
1. Utility personnel (No.) 387 481 91 86 94 802. Staff /1000 connections 10.4 6.9 28 14.5 37.5 11.5
Source: PAD MWWP, Annex 5, Table 7, Volumetric/Physical Assumptions in Financial Analysis, pg. 59, and the IR Implementation Completion Report, June 2008. Monitoring and Benchmarking Unit of the GDWS/MPWTT
(b) Projections of Financial Statements of the three Companies
The projections of financial statements follows on the cost recovery approach of the financial forecasts of the Municipal Water and Wastewater Project5 that by the end of the project life span the Companies will become financially viable (Attachment to Annex).
The financial statements forecast for the companies of Durres, Fier and Sarande for the period 2010-2014 has taken the following assumptions.
4 These assumptions are taken in the PAD for the year 2001 and 2007. The IR data refer to the 5 th year (2008) of the MC. The base year for staff productivity ratio for Fier utility is taken the data from IR Report for 2002, because of the additional staff added to the utility after taking over the wells and water production operation.5 According to the financial projections all four utilities were projected to break even in 2007, i.e. their collected revenues would cover 100% operating expenses.
25
Operating cost break-even target6 that was assumed to be achieved not later than 2008 under the IWEMP, is moved to 2011.
Full-cost recovery target, which was assumed to be achieved not later than 2010 under the IWEMP, is moved to 2012.
The weighted average tariffs level assumed to achieve the cost recovery are adjusted for this projection.
Collection ratios need to be raised substantially for Durres and Lezhe and slightly less for Sarande from the level of 2009 on.
Under the IWEMP the debt service was assumed to start in 2008. In this projection, the three companies would have to reschedule the debt service on the sub-loans starting in 2012.
The sewerage capital investment cost assumed to be financed by EIB loan is going to be financed by EU/IPA grant funds.
The WWTP capital investment cost for the three cities has resulted about 265% higher than anticipated at appraisal.
The three WWTPs of Durres, Lezhe and Sarande will start their operations in 2011, but not at full capacity.
The projection of financial statements (Income Statement and Sources and Applications of Funds) will have to be discussed with the respective companies and local authorities to get their views, feedback, and commitments on the measures required to achieve the financial viability targets.
Tariffs for the three WWTPs
The operating cost of the WWTPs was assumed to be covered through their tariffs. The scenario developed is that the WWTTPs should be able to cover their cash operating cost through new tariffs from 2011 till 2015 as a first phase towards final sustainable financial viability of their operations. The source of the data is Giovanni Putignano & Figli S.r.l., which is constructing the plants in Durres, Lezhe and Sarande.
The total capital investment costs of the three WWTPs were increased two times compared with the estimation at appraisal. Table 9 below present the final cost of the investment that resulted during the implementation.
6 Working ratio not greater than 1.00
26
Table 9: Capital Investment Cost for WWTP
Durres Lezhe Sarande Total CAPEX 10,903,251 4,823,540 4,118,912 19,845,702 Tax & Duties 2,180,650 964,708 823,782 3,969,140 Sub - Total 1 13,083,901 5,788,248 4,942,694 23,814,842 Physical contingency N/A N/A N/A N/ADesign & supervision 660,660 102,960 94,380 858,000
13,744,561 5,891,208 5,037,074 24,672,842Note: Physical contingency at appraisal was assumed 15% of cost estimate, and during the contract amendments was assumed to be included in the CAPEX.
For the estimation of the WWTP tariffs the cash cost recovery approach has been applied to calculate revenue requirements that are needed to cover the cash operating cost during the period 2011-2015, when the plants are expected to be operational. The three plants are expected to work under their capacities over the first five years of operation. The main reason is that a number of households are not connected to the sewage network, and in particular those located in the outskirts of the cities and new hotels, summer houses and restaurants in the beach areas. A detailed assessment of the customer data base of the water supply customers would help to understand the differences between those billed for potable water and for wastewater services. In addition, a physical registration of those properties not yet in the customer data base is required to come up with a sound data information of the sewerage connections investments required in the future
Two cases for tariffs cash cost recovery are developed as follows: (a) 100% recovery for each year starting from 2011 on; and (b) progressively increasing cost recovery for each year, 100% in five years.
27
Table 10: WWTP Tariffs for Durres, Lezhe and Sarande
Scenario Cash Cost Coverage 2011 2012 2013 2014 2015DURRES
Cash O & M expenses (Euro) 487,286 456,601 456,601 456,601 744,208Hydraulic Load [m3/year] 3,504,000 3,504,000 3,504,000 3,504,000 7,358,400Case A: 100% recovery for each year,Weighted average tariffs (euro/m3) 0.14 0.13 0.13 0.13 0.10Weighted average tariffs (lek/m3) 18.8 17.6 17.6 17.6 13.7Case B: Progressively increasing costrecovery for each year, 100% in 5
years (2015) 50% 60% 75% 80% 100%
Weighted average tariffs (lek/m3) 9.4 10.6 13.2 14.1 13.7LEZHE
Cash O & M expenses (Euro) 181,457 223,101 223,101 223,101 284,475Hydraulic Load [m3/year] 700,800 700,800 700,800 700,800 700,800Case A: 100% recovery for each year,Weighted average tariffs (euro/m3) 0.26 0.32 0.32 0.32 0.41Weighted average tariffs (lek/m3) 35.0 43.0 43.0 43.0 54.8Case B: Progressively increasing costrecovery for each year, 100% in 5
years (2015) 50% 60% 75% 80% 100%
Weighted average tariffs (lek/m3) 17.5 25.8 32.2 34.4 54.8SARANDE
Cash O & M expenses (Euro) 197,703 237,423 237,423 237,423 308,082Hydraulic Load [m3/year] 700,800 700,800 700,800 700,800 700,800Case A: 100% recovery for each year,Weighted average tariffs (euro/m3) 0.28 0.34 0.34 0.34 0.44Weighted average tariffs (lek/m3) 38.1 45.7 45.7 45.7 59.3Case B: Progressively increasing costrecovery for each year, 100% in 5
years (2015) 50% 60% 75% 80% 100%
Weighted average tariffs (lek/m3) 19.0 27.4 34.3 36.6 59.3Source: Putignano s.r.lNote: Euro : Lek 135 constant through 2015
(c) Incremental cost analysis
This ICR cannot confirm the achievement of the project goals based on outcome per GEF dollar invested, because the construction of the wastewater treatment plants in Durres, Lezhe and Sarande is expected to be completed and become operational in 2011, while the GEF Grant Funds were fully committed and disbursed following the closing date of the Grant Agreement, i.e. December 31, 2009.
As explained in the previous chapters, this project is a GEF-blended operation; the GEF grant has helped leverage funds from EIB for additional activities related to the construction of the wastewater treatment plants. This constituted the basis for the incremental cost analysis. The incremental cost for achieving sustainable global environmental benefits at appraisal was estimated at US$11.8 million; this amount has increased to around US$28.6 million at the closing date of the GEF Grant Agreement. This is expected to be the final cost at the completion of the project in 2011. Of this amount, the GEF portion of financing remains the same amount set out in the Grant
28
Agreement, while the European Investment Bank will finance US$17.5 million and the Government of Albania will finance US$6.19 million7, upon the project completion (see Table 11 below).
Table 11: Sources and Financing
GEF(US$ million)
EIB(US$ million)
GOA(US$ million)
Total(US$ million)
Appraisal Grant closing Appraisal 2011 Appraisal 2011 Appraisal 2011
Sewage Pollution Reduction
3.96 4.04 6.29 17.5 0.68 6.19 10.93 27.73
Environmental Management & Monitoring
0.70 0.73 0.0 0.0 0.0 0.0 0.70 0.73
Public Communication and Replication
0.13 0.00 0.0 0.0 0.0 0.0 0.13 0.00
Project Management, M & E
0.08 0.10 0.0 0.0 0.0 0.0 0.08 0.10
Total 4.87 4.87 6.29 17.5 0.68 6.19 11.84 28.56
In spite of the higher incremental cost, the project aims to capture global benefits by reducing land-based pollution from the three cities and protect and restore endangered coastal and marine habitats which will most probably be achieved upon the completion of the wastewater treatment plants in the cities of Durres, Lezhe and Sarande. The Removal Efficiency (RE%) set out at appraisal is expected to be achieved upon the completion of the plants8 (Tables 12 and 13 below).
Table 12: Quality of wastewater in Durres, Lezhe, Sarande after project intervention on Project CTW basic scheme-fully natural solution
Main ParameterAssumed Sewage
Inlet concentration(mg/l)
Expected medianof RE %
Expected medianOutlet concentration
(mg/l)BOD 250-200 70% 75-60N-total 60-50 50% 30-25P-total 27-20 25% 20-15
7 This amount does not include the VAT8 Removal Efficiency (RE%) is the ratio of the out-let concentration versus the in-let concentration of the wastewater pollutant.
29
Table 13: Quality of wastewater in Durres, Lezhe, Sarandeafter project intervention on Project CTW option with aerated ponds
Main ParameterAssumed Sewage
Inlet concentration(mg/l)
Expected medianof RE %
Expected medianOutlet concentration
(mg/l)BOD 250-200 85%
(range 30%-95%)50-30
N-total 60-50 75%(range 20%-80%)
15-10
P-total 27-20 65%(range 20%-70%)
15-10
According to the analytical calculation at appraisal, the following Removal Efficiency (RE%) are expected: BOD 70%, and fecal coliform removal of 95%, studies show the CTW are effective at removing nutrients such as nitrogen (Re=50%) and phosphorous (Re=25%).
30
Attachment to Annex 3Durres Water And Sewerage Company - Financial Statements (000 Lek)
Actual Projection2009 2010 2011 2012 2013 2014 2015
INCOME STATEMENTRevenues
Drinking Water 389,623 479,554 741,810 906,656 1,097,054 1,316,465 1,465,122Sewerage & WWTP 47,139 58,019 155,532 171,334 194,369 220,915 290,270Total invoiced revenues 436,762 537,573 897,342 1,077,990 1,291,424 1,537,380 1,755,392Other revenues 135,774 122,197 44,867 53,900 64,571 76,869 87,770Total revenues 572,536 659,770 942,209 1,131,890 1,355,995 1,614,249 1,843,161Collection ratio (%) 54% 60% 89% 92% 93% 94% 95%Collected revenues 234,001 444,740 843,501 1,045,650 1,265,595 1,522,006 1,755,392
ExpensesElectricity 437,356 450,477 499,715 502,568 516,905 531,673 565,613Personnel 141,505 145,750 168,915 175,298 179,936 184,714 193,394Chemicals and materials 26,866 27,672 32,491 34,696 35,577 36,484 40,443Repairs & maintenance 24,199 24,925 29,576 34,041 34,835 35,652 49,808Contract services 8,232 8,479 8,733 8,995 9,265 9,543 9,829Other cash expenses 10,045 10,346 14,032 14,351 14,681 15,020 15,369Total cash operating expenses 648,203 667,649 753,462 769,950 791,199 813,086 874,456
EBITDA (75,667) (7,879) 188,747 361,940 564,795 801,163 968,705Depreciation 69,678 148,735 202,839 202,839 202,839 202,839 202,839Provision for bad debt 98,708 86,239 90,400 92,243 87,770Total operating expenses 717,881 816,385 1,055,009 1,059,028 1,084,438 1,108,168 1,165,065Operating result (EBIT) (145,345) (156,615) (112,800) 72,861 271,557 506,081 678,096Financial expenses 25,506 25,000 25,000 25,000 25,000 25,000 25,000IDA debt interest and financial charges
(at 1.50%) - 46,669 21,205 20,527 18,582 16,491
EIB subloan interest charges to DWSC (at 1.50% upto 2008, 4.85% after) 81,453 84,778 79,438 74,623 69,809
Total cost 743,387 841,385 1,208,131 1,190,012 1,209,403 1,226,373 1,276,365Net income before tax (170,851) (181,615) (265,922) (58,122) 146,592 387,876 566,796Corporate tax - - - - - -
Net income after tax (170,851) (181,615) (265,922) (58,122) 146,592 387,876 566,796 Sources & Applications of Funds 2009 2010 2011 2012 2013 2014 2015 Sources Net Income (145,345) (156,615) (112,800) 72,861 271,557 506,081 678,096Depreciation 69,678 148,735 202,839 202,839 202,839 202,839 202,839Provision for bad debt - - 98,708 86,239 90,400 92,243 87,770Change in working capital (20,338) (9,756) (10,294) (12,246) (7,756)1) IBRD Loan 562,538 187,513 187,5132) GEF-Grant 224,8183) GOA -Grant 204,556 68,185 68,1854) GOA -Taxes 170,091 56,697 57,2485) EU/IPA -Grant - - 388,596Total Sources 1,086,336 304,516 481,355 352,184 554,502 788,917 960,949Applications1. Capital Expenditures 1,162,003 312,395 701,542 - - -2. Debt Service - - 227,388 205,250 328,348 321,588 314,683a) Interest on total subloan including
capitalization - - 128,122 105,983 99,965 93,205 86,300
IDA Credit 46,669 21,205 20,527 18,582 16,491EIB Loan 81,453 84,778 79,438 74,623 69,809b) Annual repayment of principal to
the Government 99,266 99,266 228,383 228,383 228,383
IDA Credit 129,116 129,116 129,116EIB Loan 99,266 99,266 99,266 99,266 99,266Total Applications 1,162,003 312,395 928,931 205,250 328,348 321,588 314,683
Annual Cash Balance (75,667) (7,879) (447,576) 146,934 226,154 467,329 646,266
31
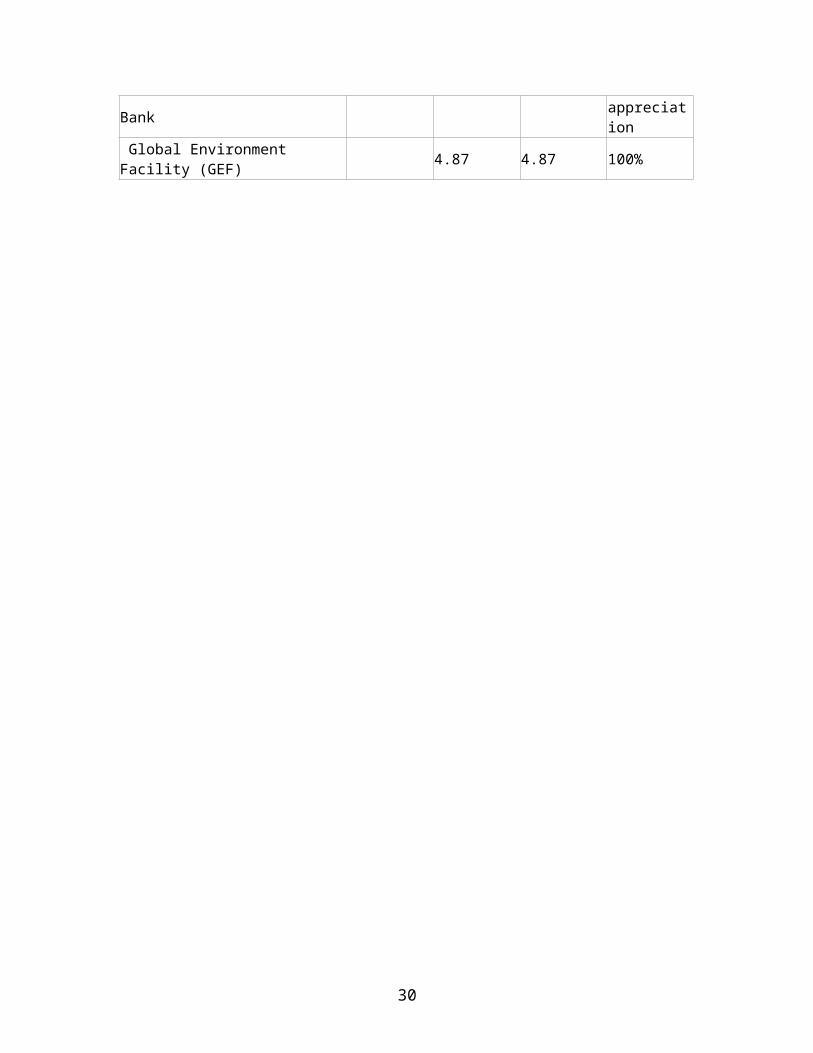
Lezhe Water And Sewerage Company - Financial Statements (000 Lek)Actuals Projection
2009 2010 2011 2012 2013 2014 2015INCOME STATEMENTS
RevenuesDrinking Water 56,236 66,737 80,752 132,607 145,868 170,687 201,239Sewerage & WWTP 9,143 11,176 38,425 53,677 56,811 62,289 77,471Total invoiced revenues 65,379 77,913 119,177 186,284 202,678 232,976 278,710Other revenues 11,800 10,620 11,918 18,628 20,268 23,298 27,871Total revenues 77,179 88,533 131,095 204,913 222,946 256,274 306,581Collection ratio (%) 65% 70% 80% 90% 93% 94% 96%Collected revenues 42,545 54,539 107,259 186,284 208,759 242,295 295,432
ExpensesElectricity 46,447 47,840 58,884 62,284 63,807 65,375 69,873Personnel 30,997 31,927 43,253 45,276 46,292 47,339 50,490Chemicals and materials 1,597 1,645 2,849 2,899 2,952 3,006 3,061Repairs & maintenance 6,417 6,610 7,474 10,341 10,552 10,768 14,321Contract services - - - - - - -Other cash expenses 1,813 1,867 4,623 4,681 4,741 4,802 4,865Total cash operating expenses 87,271 89,889 117,083 125,482 128,343 131,290 142,610
EBITDA (10,092) (1,356) 14,012 79,431 94,603 124,984 163,970Depreciation 29,000 29,000 55,975 55,975 55,975 55,975 55,975Provision for bad debt - - 23,835 18,628 14,187 13,979 11,148Total operating expenses 116,271 118,889 196,893 200,085 198,505 201,243 209,734Operating result (EBIT) (39,092) (30,356) (65,798) 4,827 24,441 55,031 96,847Financial expenses 15,000 15,000 15,000 15,000 15,000 15,000IDA debt interest and financial
charges (at 1.50%) 2,002 2,030 1,951 1,765 1,580
EIB subloan interest and financial charges to LWSC 35,317 36,540 34,049 31,985 29,922
Total cost 116,271 133,889 249,212 253,655 249,505 249,994 256,235Net income before tax (39,092) (45,356) (118,117) (48,742) (26,559) 6,280 50,346Corporate tax - - - - - - -
Net income after tax (39,092) (45,356) (118,117) (48,742) (26,559) 6,280 50,346Sources & Applications of Funds 2009 2010 2011 2012 2013 2014 2015
SourcesNet Income (39,092) (30,356) (65,798) 4,827 24,441 55,031 96,847Depreciation 29,000 29,000 55,975 55,975 55,975 55,975 55,975Provision for bad debt - - 23,835 18,628 14,187 13,979 11,148Change in working capital - - (112) (3,470) (964) (1,513) (1,864)1) IBRD Loan 238,995 79,665 79,6652) GEF-Grant 96,411 - -3) GOA -Grant 87,426 29,142 29,1424) GOA -Taxes 75,247 25,082 69,4735) EU/IPA -Grant - - 231,685
Total Sources 487,986 132,533 192,179 75,961 93,640 123,471 162,107Applications
1. Capital Expenditures 498,078 133,889 409,9642. Debt Service - - 79,867 81,117 90,920 88,671 86,423a) Interest on total subloan including
capitalization - - 37,319 38,570 36,000 33,750 31,501
-IDA Credit 2,002 2,030 1,951 1,765 1,580-EIB Loan 35,317 36,540 34,049 31,985 29,922b) Annual repayment of principal to
the Government 42,548 42,548 54,921 54,921 54,922
-IDA Credit 12,373 12,373 12,373-EIB Loan 42,548 42,548 42,548 42,548 42,549
Total Applications 498,078 133,889 489,831 81,117 90,920 88,671 86,423
Annual Cash Balance (10,092) (1,356) (297,652) (5,157) 2,720 34,800 75,684
32

Sarande Water And Sewerage Company -Financial Statements(000 Lek)Actual Projection2009 2010 2011 2012 2013 2014 2015
INCOME STATEMENTSRevenuesDrinking Water 57,239 79,127 123,438 149,771 178,014 208,276 240,675Sewerage & WWTP 7,844 14,594 50,332 62,393 70,196 79,255 99,283Total invoiced revenues 65,083 93,721 173,770 212,165 248,209 287,531 339,958Other revenues 14,154 12,739 8,689 10,608 12,410 14,377 16,998Total revenues 79,237 106,460 182,459 222,773 260,620 301,907 356,956Collection ratio (%) 73% 78% 85% 89% 92% 93% 95%Collected revenues 47,499 73,102 156,393 199,435 240,763 281,780 339,958ExpensesElectricity 26,482 26,482 38,363 41,399 42,242 43,110 47,330Personnel 34,590 34,590 46,352 48,493 49,594 50,728 54,041Chemicals and materials 3,097 3,097 4,850 4,946 5,045 5,146 5,251Repairs & maintenance 12,923 12,923 13,829 16,301 16,712 17,135 21,640Contract services - - - - - -Other cash expenses 6,020 6,020 8,901 9,087 9,278 9,476 9,679Total cash operating expenses 83,112 83,112 112,295 120,226 122,871 125,595 137,941EBITDA (3,875) 23,348 70,164 102,547 137,749 176,312 219,015Depreciation 48,000 48,000 63,543 63,543 63,543 63,543 63,543Provision for bad debt 20,619 17,377 12,730 7,446 5,751 -Total operating expenses 131,112 151,731 193,215 196,499 193,860 194,889 201,484Operating result (EBIT) (51,875) (45,271) (10,756) 26,274 66,760 107,018 155,472Financial expenses 1,836 1,836 1,840 1,840 1,840 1,840 1,840IDA debt interest and financial charges
(at 1.50%) 2,002 2,030 1,951 1,765 1,580
EIB subloan interest and financial charges to SWSC 30,197 31,242 29,112 27,348 25,583
Total cost 132,948 153,567 225,252 229,581 224,812 224,077 228,907Net income before tax (53,711) (47,107) (42,793) (6,808) 35,808 77,831 128,049Corporate tax -Net income after tax (53,711) (47,107) (42,793) (6,808) 35,808 77,831 28,049 Sources & Applications of Funds 2009 2010 2011 2012 2013 2014 2015
SourcesNet Income (51,875) (45,271) (10,756) 26,274 66,760 107,018 155,472Depreciation 48,000 48,000 63,543 63,543 63,543 63,543 63,543Provision for bad debt - 20,619 17,377 12,730 7,446 5,751 -Change in working capital - - (90) 535 159 164 8331) IBRD Loan 215,426 71,809 71,8092) GEF-Grant 75,133 - -3) GOA -Grant 68,131 22,710 22,7104) GOA -Taxes 64,255 21,418 44,1895) EU/IPA -Grant - - 118,845
Total Sources 419,070 139,285 208,782 103,083 137,908 176,476 219,848Applications1. Capital Expenditures 422,945 115,937 257,5522. Debt Service - - 68,577 69,651 79,815 77,865 75,915a) Interest on total subloan including
capitalization - - 32,198 33,272 31,063 29,113 27,163
-IDA Credit - - 2,002 2,030 1,951 1,765 1,580-EIB Loan - - 30,197 31,242 29,112 27,348 25,583b) Annual repayment of principal to
the Government 36,379 36,379 48,752 48,752 48,752
-IDA Credit - - - - 12,373 12,373 12,373-EIB Loan - - 36,379 36,379 36,379 36,379 36,379
Total Applications 422,945 115,937 326,130 69,651 79,815 77,865 75,915
Annual Cash Balance (3,875) 23,348 (117,348) 33,432 58,093 98,611 219,848
33
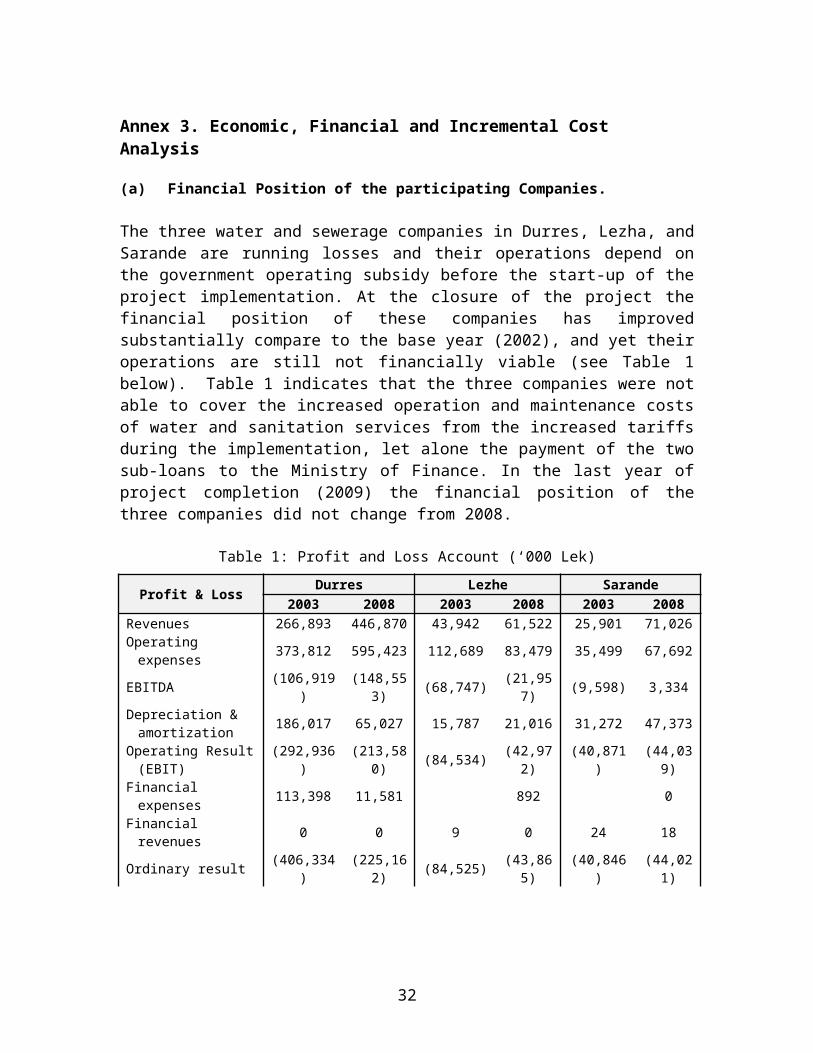
Annex 4. Bank Lending and Implementation Support/Supervision Processes
(a) Task Team members
Names Title Unit Responsibility/Specialty
LendingAndreas Rohde Team Leader/Sanitary Engineer ECSIEClaudio Purificato Water and Sanitation Engineer ECSIEArben Bakllmaja Consultant ECSIETakao Ikegami Senior Sanitary Engineer ECSIEManuel Marino Water and Sanitation Specialist ECSIEJuderica Dias Program Assistant ECSIERita Cestti Environmental Specialist ECSSDHermine De Soto Social Specialist ECSSDOlav Christensen Financial Management Specialist ECSCSJunko Funahashi Counsel LEGECRohit Mehta Finance Officer LOAG1Salim Benouniche Procurement Specialist ECSPSAhmet Jehani Counsel LEGECArtan Guxho Project Officer ECSIEDaniele Calabrese Communication Associate EXTCDGrazia Atanasio Communications Officer EXTCDEde Ijjasz-Vasquez Peer Reviewer/Senior Environmental Specialist ENVPhillip Brylski Peer Reviewer/Senior Biodiversity Specialist ECSSDPaul Mitchel Peer Reviewer/Manager EXTCDMaria Teresa R. Lim Program Assistant ECSIESusanne Szymanski Consultant ECSIEKishore Nadkarni Financial Analyst ECSIEJennifer Ngaine Program Assistant ECSIESupervision/ICR
Michael John Webster Task Team Leader/Senior Water & Sanitation Specialist ECSS6
Lynette Alemar Senior Program Assistant ECSSDArben Bakllamaja Consultant ECSSDSalim Benouniche Lead Procurement Specialist MNAPRHermine De Soto Consultant EASVSMajed El-Bayya Lead Procurement Specialist ECSC2Elona Gjika Financial Management Specialist ECSPSArtan Guxho Projects Officer ECSS5Elda Hafizi Program Assistant ECCALBekim Imeri Social Scientist ECSS4Enkelejda Karaj Program Assistant ECCALMaria Teresa R. Lim Program Assistant ECSSDShelley Mcmillan Water Resources Spec. AFTWRIda N. Muhoho Senior Financial Management Specialist ECSC3Norval Stanley Peabody Consultant EASISClaudio Purificato Consultant EASCSAmelito Velasco Procurement Assistant ECSC2Ulrich Zeidler Consultant ECSSD
34
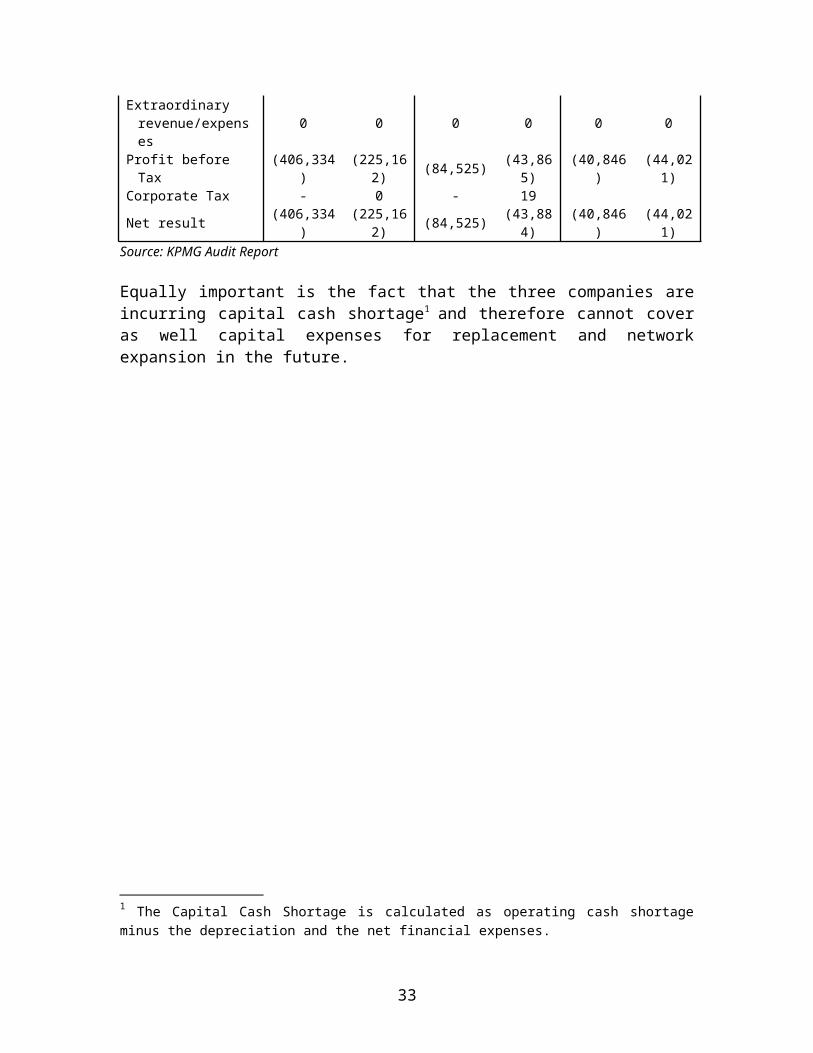
(b) Staff Time and Cost
Stage of Project CycleStaff Time and Cost (Bank Budget Only)
No. of staff weeks USD Thousands (including travel and consultant costs)
Lending FY02 40.72 FY03 97.54 FY04 83.61 FY05 -0.02 FY06 0.02 FY07 0.00 FY08 0.00
Total: 221.87Supervision/ICR
FY02 0.00 FY03 0.00 FY04 17.92 FY05 79.41 FY06 67.57 FY07 66.37 FY08 98.84
Total: 330.11
35
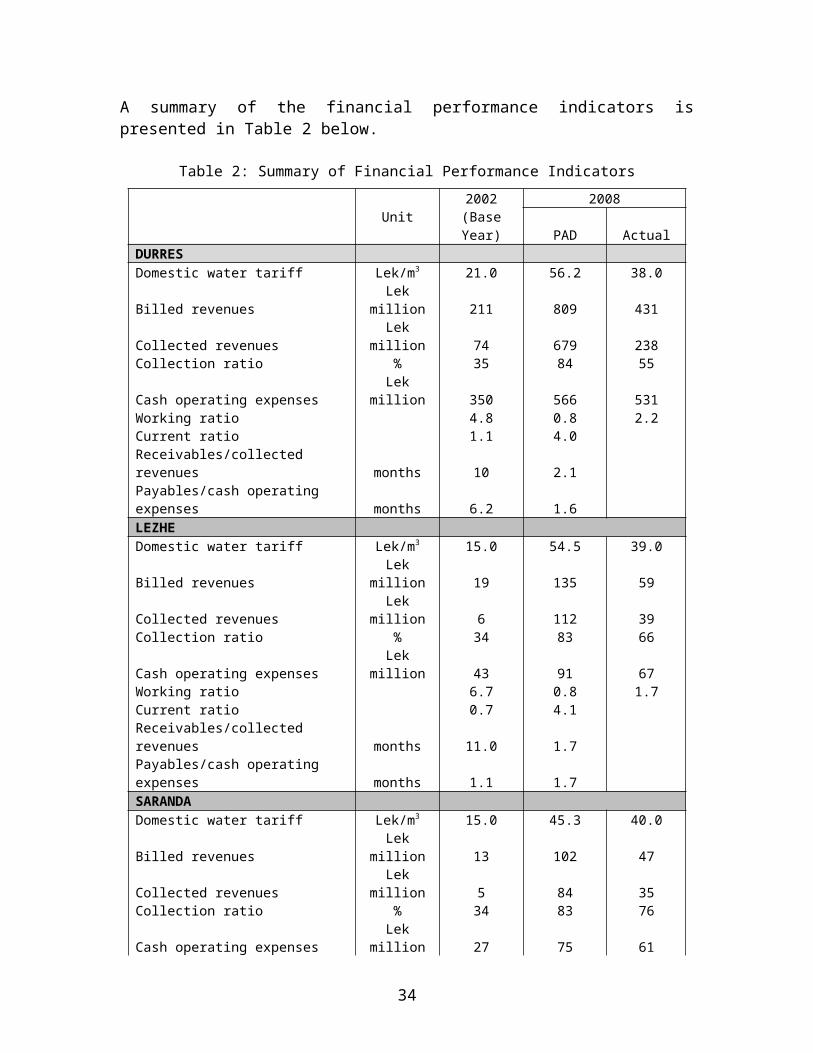
Annex 5. Beneficiary Survey Results
Not applicable
36
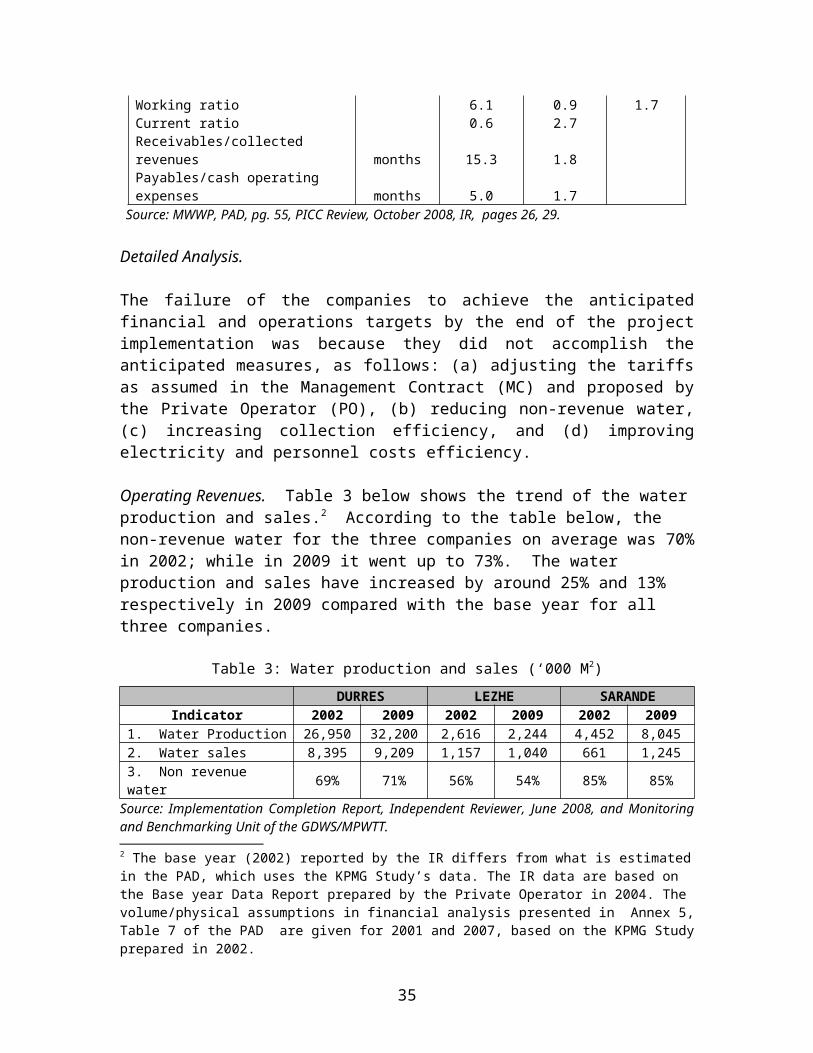
Annex 6. Stakeholder Workshop Report and Results
Not applicable
37
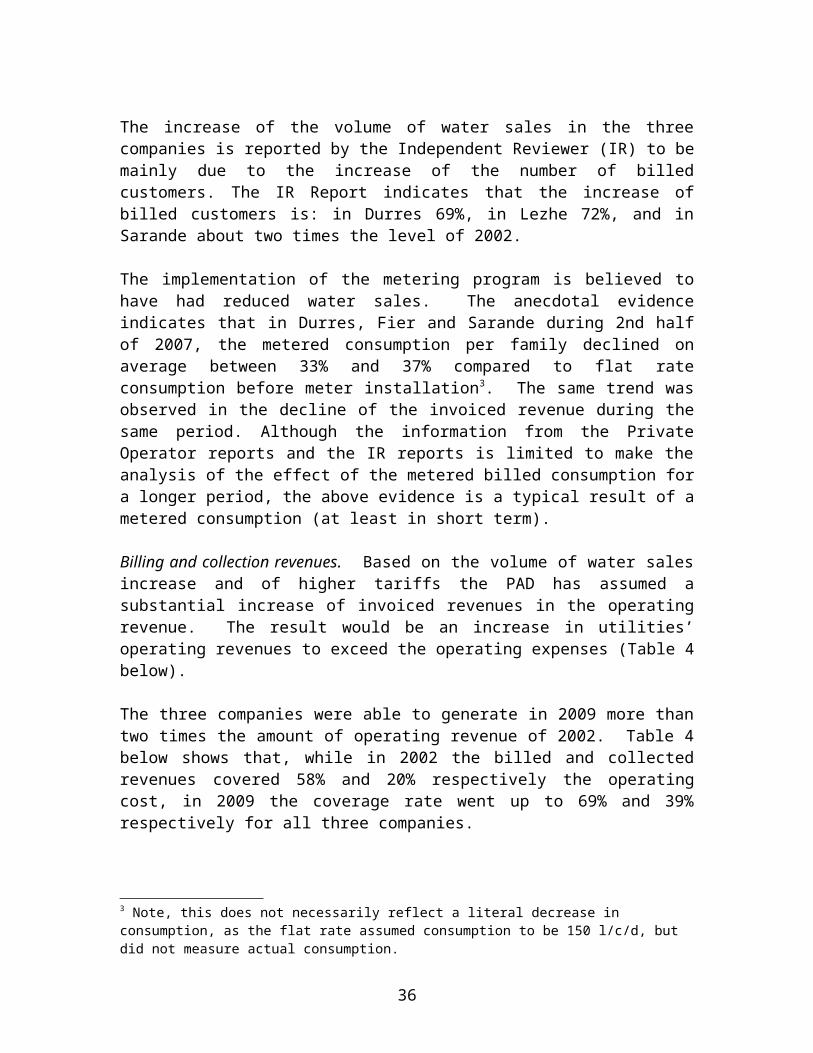
Annex 7. Summary of Borrower's ICR and/or Comments on Draft ICR
No comments were received.
38
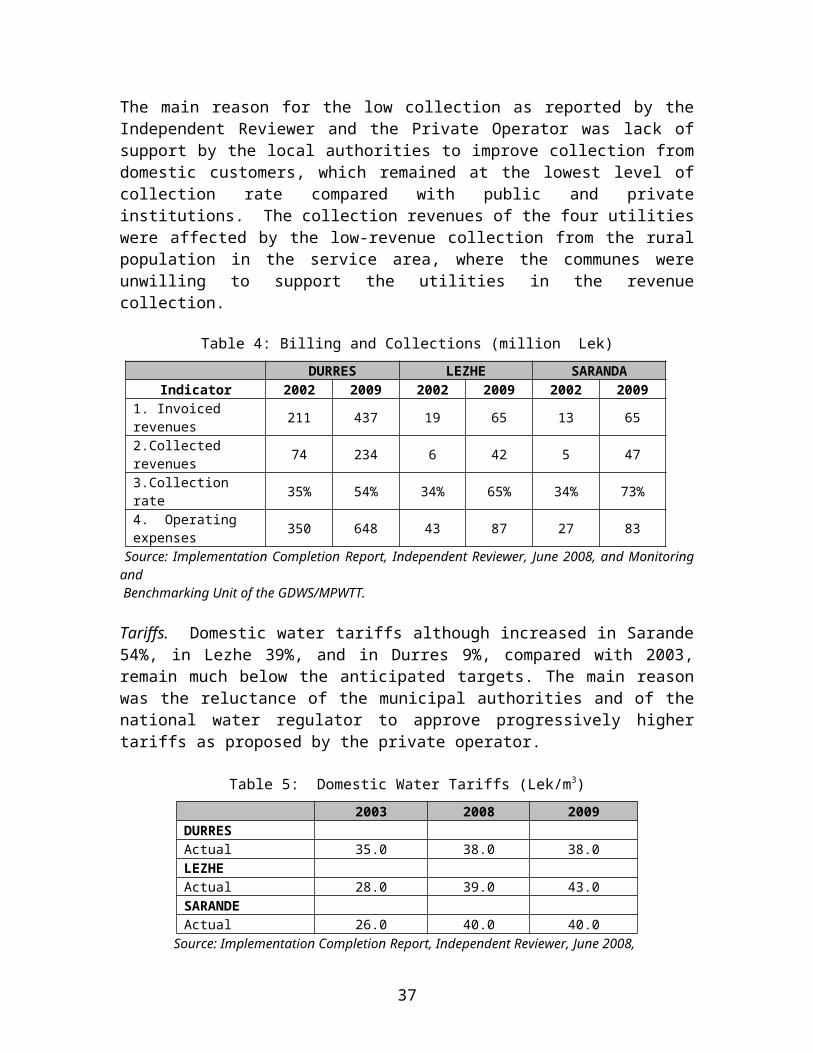
Annex 8. Comments of Cofinanciers and Other Partners/Stakeholders
No comments were received.
39
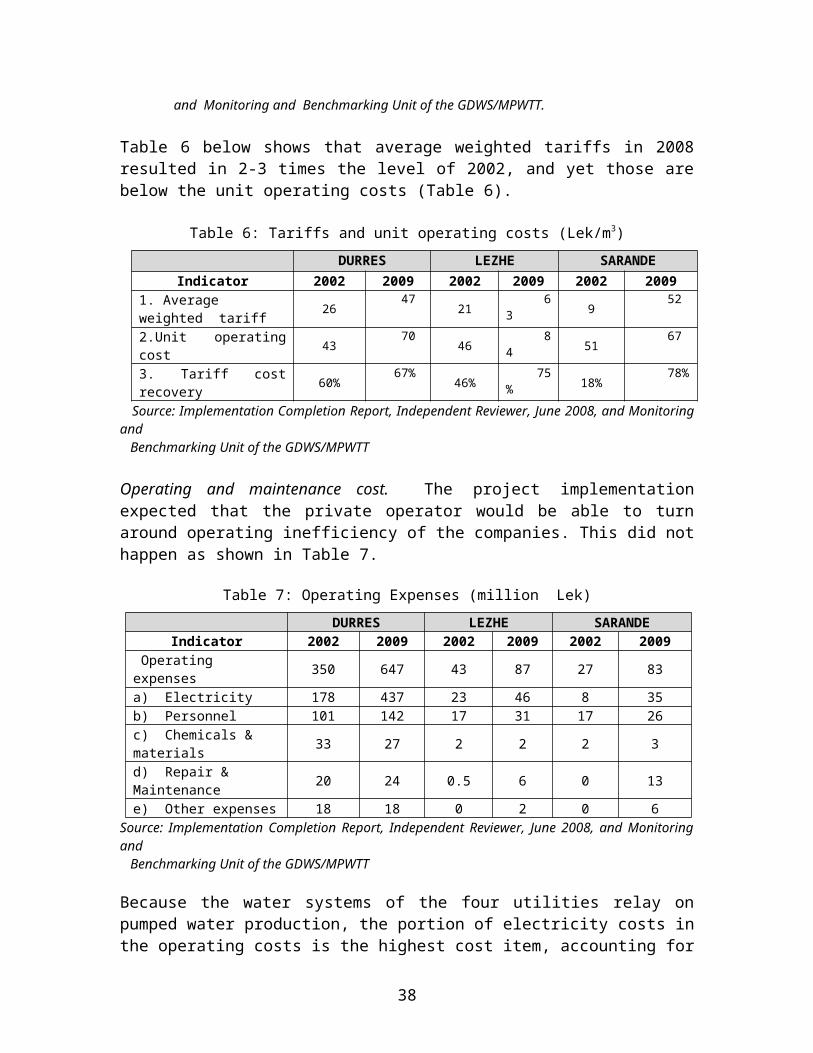
Annex 9. List of Supporting Documents
Country Assistance Strategy for Albania for FY02-05, June 20, 2002 Country Assistance Strategy for Albania for FY06-09, January 10, 2006 Project Information Document Project Appraisal Document, Report No. 27957, February 24, 2004 Grant Agreement Feasibility studies and Consultants reports (Various) Environmental Assessment Financial Management Supervision Reports Investment Plans (Various) Project Management and Audit Reports (Various) Aide memoires Implementation Status and Results Reports Monthly and Quarterly Project Progress Reports
40
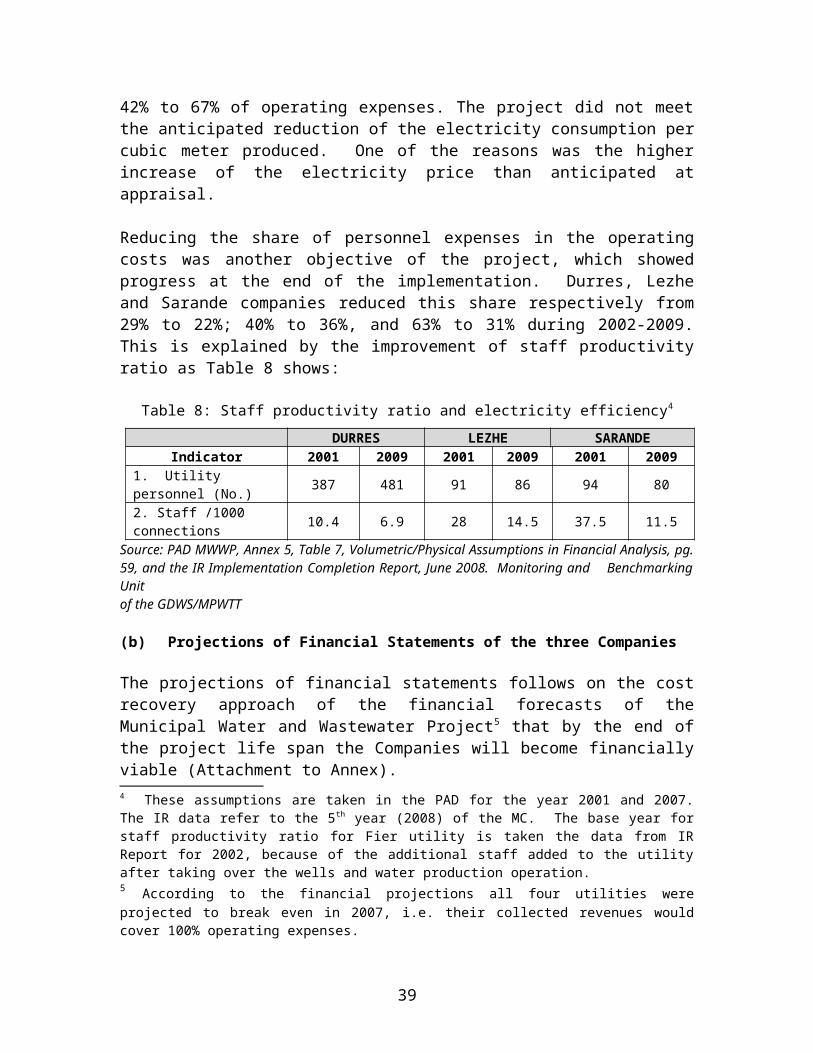
41