ICP 2 11-15-05 final - Wisconsin Department of Natural...
60
1 November 15, 2005 ICP Training November 15, 2005 ICP Training Disclaimer Any reference to product or company names does not constitute endorsement by the Wisconsin State Laboratory of Hygiene, the University of Wisconsin, or the Department of Natural Resources.
Transcript of ICP 2 11-15-05 final - Wisconsin Department of Natural...

1
November 15, 2005 ICP Training
November 15, 2005 ICP Training
Disclaimer
Any reference to product or company names does not constitute endorsement by
the Wisconsin State Laboratory of Hygiene, the University of Wisconsin, or
the Department of Natural Resources.

2
November 15, 2005 ICP Training
Discussion Topics1. Calibration: Single point vs. multipoint2. Selecting background correction points
when dealing with challenging samples3. Advanced techniques for the identification
of interferences and setting proper IECs4. Dealing with special case interferences:
Multi-component spectral fit vs. IEC5. Applying data evaluation tools to
challenging round robin data submitted by participating laboratories
November 15, 2005 ICP Training
ObjectivesTo provide an open forum where analytical problems and solutions can be openly shared among participantsTo better understand background and interference correctionProvide troubleshooting tools that will be useful in data evaluationLearn from each other Improve the overall quality of ICP data in Wisconsin

3
November 15, 2005 ICP Training
Session OutlineSuggested approach to setting up a new instrumentCalibrationDetection capabilitiesBackground correctionInterference correction
Interelement correction factorsMulticomponent spectral fit
Daily interference checksReprocessing data---application and ethicsPostmortem of the Wibby Environmental PT sample…the PT sample from H_LL!
November 15, 2005 ICP Training
4
November 15, 2005 ICP Training
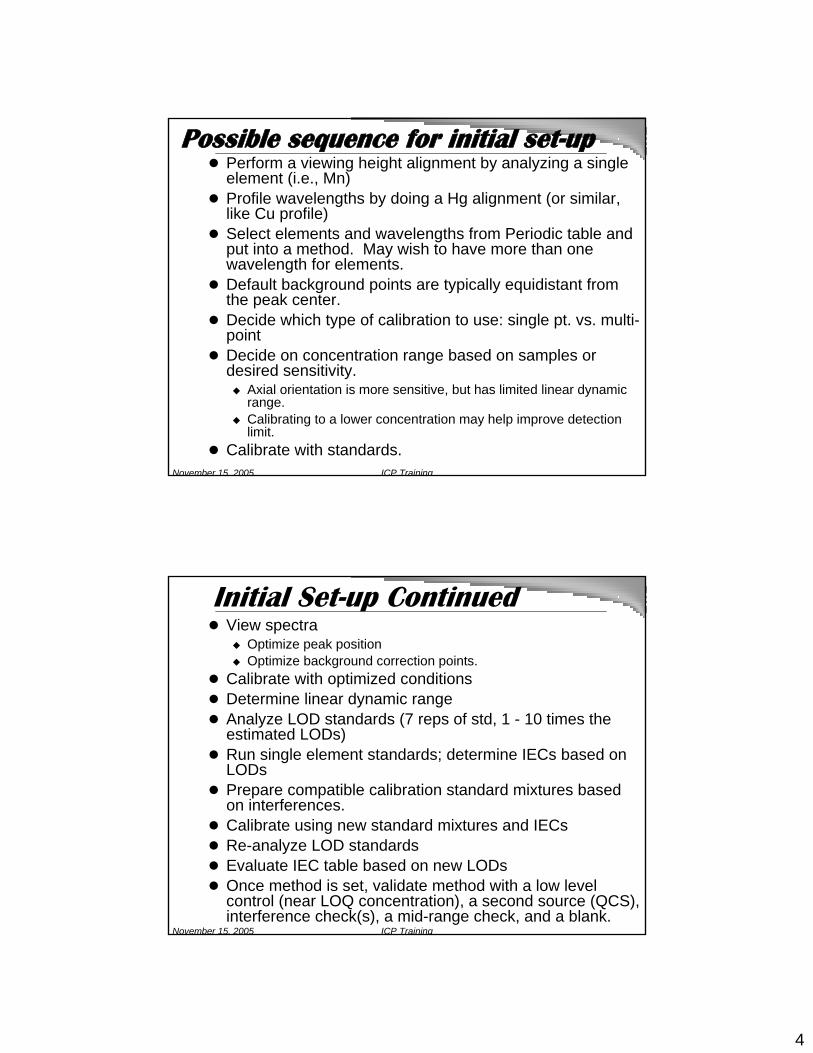
Possible sequence for initial set-upPerform a viewing height alignment by analyzing a single element (i.e., Mn)Profile wavelengths by doing a Hg alignment (or similar, like Cu profile)Select elements and wavelengths from Periodic table and put into a method. May wish to have more than one wavelength for elements. Default background points are typically equidistant from the peak center. Decide which type of calibration to use: single pt. vs. multi-pointDecide on concentration range based on samples or desired sensitivity.
Axial orientation is more sensitive, but has limited linear dynamic range. Calibrating to a lower concentration may help improve detection limit.
Calibrate with standards.
November 15, 2005 ICP Training
Initial Set-up ContinuedView spectra
Optimize peak positionOptimize background correction points.
Calibrate with optimized conditionsDetermine linear dynamic rangeAnalyze LOD standards (7 reps of std, 1 - 10 times the estimated LODs)Run single element standards; determine IECs based on LODsPrepare compatible calibration standard mixtures based on interferences.Calibrate using new standard mixtures and IECsRe-analyze LOD standardsEvaluate IEC table based on new LODsOnce method is set, validate method with a low level control (near LOQ concentration), a second source (QCS), interference check(s), a mid-range check, and a blank.

5
November 15, 2005 ICP Training
November 15, 2005 ICP Training
Calibration with blank and one standard acceptable for all 3
6010 incorporates stricter criteria when 1-pt calibration is usedVerify the calibration at low and mid-level, but……+ 20% criteria is quite forgiving for a mid-level standard…but may be difficult at LOQ level regardless of calibration
Note that only SM touches on the need for multiple integrations
Method Comparison - # of Calibration Levels200.7 6010C 3120B

6
November 15, 2005 ICP Training
Calibration…2 Schools of thought
SLH calibrates with 1 standard plus a blank and reads back an LOQ level standard. This procedure meetsNELAP requirements.
Blank +1 standard
Blank +Multiple standards
Manufacturers recommend: Blank + 1 standard.
Either is fine as long as you can demonstrate linearity and obtainacceptable results upon “reading back” an LOQ standard.
November 15, 2005 ICP Training
Calibration Debate: 1 pt or multi?Comparison of calibration
approach
In each case, a standard was
prepared at the SLH LOQ level for each target
analyte.
These tables show the
recovery for each analyte.

7
November 15, 2005 ICP Training
Calibration approach: accuracy at the LOQ
Multi-point calibration - LOQ Readback
y = 0.9733x - 0.8055R2 = 0.9796
-10
0
10
20
30
40
50
60
70
80
0 20 40 60 80
True value of LOQ (ug/L)
Rea
dbac
k va
lue
of L
OQ
(u
g/L)
Single Point calibration - LOQ Readback
y = 1.0062x + 0.2669R2 = 0.9891
0102030405060708090
0 20 40 60 80
LOQ True Value (ug/L)
LOQ
Mea
sure
d va
lue
(ug/
L)
• 20 of 24 elements recovered w/ in + 5% of True Value
• Only 4 elements outside of 90-110%: Be, B, K, Na
• Range = 70-116%• Correlation= 0.994387
• 16 of 24 elements recovered w/ in + 5% of True Value
• 8 elements outside of 90-110%: Al, Ba, B, Ca, Cu, Mg, Mn, Ag
• Range = 44 -122%• Correlation= 0.98974
November 15, 2005 ICP Training
Blank Data: 1pt v. Multi ptBlank Data (Single pt calibration)
-30
-20
-10
0
10
20
30
Element
Blan
k va
lues
(ug/
L)
Al As Be Cd Cr Cu Pb Mn Ni Se Na V Sb Ba B Ca Co Fe Mg Mo K Ag Tl Zn
_______ +/- LOD for each element
Blank Data (Multi-point)
-30
-20
-10
0
10
20
30
Element
Blan
k va
lues
(ug/
L)
Al As Be Cd Cr Cu Pb Mn Ni Se Na V Sb Ba B Ca Co Fe Mg Mo K Ag Tl Zn

8
November 15, 2005 ICP Training
ICS-A Data: Single pt v. Multi ptSingle point Calibration
-30
-20
-10
0
10
20
30
40
Al 396.153 Axial
Sb 206.836 Axial
As 188.982 Axial
Ba 233.525 Axial
Be 313.042 Axial
B 249.772 Axial
Cd 228.802 Axial
Cr 205.560 Axial
Co 228.615 Axial
Cu 327.399 Axial
Pb 220.353 Axial
Mn 257.608 Axial
Mo 202.032 Axial
Ni 231.606 Axial
Se 196.025 Axial
Ag 338.289 Axial
Tl 190.793 Axial
V 292.402 Axial
Zn 206.198 Axial
Al As Be Cd Co Pb Mo Se TL ZnSb Ba B Cr Cu Mn Ni Ag V
Multi-point Calibration
-30
-20
-10
0
10
20
30
40
Al As Be Cd Co Pb Mo Se TL ZnSb Ba B Cr Cu Mn Ni Ag V
_______ +/- LOD for each element
November 15, 2005 ICP Training
Comparison of calibration techniques:Low level accuracy statistics
LOQStandard
IPCStandard
QCSStandard
Calibration followed by reading back 3 different standards with differing concentrations of 25 elements
Mean recovery= 98.6% Mean recovery= 90.8%Range= 70.5 to 106.1% Range= 44.1 to 121.9%
LOQStandard
IPCStandard
QCSStandard
Calibration followed by reading back 3 different standards with differing concentrations of 20 elements (excludes radial elements (Ca, Fe, K, Mg, Na)
Mean recovery= 100.6% Mean recovery= 100.9%Range= 95.5 to 103.8% Range= 97.9 to 106.3%
Mean recovery= 99.8% Mean recovery= 101.2%Range= 88.4 to 107.3% Range= 95.3 to 108.7%
Single Point Multi- Point
Mean recovery= 99.9% Mean recovery= 88.0%Range= 70.5 to 116.1% Range= 44.1 to 109.0%
Mean recovery= 100.7% Mean recovery= 100.9%Range= 95.5 to 103.8% Range= 97.9 to 106.3%
Mean recovery= 100.9% Mean recovery= 101.7%Range= 97.4 to 107.3% Range= 95.3 to 108.7%
Single Point Multi- Point

9
November 15, 2005 ICP Training
1 pt vs. Multi-pt: Our ConclusionsWith older instrumentation (i.e., direct readers) the data was clear cut in favor of single point calibrationWith current technology (solid state, dual view), the line between the two becomes more grayBOTH approaches have been shown to workOn close examination, however, the nod has to be given to single-point calibration:
Better control at low levels (blanks, LOQ standard)Not only better accuracy, but better precisionMore economical (time and $$$)
November 15, 2005 ICP Training
Limitations of Multi-point CalibrationCalibration range must be short for successful measurement near the LOD (blanks, LOQ level standards and samples)
Multi-point calibration range for Ca: 0-10 ppmCa typically in the 10-100 ppm rangeIf try to bracket samples with calibration standards, frequent dilution maybe required
Optional approach with multi-point Calibrate with shorter range (e.g., Ca 0-10 ppm)Run LDR standard daily (e.g., Ca 200 ppm)Run samples without dilution to within 90% of LDR as per EPA method 200.7
Extra effort to use multi-point calibration has little or no cost/benefit…..why bother!

10
November 15, 2005 ICP Training
Driven by compatibilityPlan on at least 5
Solubility concernsSpectral interferencesStability (Ag)
#ElementsVendor /#solutionsSpex 25 in 5XAXO 25 in 5Radian 25 in 6Inorganic Ventures 31 in 6High Purity Stds 26 in 4RTC 31 in 2SLH 28 in 5
Calibration - Standard Preparation
Compatibility Issues
How many groups?
November 15, 2005 ICP Training
200.7 6010 SM3120BInstrument Optimization
7.9 Mixed calibration standards NOT prepared from primary standards must be initially verified using a certified reference solution
7.4 For all intermediate and working solutions (especially those < 1 ppm) stability MUST be demonstrated prior to use
3.e. Before preparing mixed standards, analyze each stock standard separately to check for interferences/impurities. Verify calibration standards initially w2/ QCS; monitor weekly for stability.
7.9 Acid content = 2% HNO3 / 2% HCl 10.4.1.1 Calibration standards should be prepared with the same acid combination/concentration as samples.
3.e. Mixed calibration standard acid content = 1% HNO3 / 5% HCl
pSuggested standard mixes
7.9 Std I: Ag, As, Ba, B, Ca, Cd, Cu, Mn, Sb, Se
7.4 Std I: Be, Cd, Mn, Pb, Se, Zn 3.e. Std I: Be, Cd, Mn, Pb, Se, Zn
7.9 Std II: K, Li, Mo, Na, Sr ,Ti 7.4 Std II: Ba, Co, Cu, Fe, V 3.e. Std II: Ba, Co, Cu, Fe, V7.9 Std III: Co, P, V 7.4 Std III: As, Mo 3.e. Std III: As, Mo, Li, Si, Sr7.9 Std IV: Al, Cr, SiO2, Sn, Zn 7.4 Std IV: Al, Ca, Cr, K, Na, Ni, Li, Sr 3.e. Std IV: Al, Ca, Cr, K, Na, Ni7.9 Std V: Be, Fe, Mg, Ni, Pb, Tl 7.4 Std V: Ag, Mg, Sb, Tl 3.e. Std V: Ag, B, Mg, Sb, Tl
Agree that mixed standards should be verified….disagree on “how”
Much variation on standard acid composition. 6010 makes best sense
Agree that 5 standard mixes are needed….disagree on composition
Method Comparison - Standard Mixes

11
November 15, 2005 ICP Training
Suggested standard concentrations
7.9 Std I:0.5 (Ag),1.0 (Ba), 2.0( B,Cd,Cu,Mn), 5.0 (Sb,Se), 10 (As,Ca)
7.9 Std II: 1.0 (Sr), 5.0 (Li), 10 (Mo,Na), 20 (K), ? (Ti)
7.9 Std III: 2.0 (Co,V), 10 (P)
7.9 Std IV: 4.0 (Sn), 5.0 (Cr,Zn), 10 (Al,SiO2)
7.9 Std V: 1.0 (Be), 2.0 (Ni), 5.0 (Tl), 10 (Fe,Mg,Pb)
Method Comparison - Calibration Concentrations
Std I: 1.0 (Be), 2.0 (Cd, Mn), 5.0 (Se, Zn), 10 (Pb)
Std II: 1.0 (Ba, Cu, V), 2.0 (Co), 10 (Fe)
Std III: 1.0 (Sr), 5.0 (Li) 10 (As, Mo), 21.4 (Si)Std IV: 2.0 (Ni), 5.0 (Cr), 10 (Al, Ca, K, Na)Std V: 1.0 (B), 2.0 (Ag), 10 (Mg, Sb, Tl)
200.7 3120B
0.5ppm 1ppm 2ppm 5ppm 10ppm 20ppm
200.7 Ag Ba,Sr,Be Cd,Co,Mn,Ni Cr,Li,Se,Zn Al,As,Ca,Fe, KB,Cu,V, Sb,Tl Mg,Mo,Na,Pb,
Si
3120B --- Ba,Sr, Be, Cd, Co, Mn,Ni, Cr,Li,Se,Zn, Al,As,Ca,Fe, ---Cu,V,B Ag Mg,Mo,Na,Pb,
Si, K, Sb, Tl
Calibration Standard Concentrations
November 15, 2005 ICP Training

12
November 15, 2005 ICP Training
SLH LODs (PE 5300 DV, 1 pt calibration, SeaSpray nebulizer,
cyclonic spray chamber)Element Calib std. LOQ stock LOD
Ag 2000 300 3Al 2000 500 5As 2000 500 5B 2000 1000 10Ba 2000 100 1Be 200 50 0.5Cd 2000 300 3Co 2000 300 3Cr 2000 500 5Cu 2000 500 5
Mn 1000 100 1Mo 2000 500 5Ni 2000 500 5Pb 2000 500 5Sb 2000 500 5Se 2000 1000 10Tl 2000 1000 10V 2000 300 3
Zn 2000 500 5
Ca 200 10 0.1Fe 30 10 0.1K 30 10 0.1Mg 100 10 0.1Na 200 10 0.1
Element Calib std. LOQ stock LOD
Element Calib std. LOQ stock LOD
November 15, 2005 ICP Training
P-E Optima 2100 DV 3-sigma IDLsAnalyte IDL, ppb
Ag 328.068 0.549 As 188.979 4.29Ba 233.527 0.555 Cd 226.502 0.607Co 238.892 0.346 Cr 267.716 0.744 Cu 327.393 1.41 Mn 257.610 0.095Na 589.592 15.5 Ni 231.604 0.839 Pb 220.353 2.21 Sb 206.836 4.68Se 196.026 2.54 Tl 190.801 2.38V 292.464 1.52 Zn 206.200 1.19
Perkin-ElmerField Application Note
Environmental Analysis Using theOptima 2100 DV ICP System
13
November 15, 2005 ICP Training
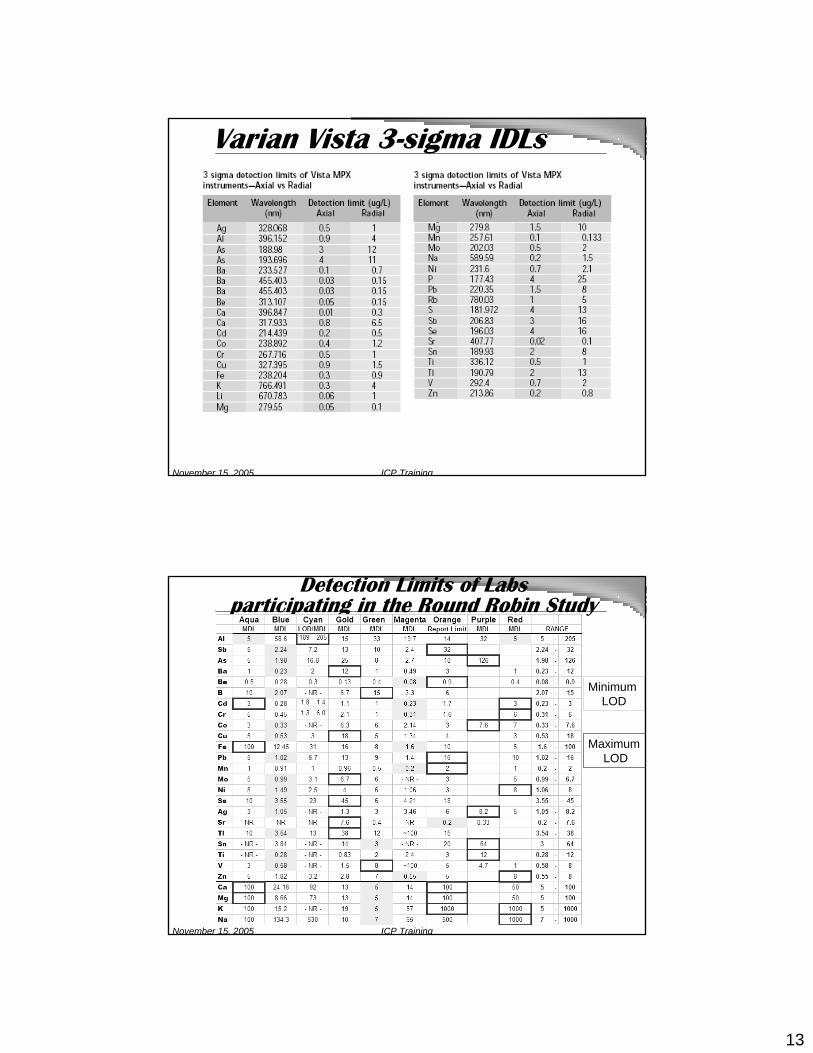
Varian Vista 3-sigma IDLs
November 15, 2005 ICP Training
Detection Limits of Labs participating in the Round Robin Study
Minimum LOD
Maximum LOD

14
November 15, 2005 ICP Training
Select Elements – DL Comparisons
A used wavelength 190.790
November 15, 2005 ICP Training
Determining Realistic LODs: One Approach
Determine LODs using the EPA approach (which is based on precision and may not reflect actual detection capability)If your blank results are frequently outside of + the LOD, the LOD is unrealisticRead back standards at the LOQ.If you cannot achieve recoveries of 70-130% the LOD is too low and should be raised.Increase the LOQ concentration to a reasonable level and repeat replicate measurements. If you can measure this level within 70-130% your LOQ estimate is likely good.Divide the LOQ by 3.333 (per NR 149) to obtain the LOD.Talk with your auditor and show him/her the data to see if they concur with you.

15
November 15, 2005 ICP Training
Detection Capability and ArsenicThe new generation instrumentation strongly suggests that achievable detection limits will allow ICP to virtually replace GFAA
With the push to lower SDWA MCLs (and NR 140 PALs) for elements such as Pb and As, is ICP still a viable option for low level analysis of arsenic?
The SLH looked at a 2004 groundwater study for arsenic when both ICP and GFAA techniques were performed on the same sample.
November 15, 2005 ICP Training
Arsenic; ICP vs. GFAAComparison of Arsenic Analyses Performed
by GFAA and ICP - All Results (N=159)
y = 0.9783x - 0.3174R2 = 0.9991; R=0.9995
-200
0
200
400
600
800
0 200 400 600 800
ICP ug/L
GFA
A u
g/L
Correlation for ALL data looks good, but don’t be fooled by limitations of the correlation coefficient
Comparison of Arsenic Analyses Performed by GFAA and ICP - Results in the Range of 10-100 ug/L (N=29)
y = 0.9926x - 0.4009R2 = 0.9942; R=0.997
0
20
40
60
80
100
0 20 40 60 80 100ICP ug/L
GFA
A u
g/L
Looking a bit closer, we see that the correlation DOES drop, but agreement still looks good
Comparison of Arsenic Analyses Performed by GFAA and ICP-Results in Range of 5-25 ug/L (N=38)
y = 0.9758x - 0.3611R2 = 0.9608; R=0.9802
05
1015202530
0 10 20 30
ICP ug/L
GFA
A u
g/L
Narrowing the range further, we start to see data scattering

16
November 15, 2005 ICP Training
Arsenic; ICP vs. GFAA
Comparison of Arsenic Analyses Perfromed by GFAA and ICP - Results in the Range of 1-10 ug/L
(N=109)
y = 1.0264x - 0.5885R2 = 0.6538; R=0.8086
-15-10
-505
1015
0 2 4 6 8 10 12
ICP ug/L
GFA
A u
g/L
Comparison of Aresenic Analyses Performed by GFAA and ICP - Results in the Range of 5-10 ug/L (N=38)
y = 1.1706x - 1.8993R2 = 0.781; R=0.884
0
5
10
15
0 2 4 6 8 10 12
ICP ug/L
GFA
A u
g/L
Looking only at data in the 1-10 ug/L range, it is clear that GFAA is better below 5 ug/L.
Note that as of Jan. 2006, the EPA will no longer approve use of ICP for compliance testing of As in drinking water
Narrowing the range further, we start to see data scatter.
ICP shows a little high bias over GFAA
November 15, 2005 ICP Training

17
November 15, 2005 ICP Training
6010C10.1.1 Before using this procedure to analyze samples, data must be available documenting the initial demonstration of performance. The required data document the selection criteria for background correction points; analytical dynamic ranges, the applicable equations, and the upper limits of those ranges; the method and instrument detection limits; and the determination and verification of interelement correction equations or other routines for correcting spectral interferences. These data must be generated using the sameinstrument, operating conditions, and calibration routine to be used for sample analysis. These data must be kept on file and be available for review by the data user or auditor.
6010C4.1.2 AND 200.7 4.1.44.1.2 To determine the appropriate location for off-line background correction, the user must scan the area on either side adjacent to the wavelength and record the apparent emission intensity from all other method analytes. This spectral information must be documented and kept on file. The location selected for background correction must be either free of off-line interelement spectral interference or a computer routine must be used for automatic correction on all determinations.
200.74.1.4 If a wavelength other than the recommended wavelength is used, the user must determine and document both the on-line and off-line spectral interference effect from all method analytes and provide for their automatic correction on all analyses.
Background Correction
Bottom Line: What BGC points were selected and why?
November 15, 2005 ICP Training
Background Correction Basics
www.ivstandards.com/tech/icp-ops/part08.asp
An example showing how a sample with very high levels of Calcium will increase background radiation/intensity over the whole spectrum.

18
November 15, 2005 ICP Training
Background correction: Flat but elevated baseline
Illustration from: http://www.ivstandards.com/tech/icp-ops/part08.asp#icp-types
Note that this software system uses “regions”instead of discrete pointfor background correction.
Note that this software averages the baseline adjustment and subtracts it from the analyte peak intensity
Note intentional placement of 2nd background correction zone just beyond Re 213.904 line.
Zn peak with straight-line baseline noise increase due to 62000 ppm Ca.
Zn peak = ~ 212K countsBackground = ~15K counts
Corrected Zn intensity = 197K
]55k – 40 K = 15
November 15, 2005 ICP Training
Background correction: sloping linear
~93k – 35 = 58K~105k – 35= 70K
Average background = 64K
~110k – 35 = 75K
Sr peak = ~ 75K countsBackground = ~64K countsCorrected Sr intensity = 11K
Note that Sr peak appears within linear portion of sloped background.
Background correction points must be taken equidistant from peak center.
Sr peak with sloping/linear baseline due to 62000 ppm Ca.
Illustration from: http://www.ivstandards.com/tech/icp-ops/part08.asp#icp-types

19
November 15, 2005 ICP Training
Background correction: sloping non-linear
Na peak = ~ 2200K countsBackground = ~2050K countsCorrected Na intensity = 150K
Note that Na peak appears within linear portion of sloped background.
Background correction points must be taken equidistant from peak center.
Sr peak with sloping/linear baseline due to 62000 ppm Ca.
Illustration from: http://www.ivstandards.com/tech/icp-ops/part08.asp#icp-types
November 15, 2005 ICP Training
Deciding to use an alternate line
http://www.ivstandards.com/tech/icp-ops/enlarge/07/fig1.asp
Ni100 ppm
Fe100 ppm
Cr100 ppbSwitching to the
267.716 line, it looks very clean
Ni100 ppm
Fe100 ppm Cr
100 ppb
Initially looking at the 205.552 line for Cr,. The
decision is that other analytes in this sample
make the use of this line too challenging

20
November 15, 2005 ICP Training
Background shifts
50ppb Pb only Reads: :50.86
…….200ppm Ca
50ppb Pb + 200 ppm CaReads: :50.72
November 15, 2005 ICP Training
Background shifts: Ca on Mo
50ppb Mo reads: 50.10 ppb
…… 200 ppm Ca
50ppb Mo + 200ppm Ca(also requires an IEC)
reads: 52.9 ppb

21
November 15, 2005 ICP Training
Background shifts: As
206.8
413.6
620.4
827.2
1034.0
1240.8
1447.6
1654.4
1861.2
++
++
LOQ level check standard
LOQ level + Water level interferents
LOQ level + Solid level interferents
November 15, 2005 ICP Training
Be : problem w/ default background
200.7 w/ default background points (-0.029 and +0.029nm)

22
November 15, 2005 ICP Training
Be : optimized background
200.7 w/ optimized background point ( +0.029nm only)
November 15, 2005 ICP Training
Ti : Default background
Default background points 2400mg/Kg Ti
Default 2-point correction results in
loss of significant area

23
November 15, 2005 ICP Training
Ti; optimimized background
Correct background point for Ti
November 15, 2005 ICP Training
Major interferents (ICS-A) effect at wavelength of main target analytes at a concentration equal to their LOQ
ALFECAMGNATarget Analytes
0
100
200
300
400
500
600
700
200 210
0
20
40
60
80
100
120
140
160
180
200
190 200
TL AS SE
0
500
1000
1500
2000
2500
3000
3500
4000
4500
213.50
50
100
150
200
250
300
350
400
450
500
214 221
MO CR P PBZN
This shows effect of Ca and Fe on Tl, As, and Se.
…while elements such as Cr and Zn do not seem to be affected

24
November 15, 2005 ICP Training
500
1500
2500
3500
4500
5500
6500
7500
249 259 269 279 289 299 309 319 329
Major interferents (ICS-A) effect at wavelength of main target analytes at a concentration equal to their LOQ
ALFECAMGNATarget Analytes
B V CU AGSI
Vanadium shows itself to be another analyte not effected by a high cation background.
November 15, 2005 ICP Training
150ppb Cd + 20ppm Codefault background points result: 65.5
Co interference on Cd seriesno IECs involved…just background correction
+
150ppb Cd + 20ppm Cooptimized (single) background point.Result 157.3
25
November 15, 2005 ICP Training
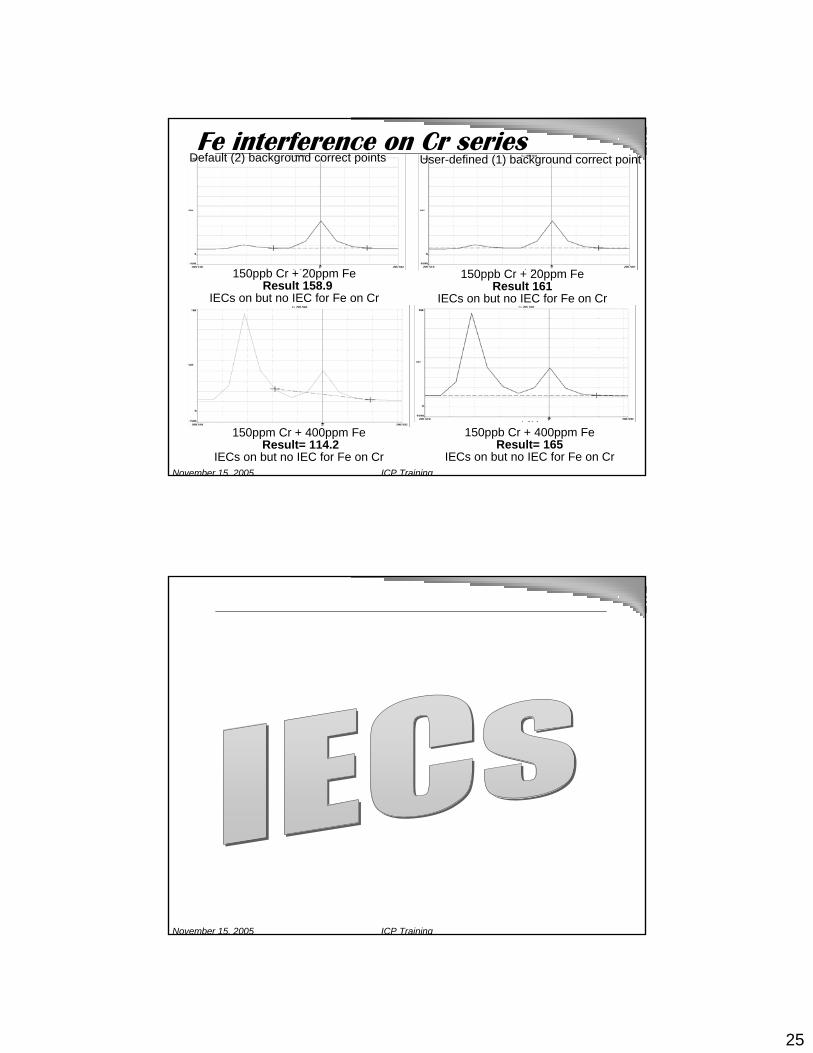
Fe interference on Cr series
150ppb Cr + 20ppm FeResult 158.9
IECs on but no IEC for Fe on Cr
150ppb Cr + 20ppm Fe Result 161
IECs on but no IEC for Fe on Cr
150ppm Cr + 400ppm Fe Result= 114.2
IECs on but no IEC for Fe on Cr
150ppb Cr + 400ppm Fe Result= 165
IECs on but no IEC for Fe on Cr
Default (2) background correct points User-defined (1) background correct point
November 15, 2005 ICP Training

26
November 15, 2005 ICP Training
Determining what Interferences exist
Spectral overlap? Or background correction?
Generating correction factors
Verifying adequate correctionwhat the methods requirecommon sense approach
calibration blankICS-A….1o interferents (major cations)ICS-B?? 2o interferents (other elements that might interfere)ICS-AB
Interference Correction
November 15, 2005 ICP Training
Option A: Interference Correction using method wavelngths
4.1.4 Interferences must be evaluated for each instrument. When using method suggested λ, analyst must determine and document for each λ the effect of interferences in Table 2 (and use a computer routine for auto-correction
4.1.4 Interferences must be evaluated for each instrument. When using method suggested λ, analyst must determine and document for each λ the effect of interferences in Table 2
Determine interelement CFs by analyzing single element stock solutions of appropriate concentration under conditions matching as closely as possible those of samples.
Table 2
Requires evaluation of interference from 17 elements: Al,Fe,Cu,Ni,Cr,Mn,V,Be,Ba,Co,Mo,Sn,Ti,Cd,Tl,Si,Ce NOTE what's missing: Ca, Mg, Na
Table 2
Requires evaluation of interference from 10 elements: Al, Ca, Mg, Fe, Cu, Ni, Cr, Mn, V, Ti 1000 ppm: (Al, Ca,Fe,Mg) used by EPA 200 ppm: all others used by EPA
NOTE what's missing: Na only
Option A: Interference Correction using method wavelngths
4.1.4 Interferences must be evaluated for each instrument. When using method suggested λ, analyst must determine and document for each λ the effect of interferences in Table 2 (and use a computer routine for auto-correction
4.1.4 Interferences must be evaluated for each instrument. When using method suggested λ, analyst must determine and document for each λ the effect of interferences in Table 2
Determine interelement CFs by analyzing single element stock solutions of appropriate concentration under conditions matching as closely as possible those of samples.
Table 2
Requires evaluation of interference from 17 elements: Al,Fe,Cu,Ni,Cr,Mn,V,Be,Ba,Co,Mo,Sn,Ti,Cd,Tl,Si,Ce NOTE what's missing: Ca, Mg, Na
Table 2
Requires evaluation of interference from 10 elements: Al, Ca, Mg, Fe, Cu, Ni, Cr, Mn, V, Ti 1000 ppm: (Al, Ca,Fe,Mg) used by EPA 200 ppm: all others used by EPA
NOTE what's missing: Na only
Option A: Interference Correction using method wavelngths
4.1.4 Interferences must be evaluated for each instrument. When using method suggested λ, analyst must determine and document for each λ the effect of interferences in Table 2 (and use a computer routine for auto-correction
4.1.4 Interferences must be evaluated for each instrument. When using method suggested λ, analyst must determine and document for each λ the effect of interferences in Table 2
Determine interelement CFs by analyzing single element stock solutions of appropriate concentration under conditions matching as closely as possible those of samples.
Method Comparison -What Elements Must be Tested?
200.7 (4.1.4)6010C (4.1.2)If a wavelength other than the recommended wavelength is used, the user must determine and document both the on-line and off-linespectral interference effect from all method analytes and provide for their automatic correction on all analyses.
200.7 6010C 3120B

27
November 15, 2005 ICP Training
6010 suggested IECs –but not plug n’ play
November 15, 2005 ICP Training
Procedure for Generating IECs (PE 5300 DV)
Calibrate instrument as usual.Run single element standards at levels equal to calibration standards.If no previous IEC table is in the method, create a new one by entering standards as samples and choosing which element is the possible interferent.Check all standards against a table of LODs or reporting limits.If any analyte exhibits a response greater than the LOD:
calculate an IEC as “apparent” analyte concentration (ppb) per ppm of interferent
If the method already had an IEC table in it, then the analytes that were greater than the LODs will be manually calculated, as above, and the current IEC will be edited.Once the table is complete the single element standards should be analyzed again to ensure they worked and were accurate.Some minor editing of the IEC table may be required.Reprocessing the analytical run used to collect the data, with the IEC table, will not give an accurate indication of the IECs at work.It is best to re-evaluate LODs after IECs have been calculated.

28
November 15, 2005 ICP Training
No. 1 Rule for determining IECsBe sure that your single
element standards do not contain significant
concentrations of target elements
November 15, 2005 ICP Training
29
November 15, 2005 ICP Training
Principle
Breaking New Ground...
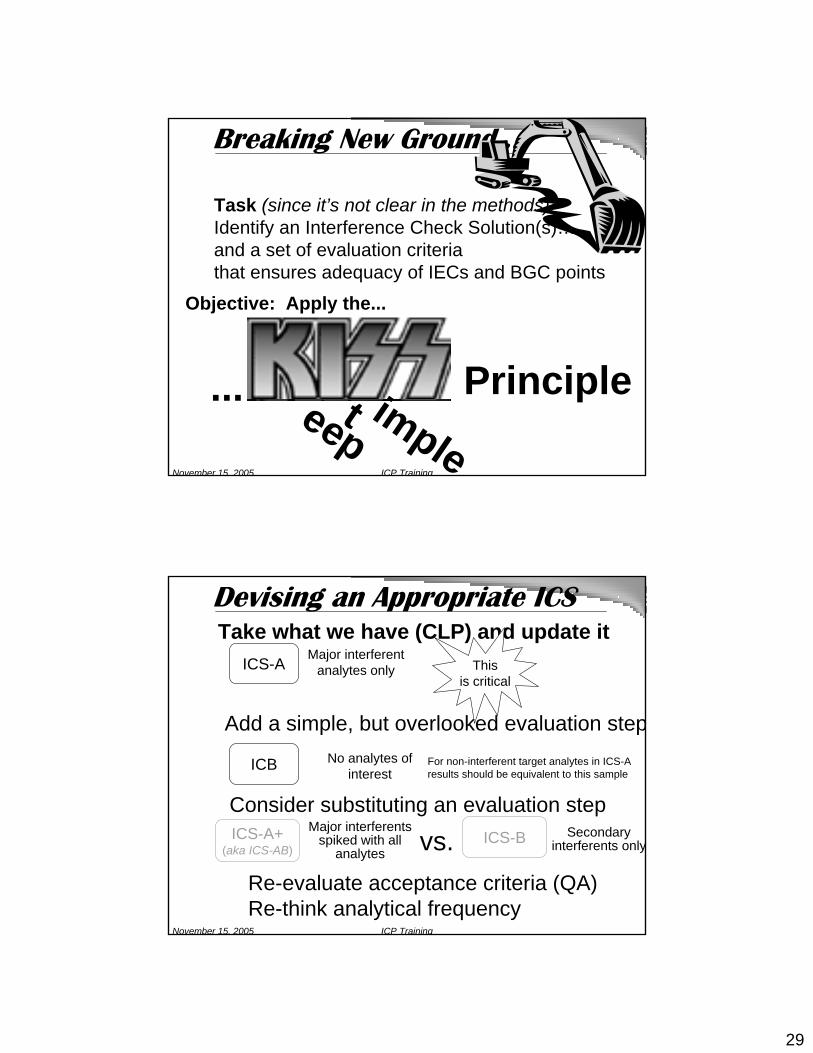
Task (since it’s not clear in the methods):Identify an Interference Check Solution(s)…and a set of evaluation criteriathat ensures adequacy of IECs and BGC points
impleteep
...
Objective: Apply the...
November 15, 2005 ICP Training
Take what we have (CLP) and update itDevising an Appropriate ICS
Re-evaluate acceptance criteria (QA)Re-think analytical frequency
ICB No analytes of interest
ICS-A This is critical
Major interferentanalytes only
Add a simple, but overlooked evaluation step
Consider substituting an evaluation stepICS-A+
(aka ICS-AB)
Major interferentsspiked with all
analytesICS-B Secondary
interferents onlyvs.
For non-interferent target analytes in ICS-A results should be equivalent to this sample

30
November 15, 2005 ICP Training
What about the ICS-AB sample?Typically, the “B” means that all target analytes are spiked in with the interferents at a concentration from 0.5 to 1.0 ppmUsing +/- 20% acceptance criteria, this amounts to allowing +/- 100-200 ppb as “acceptable”When trying to analyze trace levels (below 50 ppb), +/- 100-200 ppb represents a huge difference that can mask potential inter-element interferencesThe original reason for the ICS-AB sample was for early instruments that could not display negative numbers (further suggesting validity of +/- LOD)If you remain caught up in the ICS-AB concept, at least consider spiking target analytes at a much lower level (3-5 times LOQ)
November 15, 2005 ICP Training
ICS Recommendations: How do we know our IECs are working.Analyze & Evaluate Initial Calibration Blank (ICB)
All target analytes should be within + LOD
Analyze & Evaluate an ICS-A standardICS-A = Some combo of : Al, Ca, Mg, Fe, K, Na
Use levels = 99% level of expected concentrationMay use different ICS-A levels for different matrices
ex. Soils: Al, Ca, Mg, Fe all at 500 ppmex: drinking water: Al, Ca, Mg, Fe all at 50 ppmex:The “Wibby Sample”:????Interferents should be within + 5% of true value All unspiked target analytes should be within + LOD
Optimally, checks should be made with each run(Methods allow weekly if control is demonstrated)

31
November 15, 2005 ICP Training
ICS Recommendations: How do we know our IECs are working. Analyze & Evaluate an ICS-B standardICS-B = 2° Interferents only (e.g., Be,Ba,Cd,Co,Cr,Cu,Mn,Ni,V)
Use levels = 99% level of expected concentrationSuggest 10-50 ppm for eachInterferents should be within + 10% of true valueAll unspiked target analytes should be within + LOD.
Analyze & Evaluate an ICS-A+ [ICS-B+] standardICS-A+/ B+ = Interferents at regular level + all target analytesDesign target analyte spike levels to detect bias near LOD
Suggest 3 x LOQ for each analyteAll analytes should be within + 10% of true valueAt 3 x LOQ, target analyte recovery should be + LOD
November 15, 2005 ICP Training
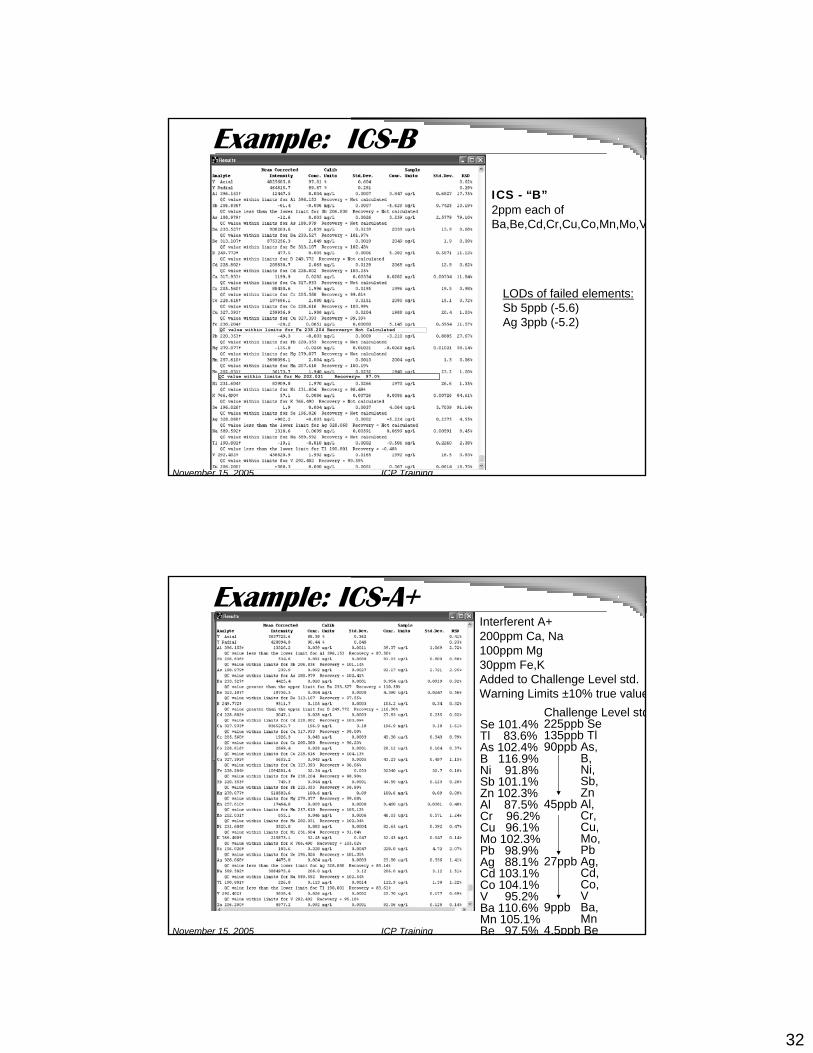
ICS-”A”200ppm Ca, Na100ppm Mg30ppm Fe,K
LODs of failed elementsAl 5ppb (-7.4 ppb)Ba 1ppb ( 1.2 ppb)Ag 3ppb (-3.5 ppb)
Control Limits: + LOD
Example: ICS-A
32
November 15, 2005 ICP Training
ICS - “B”2ppm each of Ba,Be,Cd,Cr,Cu,Co,Mn,Mo,V
LODs of failed elements:Sb 5ppb (-5.6)Ag 3ppb (-5.2)
QC value within limits for Fe 238.204 Recovery= Not Calculated
QC value within limits for Mo 202.031 Recovery= 97.0%
Example: ICS-B
November 15, 2005 ICP Training
Interferent A+200ppm Ca, Na100ppm Mg30ppm Fe,KAdded to Challenge Level std. Warning Limits ±10% true value
Challenge Level std225ppb Se135ppb Tl90ppb As,
B,Ni,Sb,Zn
45ppb Al,Cr,Cu,Mo,Pb
27ppb Ag,Cd,Co,V
9ppb Ba,Mn
4.5ppb Be
Se 101.4%Tl 83.6%As 102.4%B 116.9%Ni 91.8%Sb 101.1%Zn 102.3%Al 87.5%Cr 96.2%Cu 96.1%Mo 102.3%Pb 98.9%Ag 88.1%Cd 103.1%Co 104.1%V 95.2%Ba 110.6%Mn 105.1%Be 97.5%
Example: ICS-A+

33
November 15, 2005 ICP Training
November 15, 2005 ICP Training
Fe on Cr SummaryDefault (2) background correct points User-defined (1) background correct point
LOQ level standard of Cr
LOQ level standard of Cr + SLH’s Solid Level of Interferents
LOQ level standard of Cr + SLH’s Water Level of Interferents

34
November 15, 2005 ICP Training
Summary: Cr @ 150 ppb
NO INTWater level
INTSolid level
INT
Default2 BC
156.9 155.1 119.6
Default 2 BC + IEC 157.5 156.5 146.9
User-select 1 BC
User-select 1 BC+IEC
158.0 156.5 159.3
158.8 158.3 158.8
November 15, 2005 ICP Training
Default background points 150ppb Cd + 2ppm Co
Result 145.2
Optimized (single)background points 150ppb Cd + 2ppm Co
Result 154.2
Co interference on Cd series

35
November 15, 2005 ICP Training
150ppb Cd + 20ppm Co default background points result: 65.5
Co interference on Cd seriesno IECs involved…just background correction
+
150ppb Cd + 20ppm Cooptimized (single) background point.Result 157.3
November 15, 2005 ICP Training
Default background points 150ppb Cd + 60ppm Co Result: -113.9
Co interference on Cd series
Optimized (single) background point 150ppb Cd + 60ppm Co Result: 168.3

36
November 15, 2005 ICP TrainingArea calculated for 150ppb Cd + 60ppm Co default bkgrd no IECs
Co
Cd
Co interference on Cd seriesHow the peak is integrated to a negative intensity
November 15, 2005 ICP Training
Co interference on Cd series
168.3157.3154.2Optimal (1 pt)(-113.9)65.5145.2Default (2 pt)
+ 60 ppm Co+ 20 ppm Co+ 2 ppm CoBackgroundcorrection
150.9153.5156.7Optimal (1 pt)(-35.0)91.7147.8Default (2 pt)
+ 60 ppm Co+ 20 ppm Co+ 2 ppm CoBackgroundcorrection
149.2150.9153.6Optimal (1 pt)161.6157.0154.1Default (2 pt)
+ 60 ppm Co+ 20 ppm Co+ 2 ppm CoBackgroundcorrection
With IECs based on analysis of 60 ppm CO standard applied
With IECs based on analysis of 2 ppm CO standard applied
Without any IECs|----------------- 150 ppb Cadmium ----------------|

37
November 15, 2005 ICP Training
Fe on B SummaryDefault (2) background correct points User-defined (1) background correct point
LOQ level standard of Boron
LOQ level standard of B + SLH’s Solid Level of Interferents
LOQ level standard of B + SLH’s Water Level of Interferents
November 15, 2005 ICP Training
Summary: Fe on B @ 300 ppb
NO INTWater level
INTSolid level
INT
Default 2 BC
293.3 292.4 - 761.2
Default 2 BC + IEC 288.3 281.9 - 968.2
User-select 1 BC
User-select 1 BC+IEC
311.8 332.9 115.8
288.3 281.9 - 54.5

38
November 15, 2005 ICP Training
November 15, 2005 ICP Training
What is MSF?MSF- What is it?
Proprietary software algorithm provided with Perkin-Elmer ICP instruments. It uses multiple regression technique.
What does it do?An advanced form of IEC correction. By feeding it ICP spectra of blank, standard and interferents, the software “de-constructs” a sample spectrum in order to resolve and integrate only the peak related to the analyte
Are there limitations?MSF will not work for direct spectral overlapCertainly, it’s best to “feed” the algorithm data that closely matches the real sample.This is really a sample specific or interference-specific correction rather than a universal correction
39
November 15, 2005 ICP Training
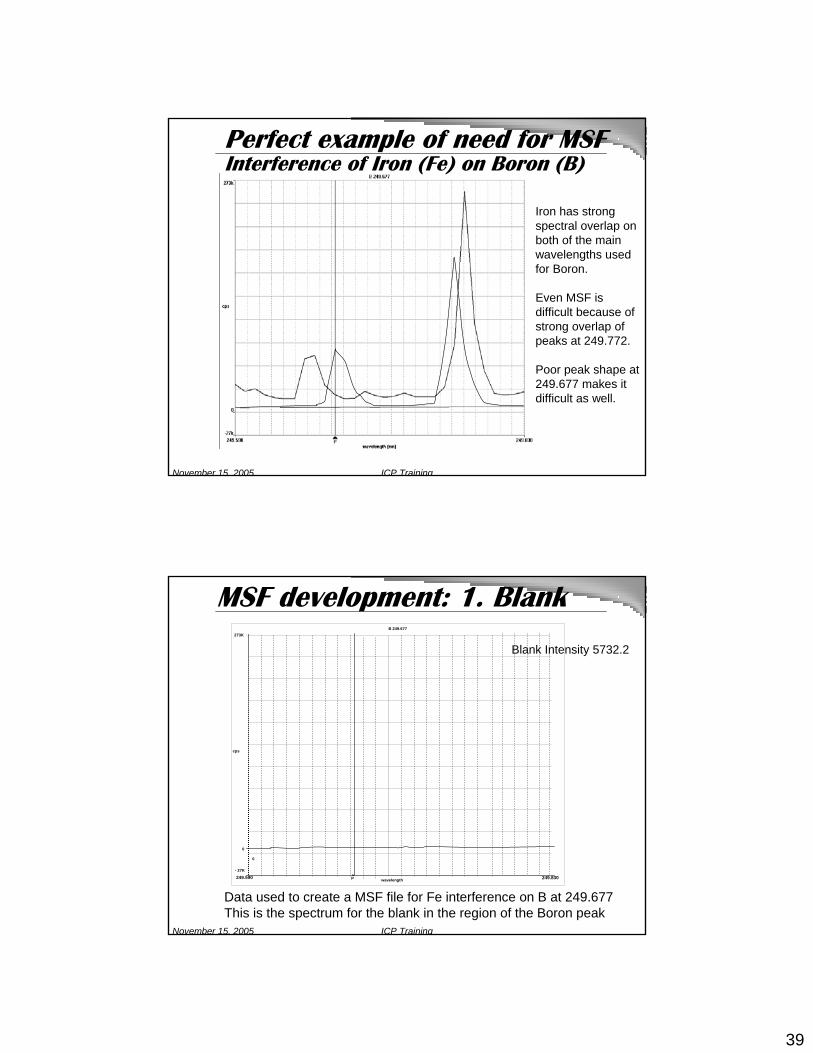
Iron has strong spectral overlap on both of the main wavelengths used for Boron.
Even MSF is difficult because of strong overlap of peaks at 249.772.
Poor peak shape at 249.677 makes it difficult as well.
Fe
B
B
Fe
Perfect example of need for MSFInterference of Iron (Fe) on Boron (B)
November 15, 2005 ICP Training
Data used to create a MSF file for Fe interference on B at 249.677 This is the spectrum for the blank in the region of the Boron peak
P
B 249.677
249.830249.590 wavelength
- 27K
0
0
cps
273K
MSF development: 1. Blank
Blank Intensity 5732.2

40
November 15, 2005 ICP Training
Data used to create a MSF file for Fe interference on B at 249.677This is the spectrum of the Boron std (2ppm) used to develop the MSF
B
B
P
B 249.677
249.830249.590 wavelength
- 27K
0
0
cps
273K
MSF Development : 2. Boron only
STD 1 Intensity = 73462.0
November 15, 2005 ICP Training
Fe
Fe
P
B 249.677
249.830249.590 wavelength
- 27K
0
0
cps
273K
MSF Development: 3. Fe 400 ppm only
400 ppm Fe Intensity =20390.1
Data used to create a MSF file for Fe interference on B at 249.677This is the spectrum of the Iron std (400 ppm) used to develop the MSF

41
November 15, 2005 ICP TrainingThis shows the sample with 1ppm B and 400ppm Fe 53537.4
MSF Development: Blank+ Boron+ Fe Interference
This is what the instrument “sees”
November 15, 2005 ICP Training
B
B
P
B 249.677
249.830249.590 wavelength
Fe
Fe
- 27K
0
0
cps
273K
MSF Development: Blank+ Boron+ Fe InterferenceThis is how the
instrument uses MSF input data to “pull” the
Boron out of the spectrum
Electronically, the instrument determines and then subtracts the background (blank) and iron components of the sample to leave only the boron component which can then be easily integrated.

42
November 15, 2005 ICP Training
The results for analyzing a 1000 ug/L (ppb) single element Boron standard to which 400 ppm of Iron was added are as follows:
With no IECs : 1249 ppb ~ 25% high bias Background correction is insufficient
With water IECs: 1067 ppb ~ 7% high biasThis correction is based on Fe at 20 ppm
With solid IECs : 1026 ppb ~ 3% high biasThis correction is based on Fe at 400 ppm
Using MSF: 1016 ppb ~ 2% high biasWhile the solid IEC gives good results, the MSF-derived value is slightly better.
MSF vs. IEC comparison
November 15, 2005 ICP Training

43
November 15, 2005 ICP Training
Interference: As on Cd
www ivstandards com/tech/icp-ops/part08 asp
2400K
2000K
1600K
1200K
800K
400K
Cd228.802
As228.812
228.720 228.760 228.800 228.840 228.880 nm
___1 ppm Cd___10 ppm Cd
- - -1 ppm Cd+ 100 ppm As
…..10 ppm Cd+ 100 ppm As
November 15, 2005 ICP Training
Using RE-PROCESS to update an IECThe lab noted that although a little high biased, the Cd in their LOQ check standard was acceptable.On this day, however, they were analyzing a new TCLP internal blind PT Things that should have no Cd (blanks, INTRF) looked good.Things that had relatively high As (QCS, LFB) showed high Cd bias. It was noted that these As levels exceeded the level at which IECs had been determined.The background correction points looked fineCloser examination, however, shows an As line at 228.812 nm (Cd peak is at 228.802)This looks to be a clear spectral overlap problem

44
November 15, 2005 ICP Training
Uncovering an IEC problem
24 elements 0.5, 2 or 4 ppm)
Ca, Fe, Na: 200 ppm; Mg: 100ppm; Al, K:20 ppm
Cal. Blank - 296.5 [0.00] -105.8 [0.00]STD 1 48397.7 [0.50] ------------------STD 2 ------------------ 3962.6 [1.00]LOQ ppm 931.2 0.010 (106.9%) 121.4 0.031(102.1%)
CB 6.2 0.000 - 3.7 - 0.001
QCS 49184.7 0.508 (127.0%) 15927.2 4.019 100.5%)
INTRF - 480.6 -0.005 - 92.5 - 0.023
I-IPC 26452.6 0.273 (109.3%) 2022.4 0.510 102.0%)
DLRB 4.2 0.000 - 5.2 - 0.007DLFB 44170.2 2.282 (114.1%) 8535.1 10.77 107.7%)DQCS 12256.9 0.633 (126.6%) 4048.5 5.108 102.1%)
Cd 228.802 As 188.979LOD= 0.005 ppm NEW INTERFERENT
Sample Mean Corr.Intensity mg/L Recovery
Mean Corr.Intensity mg/L Recovery
November 15, 2005 ICP Training
Uncovering an IEC problem
2nd Source 47523.7 0.491 (98.2%) -2.7 -0.001 ------Single element standard, different from normal 2nd source
2 ppm As 6105.1 0.063 -------- 8088.3 2.041 (102.1%)This clearly indicated that additional IEC correction for As on Cd is requiredUpdated IEC table to reflect an IEC correction of -0.03087 ppm per 1 ppm As
Update IEC Table and use “Reprocess” feature toregenerate the entire run from beginning to end.
Cd 228.802 As 188.979Sample Mean Corr.
Intensity mg/L RecoveryMean Corr.
Intensity mg/L Recovery
Why wasn’t this need for an IEC identified earlier?IECs were run at 500 ppb for As because samples at or above this level are not typically encountered.At 500 ppb As, the apparent Cd is 0nly 0.0039 ppm, which is below the LOD of 0.005 ppm

45
November 15, 2005 ICP Training
…after “REPROCESS” feature
24 elements 0.5, 2 or 4 ppm)
Ca, Fe, Na: 200 ppm; Mg: 100ppm; Al, K:20 ppm0
Cd 228.802 As 188.979Sample Cal. Blank -296.5 [0.00] -105.8 [0.00]STD 1 48397.7 [0.50] ------------------STD 2 ------------------ 3962.6 [1.00]LOQ ppm 931.2 0.009 (96.3 %) 121.4 0.031(102.1%)
CB 6.2 0.000 -3.7 -0.001
QCS 49184.7 0.384 (96.0%) 15927.2 4.019 (100.5%)
INTRF -480.6 -0.004 - 92.5 -0.023
I-IPC 26452.6 0.258 (103.0%) 2022.4 0.510 (102.0%)
DLRB 4.2 0.000 -5.2 -0.007DLFB 44170.2 1.949 (97.5%) 8535.1 10.77 107.7%)DQCS 12256.9 0.475 (95.0%) 4048.5 5.108 102.1%)
Mean Corr.Intensity mg/L Recovery
Mean Corr.Intensity mg/L Recovery
November 15, 2005 ICP Training
After “REPROCESS” function
2nd Source 47523.7 0.491 (98.2%) -2.7 -0.001 ------Single element standard, different from normal 2nd source
2 ppm As 6105.1 0.000 -------- 8088.3 2.041 (102.1%)
Cd 228.802 As 188.979Sample Mean Corr.
Intensity mg/L RecoveryMean Corr.
Intensity mg/L Recovery

46
November 15, 2005 ICP Training
As on Cd: Serial Dilution Fails15ppb Cd result: 16.29
15ppb Cd + 4ppm As result :85.57
As
_____15ppb Cd + 4ppm As diluted 1:5 result: 17.72 X5 = 88.60
……15 ppb Cd UNDILUTED
November 15, 2005 ICP Training
As on Cd: Serial DilutionAnalyzed a 15 ppb single element Cd standard: 16.29 ppbMixed 15 ppb Cd with 4 ppm As standard: 85.57 ppb
Note: an IEC for As on Cd WAS in placeCorrection was -0.0096391 ppm Cd per 1 ppm As
Prepared & analyzed a 1:5 serial dilution of the 15 ppb Cd with 4 ppm As standard: 17.72 ppbtimes 5 x dilution = 88.60 ppbAgreement is within10%
From 6010C 9.6.2 Dilution testIf the analyte concentration is sufficiently high (minimally, a factor of 10 above themethod detection limit after dilution), an analysis of a 1:5 dilution should agree within ± 10%of the original determination. If not, then a chemical or physical interference effect should besuspected.
CAUTION: If spectral overlap is suspected, then the use of computerized compensation, analternate wavelength, or comparison with an alternate method is recommended.
This is why serial dilution may be misleading. It may work for flame and furnace AA, but it does not work when very near spectral overlap is involved.

47
November 15, 2005 ICP Training
As on Cd: Serial DilutionInstead of dilution, adjusting the IEC is best optionAnalysis of 4 ppm single element As standard: 70.02 ppb
70.02 ppb Cd / 4 ppm As= 0.01754 ppm Cd/ppm AsAlready had an IEC of 0.0096391 Cd per 1 ppm AsMust ADD the additional IEC0.0096391 + 0.01754 = 0.027185Change IEC for As on Cd to 0.027185
Prepared & analyzed a 1:5 serial dilution of the 15 ppb Cd with 4 ppm As standard: 3.61 ppbtimes 5 x dilution = 18.06 ppb
Agreement is within15%Note proximity of diluted sample to LOD (3 ppb)
November 15, 2005 ICP Training
Re-processing: Pros & Cons
Easy, a time-saver Allows flexibilityExcellent for dealing with unique sample issuesExcellent method development toolRaw data are unchanged
Makes auditors uneasyPractice can be abusedRequires a good deal of thought to decide WHAT to reprocessHow to document precisely what was done (and that nothing else changed in the process)
Pros Cons

48
November 15, 2005 ICP Training
Where reprocessing maybe appropriate
Method development IEC needs to be adjustedBackground correction point is
incorrectIf mis-entered calibration
standard concentrationAtypical samples (the “Wibby”)
November 15, 2005 ICP Training
Reprocessing ICP Data & EthicsNew generation ICP-OES digitally captures all dataModern software has the ability to alter test results by changing method parameters and by reprocessing the data.This can present an ethical conundrum if used carelessly or inappropriatelyStrict rules MUST be followed or … the auditors will be on you like a monkey on a cupcake!

49
November 15, 2005 ICP Training
Suggested Reprocessing GuidelinesOnly experienced personnel with a good understanding of instrumental analysis should be allowed to reprocess data.ALL DATA including the calibration and QC checks must be reprocessed.ALL adjustments must be clearly documented on the initial and the reprocessed printouts.The adjustments must be approved, initialed and dated by the analyst and supervisor or QA Officer.As a general rule, changes must make good data better not bad data acceptable.
November 15, 2005 ICP Training
50
November 15, 2005 ICP Training
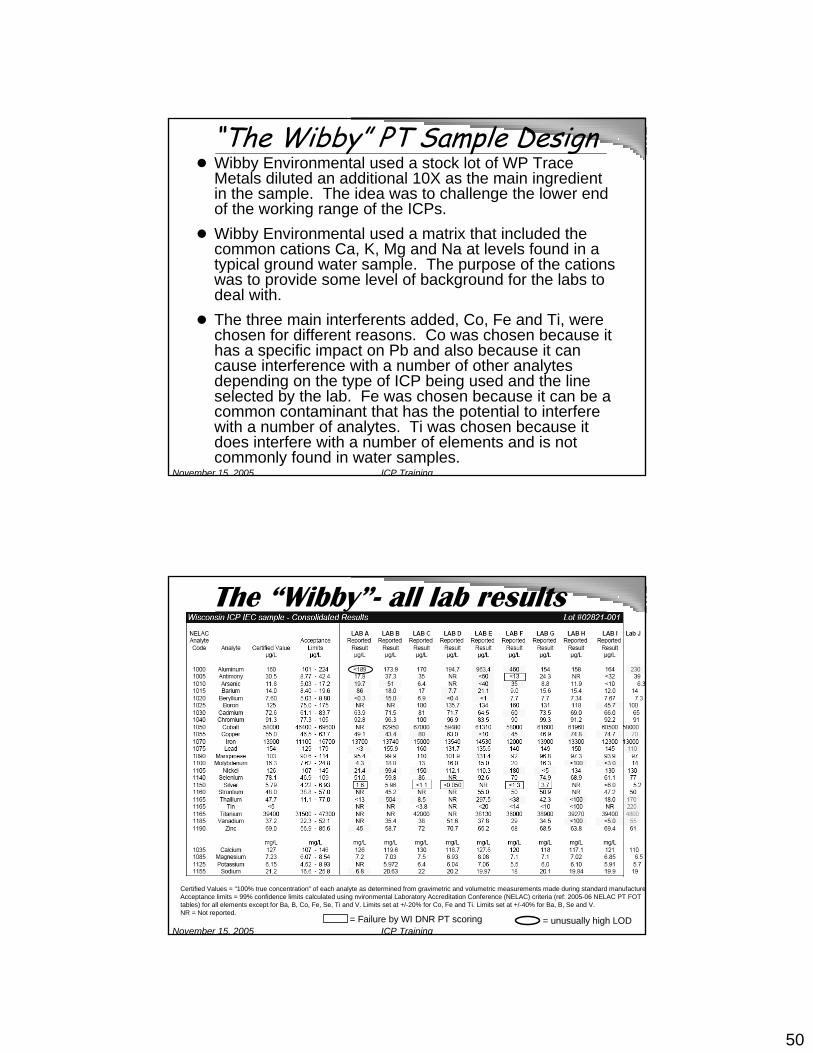
“The Wibby” PT Sample DesignWibby Environmental used a stock lot of WP Trace Metals diluted an additional 10X as the main ingredient in the sample. The idea was to challenge the lower end of the working range of the ICPs. Wibby Environmental used a matrix that included the common cations Ca, K, Mg and Na at levels found in a typical ground water sample. The purpose of the cations was to provide some level of background for the labs to deal with. The three main interferents added, Co, Fe and Ti, were chosen for different reasons. Co was chosen because it has a specific impact on Pb and also because it can cause interference with a number of other analytes depending on the type of ICP being used and the line selected by the lab. Fe was chosen because it can be a common contaminant that has the potential to interfere with a number of analytes. Ti was chosen because it does interfere with a number of elements and is not commonly found in water samples.
November 15, 2005 ICP Training
The “Wibby”- all lab results
Certified Values = "100% true concentration" of each analyte as determined from gravimetric and volumetric measurements made during standard manufactureAcceptance limits = 99% confidence limits calculated using nvironmental Laboratory Accreditation Conference (NELAC) criteria (ref: 2005-06 NELAC PT FOTtables) for all elements except for Ba, B, Co, Fe, Se, Ti and V. Limits set at +/-20% for Co, Fe and Ti. Limits set at +/-40% for Ba, B, Se and V.NR = Not reported.
= Failure by WI DNR PT scoring = unusually high LOD

51
November 15, 2005 ICP Training
How SLH Handled “the Wibby”Analyzed sample for regular 24* elements using IECs based on water levels (20ppm Fe,K, 100ppm Mg, 200ppm Ca,Na).
Gallium internal standard failed high. ~160% axial, ~240% radial.
Noticed cobalt at ~60ppm.Calibrated for Gallium, but found no gallium in sampleCerium and titanium peak near gallium line. Created new method to include cerium, tin, strontium, and titanium (not in regular method) and used Yttrium only as internal standard. Added Indium as possible internal standard.Calibrated new method
* Don’t normally analyze Sr, Sn, Ti
November 15, 2005 ICP Training
How SLH Handled “the Wibby”Using EXAMINE tool in software; optimized peaks and background pointsAnalyzed single element standards at the calibration level to calculate IECs.Reprocessed above run with new IECs. Analyzed Wibby sample, plus duplicate and spiked sample16 of the 27 elements worked at this point (controls, blanks, and QC all acceptable)The remaining 11 elements required further investigation. Many had interferences from Cobalt (~60ppm) and Titanium (~40ppm)
* Don’t normally analyze Sr, Sn, Ti

52
November 15, 2005 ICP Training
How SLH Handled “the Wibby”EXAMINED sample spectra and single element standards (used for IECs),
readjusted some background points and added multiple lines for Sb,As,Be,B,Cd,Cu,Pb,Ni,Se,Ag,Tl,Sn, and Sr. Re-determined IECs using new background points and new wavelengths.
Ran interferences at the levels seen in the sample (Co=60ppm, Ti=40ppm, Fe=15ppm, Ca=120ppm). ..since these appeared to be the main interferents.Calculated new IECs and ran calibration, controls, sample, duplicate, and spike. Diluted 100x for Co and Ti.
All elements passed except: B, Cu, Ni, Se, Ag, Tl, Sn
November 15, 2005 ICP Training
How SLH Handled “the Wibby”Decided to use MSF on remaining elements. Created MSF file and reprocessed data.All acceptable except for: Ni, and Sn.
Ni was ~ - 15ppb on all wavelengths, Sn was ~100ppb on 1st wavelength, ; ~1ppb on alternate
Prepared & analyzed a sample with 100ppb Sn plus interferences (Co=60ppm, Ti=40ppm, Fe=15ppm, Ca=120ppm).
Chose result from routine wavelength (189.927) 96%Alt.wavelength= -31% recovery. Concluded: No Sn in sample <LOD=10ppb
Prepared & analyzed samples with 10ppb and 20ppb Ni plus interferences as above.
Concluded Ni not present in sample = < 5ppb Recoveries ~92% to 96 on two lines
53
November 15, 2005 ICP Training
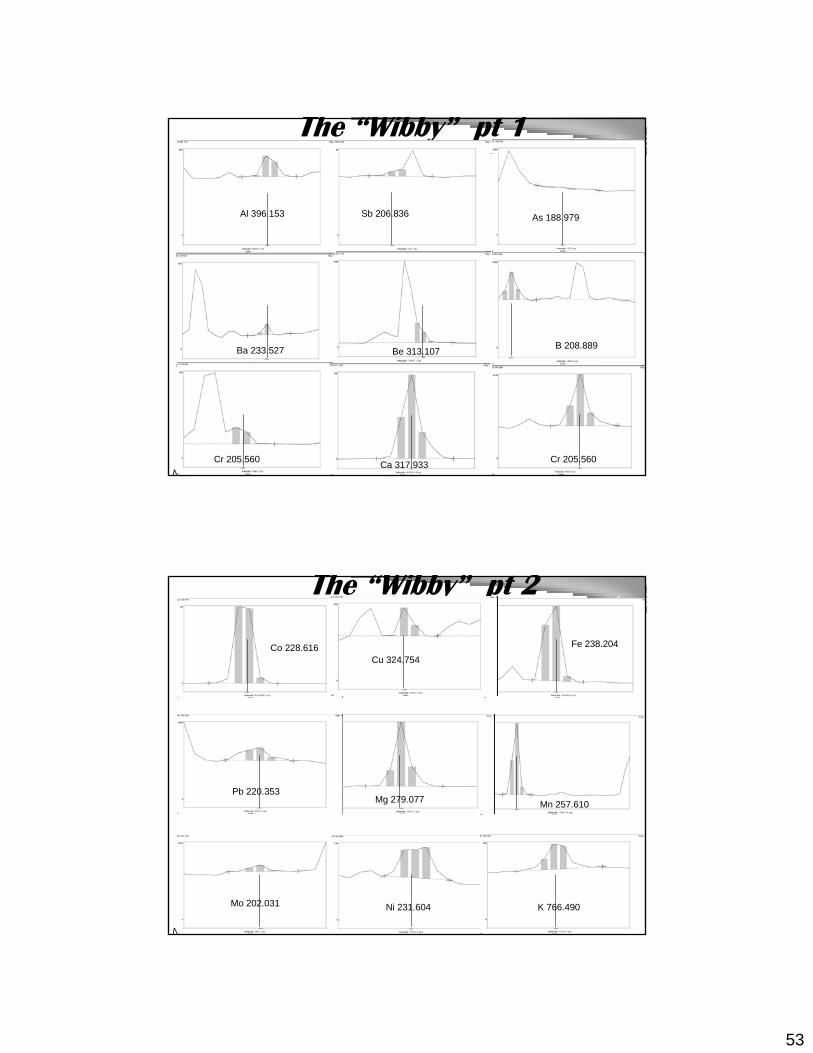
The “Wibby” pt 1
Sb 206.836
Ba 233.527
Cr 205.560
Be 313.107
As 188.979
B 208.889
Ca 317.933 Cr 205.560
Al 396.153
November 15, 2005 ICP Training
The “Wibby” pt 2
Co 228.616 Fe 238.204
Mn 257.610Mg 279.077Pb 220.353
Mo 202.031 Ni 231.604 K 766.490
Cu 324.754

54
November 15, 2005 ICP Training
The “Wibby” pt 3
Sn 189.927
TL 190.801
V 292.402
Ti 336.121
Sr 407.771
Zn 206.200
Na 589.592Ag 328.068
Se 203.985
November 15, 2005 ICP Training
The “Wibby”: Gallium (IS) Glitch
Calibration blank (yellow) vs. Wibby sample (blue/dotted) shows increased Gallium (internal standard) intensity.
Ti 417.190 Ga 417.206
The “Wibby”
417.087 417.284
417.206
The lab observed high bias in the recovery of Gallium, a secondary
internal standard.

55
November 15, 2005 ICP Training
The thick (red )line = the sampleThe dotted (white) line = 15ppm FeThe small (yellow) peak = 2ppm Sn
Strong Fe interference; direct overlap
Wibby sample – Tin TroubleSn 235.485
Different wavelength doesn’t help
Thick (red) line = sampleBlue line = 40ppm TiRed (dash) line is 2ppm Sn
MSF yields 1.6ppb 100 ppb spike = 96% recovery
Convinces that Sn is not present
Sn 189.927
November 15, 2005 ICP Training
Four different wavelengths for Ni (cursor shows expected Ni peak)Each shows the sample + 60ppm Cobalt superimposed. SLH base IEC for Cobalt on Nickel yielded negative results (~ - 20 to – 30ppb). MSF also yielded negative results (~ - 25 to - 30ppb). Yet a 10ppb Ni spike= 92%
Cobalt at the level it was in the sample interfered with Nickel at multiple wavelengths
The “Wibby” - Nickel Nightmare
Ni 341.476 Ni 232.003
Ni 221.648Ni 227.022
_ _ _ Ni___ Co
56
November 15, 2005 ICP Training
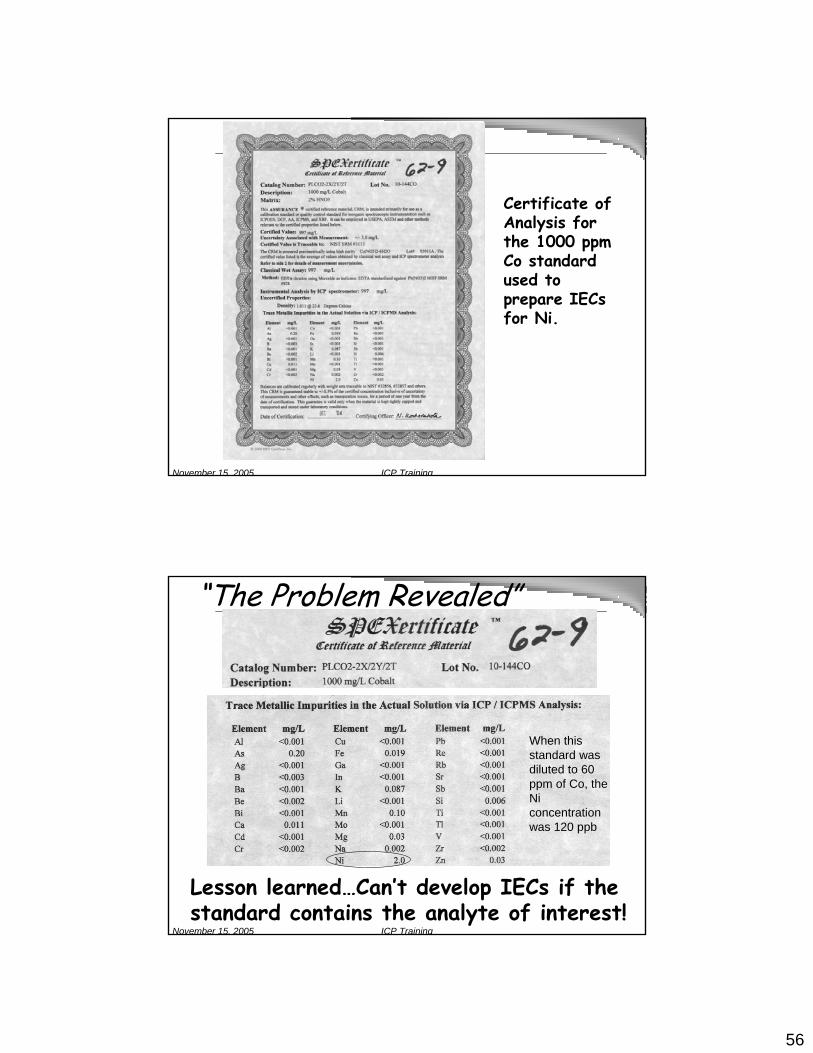
Certificate of Analysis for the 1000 ppmCo standard used to prepare IECs for Ni.
November 15, 2005 ICP Training
“The Problem Revealed”
Lesson learned…Can’t develop IECs if the standard contains the analyte of interest!
When this standard was diluted to 60 ppm of Co, the Ni concentration was 120 ppb

57
November 15, 2005 ICP Training
The Nickel solutionUsing a pure Co standard, new IECs were developed and “the Wibby” (true value= 126 (107-145)), was re-analyzedNi 231.604 – 122.0 ppbNi 221.648 – 121.7 ppbNi 232.003 – 119.6 ppbNi 227.022 – 124.0 ppb
November 15, 2005 ICP Training
WSLH Emission Tracking Experience
Noticed sensitivity deteriorating“Backtracked” and plotted emissions over several monthsFound UV lines dropped the mostSample introduction as injector problems ruled out.Service revealed optics coated –technician cleaned them.

58
November 15, 2005 ICP Training
Emissions Tracking for Arsenic: 250 ppb at 188.979 ηm
0200400600800
10001200
3/19/2
005
3/29/2
005
4/8/200
5
4/18/2
005
4/28/2
005
5/8/200
5
5/18/2
005
5/28/2
005
6/7/200
5
6/17/2
005
6/27/2
005
7/7/200
5
Date
Emission
, CP
SOptics cleaned by service tech
November 15, 2005 ICP Training
Emissions Tracking for Selenium: 1000 ppb at 196.025 ηm
0500
100015002000250030003500
3/19/2
005
3/29/2
005
4/8/200
5
4/18/2
005
4/28/2
005
5/8/200
5
5/18/2
005
5/28/2
005
6/7/200
5
6/17/2
005
6/27/2
005
7/7/200
5
Date
Emission
s, C
PS
Optics cleaned by service tech

59
November 15, 2005 ICP Training
WSLH Emission Tracking ExperienceProblem returnedInstrument replaced, Problem returned-againProblem: Leak in gas line
Leaks allow impurities to enter gas stream and coat optics
Final Corrective Action: Fix leakAdd in-line gas filter & dessicantClean optics
November 15, 2005 ICP Training
AcknowledgementWe wish to thank the following laboratories for participating in the PT Study and contributing to the data troubleshooting section:
• Commercial Testing Laboratory• Davy Laboratories• Green Bay Metropolitan Sewage District• Kohler Co.• Madison Department of Health Laboratory• Northern Lake Services, Inc.• Pace Analytical Services, Inc., Green Bay• S-F Analytical Laboratories, Inc.• TestAmerica, Inc., Watertown• U.S. Filter-Enviroscan

60
November 15, 2005 ICP Training
Many Thanks….WI Department of Natural Resources,(DNR) Lab Certification Program for sponsoring this training through funding
Wisconsin Environmental Laboratory Association (WELA) for sponsoring this training through funding
Chuck Wibby & Wibby Environmentalfor preparing and scoring the challenging PT sample used for discussion and illustration of interferences