ICICI Prudential Value Fund - Series 11 - Advisorkhoj · PDF fileglobal markets Last 2 year...
18
ICICI Prudential Value Fund - Series 11 NFO Period – 10 th Jan 2017 – 24 th Jan 2017 Benchmark – S&P BSE 500 Index 1 Only for Distributors & Advisors of ICICI Prudential Mutual Funds
-
Upload
nguyenquynh -
Category
Documents
-
view
217 -
download
2
Transcript of ICICI Prudential Value Fund - Series 11 - Advisorkhoj · PDF fileglobal markets Last 2 year...

ICICI Prudential Value Fund - Series 11
NFO Period – 10th
Jan 2017 – 24th
Jan 2017
Benchmark – S&P BSE 500 Index
1Only for Distributors & Advisors of ICICI Prudential Mutual Funds
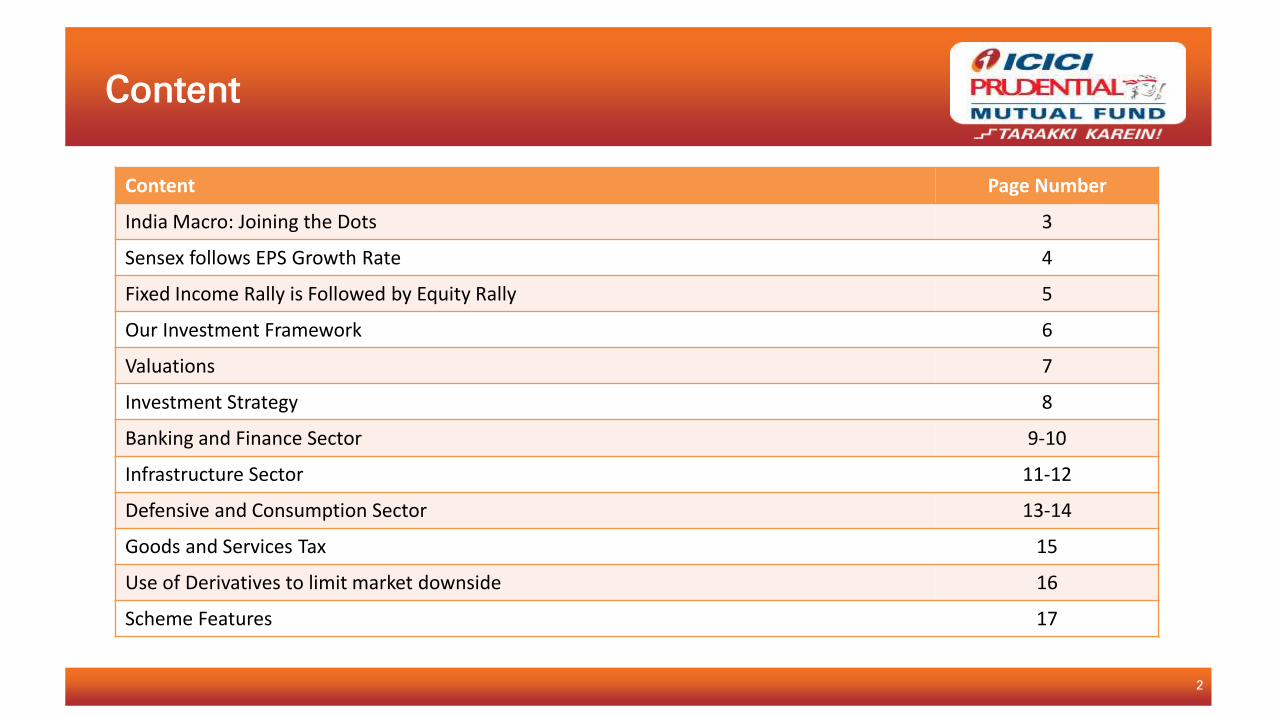
Content
Content Page Number
India Macro: Joining the Dots 3
Sensex follows EPS Growth Rate 4
Fixed Income Rally is Followed by Equity Rally 5
Our Investment Framework 6
Valuations 7
Investment Strategy 8
Banking and Finance Sector 9-10
Infrastructure Sector 11-12
Defensive and Consumption Sector 13-14
Goods and Services Tax 15
Use of Derivatives to limit market downside 16
Scheme Features 17
2

Government
Reforms
Rate Cuts
Improved Fiscal and
Current Account Balance
Demonetisation
Indian Macro has strengthen structurally over last 3 years. Most indicators have improved and few are
gradually improving. Together these macro factors may take the trend growth to higher levels in coming years.
India Macro: Joining the Dots
3

Sensex follows EPS Growth Rate
-80.00%
-60.00%
-40.00%
-20.00%
0.00%
20.00%
40.00%
60.00%
80.00%
100.00%
Dec-0
7
Ap
r-08
Au
g-08
Dec-0
8
Ap
r-09
Au
g-09
Dec-0
9
Ap
r-10
Au
g-10
Dec-1
0
Ap
r-11
Au
g-11
Dec-1
1
Ap
r-12
Au
g-12
Dec-1
2
Ap
r-13
Au
g-13
Dec-1
3
Ap
r-14
Au
g-14
Dec-1
4
Ap
r-15
Au
g-15
Dec-1
5
Ap
r-16
Au
g-16
Dec-1
6
EPS vs. Sensex Returns
Trailing 12 month EPS Growth Trailing 12 month Sensex Returns
Source: Bloomberg, EPS: Earning per share, Returns as on 28-12-2016 | Past performance may or may not be sustained in future4
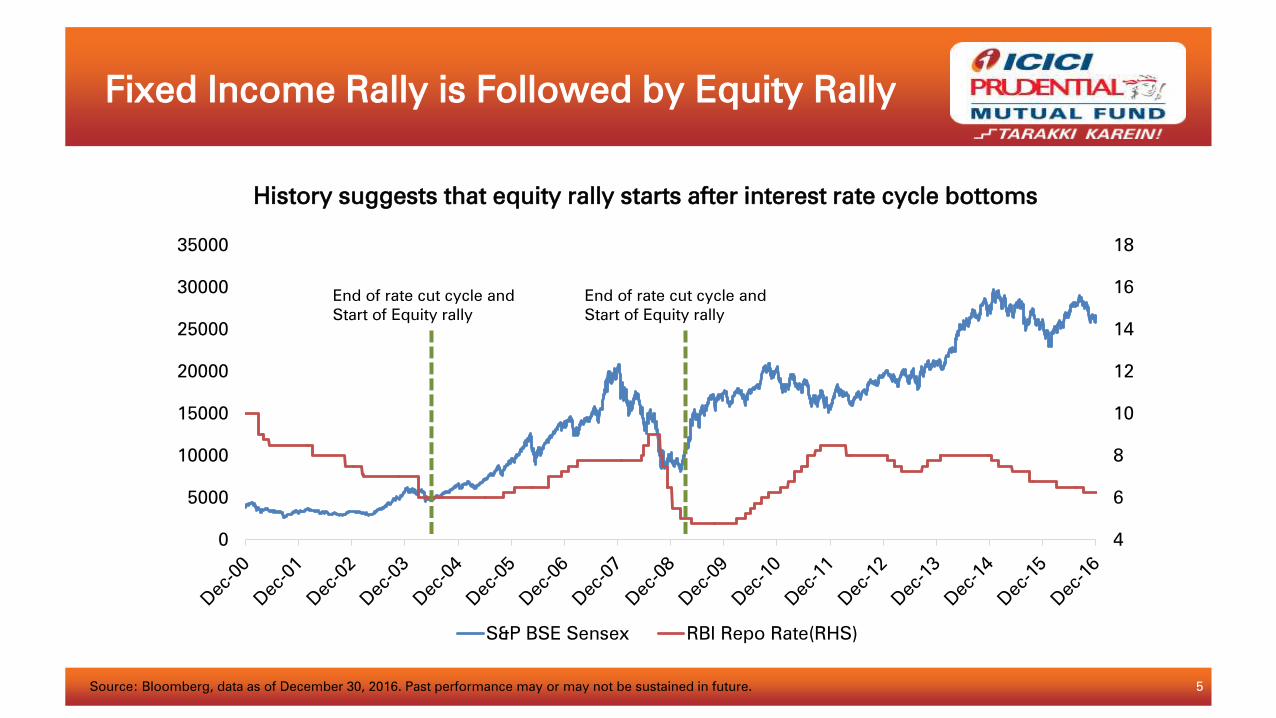
Fixed Income Rally is Followed by Equity Rally
4
6
8
10
12
14
16
18
0
5000
10000
15000
20000
25000
30000
35000
S&P BSE Sensex RBI Repo Rate(RHS)
End of rate cut cycle and
Start of Equity rally
End of rate cut cycle and
Start of Equity rally
History suggests that equity rally starts after interest rate cycle bottoms
Source: Bloomberg, data as of December 30, 2016. Past performance may or may not be sustained in future. 5
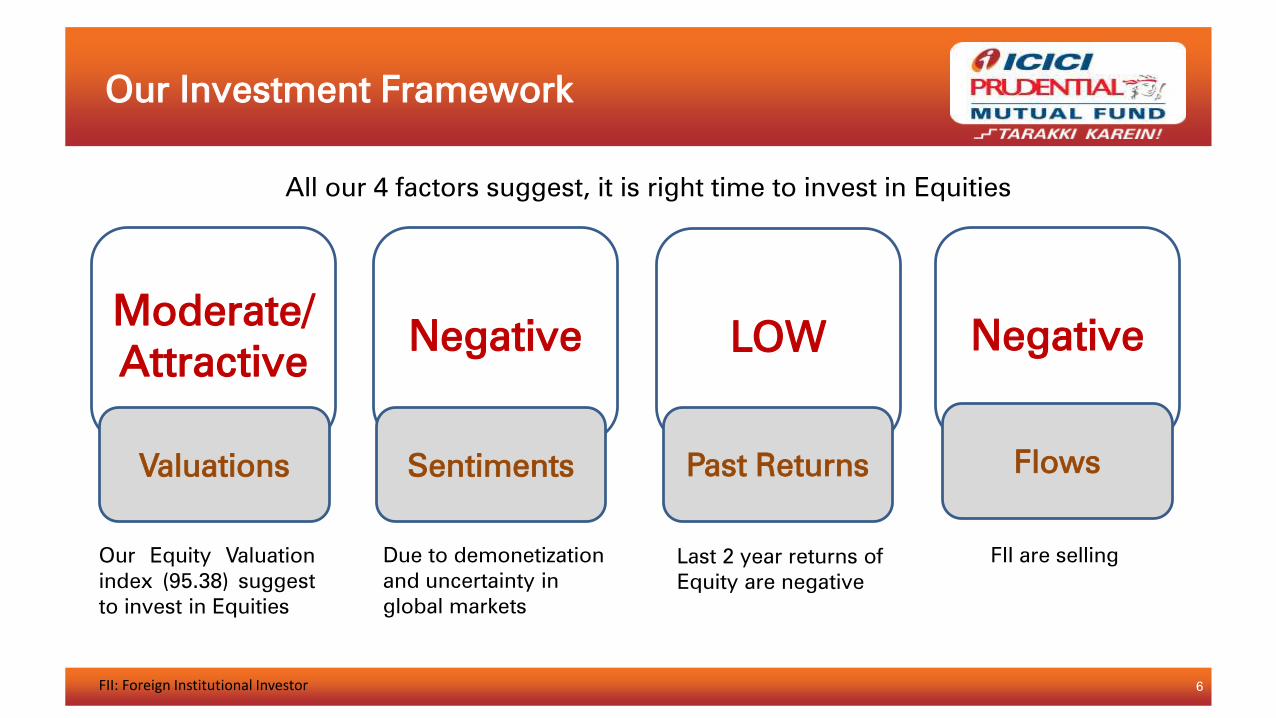
Our Investment Framework
Moderate/
AttractiveNegative LOW Negative
All our 4 factors suggest, it is right time to invest in Equities
Our Equity Valuation
index (95.38) suggest
to invest in Equities
Due to demonetization
and uncertainty in
global markets
Last 2 year returns of
Equity are negative
FII are selling
Valuations FlowsPast ReturnsSentiments
FII: Foreign Institutional Investor 6
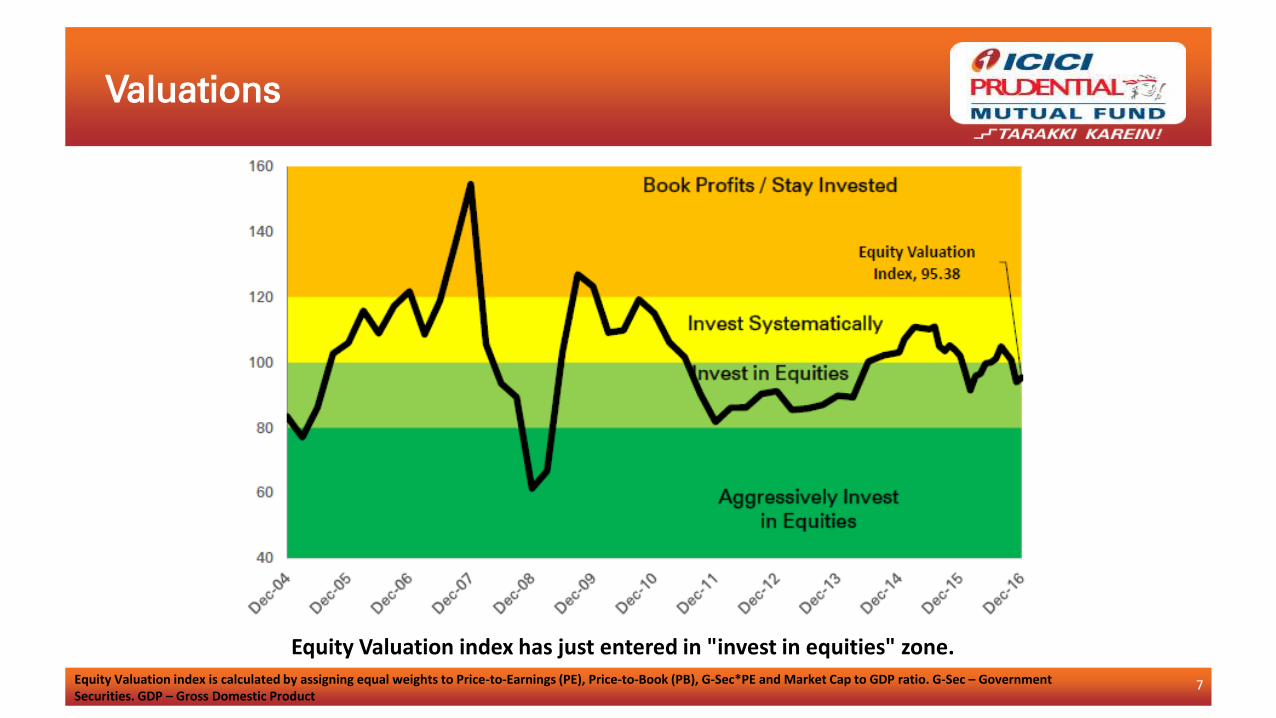
Valuations
Equity Valuation index has just entered in "invest in equities" zone.Equity Valuation index is calculated by assigning equal weights to Price-to-Earnings (PE), Price-to-Book (PB), G-Sec*PE and Market Cap to GDP ratio. G-Sec – Government Securities. GDP – Gross Domestic Product
7

Investment Strategy
• Flexicap fund.
• Bottom-up approach
• Fund intends to invest in 20-25* stocks given at particular point in
time.
• Sectors Themes
– Banks, NBFC and Infrastructure
– Defensive and Consumption Sectors
– Others (GST play like FMCG)
• As a part of investment strategy the scheme may buy put options
either for the entire/partial portfolio depending on the discretion of
the fund managers and subject to market conditions
NBFC: Non Banking Financial Company, GST : Goods and Services Tax, FMCG: Fast Moving Consumer Goods
* The No. of Stocks provided is to explain the investment philosophy and the actual No. may go up and down depending on than prevailing market conditions at the time of investment. The fund may invest up to 25 stocks depending on the discretion of the Fund Managers. The stock selection and investment strategy will be as per the Scheme Information Document
8

Banking and Finance Sector
Private Banks Increasing Penetration in Rural & Semi-Urban Markets
3.5 6
6.8
7.6
6.2
3.7
6.5 8
.8
11
.7
8.2
3.3
8.1
14
21
.8
13
.4
4.6
12
.1
19
.1
27
.1
17
.4
5.9
14
.3
22
.1
28
.5
19
.4
0
5
10
15
20
25
30
Rural Semi-Urban Urban Metropolitan India
Current & Savings Account Growth Rate (%)
2000 2004 2007 2012 2015
Source : CLSA 9

Economic and Demographic
•Increase in working population and
growing disposable incomes can
raise demand for banking and
related services
•Favorable demographics and rising
income levels also this can be
benefitted by developments in
revenue mix models of the banks
•Strong GDP growth to facilitate
banking sector expansion
Policy Support
•Wide policy support in the form of
private sector participation and
liquidity support.
•Government's schemes like Pradhan
Mantri Jan Dhan Yojna can increase
the accessibility of financial services
.
•RBI has emphasised the need to
focus on spreading the reach of
banking services to the un-banked
population of India hence focus in
banks is to expand branch network
in the rural areas in line with Pradhan
Mantri Jan Dhan Yojna
Technology Innovation
•This not only help to reach out to
masses in cost effective way and
hence scale rapidly.
•Use of alternate channels like ATM,
internet and mobile hold significant
potential in India
•Launch of new technologies and
internet platforms like BHIM app
Banking and Finance Sector
GDP: Gross Domestic Product, RBI : Reserve Bank of India. 10

Why Infrastructure Sector?
Stable
Government &
Policy Initiatives
Goods and Services Tax &
Demonetisation
Higher
Government
Revenue
Increase in tax
revenue under
IDS
Higher government
expenditure on
infrastructure projects
Lower Current Account
Deficit & Inflation
Strong
Macroeconomic Base
100 Smart Cities10,000 Km of
New Roads
UDAY Scheme
For financial revival
of Power distribution
companies
Digital India
Funding
Sources : CLSA | UDAY: Ujwal DISCOM Assurance Yojana | IDS: Income Disclosure Scheme 11

Infrastructure Sector
POWER: Government’s focus on lowering debts of power distribution companies and infrastructure expansion in
rural and urban areas.
MINERALS / MINING: Could grow in tandem with expected increase in demand for power, operational
efficiency, and attractive valuations.
TELECOM: India’s demographic advantage, rapid growth in data consumption, and government initiatives
such as Digital India.
CONSTRUCTION & CONSTRUCTION PROJECTS: Government’s focus on infrastructure expansion in
rural and urban areas. They could also leverage on excess capacity.
TRANSPORTATION: Could benefit from the implementation of Goods and Services Tax (GST), operational
efficiency, and attractive valuations.
12

Defensive and Consumption Sector
Pharma and Healthcare Sector
– India is one of the few markets worldwide which is growing at double digits.
– Most pharma companies are spending a lot on research and development which will play
out in next few years
– Indian companies have 25% volume share in USA. In all the drug filings for US market
incrementally Indian players are getting maximum share and already Indian companies
have shown tremendous growth in USA in last 7-8 years.
– Tremendous growth opportunity in Indian hospitals growth with favourable
demographics in India(Rising income, rising insurance penetration, increasing occurrence
of ailments like diabetes, cancer, cardio issues)
– Long term outlook for Indian healthcare sector remains structurally positive, considering
abundant growth opportunities, strong balance sheets, and better return ratios and free
cash flow generation in pharma companies and reasonable valuations.
Source : CLSA 13

Defensive and Consumption Sector
Auto Ancillaries
– India is expected to become the next auto ancillary hub in Asia by 2020.
– Currently pegged at $38 billion, this industry is estimated to post a CAGR of 17% to
$115 billion by FY21.
– Demand for auto ancillary sector is derived from Original Equipment Manufacturers
(OEM) as well as the replacement market.
– Margins in the replacement market are higher than the OEM market. As the number
of vehicles over the last decade has increased, the demand for replacement market
has also grown, bringing benefit from high margin.
Source : Motilal Oswal | CAGR: Compounding Annual Growth Rate 14
Goods and Services Tax
• Subject to passage of Goods and Services Tax (GST) in both houses; GST is
proposed to be a comprehensive indirect tax levy on manufacture, sale and
consumption of goods as well as services at the national level.
• The implementation is likely to promote more exports, create more employment
opportunities and boost growth. It will divide the burden of tax between
manufacturing and services.
• The sectors is likely to benefit from the Implementation of GST would be majorly
Consumer Cyclicals.
15
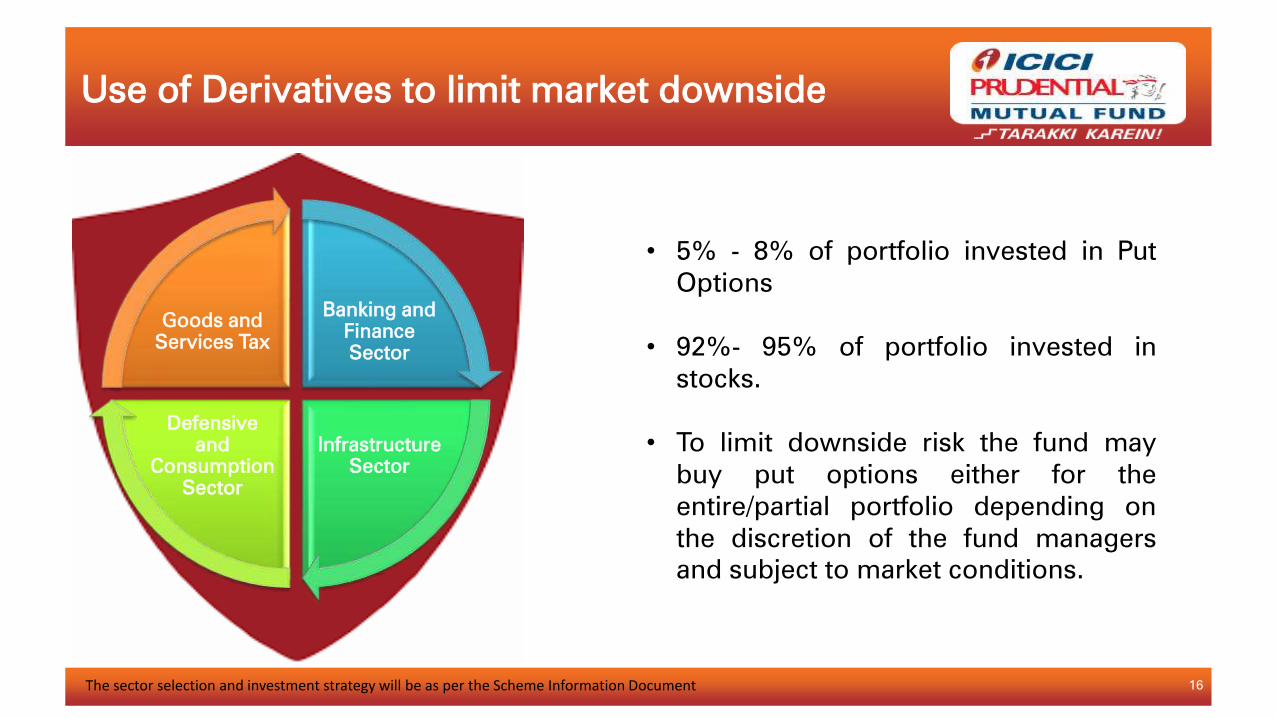
• 5% - 8% of portfolio invested in Put
Options
• 92%- 95% of portfolio invested in
stocks.
• To limit downside risk the fund may
buy put options either for the
entire/partial portfolio depending on
the discretion of the fund managers
and subject to market conditions.
Banking and
Finance
Sector
Infrastructure
Sector
Defensive
and
Consumption
Sector
Goods and
Services Tax
Use of Derivatives to limit market downside
The sector selection and investment strategy will be as per the Scheme Information Document 16

Tenure : 1100 days
NFO Period : 10th January 2017 to 24th January 2017
MICR cheques : Till end of business day on 20th January 2017
RTGS and transfer cheques : Till end of business day on 24th January 2017
Switches :
Switch-in requests from equity schemes will be accepted up to January 20, 2017, till
the cutoff time applicable for switches. Switch-in requests from non-equity schemes
will be accepted up to January 24, 2017, till the cutoff time applicable for switches
Option to be launched :
ICICI Prudential Value Fund - Series 11 - Growth & Dividend
ICICI Prudential Value Fund - Series 11 Direct Plan - Growth & Dividend payout
Entry / Exit Load : Nil
Minimum Application Amount : Rs.5,000/- (plus in multiple of Re.10)
Liquidity : To be listed
Benchmark : S&P BSE 500 Index
Fund Manager : Manish Gunwani & Rajat Chandak
Scheme Features
*Mr. Ihab Dalwai for investment in ADR/GDR/ Foreign securities 17

Statutory Details & Risk Factors
Mutual Fund investments are subject to market risks, read all scheme related documents carefully.
Disclaimer: All figures and data given in the document are dated unless stated otherwise. In the preparation of the material contained in this
document, the AMC has used information that is publicly available, including information developed in-house. Some of the material used in the
document may have been obtained from members/persons other than the AMC and/or its affiliates and which may have been made available to the
AMC and/or to its affiliates. Information gathered and material used in this document is believed to be from reliable sources. The AMC however
does not warrant the accuracy, reasonableness and / or completeness of any information. We have included statements / opinions /
recommendations in this document, which contain words, or phrases such as “will”, “expect”, “should”, “believe” and similar expressions or
variations of such expressions, that are “forward looking statements”. Actual results may differ materially from those suggested by the forward
looking statements due to risk or uncertainties associated with our expectations with respect to, but not limited to, exposure to market risks,
general economic and political conditions in India and other countries globally, which have an impact on our services and / or investments, the
monetary and interest policies of India, inflation, deflation, unanticipated turbulence in interest rates, foreign exchange rates, equity prices or other
rates or prices etc.
The AMC (including its affiliates), the Mutual Fund, the trust and any of its officers, directors, personnel and employees, shall not liable for any loss,
damage of any nature, including but not limited to direct, indirect, punitive, special, exemplary, consequential, as also any loss of profit in any way
arising from the use of this material in any manner. The recipient alone shall be fully responsible/are liable for any decision taken on this material.
The sector(s)/stock(s) mentioned in this presentation do not constitute any recommendation of the same and ICICI Prudential Mutual Fund may or
may not have any future position in these sector(s)/stock(s). Past performance may or may not be sustained in the future. The portfolio of the
scheme is subject to changes within the provisions of the Scheme Information document of the scheme. Please refer to the SID for investment
pattern, strategy and risk factors.
Investors are advised to consult their own legal, tax and financial advisors to determine possible tax, legal and other financial implication or
consequence of subscribing to the units of ICICI Prudential Mutual Fund.
18