ICICI Group: Strategy & Performance
64
ICICI Group: Strategy & Performance
Transcript of ICICI Group: Strategy & Performance
ICICI Group: Strategy &
Performance

Agenda
India: macroeconomic scenario
Indian banking sector
ICICI Group
2
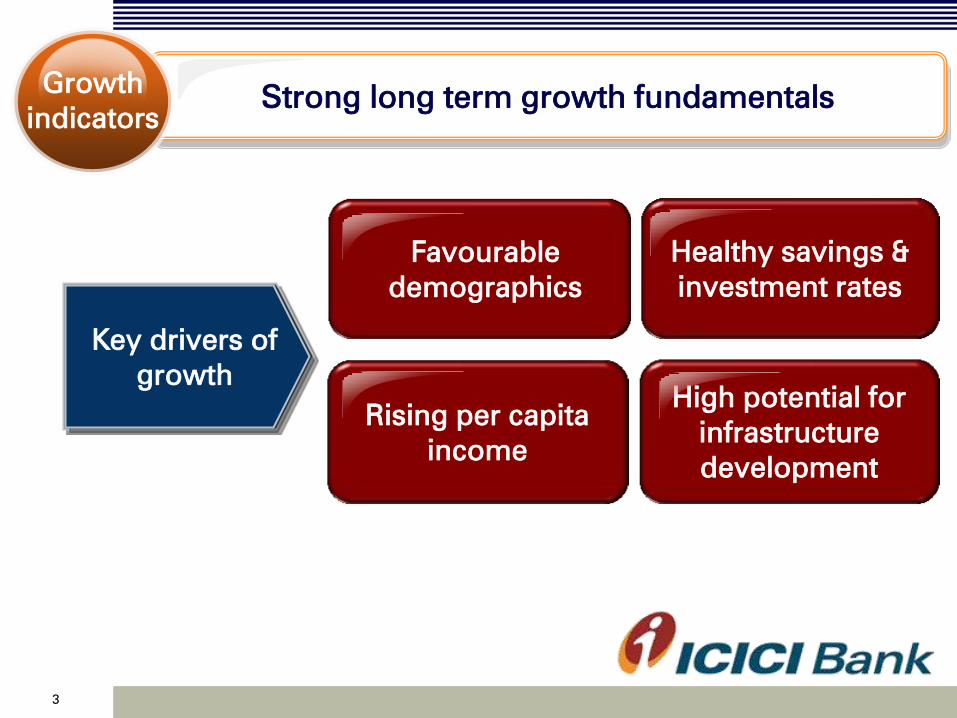
Favourable
demographics
Healthy savings &
investment rates
Rising per capita
income
High potential for
infrastructure
development
Strong long term growth fundamentals Growth
indicators
Key drivers of
growth
3
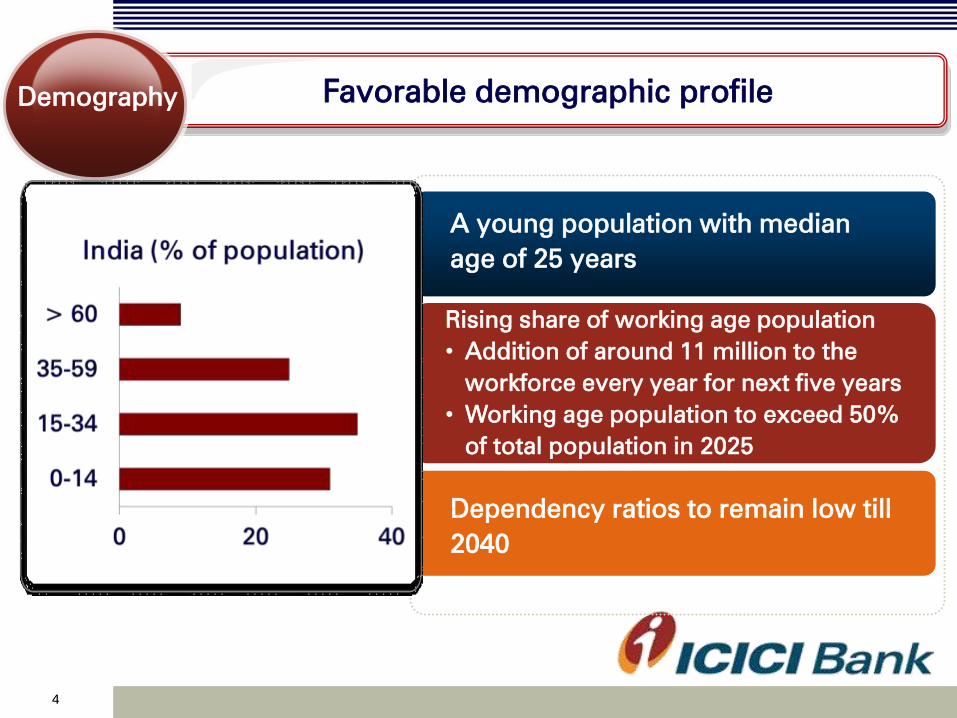
Favorable demographic profile Capital Demography
Rising share of working age population
• Addition of around 11 million to the
workforce every year for next five years
• Working age population to exceed 50%
of total population in 2025
A young population with median
age of 25 years
Dependency ratios to remain low till
2040
840
1,053
1,432 1,501
840
1,053
1,432 1,501
4
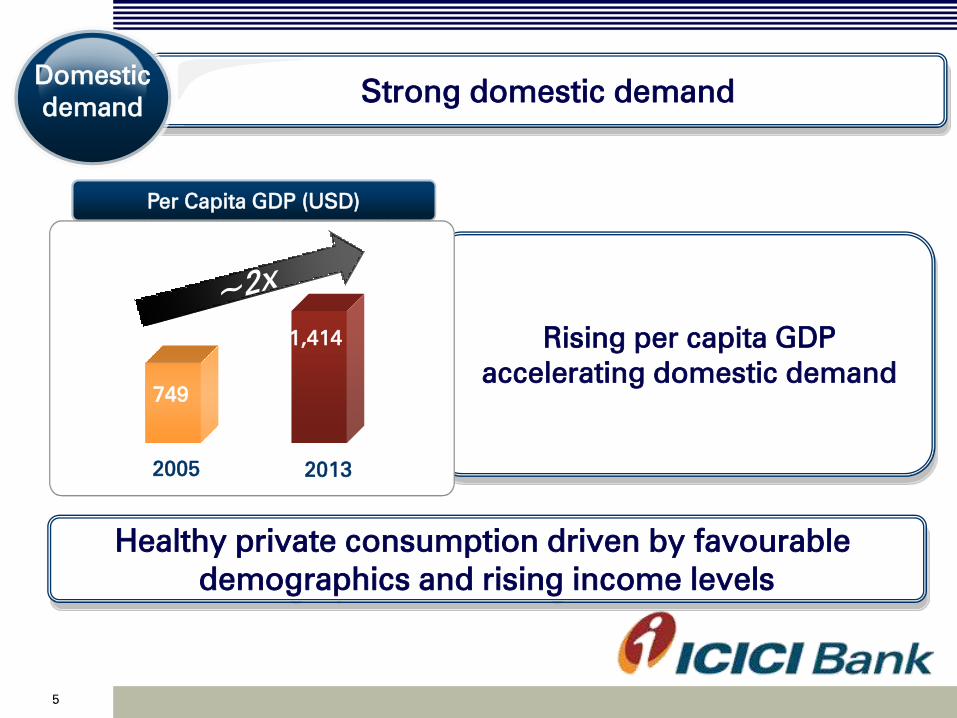
Strong domestic demand
Per Capita GDP (USD)
Domestic
demand
Healthy private consumption driven by favourable
demographics and rising income levels
Rising per capita GDP
accelerating domestic demand
840
1,053
1,432 1,501
2005 2013
7
749
1,414
5
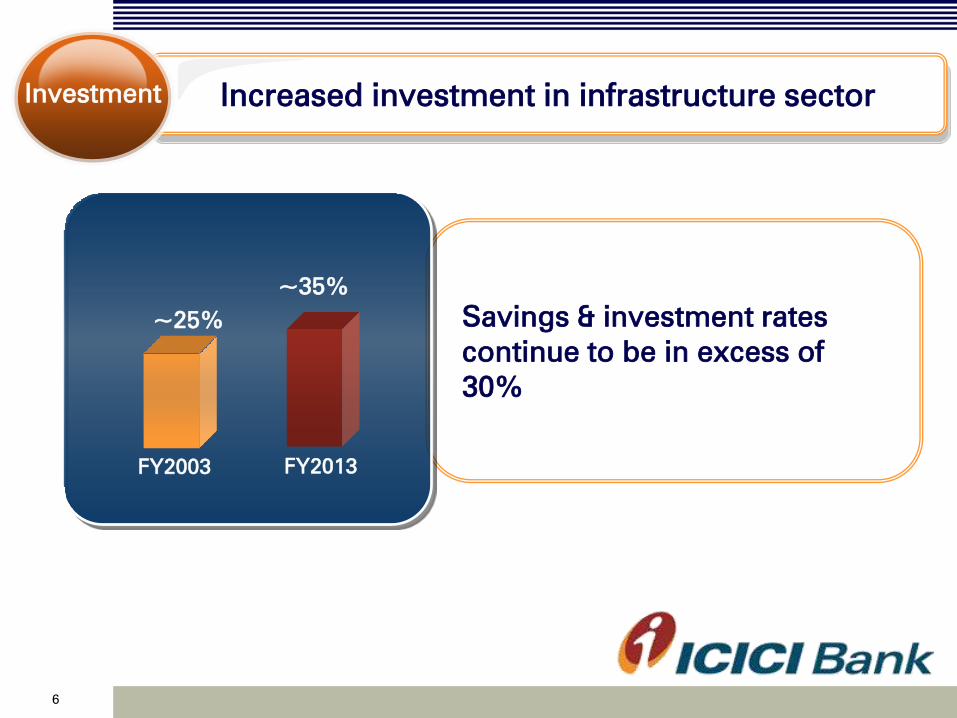
Savings & investment rates
continue to be in excess of
30%
Increased investment in infrastructure sector Investment
FY2003 FY2013
6
~25%
~35%

Structurally high growth potential Growth
trends
Domestic driven growth model
Source: CSO
1970s 1980s 1990s 2000s 2010-2013
3.9%
5.6% 5.8%
7.2%
6.7%
GDP growth %
7

• Moderation in GDP growth to less than 5%; industrial
growth subdued
• Slowdown in investments and savings
• Inflationary pressures resulting in tight monetary
policy
• Substantial reduction in trade deficit and current
account deficit in current year
• Government has indicated commitment towards
reduction of fiscal deficit
• Policy measures announced by government
• Strong growth in agriculture sector
• GDP growth improved from 4.4% in Q1-2014 to 4.7%
in Q3-2014
Recent developments
Key concerns
Macro
environment
Positive trends
8
Agenda
India: macroeconomic scenario
Indian banking sector
ICICI Group
9
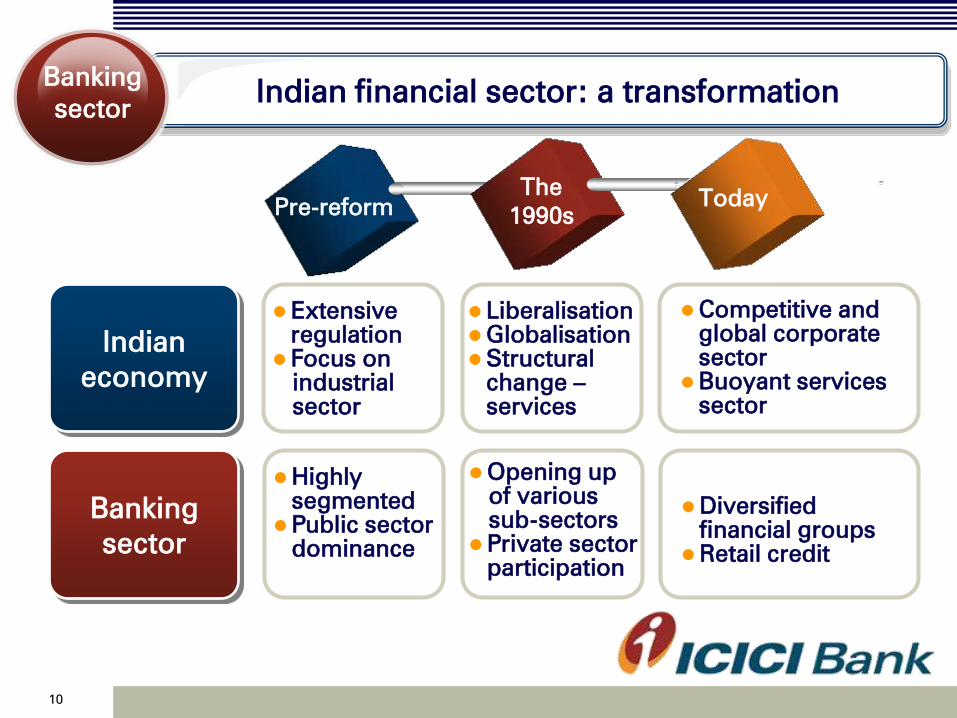
Indian financial sector: a transformation
Pre-reform
The
1990s
Today
Extensive
regulation
Focus on
industrial
sector
Liberalisation
Globalisation
Structural
change –
services
Competitive and
global corporate
sector
Buoyant services
sector
Indian
economy
Banking
sector
Highly
segmented
Public sector
dominance
Opening up
of various
sub-sectors
Private sector
participation
Diversified
financial groups
Retail credit
Banking
sector
10
Granular
income
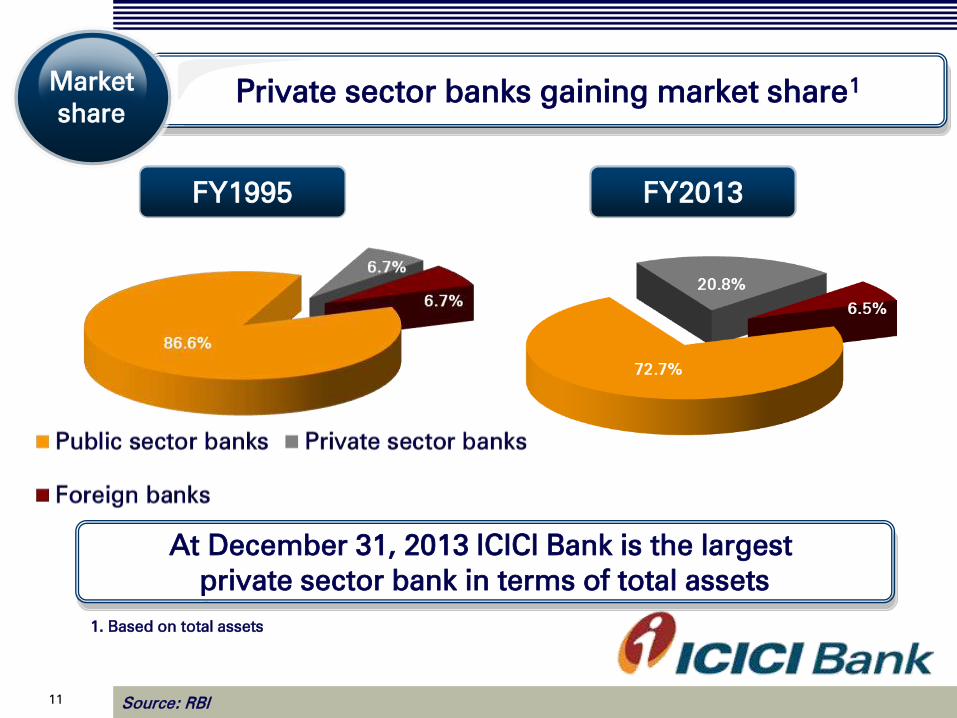
Private sector banks gaining market share1 Market
share
FY1995 FY2013
At December 31, 2013 ICICI Bank is the largest
private sector bank in terms of total assets
Source: RBI
1. Based on total assets
11
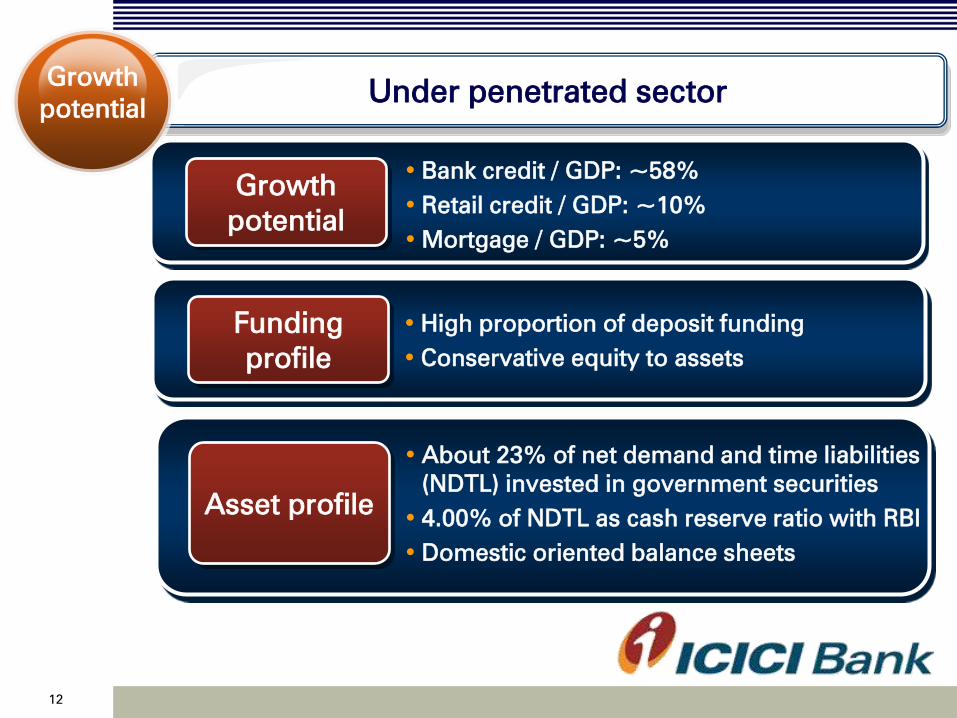
Under penetrated sector Growth
potential
• Bank credit / GDP: ~58%
• Retail credit / GDP: ~10%
• Mortgage / GDP: ~5%
Growth
potential
• High proportion of deposit funding
• Conservative equity to assets
Funding
profile
• About 23% of net demand and time liabilities
(NDTL) invested in government securities
• 4.00% of NDTL as cash reserve ratio with RBI
• Domestic oriented balance sheets
Asset profile
12
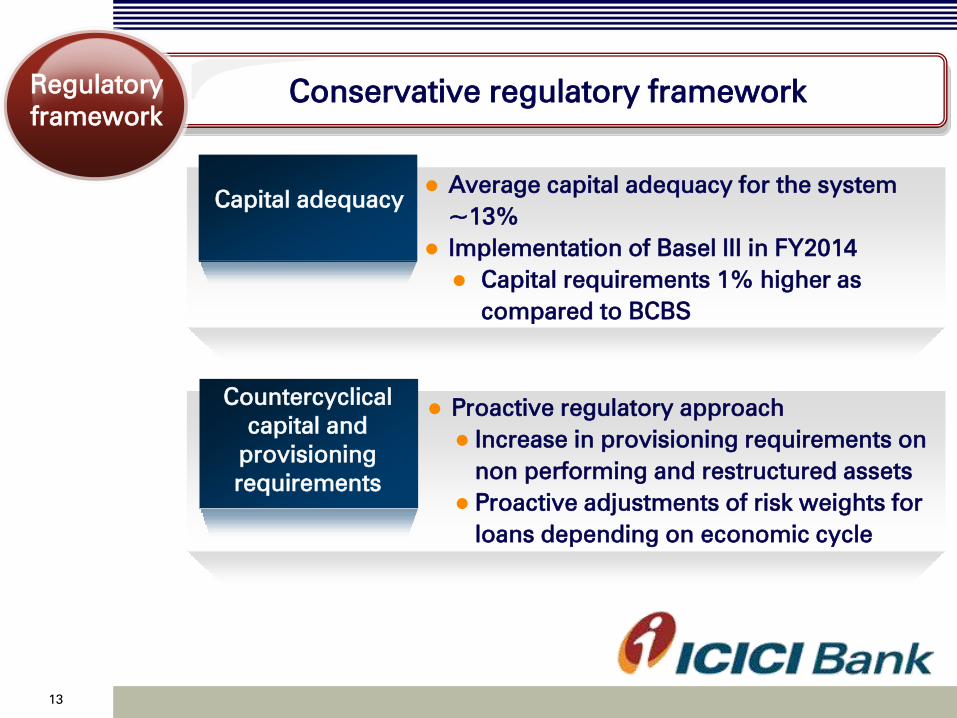
Conservative regulatory framework Regulatory
framework
Capital adequacy Average capital adequacy for the system
~13%
Implementation of Basel III in FY2014
Capital requirements 1% higher as
compared to BCBS
Proactive regulatory approach
Increase in provisioning requirements on
non performing and restructured assets
Proactive adjustments of risk weights for
loans depending on economic cycle
Countercyclical
capital and
provisioning
requirements
13
Agenda
India: macroeconomic scenario
Indian banking sector
ICICI Group
14

1955
1994
1998
2000
2003
Project
finance
to India’s
corporate
sector
Development
Finance
Capitalising
on
liberalisation
of financial
sector
Commercial
Banking
First mover
in
consumption
led growth
opportunity
Retail
Banking
Becoming a
universal
bank
Insurance
Serving
Indian MNCs,
NRIs and
local
communities
International
Granular
income
Transformation over the years ICICI
Group
15

Life Insurance
(JV with Prudential)
General Insurance
(JV with Fairfax)
Asset Management
(JV with Prudential)
Private Equity
(Wholly owned)
Securities
(Wholly owned)
ICICI Bank
74%
74%
51%
100%
100%
Largest private sector life
insurer
Largest private sector
general insurer
Among top three mutual
funds
Leading private equity
company
Leading securities & broking
company
Largest private sector bank
Strong diversified financial services franchise ICICI
Group
16
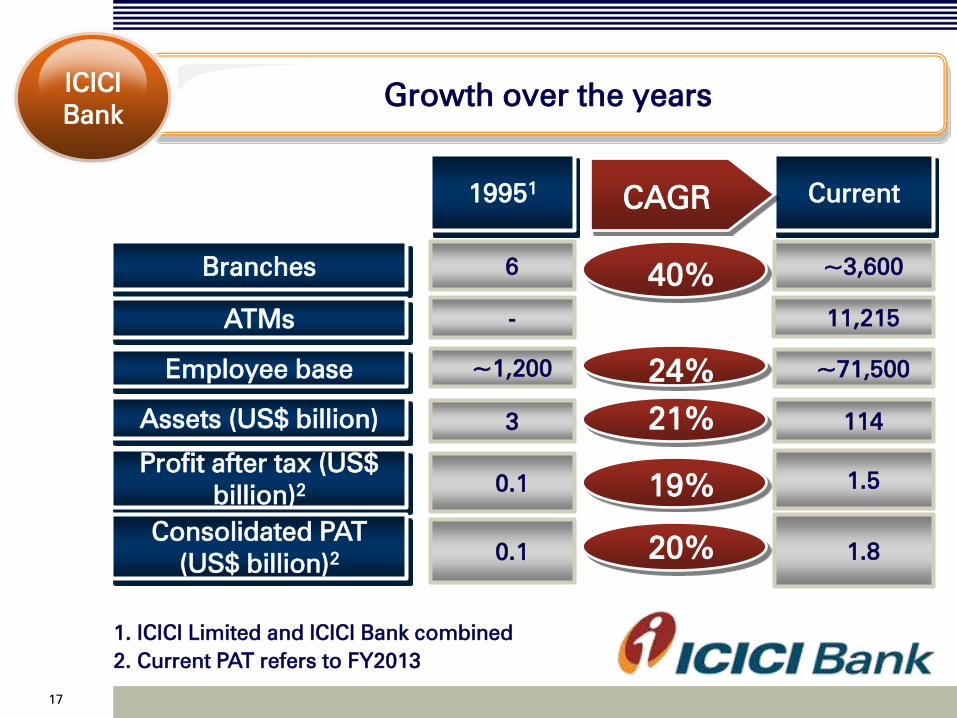
19951
6 Branches
3 Assets (US$ billion)
ATMs -
Employee base ~1,200
Current
~3,600
114
11,215
~71,500
0.1
Profit after tax (US$
billion)2
1.5
40%
24%
21%
19%
CAGR
1. ICICI Limited and ICICI Bank combined
2. Current PAT refers to FY2013
0.1
Consolidated PAT
(US$ billion)2
1.8 20%
Growth over the years ICICI
Bank
17
18
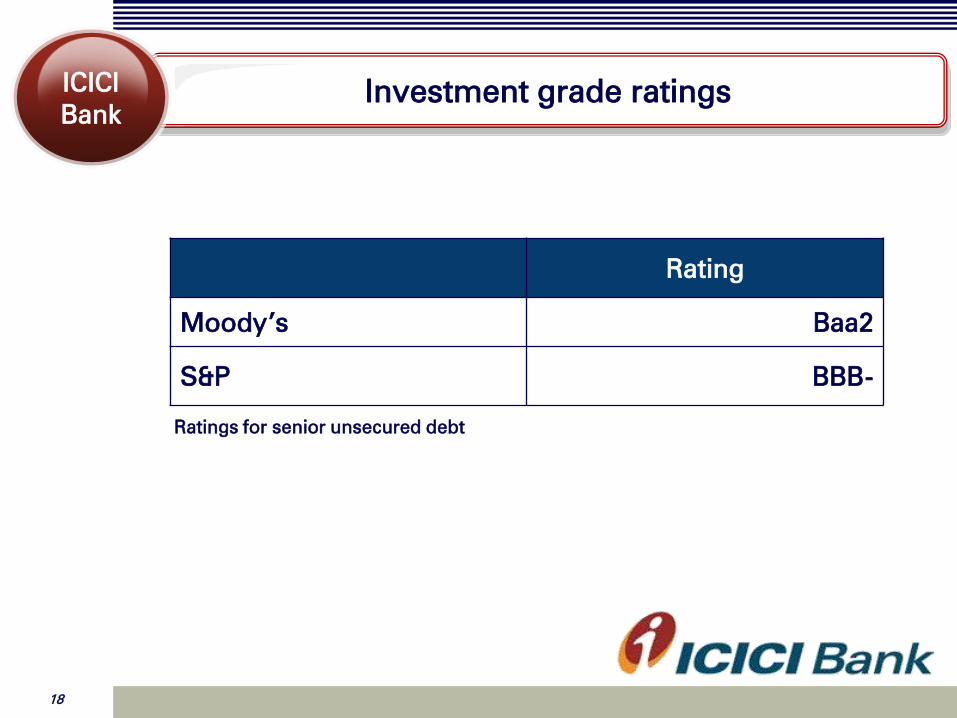
Investment grade ratings ICICI
Bank
Rating
Moody’s Baa2
S&P BBB-
Ratings for senior unsecured debt

Our strategic path
FY2010
• 4Cs: CASA,
Costs, Credit
Quality & Capital
FY2011
Resume balance
sheet growth
FY2012
onwards
Accelerate
growth
Position the
balance sheet for
growth
• Further
improve
funding mix
through retail
term deposit
growth
• Improve RoA:
sharp
reduction in
provisions
• On the back of
improved
liability
structure &
RoA
• Leverage
capital to
increase RoE
Based on long-term economic growth
outlook for the Indian economy
19

Significant improvement in asset and funding profile
20
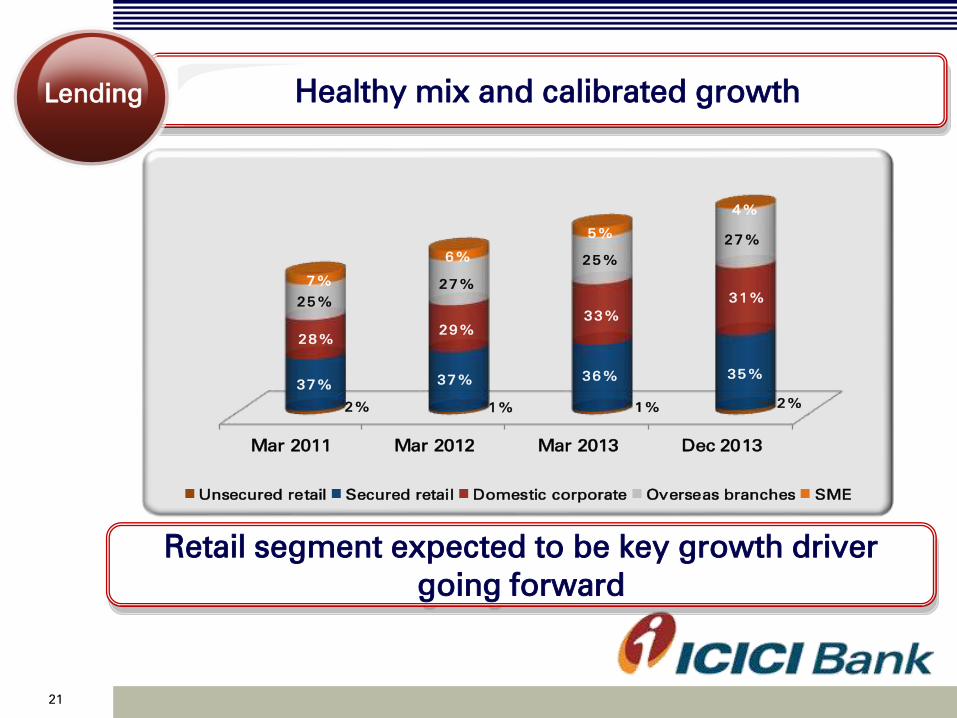
Healthy mix and calibrated growth Lending
Retail segment expected to be key growth driver
going forward
Mar 2011 Mar 2012 Mar 2013 Dec 2013
2% 1% 1% 2%
37% 37%
36% 35%
28%
29%
33%
31%25%
27%
25%
27%
7%
6%
5%
4%
Unsecured retail Secured retail Domestic corporate Overseas branches SME
21

Building a low cost and granular base Funding
Mar 2009 Dec 2013
Retail/domestic Wholesale/domestic
~50% ~50%
~70%
~30%
Mar
2009
Mar
2010
Mar
2011
Mar
2012
Mar
2013
Dec
2013
Savings Current
29%
42%
45%
43%
42%
43%
Retail deposits CASA deposits
Increasing proportion of CASA and retail deposits
22
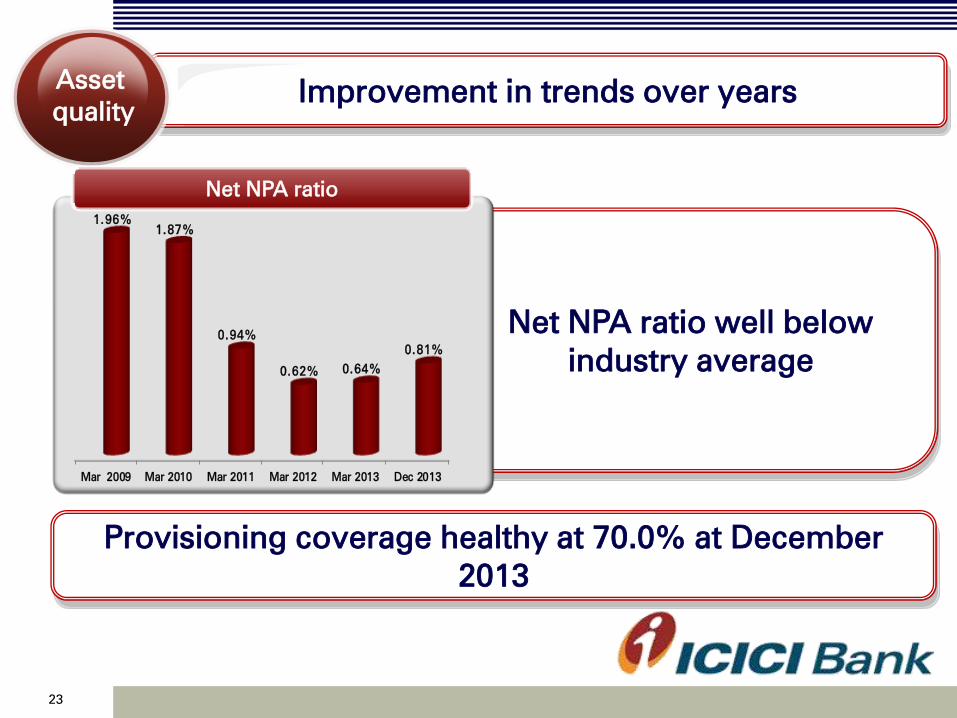
Net NPA ratio well below
industry average
Improvement in trends over years
Provisioning coverage healthy at 70.0% at December
2013
Asset
quality
Mar 2009 Mar 2010 Mar 2011 Mar 2012 Mar 2013 Dec 2013
1.96%
1.87%
0.94%
0.62% 0.64%
0.81%
Net NPA ratio
23
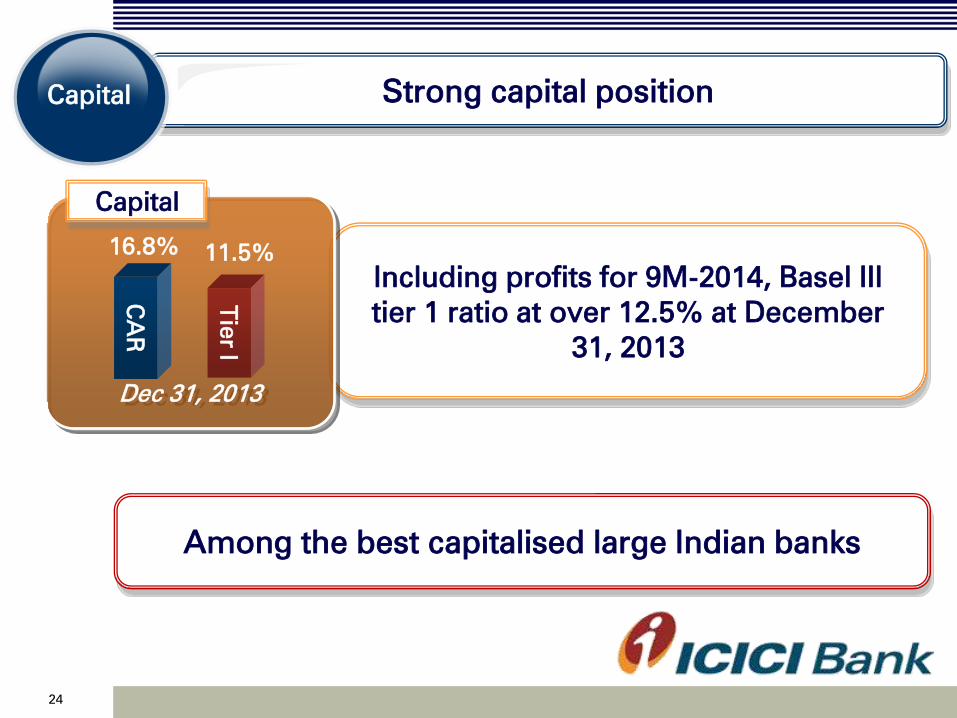
Strong capital position Capital
Including profits for 9M-2014, Basel III
tier 1 ratio at over 12.5% at December
31, 2013
Among the best capitalised large Indian banks
Dec 31, 2013
Tie
r I
CA
R
16.8% 11.5%
Capital
24
Sustained improvement in financial performance
25
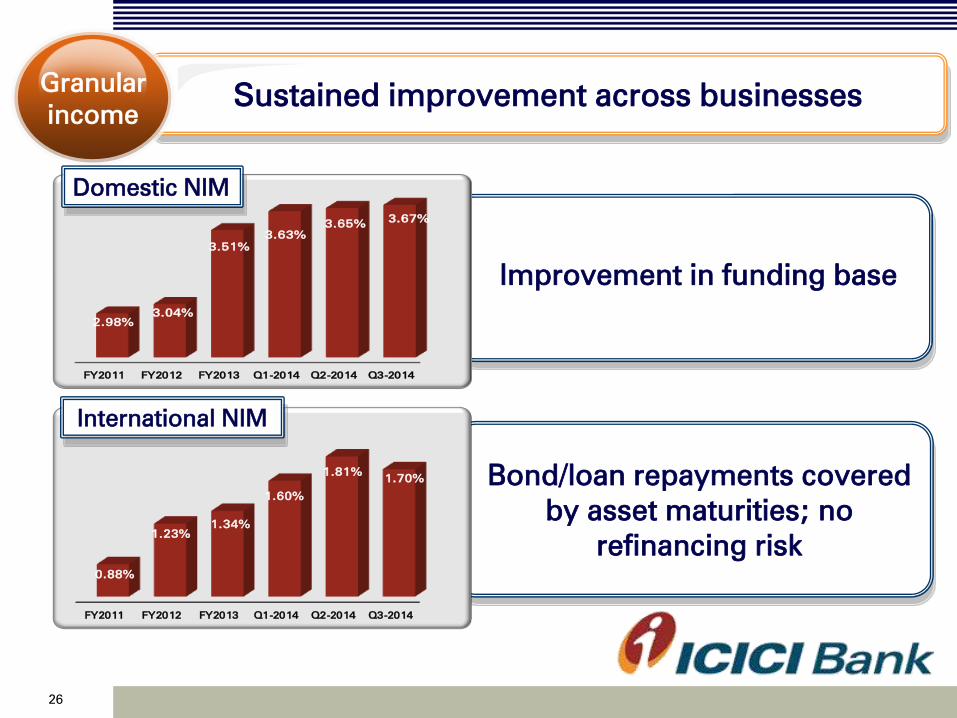
Sustained improvement across businesses Granular
income
Bond/loan repayments covered
by asset maturities; no
refinancing risk
FY2011 FY2012 FY2013 Q1-2014 Q2-2014 Q3-2014
0.88%
1.23%
1.34%
1.60%
1.81%1.70%
Improvement in funding base
FY2011 FY2012 FY2013 Q1-2014 Q2-2014 Q3-2014
2.98%
3.04%
3.51%
3.63%
3.65%3.67%
Domestic NIM
International NIM
26
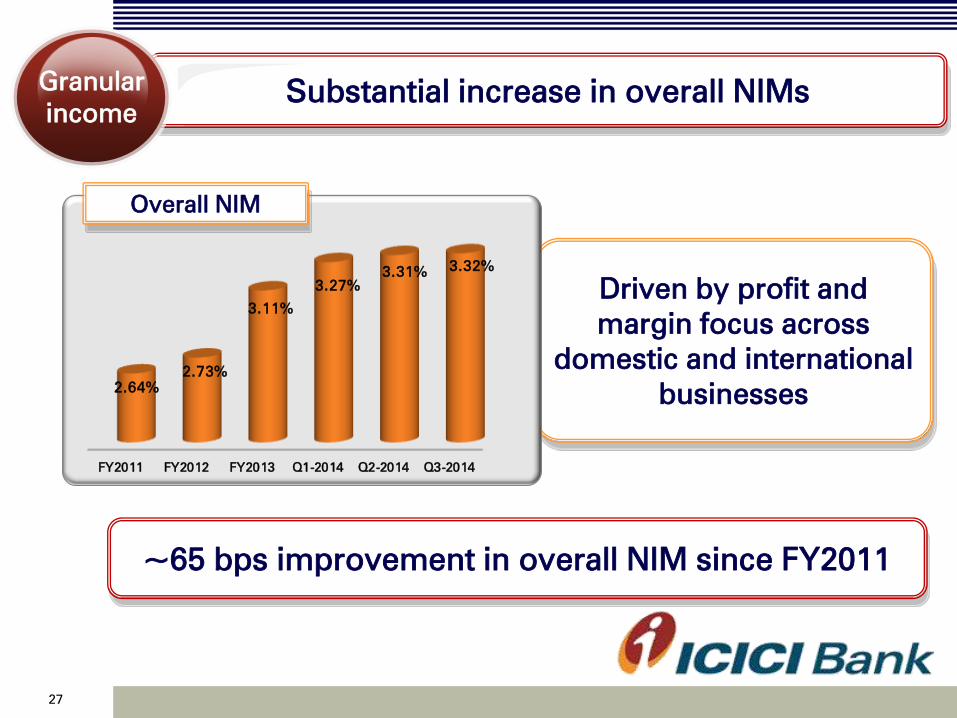
Substantial increase in overall NIMs Granular
income
Driven by profit and
margin focus across
domestic and international
businesses
FY2011 FY2012 FY2013 Q1-2014 Q2-2014 Q3-2014
2.64%
2.73%
3.11%
3.27%
3.31%3.32%
~65 bps improvement in overall NIM since FY2011
Overall NIM
27
Granular
income
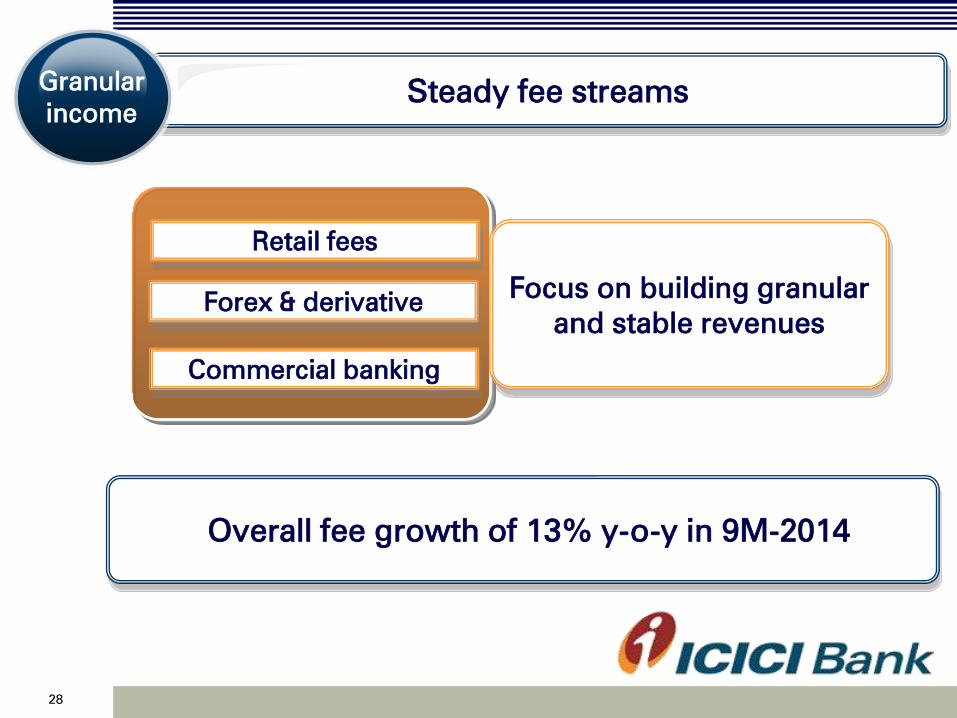
Steady fee streams Granular
income
Forex & derivative
Overall fee growth of 13% y-o-y in 9M-2014
Commercial banking
Retail fees
Focus on building granular
and stable revenues
28

Regular and increasing dividend income Granular
income
• Diversified financial services
franchise yielding high returns
• Remains healthy with increased
payout by ICICI Life
FY2010 FY2013 FY2012
Contributing to increase in non-interest income
29

Driving efficiency on larger network and business Operating
efficiency
• Sustaining best in class
cost-income ratios
• Despite significant scale
up in infrastructure
Focus on cost efficiency to continue
30
FY2011 FY2012 FY2013 9M-2014
42%
43%
41%
38%
Cost-income %
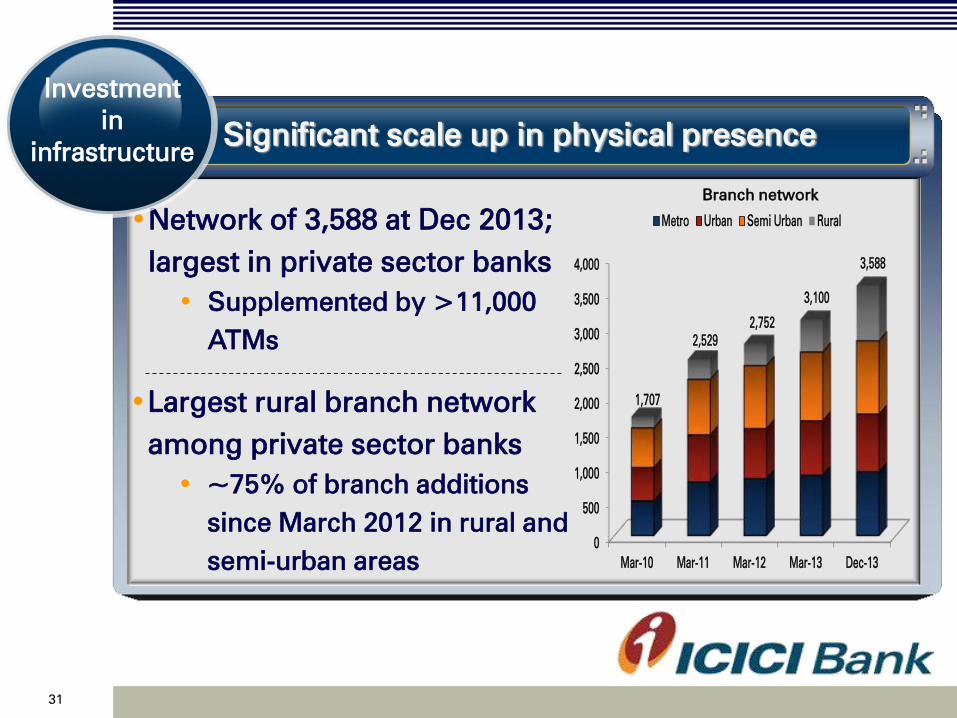
Significant scale up in physical presence
•Network of 3,588 at Dec 2013;
largest in private sector banks
• Supplemented by >11,000
ATMs
•Largest rural branch network
among private sector banks
• ~75% of branch additions
since March 2012 in rural and
semi-urban areas
Branch network
0
500
1,000
1,500
2,000
2,500
3,000
3,500
4,000
Mar-10 Mar-11 Mar-12 Mar-13 Dec-13
Metro Urban Semi Urban Rural
1,707
2,529
2,752
3,100
3,588
Investment
in
infrastructure
31
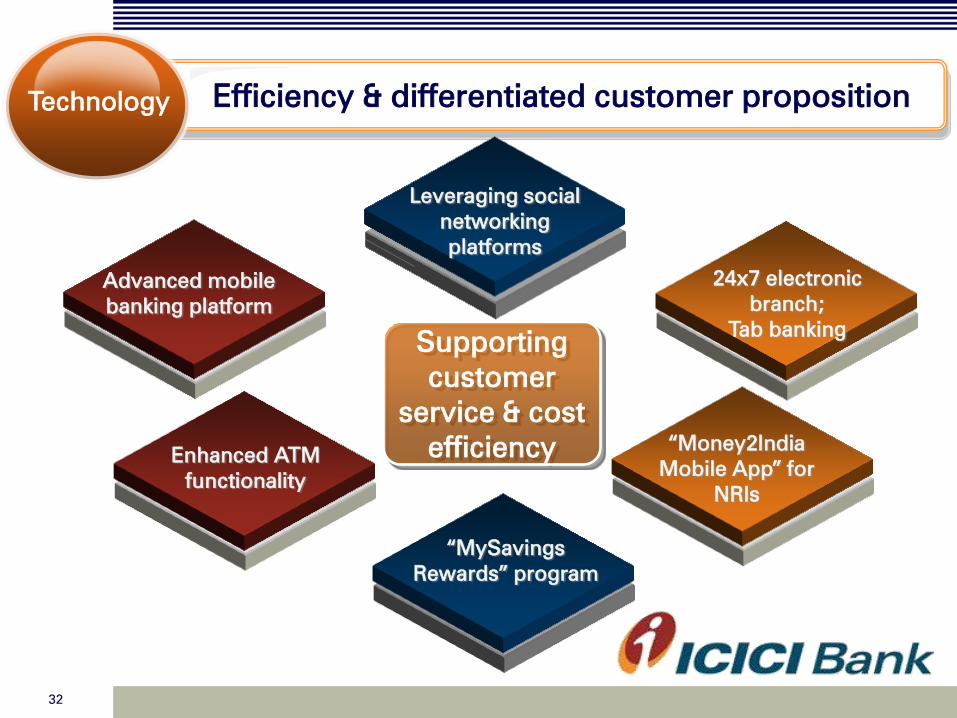
Efficiency & differentiated customer proposition
Leveraging social
networking
platforms
Advanced mobile
banking platform
“MySavings
Rewards” program
Enhanced ATM
functionality
“Money2India
Mobile App” for
NRIs
Technology
Supporting
customer
service & cost
efficiency
24x7 electronic
branch;
Tab banking
32
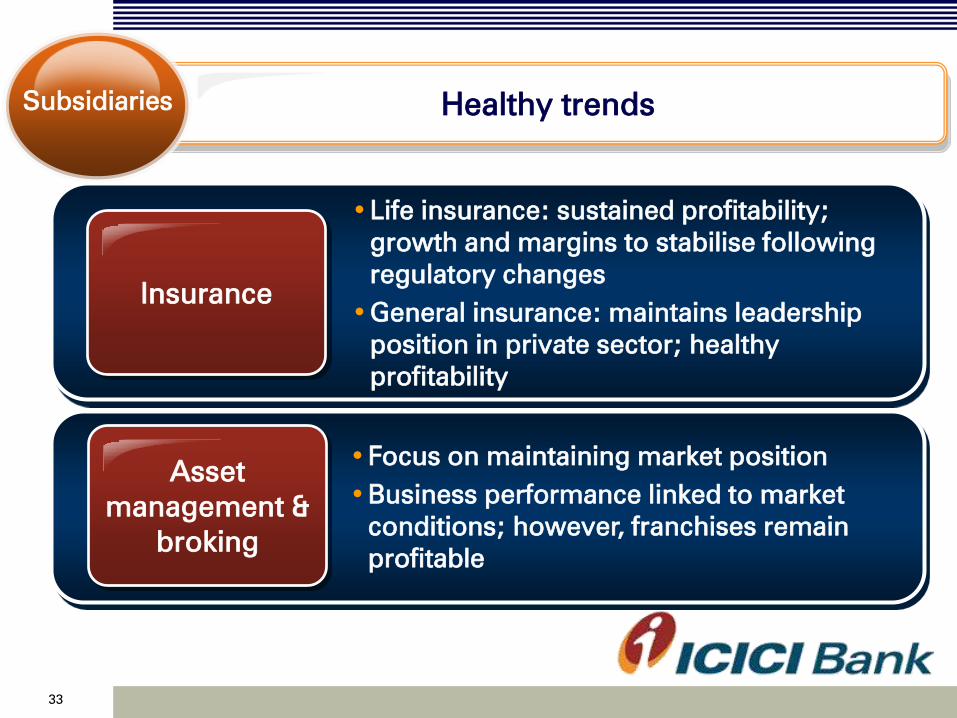
Healthy trends Subsidiaries
•Life insurance: sustained profitability;
growth and margins to stabilise following
regulatory changes
•General insurance: maintains leadership
position in private sector; healthy
profitability
Insurance
•Focus on maintaining market position
•Business performance linked to market
conditions; however, franchises remain
profitable
Asset
management &
broking
33

Consistent delivery against stated objectives Return
profile
Near doubling of
consolidated RoE since
FY2009
Over 70 bps improvement
over FY2009
Standalone RoA
<1.0%
FY2009 1.66%
FY2013
1.73%
9M-2014
Consolidated RoE
<8.0%
FY2009
14.7%
FY2013 15.1%
9M-2014
34
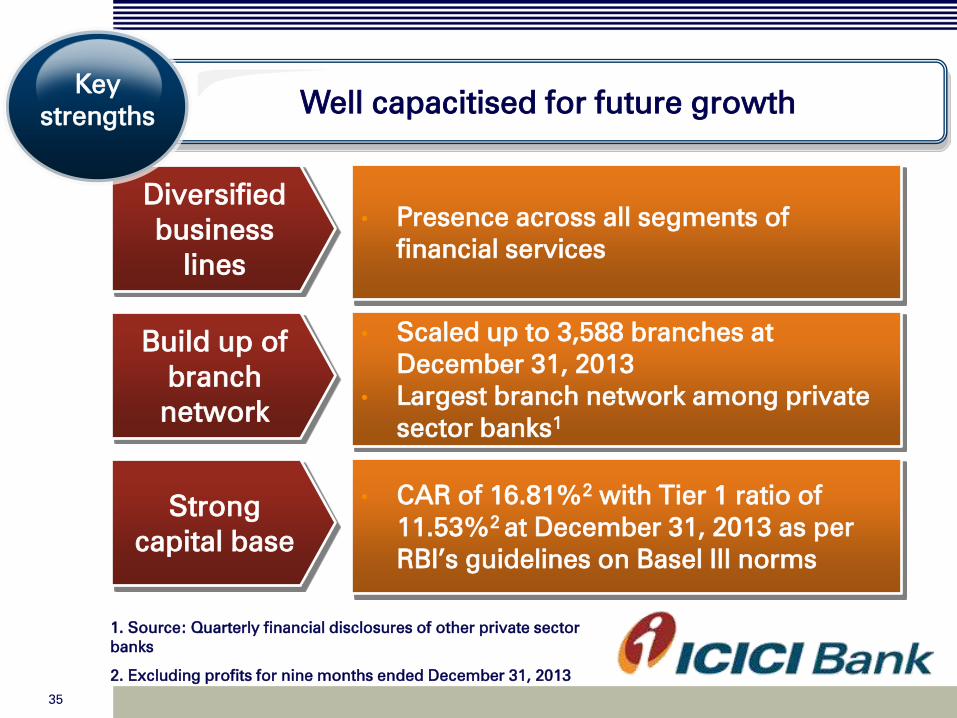
Build up of
branch
network
• Scaled up to 3,588 branches at
December 31, 2013
• Largest branch network among private
sector banks1
Strong
capital base
• CAR of 16.81%2 with Tier 1 ratio of
11.53%2 at December 31, 2013 as per
RBI’s guidelines on Basel III norms
Diversified
business
lines
• Presence across all segments of
financial services
1. Source: Quarterly financial disclosures of other private sector
banks
2. Excluding profits for nine months ended December 31, 2013
Well capacitised for future growth Key
strengths
35
Thank you

37
Financial results
38
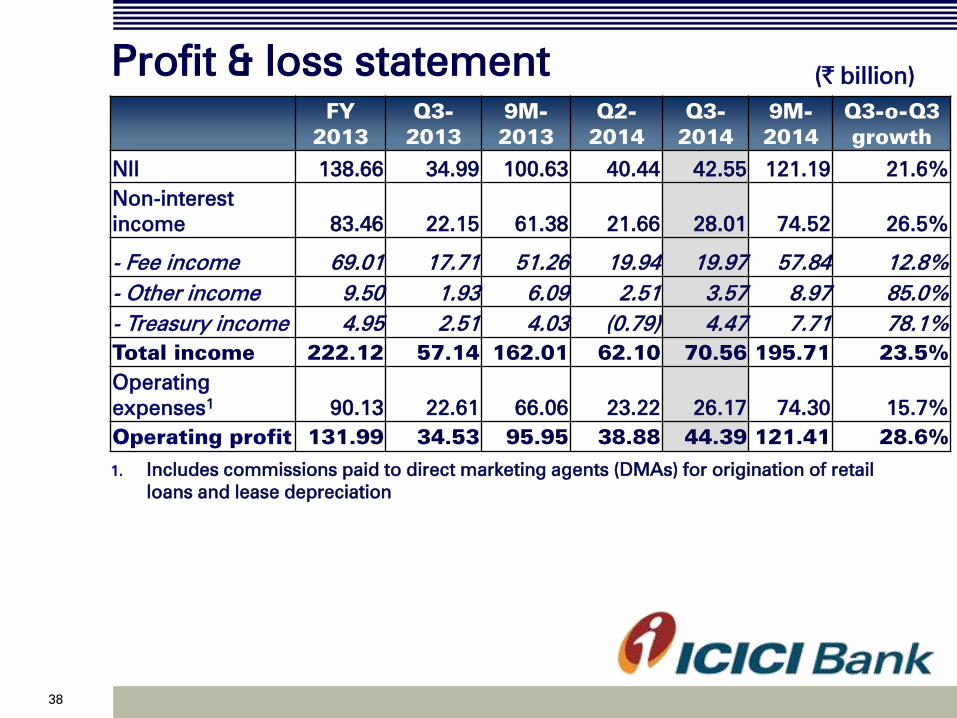
Profit & loss statement
FY
2013
Q3-
2013
9M-
2013
Q2-
2014
Q3-
2014
9M-
2014
Q3-o-Q3
growth
NII
138.66 34.99 100.63 40.44 42.55 121.19 21.6%
Non-interest
income 83.46 22.15 61.38 21.66 28.01 74.52 26.5%
- Fee income 69.01 17.71 51.26 19.94 19.97 57.84 12.8%
- Other income 9.50 1.93 6.09 2.51 3.57 8.97 85.0%
- Treasury income 4.95 2.51 4.03 (0.79)
4.47 7.71 78.1%
Total income 222.12 57.14 162.01 62.10 70.56 195.71 23.5%
Operating
expenses1
90.13 22.61 66.06 23.22 26.17 74.30 15.7%
Operating profit 131.99 34.53 95.95 38.88 44.39 121.41 28.6%
(` billion)
1. Includes commissions paid to direct marketing agents (DMAs) for origination of retail
loans and lease depreciation
39
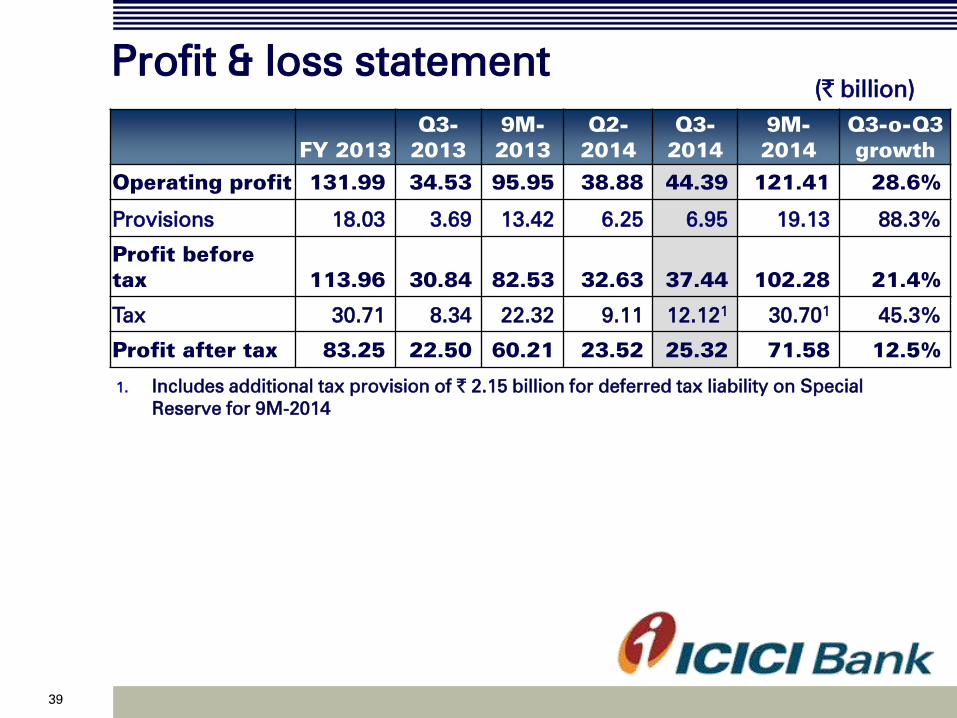
Profit & loss statement
FY 2013
Q3-
2013
9M-
2013
Q2-
2014
Q3-
2014
9M-
2014
Q3-o-Q3
growth
Operating profit 131.99 34.53 95.95 38.88 44.39 121.41 28.6%
Provisions
18.03 3.69
13.42
6.25 6.95 19.13 88.3%
Profit before
tax 113.96 30.84 82.53 32.63 37.44 102.28 21.4%
Tax 30.71 8.34 22.32 9.11 12.121
30.701
45.3%
Profit after tax 83.25 22.50 60.21 23.52 25.32 71.58 12.5%
(` billion)
1. Includes additional tax provision of ` 2.15 billion for deferred tax liability on Special
Reserve for 9M-2014
40
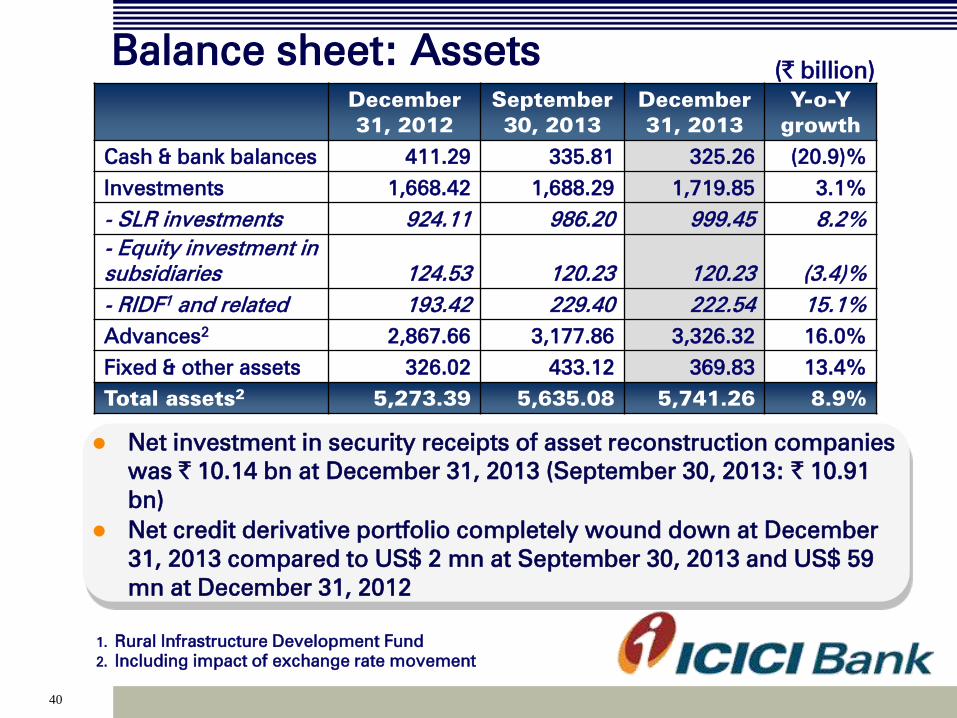
Balance sheet: Assets
December
31, 2012
September
30, 2013
December
31, 2013
Y-o-Y
growth
Cash & bank balances 411.29 335.81 325.26 (20.9)%
Investments 1,668.42 1,688.29 1,719.85 3.1%
- SLR investments 924.11 986.20 999.45 8.2%
- Equity investment in
subsidiaries 124.53 120.23 120.23 (3.4)%
- RIDF1 and related 193.42 229.40 222.54 15.1%
Advances2
2,867.66 3,177.86 3,326.32 16.0%
Fixed & other assets
326.02 433.12 369.83 13.4%
Total assets2
5,273.39 5,635.08 5,741.26 8.9%
(` billion)
Net investment in security receipts of asset reconstruction companies
was ` 10.14 bn at December 31, 2013 (September 30, 2013: ` 10.91
bn)
Net credit derivative portfolio completely wound down at December
31, 2013 compared to US$ 2 mn at September 30, 2013 and US$ 59
mn at December 31, 2012
1. Rural Infrastructure Development Fund
2. Including impact of exchange rate movement
41
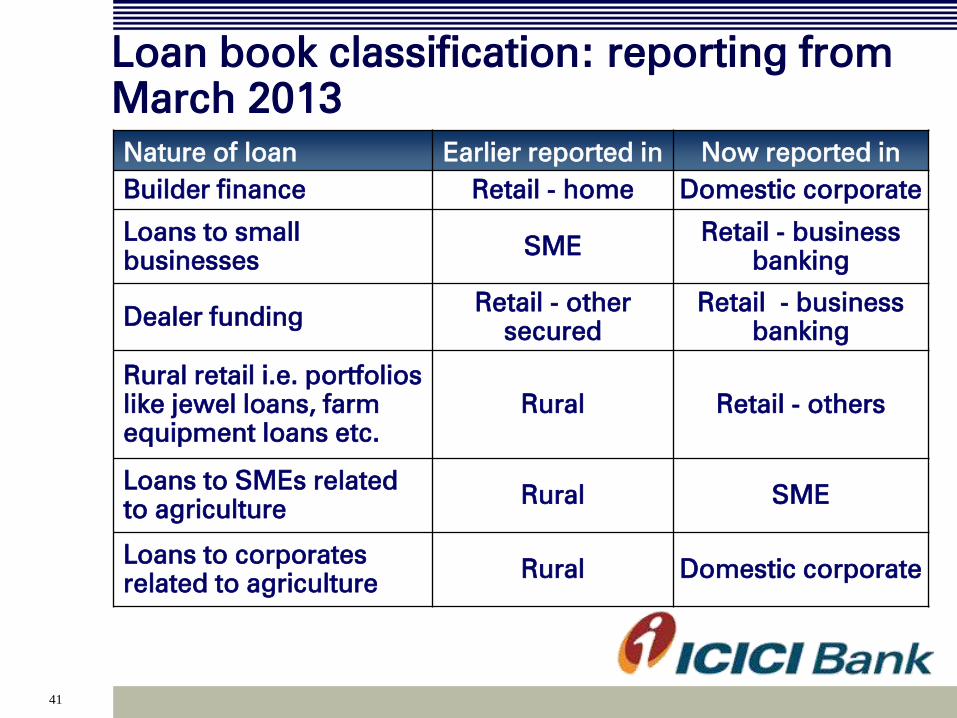
Loan book classification: reporting from
March 2013
Nature of loan Earlier reported in Now reported in
Builder finance Retail - home Domestic corporate
Loans to small
businesses SME
Retail - business
banking
Dealer funding Retail - other
secured
Retail - business
banking
Rural retail i.e. portfolios
like jewel loans, farm
equipment loans etc.
Rural Retail - others
Loans to SMEs related
to agriculture Rural SME
Loans to corporates
related to agriculture Rural Domestic corporate
42
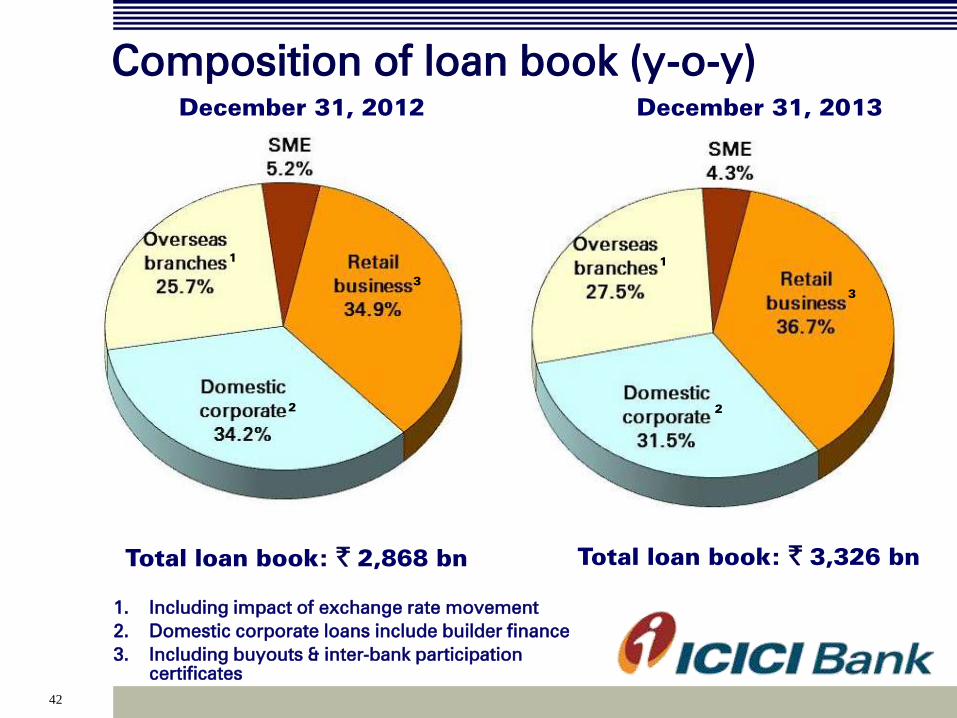
Composition of loan book (y-o-y)
1. Including impact of exchange rate movement
2. Domestic corporate loans include builder finance
3. Including buyouts & inter-bank participation
certificates
December 31, 2012
Total loan book: ` 2,868 bn
December 31, 2013
Total loan book: ` 3,326 bn
3
1
2
1
2
3
43
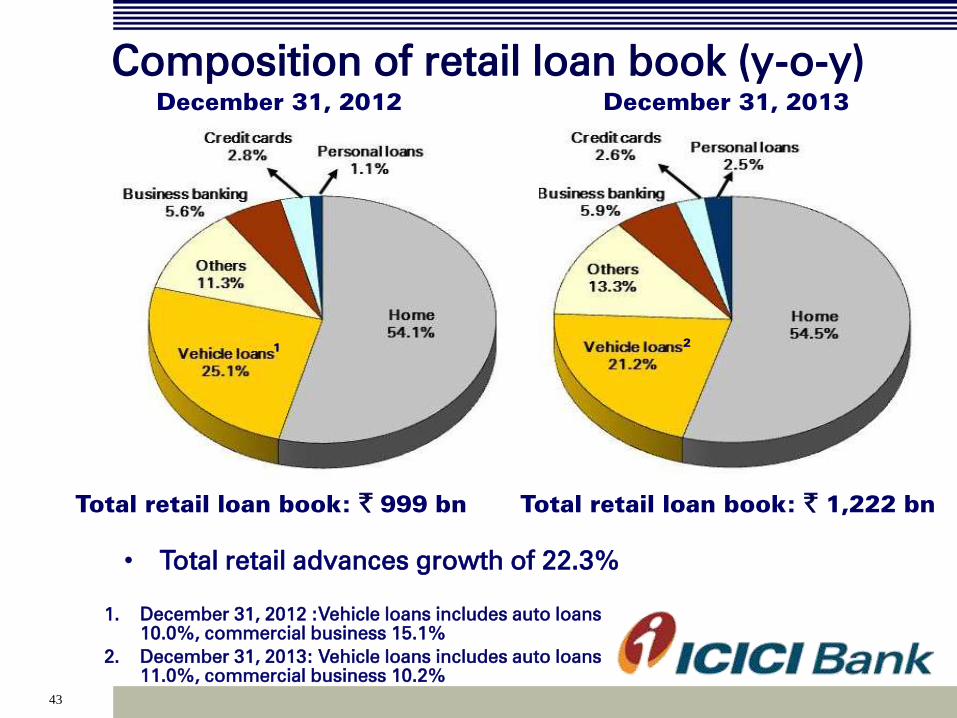
Composition of retail loan book (y-o-y)
1. December 31, 2012 :Vehicle loans includes auto loans
10.0%, commercial business 15.1%
2. December 31, 2013: Vehicle loans includes auto loans
11.0%, commercial business 10.2%
Total retail loan book: ` 999 bn
December 31, 2012
• Total retail advances growth of 22.3%
Total retail loan book: ` 1,222 bn
December 31, 2013
1 2
44
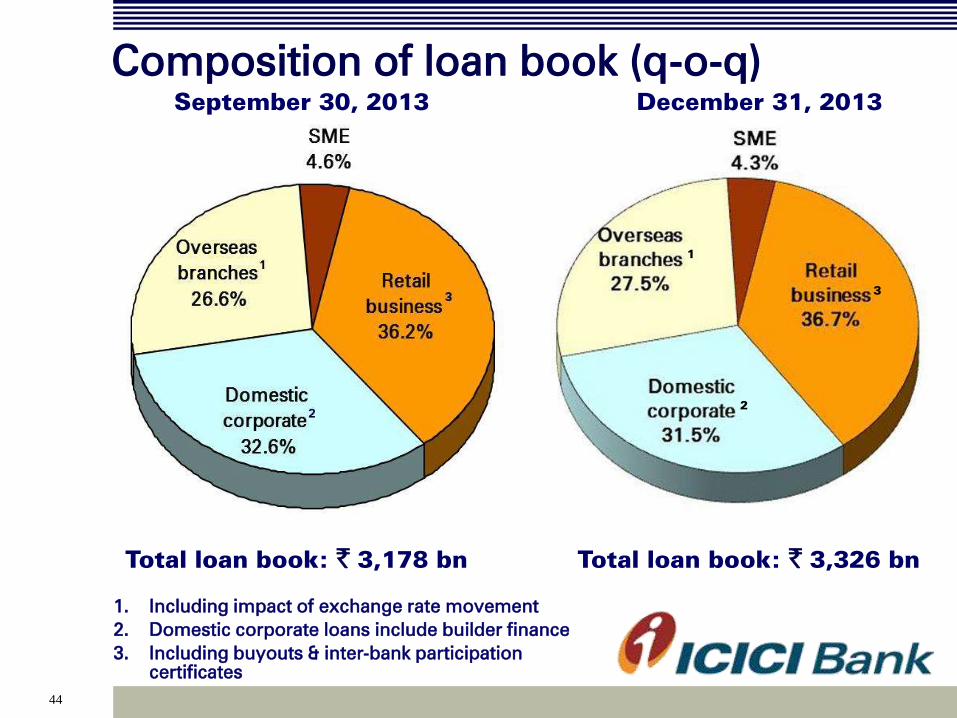
Composition of loan book (q-o-q)
September 30, 2013
Total loan book: ` 3,178 bn
1. Including impact of exchange rate movement
2. Domestic corporate loans include builder finance
3. Including buyouts & inter-bank participation
certificates
December 31, 2013
Total loan book: ` 3,326 bn
3
2
1
45
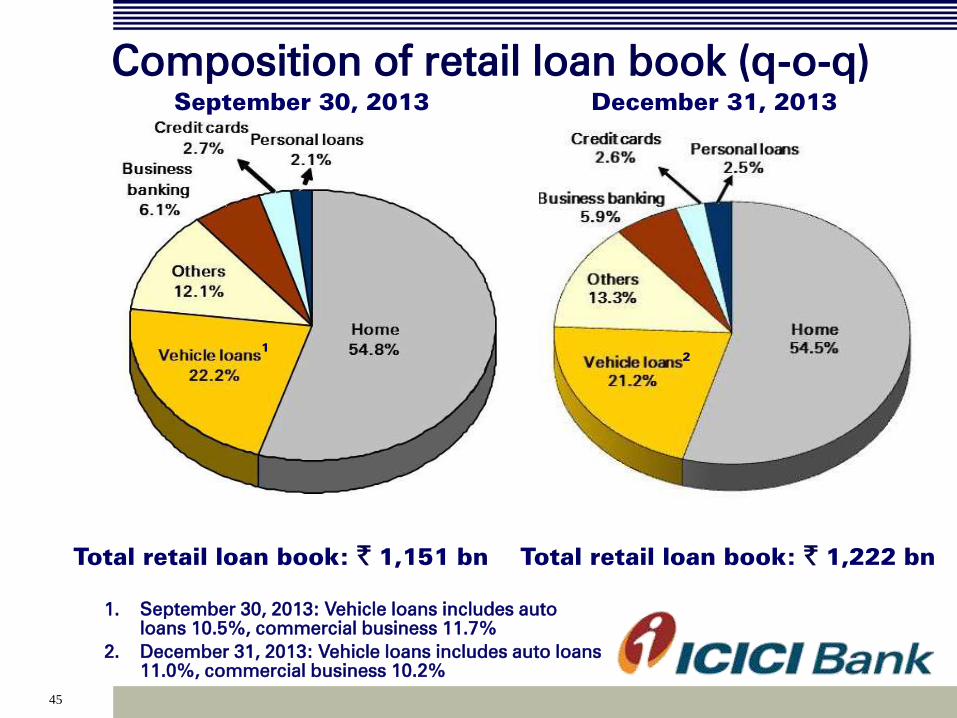
Composition of retail loan book (q-o-q)
1. September 30, 2013: Vehicle loans includes auto
loans 10.5%, commercial business 11.7%
2. December 31, 2013: Vehicle loans includes auto loans
11.0%, commercial business 10.2%
Total retail loan book: ` 1,151 bn Total retail loan book: ` 1,222 bn
December 31, 2013 September 30, 2013
1
2
46
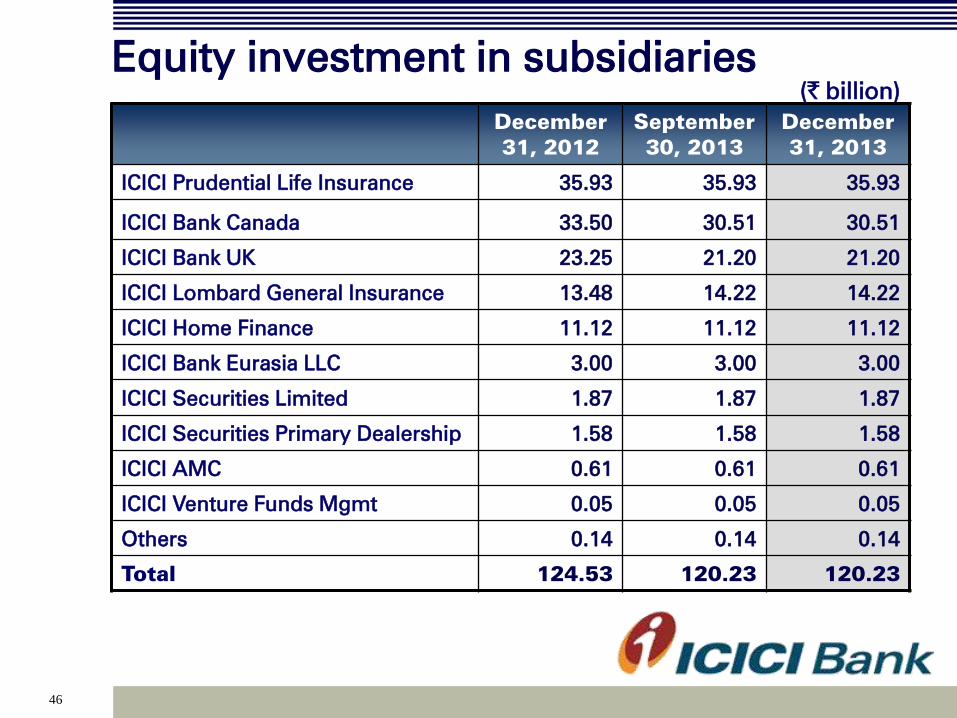
Equity investment in subsidiaries
December
31, 2012
September
30, 2013
December
31, 2013
ICICI Prudential Life Insurance 35.93 35.93 35.93
ICICI Bank Canada 33.50 30.51 30.51
ICICI Bank UK 23.25 21.20 21.20
ICICI Lombard General Insurance 13.48 14.22 14.22
ICICI Home Finance
11.12 11.12 11.12
ICICI Bank Eurasia LLC 3.00 3.00 3.00
ICICI Securities Limited 1.87 1.87 1.87
ICICI Securities Primary Dealership 1.58 1.58 1.58
ICICI AMC 0.61 0.61 0.61
ICICI Venture Funds Mgmt 0.05 0.05 0.05
Others 0.14 0.14 0.14
Total 124.53 120.23 120.23
(` billion)
47
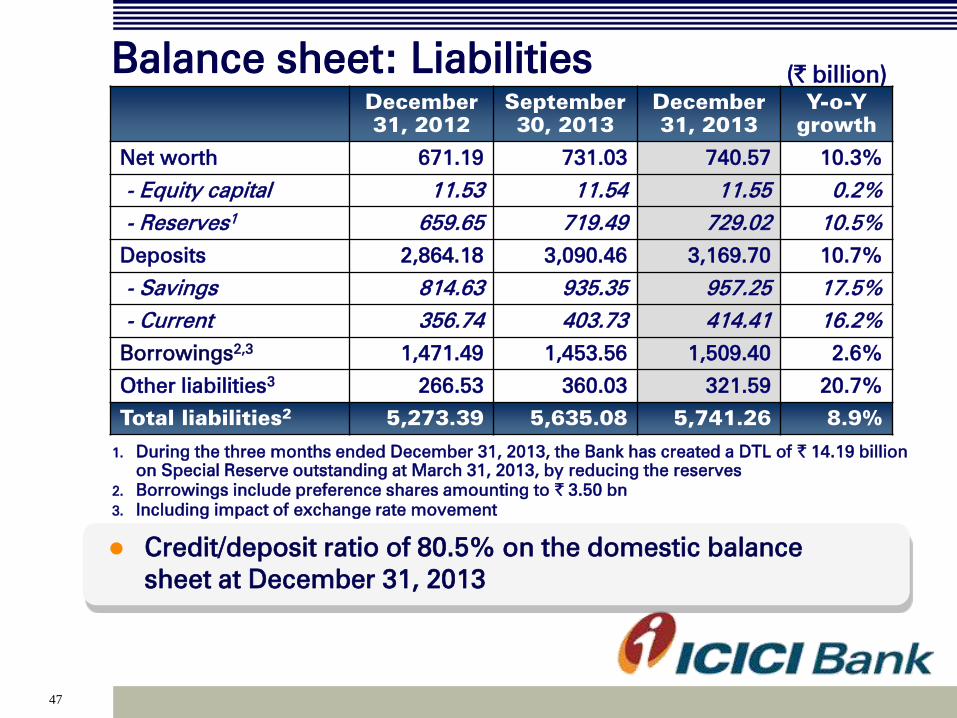
Balance sheet: Liabilities
December
31, 2012
September
30, 2013
December
31, 2013
Y-o-Y
growth
Net worth 671.19 731.03 740.57 10.3%
- Equity capital 11.53 11.54 11.55 0.2%
- Reserves1
659.65 719.49 729.02 10.5%
Deposits 2,864.18 3,090.46 3,169.70 10.7%
- Savings 814.63 935.35 957.25 17.5%
- Current 356.74 403.73 414.41 16.2%
Borrowings2,3
1,471.49 1,453.56 1,509.40 2.6%
Other liabilities3
266.53 360.03 321.59 20.7%
Total liabilities2
5,273.39 5,635.08 5,741.26 8.9%
(` billion)
Credit/deposit ratio of 80.5% on the domestic balance
sheet at December 31, 2013
1. During the three months ended December 31, 2013, the Bank has created a DTL of ` 14.19 billion
on Special Reserve outstanding at March 31, 2013, by reducing the reserves
2. Borrowings include preference shares amounting to ` 3.50 bn
3. Including impact of exchange rate movement
48
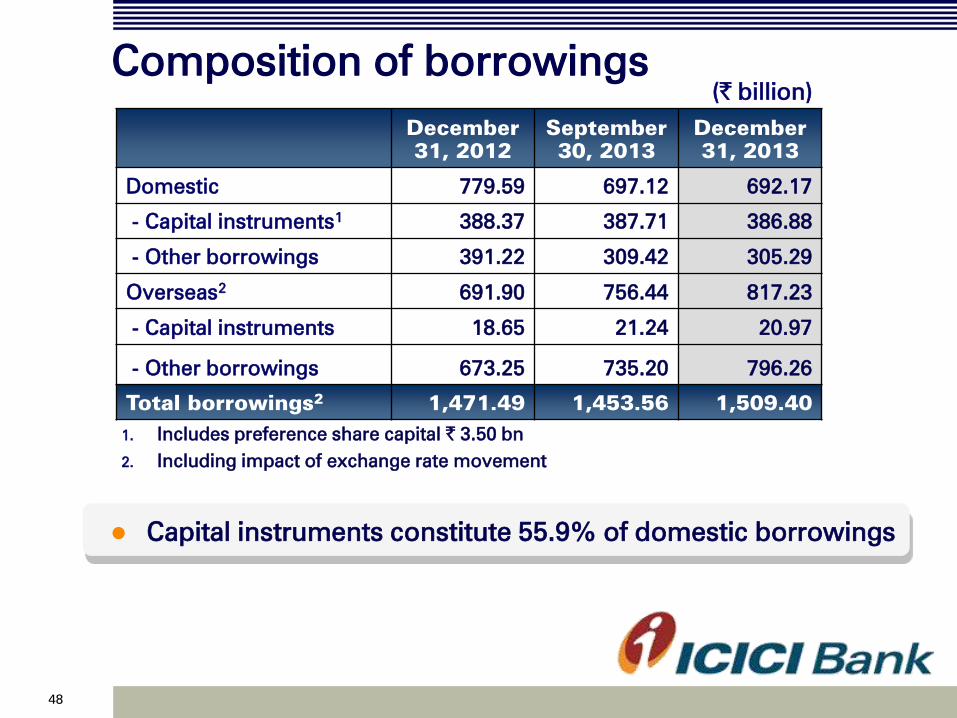
Composition of borrowings
December
31, 2012
September
30, 2013
December
31, 2013
Domestic 779.59 697.12 692.17
- Capital instruments1
388.37
387.71 386.88
- Other borrowings
391.22
309.42 305.29
Overseas2
691.90 756.44 817.23
- Capital instruments 18.65 21.24 20.97
- Other borrowings 673.25 735.20 796.26
Total borrowings2
1,471.49 1,453.56 1,509.40
Capital instruments constitute 55.9% of domestic borrowings
1. Includes preference share capital ` 3.50 bn
2. Including impact of exchange rate movement
(` billion)
49
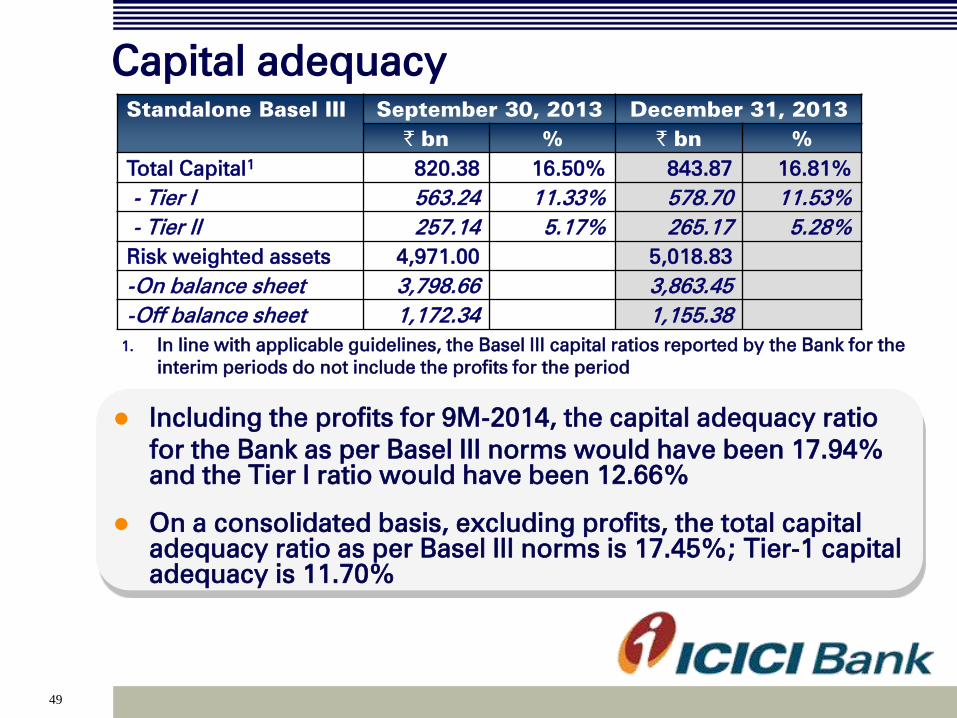
Capital adequacy
Standalone Basel III
September 30, 2013
December 31, 2013
` bn % ` bn %
Total Capital1
820.38 16.50% 843.87 16.81%
- Tier I 563.24 11.33% 578.70 11.53%
- Tier II 257.14 5.17% 265.17 5.28%
Risk weighted assets 4,971.00 5,018.83
-On balance sheet 3,798.66 3,863.45
-Off balance sheet 1,172.34 1,155.38
1. In line with applicable guidelines, the Basel III capital ratios reported by the Bank for the
interim periods do not include the profits for the period
Including the profits for 9M-2014, the capital adequacy ratio
for the Bank as per Basel III norms would have been 17.94%
and the Tier I ratio would have been 12.66%
On a consolidated basis, excluding profits, the total capital
adequacy ratio as per Basel III norms is 17.45%; Tier-1 capital
adequacy is 11.70%
50
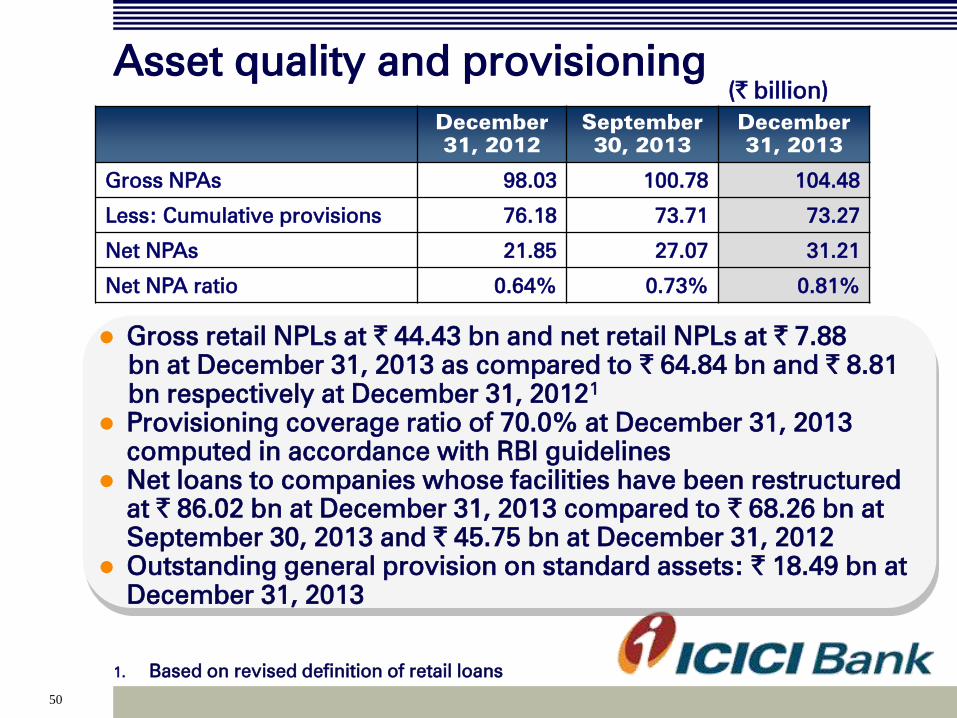
Gross retail NPLs at ` 44.43 bn and net retail NPLs at ` 7.88
bn at December 31, 2013 as compared to ` 64.84 bn and ` 8.81
bn respectively at December 31, 20121
Provisioning coverage ratio of 70.0% at December 31, 2013
computed in accordance with RBI guidelines
Net loans to companies whose facilities have been restructured
at ` 86.02 bn at December 31, 2013 compared to ` 68.26 bn at
September 30, 2013 and ` 45.75 bn at December 31, 2012
Outstanding general provision on standard assets: ` 18.49 bn at
December 31, 2013
Asset quality and provisioning (` billion)
December
31, 2012
September
30, 2013
December
31, 2013
Gross NPAs
98.03 100.78 104.48
Less: Cumulative provisions
76.18 73.71 73.27
Net NPAs 21.85 27.07 31.21
Net NPA ratio
0.64% 0.73% 0.81%
1. Based on revised definition of retail loans

51
Overseas subsidiaries
52
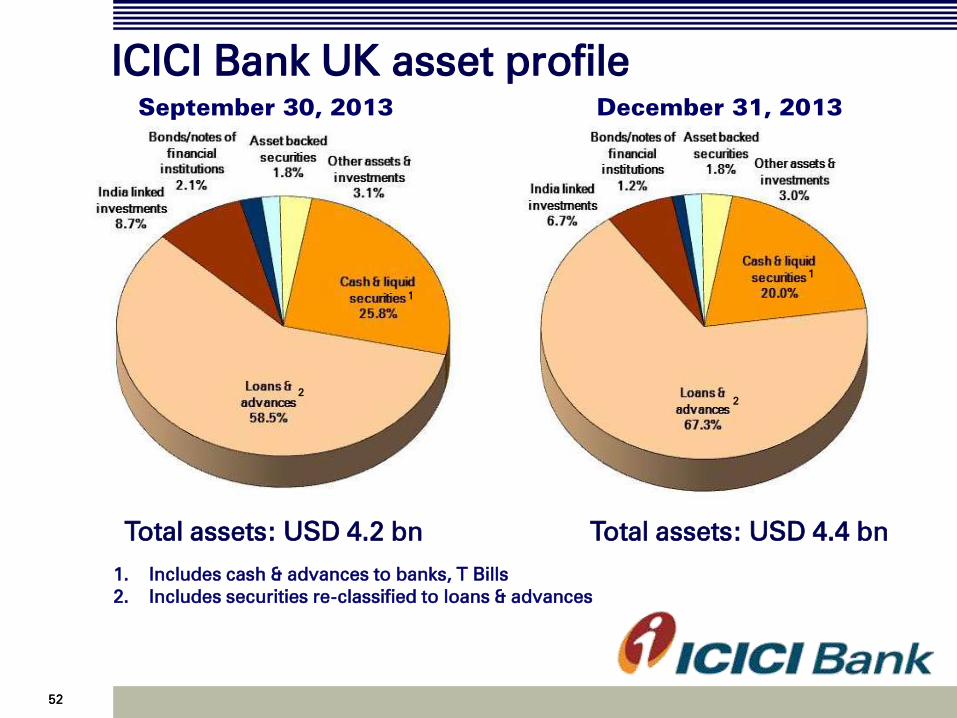
December 31, 2013
Total assets: USD 4.4 bn
52
ICICI Bank UK asset profile
1. Includes cash & advances to banks, T Bills
2. Includes securities re-classified to loans & advances
Total assets: USD 4.2 bn
September 30, 2013
1
1
2
2

53 53
ICICI Bank UK liability profile
Profit after tax of US$ 8.5 mn in Q3-2014 compared to US$ 5.4 mn in Q3-2013
Capital adequacy ratio at 24.4%
Proportion of retail term deposits in total deposits at 36% at December 31, 2013
Total liabilities: USD 4.2 bn
September 30, 2013 December 31, 2013
Total liabilities: USD 4.4 bn
54
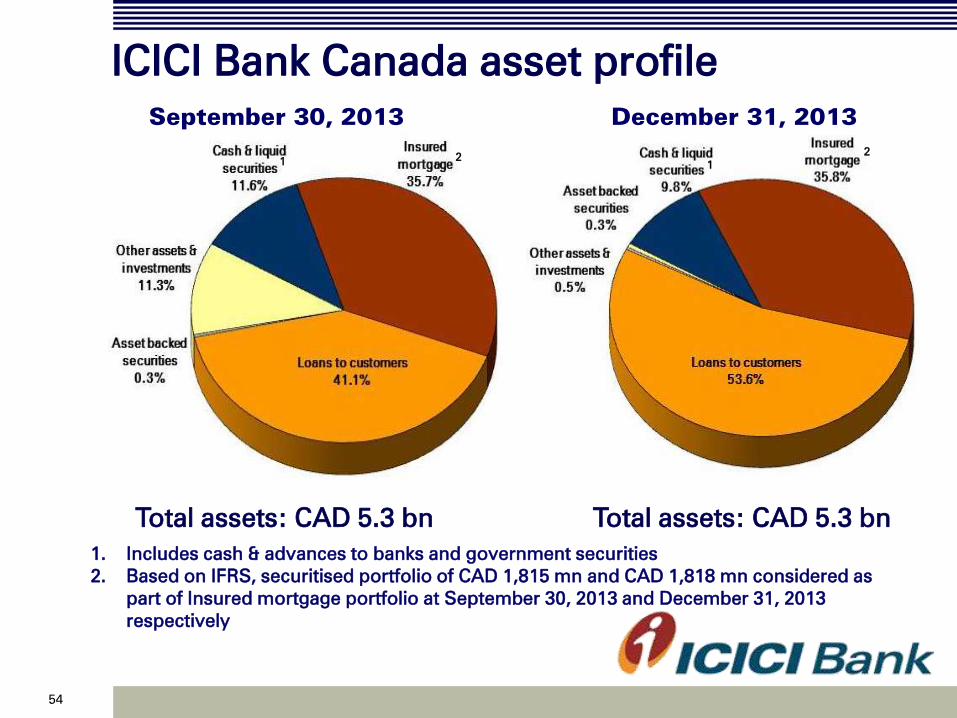
ICICI Bank Canada asset profile
1. Includes cash & advances to banks and government securities
2. Based on IFRS, securitised portfolio of CAD 1,815 mn and CAD 1,818 mn considered as
part of Insured mortgage portfolio at September 30, 2013 and December 31, 2013
respectively
September 30, 2013
Total assets: CAD 5.3 bn
December 31, 2013
Total assets: CAD 5.3 bn
2
1
2 1
55 55
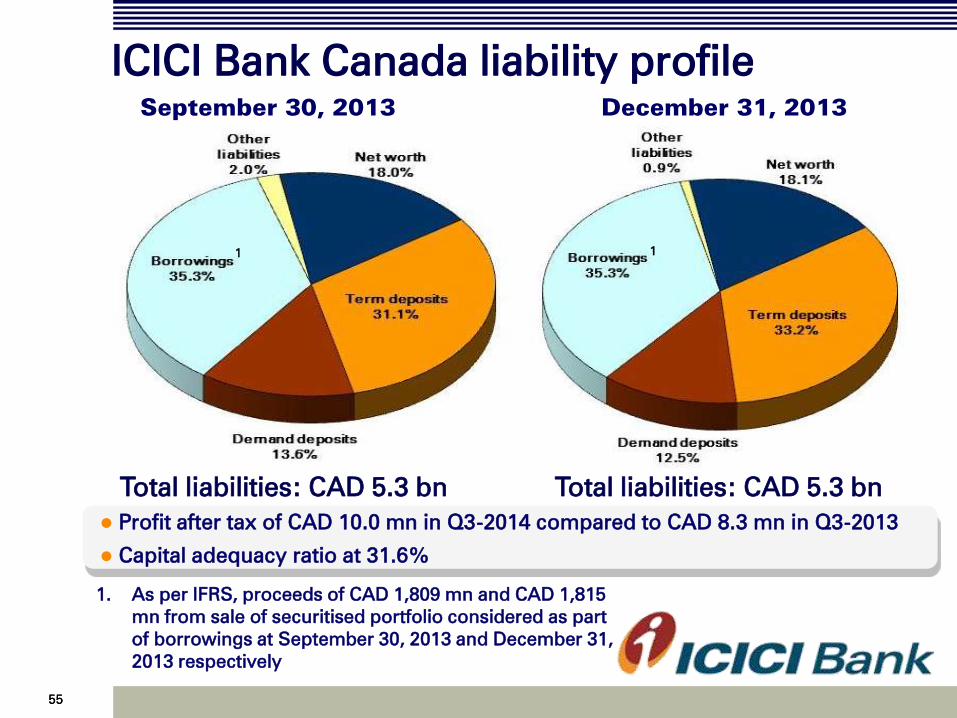
ICICI Bank Canada liability profile
Profit after tax of CAD 10.0 mn in Q3-2014 compared to CAD 8.3 mn in Q3-2013
Capital adequacy ratio at 31.6%
1. As per IFRS, proceeds of CAD 1,809 mn and CAD 1,815
mn from sale of securitised portfolio considered as part
of borrowings at September 30, 2013 and December 31,
2013 respectively
Total liabilities: CAD 5.3 bn
December 31, 2013
September 30, 2013
Total liabilities: CAD 5.3 bn
1 1
56 56
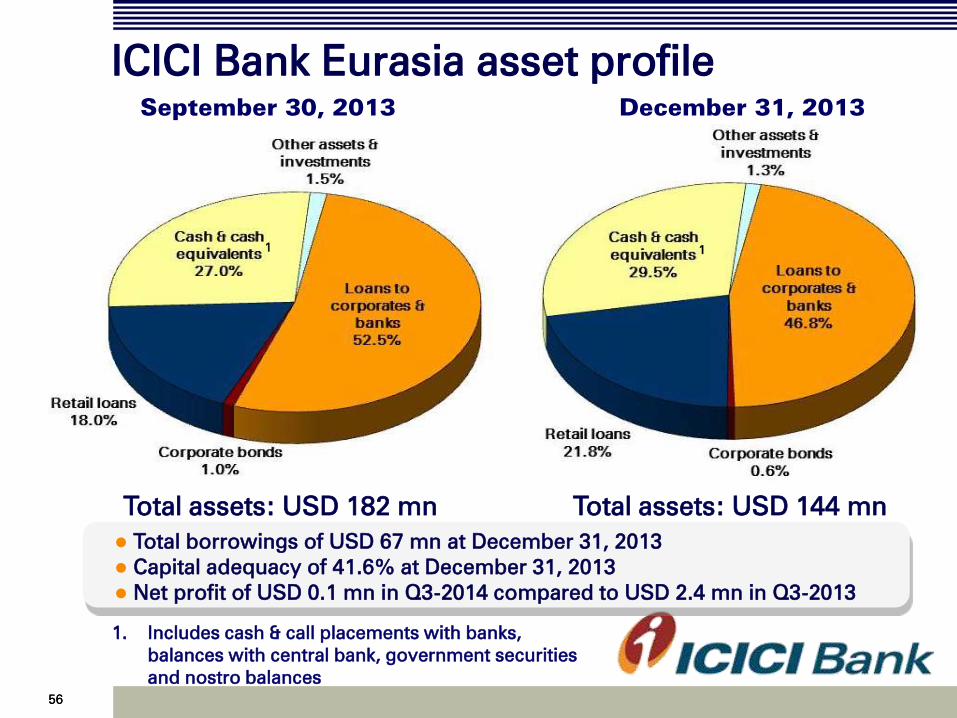
ICICI Bank Eurasia asset profile
1. Includes cash & call placements with banks,
balances with central bank, government securities
and nostro balances
Total borrowings of USD 67 mn at December 31, 2013
Capital adequacy of 41.6% at December 31, 2013
Net profit of USD 0.1 mn in Q3-2014 compared to USD 2.4 mn in Q3-2013
Total assets: USD 182 mn
December 31, 2013
Total assets: USD 144 mn
September 30, 2013
1 1
57
Domestic subsidiaries
58
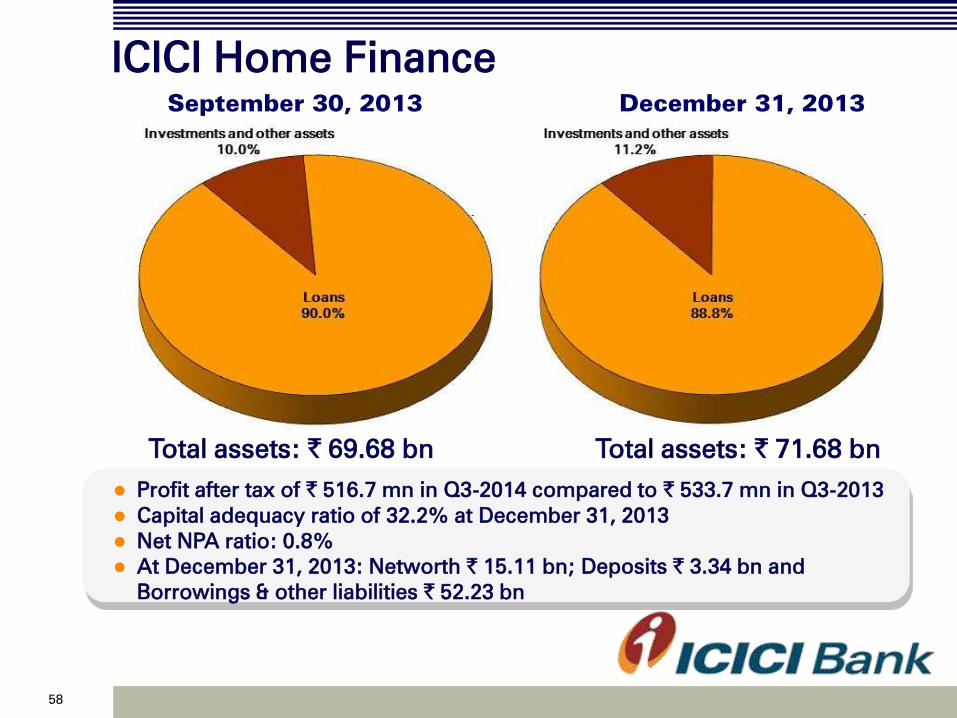
ICICI Home Finance
Profit after tax of ` 516.7 mn in Q3-2014 compared to ` 533.7 mn in Q3-2013
Capital adequacy ratio of 32.2% at December 31, 2013
Net NPA ratio: 0.8%
At December 31, 2013: Networth ` 15.11 bn; Deposits ` 3.34 bn and
Borrowings & other liabilities ` 52.23 bn
September 30, 2013
Total assets: ` 69.68 bn
December 31, 2013
Total assets: ` 71.68 bn
59 59 59
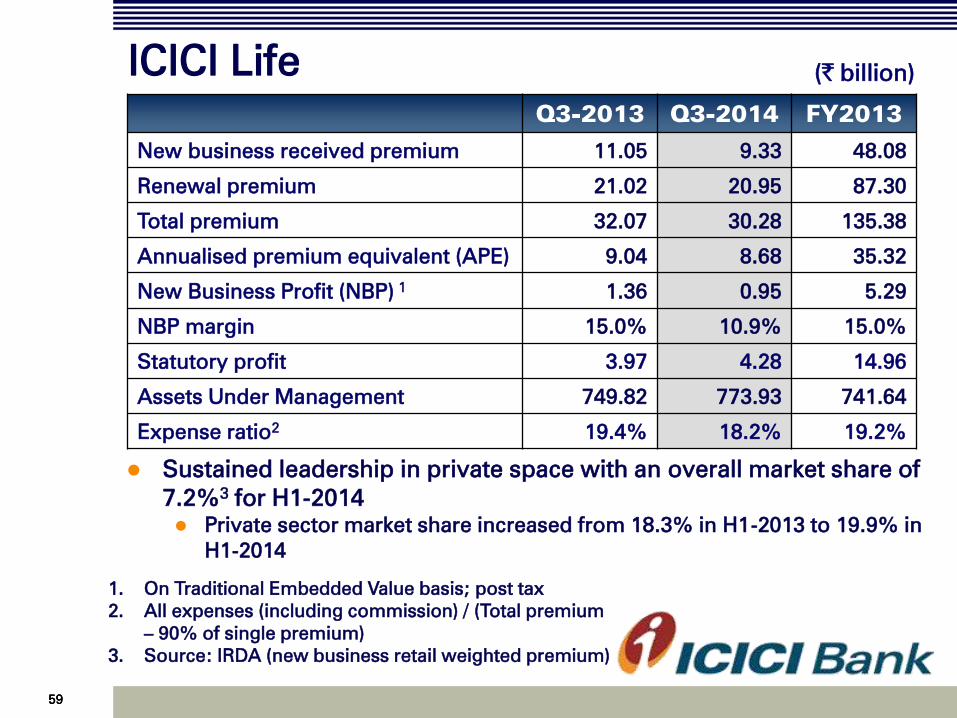
ICICI Life (` billion)
Q3-2013 Q3-2014 FY2013
New business received premium 11.05 9.33 48.08
Renewal premium 21.02 20.95 87.30
Total premium 32.07 30.28 135.38
Annualised premium equivalent (APE) 9.04 8.68 35.32
New Business Profit (NBP) 1 1.36 0.95 5.29
NBP margin 15.0% 10.9% 15.0%
Statutory profit 3.97 4.28 14.96
Assets Under Management 749.82 773.93 741.64
Expense ratio2
19.4% 18.2% 19.2%
Sustained leadership in private space with an overall market share of
7.2%3 for H1-2014
Private sector market share increased from 18.3% in H1-2013 to 19.9% in
H1-2014
1. On Traditional Embedded Value basis; post tax
2. All expenses (including commission) / (Total premium
– 90% of single premium)
3. Source: IRDA (new business retail weighted premium)
60
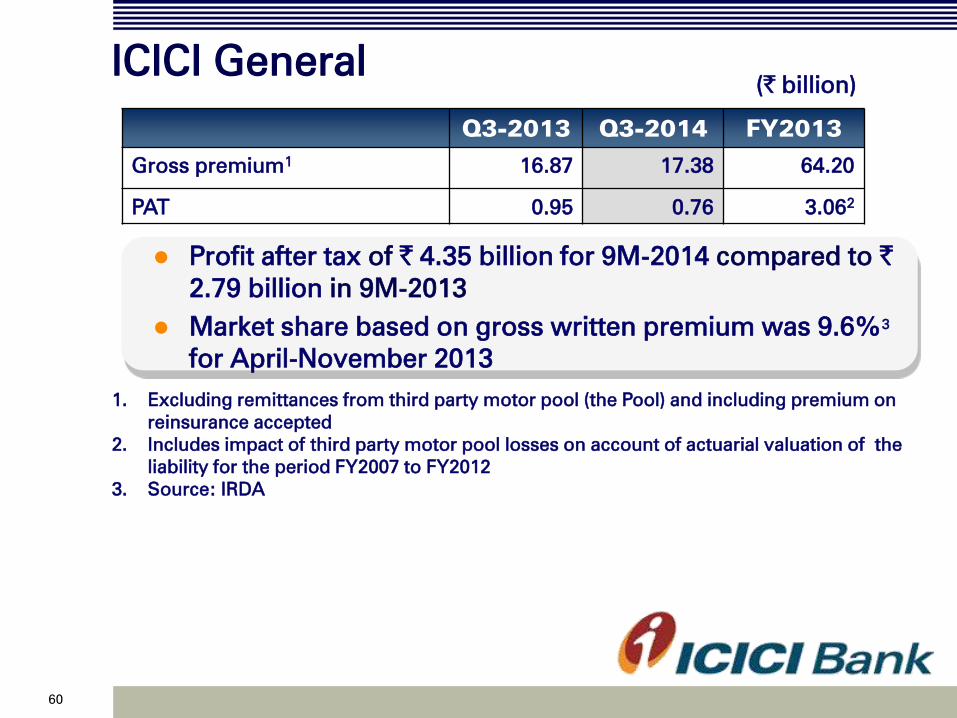
ICICI General
1. Excluding remittances from third party motor pool (the Pool) and including premium on
reinsurance accepted
2. Includes impact of third party motor pool losses on account of actuarial valuation of the
liability for the period FY2007 to FY2012
3. Source: IRDA
Q3-2013 Q3-2014 FY2013
Gross premium1
16.87 17.38 64.20
PAT 0.95 0.76 3.062
Profit after tax of ` 4.35 billion for 9M-2014 compared to `
2.79 billion in 9M-2013
Market share based on gross written premium was 9.6%3
for April-November 2013
(` billion)
61
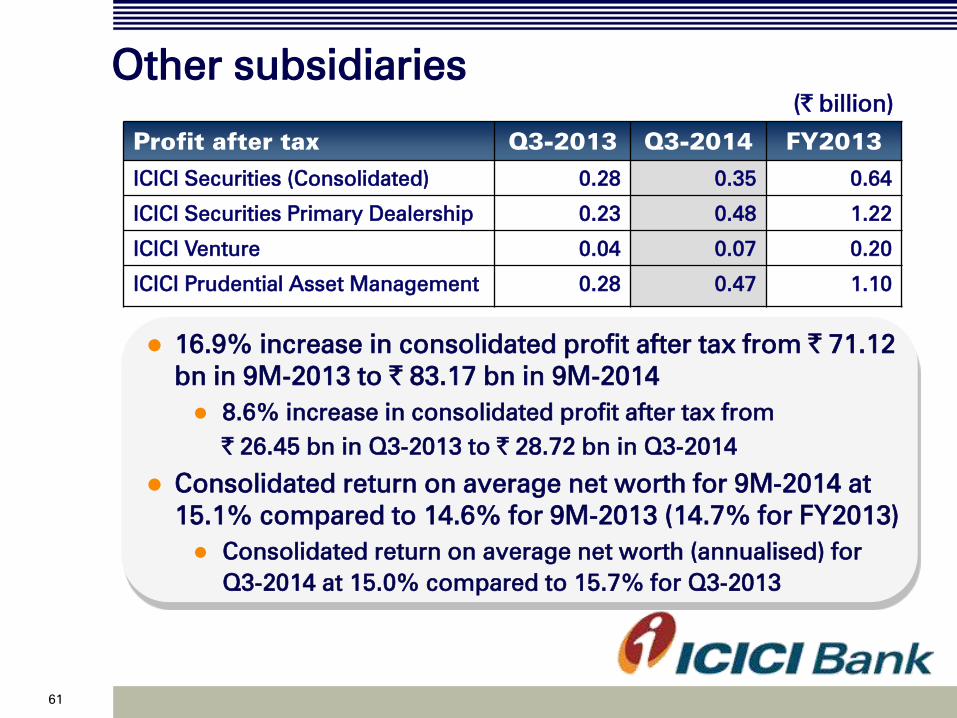
Other subsidiaries
Profit after tax Q3-2013 Q3-2014 FY2013
ICICI Securities (Consolidated) 0.28 0.35 0.64
ICICI Securities Primary Dealership 0.23 0.48 1.22
ICICI Venture 0.04 0.07 0.20
ICICI Prudential Asset Management 0.28 0.47 1.10
16.9% increase in consolidated profit after tax from ` 71.12
bn in 9M-2013 to ` 83.17 bn in 9M-2014
8.6% increase in consolidated profit after tax from
` 26.45 bn in Q3-2013 to ` 28.72 bn in Q3-2014
Consolidated return on average net worth for 9M-2014 at
15.1% compared to 14.6% for 9M-2013 (14.7% for FY2013)
Consolidated return on average net worth (annualised) for
Q3-2014 at 15.0% compared to 15.7% for Q3-2013
(` billion)
62
Key ratios
63
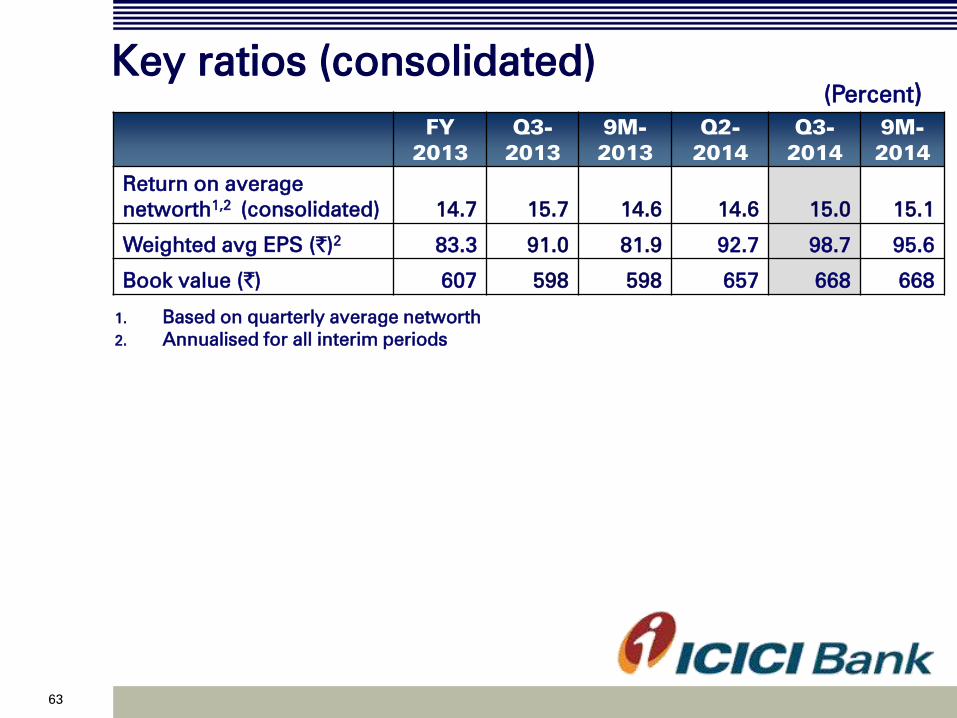
Key ratios (consolidated)
FY
2013
Q3-
2013
9M-
2013
Q2-
2014
Q3-
2014
9M-
2014
Return on average
networth1,2
(consolidated) 14.7 15.7 14.6 14.6 15.0 15.1
Weighted avg EPS (`)2
83.3 91.0 81.9 92.7 98.7 95.6
Book value (`)
607 598 598 657 668 668
(Percent)
1. Based on quarterly average networth
2. Annualised for all interim periods
64
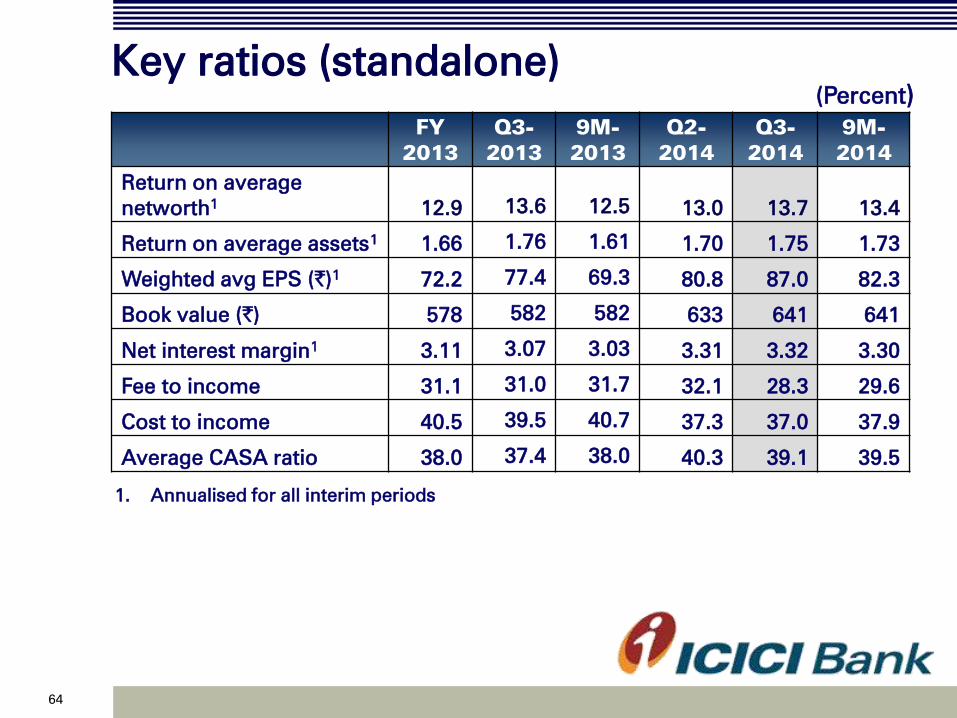
Key ratios (standalone)
FY
2013
Q3-
2013
9M-
2013
Q2-
2014
Q3-
2014
9M-
2014
Return on average
networth1
12.9 13.6 12.5 13.0 13.7 13.4
Return on average assets1
1.66 1.76 1.61 1.70 1.75 1.73
Weighted avg EPS (`)1
72.2 77.4 69.3 80.8 87.0 82.3
Book value (`)
578 582 582 633 641 641
Net interest margin1 3.11 3.07 3.03 3.31 3.32 3.30
Fee to income 31.1 31.0 31.7 32.1 28.3 29.6
Cost to income 40.5 39.5 40.7 37.3 37.0 37.9
Average CASA ratio 38.0 37.4 38.0 40.3 39.1 39.5
(Percent)
1. Annualised for all interim periods