ICICI Direct - Oil India Limited - Initiating Coverage
20
July 1, 2010 ICICIdirect.com | Equity Research Initiating Coverage Government reforms to drive earnings… Oil India, a Navratna PSU, is engaged in exploration, development, production and transportation of crude oil and natural gas in India and abroad. We expect Oil India to report a CAGR of 10.6% and 17.8%, in revenues and net profit, respectively, over FY10-12E on the back of an increase in APM gas prices and steady growth in crude oil and natural gas production. Oil India’s strong resource base and new discoveries could lead to upgradation of valuations, going forward. The reforms by the Indian government in the pricing of petroleum products would also add significantly to the earnings of the company. We are initiating coverage on Oil India with an ADD rating and a target price of Rs 1526. Strong resource base and steady increase in oil and gas production Oil India is India’s second largest PSU E&P player with a total area of 1,69,537 sq km under acreage in India and abroad. Oil India has 2P oil reserves of 575.4 million barrels and 2P gas reserves of 63.4 billion cubic meters. It has aggressive investment plans in exploration activities of Rs 1,527.8 crore and Rs 1,912 crore in FY11E and FY12E, respectively. Upgradation of the resource base and new discoveries would be positive triggers for the stock, going forward. We expect its oil sales to report a CAGR of 5% over FY10-12E from 25.8 mmboe in FY10 to 28.4 mmboe in FY12E. We also expect natural gas to report robust sales growth of 13.6% CAGR over FY10-12E from 1.9 bcm in FY10 to 2.4 bcm in FY12E. Government reforms in petroleum products and APM gas pricing Oil India is a major beneficiary of government reforms in the pricing of petroleum products. Deregulation of petrol prices and price hike in other petroleum products (diesel, LPG and kerosene) would add significantly to its earnings. Also, the increase in APM gas prices from Rs 3,200 tscm (US$1.79 per mmbtu) to Rs 6,818 per tscm (US$3.81 per mmbtu) approved by the Indian Government would increase Oil India’s earnings by Rs 13.5 per share. Valuations We believe Oil India’s large reserve base and new discoveries would create value for investors, going ahead. Oil India is trading at 10.3x FY11E and 9.5x FY12E EPS of Rs 138.7 and Rs 150.6, respectively. We are initiating coverage on the stock with an ADD rating and price target of Rs 1526 based on 11x FY11E EPS. Exhibit 1: Key Financials Year to March 31 FY08 FY09 FY10E FY11E FY12E Revenues (Rs Crore) 6240.8 7414.3 8072.8 9127.5 9875.0 EBITDA (Rs Crore) 2635.8 3420.2 3875.6 4694.1 5072.5 Net Profit (Rs Crore) 1788.9 2161.7 2610.5 3335.5 3621.1 Shares in Issue (In Crore) 21.4 21.4 24.0 24.0 24.0 EPS (Rs) 83.6 101.0 108.6 138.7 150.6 P/E (x) 17.2 14.2 13.2 10.3 9.5 Price/Book Value (x) 3.9 3.3 2.5 2.1 1.9 EV/EBITDA (x) 10.1 7.2 6.7 5.2 4.7 RONW (%) 22.6 23.2 19.0 20.7 19.5 ROCE (%) 27.0 28.5 22.6 24.7 23.0 Source: Company, ICICIdirect.com Research Oil India Limited (OILIND) Rs 1435 Rating Matrix Rating : Add Target : Rs 1526 Target Period : 12 months Potential Upside : 6% YoY Growth (%) FY09 FY10 FY11E FY12E Net Sales 18.8 8.9 13.1 8.2 EBITDA 29.8 13.3 21.1 8.1 Net Profit 20.8 20.8 27.8 8.6 Stock Data Bloomberg Code OINL IN Reuters Code OILI.BO Face value (Rs) 10 Promoters Holding 78% Market Cap (Rs cr) 34505 52 week H/L 1443 / 1048 Sensex 17506 Average volumes 26222 Comparative return matrix (%) Company 1M 3M 6M 12M Oil India 8 21 9 NA ONGC 12 17 6 21 Cairn India 9 6 11 33 Reliance Industries 4 -3 -1 5 Price movement (Stock vs. Nifty) 0 300 600 900 1200 1500 Sep -0 9 Nov -09 Ja n- 10 Mar -1 0 May- 10 0 1200 2400 3600 4800 6000 Stock Nifty Analyst’s name Mayur Matani [email protected]
-
Upload
communicatedeepak -
Category
Documents
-
view
218 -
download
0
Transcript of ICICI Direct - Oil India Limited - Initiating Coverage
8/8/2019 ICICI Direct - Oil India Limited - Initiating Coverage
http://slidepdf.com/reader/full/icici-direct-oil-india-limited-initiating-coverage 1/20

8/8/2019 ICICI Direct - Oil India Limited - Initiating Coverage
http://slidepdf.com/reader/full/icici-direct-oil-india-limited-initiating-coverage 2/20

8/8/2019 ICICI Direct - Oil India Limited - Initiating Coverage
http://slidepdf.com/reader/full/icici-direct-oil-india-limited-initiating-coverage 3/20
Oil India Limited (OILIND)
ICICIdirect.com | Equity Research Page 3
Investment Rationale
Oil India, a Navratna PSU, is engaged in exploration, development,production and transportation of crude oil and natural gas in India andabroad. Oil India’s strong resource base and new discoveries would leadto upgradation in valuations, going forward. The reforms by the Indiangovernment in the pricing of petroleum products would addsignificantly to the earnings of the company. We expect Oil India toreport strong earnings growth over FY10-12E on the back of an increasein APM gas prices, reforms in petroleum products pricing and steadygrowth in crude oil and natural gas production. We expect Oil India’s oilsales to report a CAGR of 5% over FY10-12E from 25.8 mmboe in FY10to 28.4 mmboe in FY12E. We also expect natural gas to report robustsales growth of 13.6% CAGR over FY10-12E from 1.9 bcm in FY10 to 2.4bcm in FY12E. This would increase Oil India’s revenues at 10.6% CAGRover FY10-12E from Rs 8,072.8 crore in FY10 to Rs 9,875 crore in FY12E.The net profit will increase at 17.8% CAGR over FY10-12E from Rs
2,610.5 crore in FY10 to Rs 3,621.1 crore in FY12E. Both Oil India andONGC are trading at an enterprise value (EV) of US$5.8 per barrel.However, Oil India trades at a P/E of 13.2x FY10 EPS, an 8.3% discountto ONGC’s P/E of 14.4x. Oil India is trading at 10.3x FY11E and 9.5xFY12E EPS of Rs 138.7 and Rs 150.6, respectively. We are initiatingcoverage on the stock with an ADD rating and a price target of Rs 1,526based on 11x FY11E EPS.
Strong resource base and new discoveries - Positive triggers for Oil IndiaOil India is India’s second largest PSU E&P player with a total area of1,27,881 sq km and 41,656 sq km under domestic and internationalacreage, respectively. Oil India has interests in 23 domestic exploration
blocks through National Exploration Licensing Policy (NELP). It has alsobeen provisionally awarded nine blocks under NELP VIII. Internationally,Oil India has exploratory activities in Egypt, Iran, Gabon, Libya, Nigeria,Timor Leste, Venezuela and Yemen. Oil India has aggressive investmentplans in exploration activities of Rs 1,527.8 crore and Rs 1,912 crore inFY11E and FY12E, respectively. We believe upgradation of the resourcebase and new discoveries of oil and natural gas reserves would bepositive triggers for the stock, going forward.
Exhibit 3: Oil India’s domestic exploration and development assets
Source: Company, ICICIdirect.com Research
Oil India has interest in 23 domestic NELP explorationblocks and two pre-NELP joint venture blocks covering atotal area of 1,20,551 sq km under acreage. Oil India hasadditional 7,330 sq km under acreage from the nominatedblocks

8/8/2019 ICICI Direct - Oil India Limited - Initiating Coverage
http://slidepdf.com/reader/full/icici-direct-oil-india-limited-initiating-coverage 4/20
Oil India Limited (OILIND)
ICICIdirect.com | Equity Research Page 4
Exhibit 4: Oil India’s domestic exploratory assetsBlock Onshore / Offshore Area (sq. kms.) OIL's Interest Operator
Pre-NELP blocks
AAP-ON-94/1 Onshore 305 16.1% HOEC
GK-OSJ-3 Offshore 5725 15.0% RIL
NELP blocks
AA-ONN-2001/3 Onshore 110 15% ONGCAA-ONN-2002/3 Onshore 1460 20% OIL
AA-ONN-2002/4 Onshore 1060 10% ONGC
AA-ONN-2003/3 Onshore 275 85% OIL
AA-ONN-2004/1 Onshore 144 85% OIL
AA-ONN-2004/2 Onshore 218 90% OIL
AA-ONN-2005/1 Onshore 363 30% ONGC
AN-DWN-2005/1 Offshore 11837 10% ONGC
CY-DWN-2001/1 Offshore 12425 20% ONGC
KG-DWN-2002/1 Offshore 10600 20% ONGC
KG-DWN-2004/5 Offshore 11922 10% ONGC
KG-DWN-2004/6 Offshore 10907 10% ONGC
KG-DWN-98/4 Offshore 4970 15% ONGCKG-ONN-2004/1 Onshore 549 90% OIL
MN-DWN-2002/1 Offshore 9980 20% ONGC
MN-OSN-2000/2 Offshore 4061 20% ONGC
MZ-ONN-2004/1 Onshore 3213 75% OIL
RJ-ONN-2000/1 Onshore 1268 60% OIL
RJ-ONN-2002/1 Onshore 7425 60% OIL
RJ-ONN-2004/2 Onshore 2196 75% OIL
RJ-ONN-2004/3 Onshore 1330 60% OIL
RJ-ONN-2005/2 Onshore 1517 60% OIL
WB-ONN-2005/2 Onshore 3940 25% ONGC
Source: Company, ICICIdirect.com Research
Exhibit 5: Oil India’s overseas exploration and development assets
Block Onshore / Offshore Area (sq. kms.) Country OIL’s interest Operator
Block 3 Onshore 8287 Egypt 25% GSPC
Block 4 Onshore 2600 Egypt 25% GSPC
Shakti Onshore 3761 Gabon 45% OIL
Farsi Offshore 3500 Iran 20% OVL
Area 86 Onshore 7087 Libya 50% OIL
Area 102/4 Onshore 2710 Libya 50% OIL
Area 95/96 Onshore 6629 Libya 25% SIPEX
OPL-205 Onshore 2094 Nigeria 18% Summit OilBlock K Onshore 2384 Timor-Leste 13% Reliance
Block 82 Onshore 1857 Yemen 15% Medco Amed
Block 83 Onshore 364 Yemen 15% Medco Arat
Source: Company, ICICIdirect.com Research
Oil India has aggressive exploration investment plans inAssam, Arunachal Pradesh, KG basin and Rajasthanthrough various blocks acquired in the NELP rounds
Oil India has a strong international presence in countrieslike Egypt, Iran, Gabon, Libya, Nigeria, Timor Leste,Venezuela and Yemen
8/8/2019 ICICI Direct - Oil India Limited - Initiating Coverage
http://slidepdf.com/reader/full/icici-direct-oil-india-limited-initiating-coverage 5/20
Oil India Limited (OILIND)
ICICIdirect.com | Equity Research Page 5
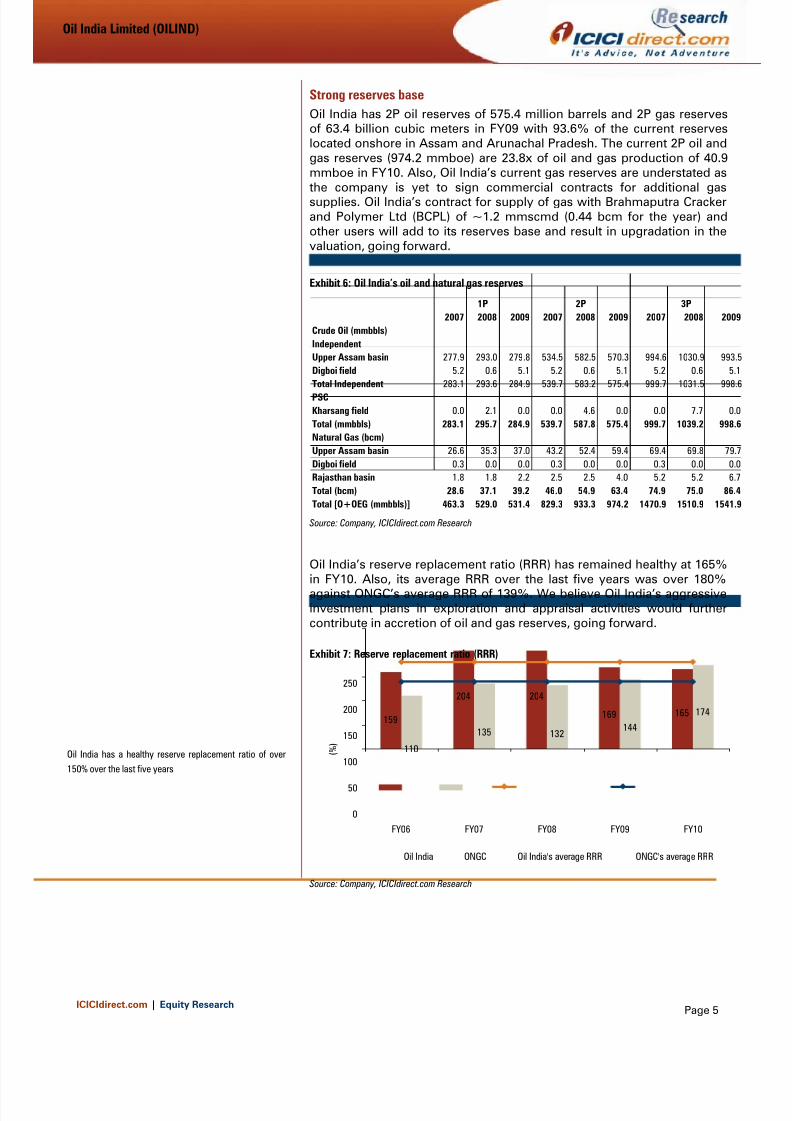
Strong reserves baseOil India has 2P oil reserves of 575.4 million barrels and 2P gas reservesof 63.4 billion cubic meters in FY09 with 93.6% of the current reserveslocated onshore in Assam and Arunachal Pradesh. The current 2P oil andgas reserves (974.2 mmboe) are 23.8x of oil and gas production of 40.9mmboe in FY10. Also, Oil India’s current gas reserves are understated asthe company is yet to sign commercial contracts for additional gassupplies. Oil India’s contract for supply of gas with Brahmaputra Crackerand Polymer Ltd (BCPL) of ~1.2 mmscmd (0.44 bcm for the year) andother users will add to its reserves base and result in upgradation in thevaluation, going forward.
Exhibit 6: Oil India’s oil and natural gas reserves
2007 2008 2009 2007 2008 2009 2007 2008 2009Crude Oil (mmbbls)IndependentUpper Assam basin 277.9 293.0 279.8 534.5 582.5 570.3 994.6 1030.9 993.5Digboi field 5.2 0.6 5.1 5.2 0.6 5.1 5.2 0.6 5.1Total Independent 283.1 293.6 284.9 539.7 583.2 575.4 999.7 1031.5 998.6PSCKharsang field 0.0 2.1 0.0 0.0 4.6 0.0 0.0 7.7 0.0Total (mmbbls) 283.1 295.7 284.9 539.7 587.8 575.4 999.7 1039.2 998.6Natural Gas (bcm)Upper Assam basin 26.6 35.3 37.0 43.2 52.4 59.4 69.4 69.8 79.7Digboi field 0.3 0.0 0.0 0.3 0.0 0.0 0.3 0.0 0.0Rajasthan basin 1.8 1.8 2.2 2.5 2.5 4.0 5.2 5.2 6.7Total (bcm) 28.6 37.1 39.2 46.0 54.9 63.4 74.9 75.0 86.4Total [O+OEG (mmbbls)] 463.3 529.0 531.4 829.3 933.3 974.2 1470.9 1510.9 1541.9
1P 2P 3P
Source: Company, ICICIdirect.com Research
Oil India’s reserve replacement ratio (RRR) has remained healthy at 165%in FY10. Also, its average RRR over the last five years was over 180%against ONGC’s average RRR of 139%. We believe Oil India’s aggressiveinvestment plans in exploration and appraisal activities would furthercontribute in accretion of oil and gas reserves, going forward.
Exhibit 7: Reserve replacement ratio (RRR)
159
204 204
169
135 132 144
174165
110
0
50
100
150
200
250
FY06 FY07 FY08 FY09 FY10
( % )
Oil India ONGC Oil India's average RRR ONGC's average RRR
Source: Company, ICICIdirect.com Research
Oil India has a healthy reserve replacement ratio of over150% over the last five years

8/8/2019 ICICI Direct - Oil India Limited - Initiating Coverage
http://slidepdf.com/reader/full/icici-direct-oil-india-limited-initiating-coverage 6/20
Oil India Limited (OILIND)
ICICIdirect.com | Equity Research Page 6
Stable growth in crude oil sales volumeWe expect Oil India’s oil sales to report a CAGR of 5% over FY10-12E
from 25.8 mmboe in FY10 to 28.4 mmboe in FY12E on capacityaugmentation and implementation of enhanced oil recovery (EOR)techniques in matured fields. The small to medium oil discoveries innominated fields would also add to the volumes in the next two or threeyears.
Exhibit 8: Stable growth in crude oil sales volume
22.324.7 25.8 27.0 28.4
0
7
14
21
28
35
FY08 FY09 FY10 FY11E FY12E
m m
b o e
Source: Company, ICICIdirect.com Research
Net crude oil realisations to increase marginally over the next two yearsWe believe Oil India’s net crude oil realisations would increase marginally
from US$58.6 per barrel in FY10 to US$60.6 per barrel in FY12E onaccount of government reforms in the pricing of petroleum products andhigher crude oil prices. We have modelled Brent crude oil prices of US$80per barrel from FY11 onwards. We expect Oil India to bear the subsidy ofRs 2,645 crore (US$21.5 per barrel) and Rs 2,472.5 crore (US$19.4 perbarrel) in FY11E and FY12E, respectively.
Exhibit 9: Oil India’s crude oil gross and net realisations
85.5
71.280.0 80.0
60.555.6
58.6 58.5 60.6
81.7
0
20
40
60
80
100
FY08 FY09 FY10 FY11E FY12E
$ / b a r r e l
0
6
12
18
24
30
$ / b a r r e l
Gross Realised Price Realised Price after Subsidy / DiscountSubsidy / Discount (RHS)
Source: Company, ICICIdirect.com Research
Oil India’s crude oil sales will increase from 25.8 mmboe inFY10 to 28.4 mmboe in FY12E at 5% CAGR over FY10-12Eon application of enhanced oil recovery (EOR) techniques
Oil India’s net crude oil realisations would increasemarginally from US$58.6 per barrel in FY10 to US$60.6 perbarrel in FY12E on account of government reforms in thepricing of petroleum products and higher crude oil prices

8/8/2019 ICICI Direct - Oil India Limited - Initiating Coverage
http://slidepdf.com/reader/full/icici-direct-oil-india-limited-initiating-coverage 7/20
Oil India Limited (OILIND)
ICICIdirect.com | Equity Research Page 7
Robust increase in natural gas sales volumeOil India’s natural gas sales volume would report robust growth onaccount of additional supplies of ~1 mmscmd (0.37 bcm) and ~1.2mmscmd (0.44 bcm) to Numaligarh Refinery Limited (NRL) andBrahmaputra Cracker and Polymer Ltd (BCPL), respectively. We expectthe company to start supplies to NRL in FY11E and BCPL from April 2012onwards. We expect Oil India’s natural gas sales volume to increase at13.6% CAGR over FY10-12E from 1.9 bcm (5.1 mmscmd) in FY10 to 2.4bcm (6.6 mmscmd) in FY12E.
Exhibit 10: Oil India’s natural gas sales volume
1.8 1.71.9
2.22.4
0.0
0.5
1.0
1.5
2.0
2.5
3.0
FY08 FY09 FY10 FY11E FY12E
b c m
Source: Company, ICICIdirect.com Research
APM gas price hike to improve gas sales realisationOil India’s natural gas sales realisation would increase by 63.6% from Rs3,446.8 per tscm in FY10 to Rs 5640.3 per tscm in FY12E on account of anincrease in APM gas prices. This increase in APM gas prices wasapproved by the Indian government from Rs 3,200 tscm (US$1.79 permmbtu) to Rs 6,818 per tscm (US$ 3.81 per mmbtu). This would increaseOil India’s earnings by Rs 13.5 per share.
Exhibit 11: Natural gas sales realisation
2430.2 2580.7
3446.8
5286.85640.3
0
1200
2400
3600
4800
6000
FY08 FY09 FY10 FY11E FY12E
R s
/ t s c m
Source: Company, ICICIdirect.com Research
Oil India’s natural gas sales will increase from 1.9 bcm in
FY10 to 2.4 bcm in FY12E at 13.6% CAGR over FY10-12Emainly on account of increased gas supplies to NumaligarhRefinery Ltd (NRL)
The increase in APM gas prices was approved by theIndian government from Rs 3,200 tscm to Rs 6,818 pertscm. This would increase Oil India’s earnings by Rs 13.5per share

8/8/2019 ICICI Direct - Oil India Limited - Initiating Coverage
http://slidepdf.com/reader/full/icici-direct-oil-india-limited-initiating-coverage 8/20
Oil India Limited (OILIND)
ICICIdirect.com | Equity Research Page 8
Aggressive investment plans in exploration and development activitiesOil India has aggressive investment plans of Rs 1,527.8 crore and Rs 1,912crore in FY11E and FY12E, respectively, on exploration and appraisalactivities. The company plans to drill 46 exploratory wells, 22 each innominated and NELP blocks and two overseas blocks in FY11E. Ondevelopment activities, Oil India plans to spend Rs 552.7 crore and Rs988.8 crore in FY11E and FY12E, respectively. The company plans to drill46 wells in nominated blocks and four wells in NELP blocks in FY11E fordevelopment activities. We believe these investments will result in newdiscoveries, upgradation in reserves and increased oil and natural gasproduction in future.
Exhibit 12: Oil India’s investment plans
850.81527.8
1912.0381.3
552.7988.8
252.4
342.3
269.31484.4
2349.8
3243.1
0
800
1600
2400
3200
4000
FY10 FY11E FY12E
R s
C r o r e
Exploration and appraisal activities Development activities Purchase of capital equipments & facilities
Source: Company, ICICIdirect.com Research
Government reforms in petroleum products pricing
Oil India is a major beneficiary of government reforms in the pricing ofpetroleum products. The Indian Government has decided to completelyderegulate petrol prices and hiked diesel, kerosene and LPG prices by Rs2 per litre, Rs 3 per litre and Rs 35 per cylinder, respectively. Thegovernment has also decided to deregulate diesel prices over anundisclosed period of time. This reform by the Empowered Group ofMinisters (EGOM) would reduce the under recoveries of the sector from~Rs 77,000 crore to ~Rs 53,000 crore at crude oil prices of US$75 perbarrel. However, the subsidy sharing mechanism between companies andgovernment is yet to be decided by the government. We have assumedupstream companies’ share of 33.33% of the total under recoveries. Thisis in line with the historical ratio shared by them.
Exhibit 13: Under recoveries of oil and gas sector (Rs Crore)
Petroleum Products Earlier Now SavingsPetrol 7500 0 7500Diesel 25700 15000 10700Kersone 19900 17000 2900LPG 23900 21000 2900Total 77000 53000 24000
Source: ICICIdirect.com Research
Oil India has aggressive investment plans of Rs 2,349.8crore and Rs 3,243.1 crore in FY11E and FY12E,respectively, on capital equipment and exploratory anddevelopment activities
Reforms by the Indian government would reduce the underrecoveries by ~Rs 24,000 crore at crude oil prices ofUS$75 per barrel
8/8/2019 ICICI Direct - Oil India Limited - Initiating Coverage
http://slidepdf.com/reader/full/icici-direct-oil-india-limited-initiating-coverage 9/20
Oil India Limited (OILIND)
ICICIdirect.com | Equity Research Page 9
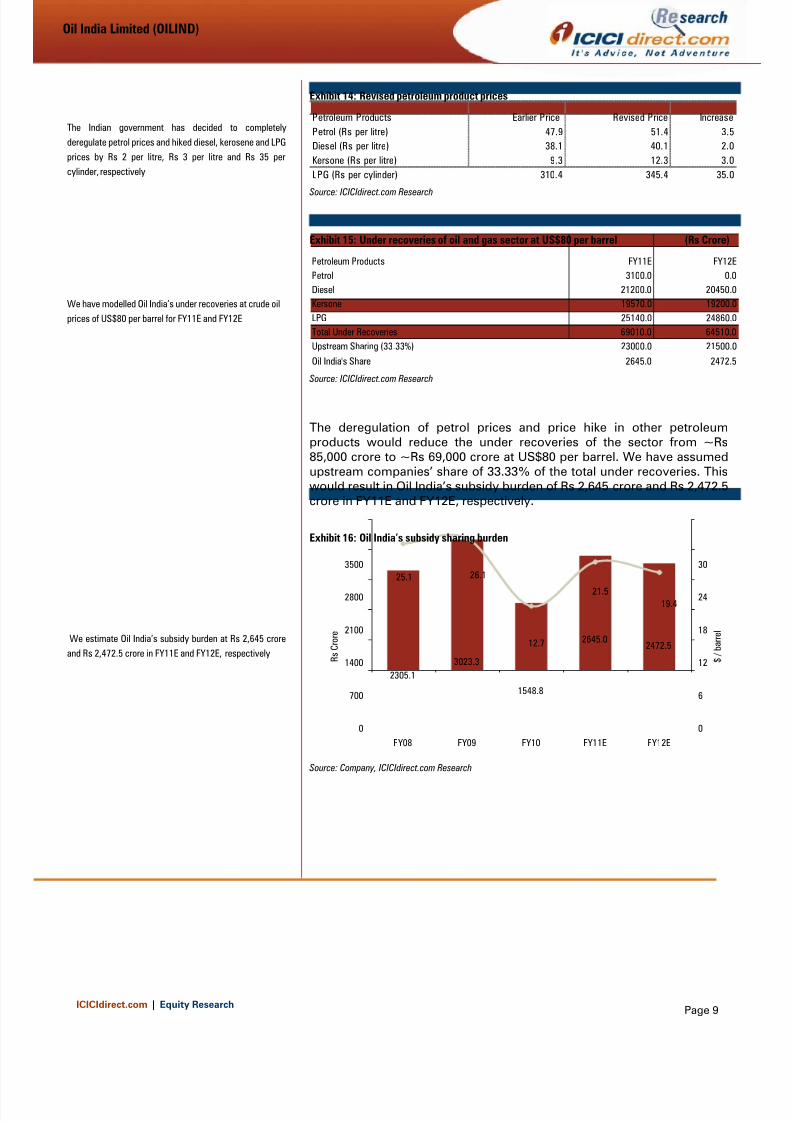
Exhibit 14: Revised petroleum product prices
Petroleum Products Earlier Price Revised Price IncreasePetrol (Rs per litre) 47.9 51.4 3.5Diesel (Rs per litre) 38.1 40.1 2.0Kersone (Rs per litre) 9.3 12.3 3.0LPG (Rs per cylinder) 310.4 345.4 35.0
Source: ICICIdirect.com Research
Exhibit 15: Under recoveries of oil and gas sector at US$80 per barrel (Rs Crore)
Petroleum Products FY11E FY12EPetrol 3100.0 0.0Diesel 21200.0 20450.0Kersone 19570.0 19200.0LPG 25140.0 24860.0Total Under Recoveries 69010.0 64510.0Upstream Sharing (33.33%) 23000.0 21500.0
Oil India's Share 2645.0 2472.5 Source: ICICIdirect.com Research
The deregulation of petrol prices and price hike in other petroleumproducts would reduce the under recoveries of the sector from ~Rs85,000 crore to ~Rs 69,000 crore at US$80 per barrel. We have assumedupstream companies’ share of 33.33% of the total under recoveries. Thiswould result in Oil India’s subsidy burden of Rs 2,645 crore and Rs 2,472.5crore in FY11E and FY12E, respectively.
Exhibit 16: Oil India’s subsidy sharing burden
2472.52645.0
1548.8
3023.32305.1
19.421.5
12.7
26.125.1
0
700
1400
2100
2800
3500
FY08 FY09 FY10 FY11E FY12E
R s
C r o r e
0
6
12
18
24
30
$ / b a r r e
l
Source: Company, ICICIdirect.com Research
The Indian government has decided to completelyderegulate petrol prices and hiked diesel, kerosene and LPGprices by Rs 2 per litre, Rs 3 per litre and Rs 35 percylinder, respectively
We have modelled Oil India’s under recoveries at crude oilprices of US$80 per barrel for FY11E and FY12E
We estimate Oil India’s subsidy burden at Rs 2,645 croreand Rs 2,472.5 crore in FY11E and FY12E, respectively
8/8/2019 ICICI Direct - Oil India Limited - Initiating Coverage
http://slidepdf.com/reader/full/icici-direct-oil-india-limited-initiating-coverage 10/20
Oil India Limited (OILIND)
ICICIdirect.com | Equity Research Page 10
Risks and concerns
Decline in crude oil prices and volatile exchange rates
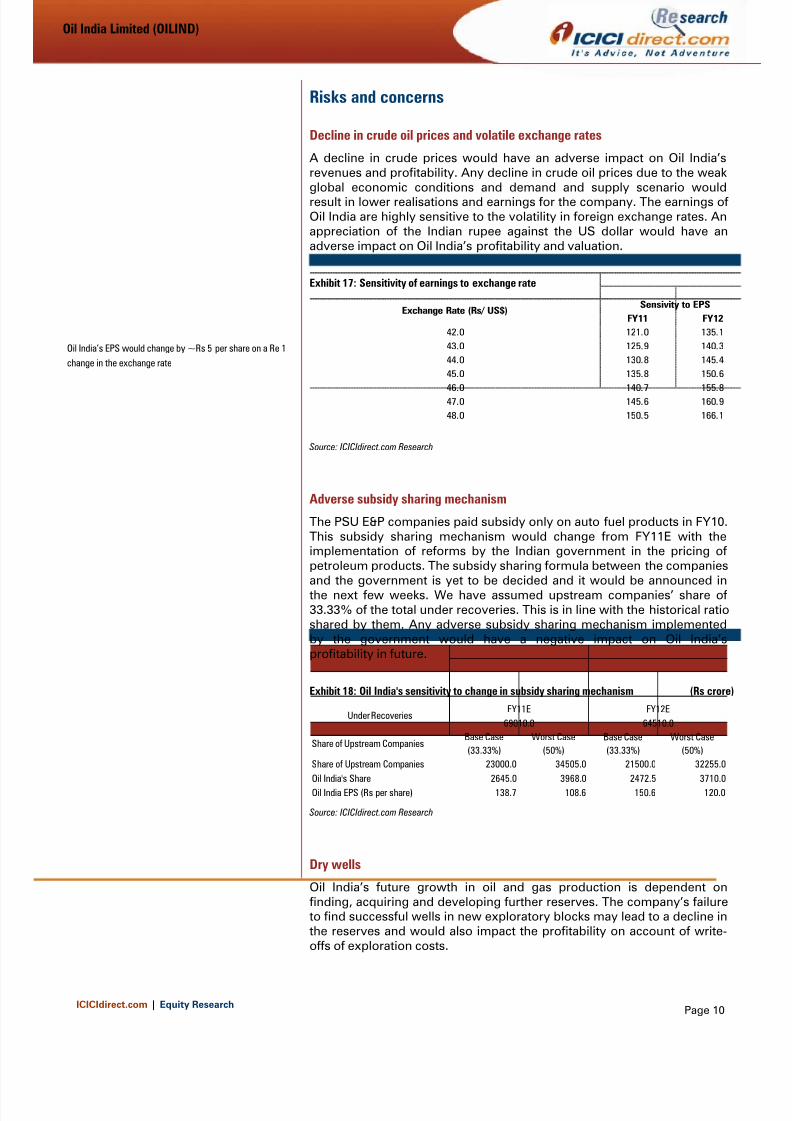
A decline in crude prices would have an adverse impact on Oil India’srevenues and profitability. Any decline in crude oil prices due to the weakglobal economic conditions and demand and supply scenario wouldresult in lower realisations and earnings for the company. The earnings ofOil India are highly sensitive to the volatility in foreign exchange rates. Anappreciation of the Indian rupee against the US dollar would have anadverse impact on Oil India’s profitability and valuation.
Exhibit 17: Sensitivity of earnings to exchange rate
FY11 FY1242.0 121.0 135.1
43.0 125.9 140.3
44.0 130.8 145.4
45.0 135.8 150.6
46.0 140.7 155.8
47.0 145.6 160.9
48.0 150.5 166.1
Exchange Rate (Rs/ US$) Sensivity to EPS
Source: ICICIdirect.com Research
Adverse subsidy sharing mechanism
The PSU E&P companies paid subsidy only on auto fuel products in FY10.This subsidy sharing mechanism would change from FY11E with theimplementation of reforms by the Indian government in the pricing ofpetroleum products. The subsidy sharing formula between the companiesand the government is yet to be decided and it would be announced inthe next few weeks. We have assumed upstream companies’ share of33.33% of the total under recoveries. This is in line with the historical ratioshared by them. Any adverse subsidy sharing mechanism implementedby the government would have a negative impact on Oil India’sprofitability in future.
Exhibit 18: Oil India's sensitivity to change in subsidy sharing mechanism (Rs crore)
Share of Upstream CompaniesBase Case(33.33%)
Worst Case(50%)
Base Case(33.33%)
Worst Case(50%)
Share of Upstream Companies 23000.0 34505.0 21500.0 32255.0Oil India's Share 2645.0 3968.0 2472.5 3710.0Oil India EPS (Rs per share) 138.7 108.6 150.6 120.0
Under Recoveries
69010.0 64510.0
FY11E FY12E
Source: ICICIdirect.com Research
Dry wells
Oil India’s future growth in oil and gas production is dependent on finding, acquiring and developing further reserves. The company’s failureto find successful wells in new exploratory blocks may lead to a decline inthe reserves and would also impact the profitability on account of write-offs of exploration costs.
Oil India’s EPS would change by ~Rs 5 per share on a Re 1
change in the exchange rate

8/8/2019 ICICI Direct - Oil India Limited - Initiating Coverage
http://slidepdf.com/reader/full/icici-direct-oil-india-limited-initiating-coverage 11/20
Oil India Limited (OILIND)
ICICIdirect.com | Equity Research Page 11
Risks brought about by asset concentration
Total 93.6% of Oil India’s current estimated oil and natural gas reservesand cross-country pipelines are located onshore in Assam and ArunachalPradesh. Any catastrophic events in Oil India’s area of operations willhave a material adverse effect on the business and profitability of the
company.

8/8/2019 ICICI Direct - Oil India Limited - Initiating Coverage
http://slidepdf.com/reader/full/icici-direct-oil-india-limited-initiating-coverage 12/20
Oil India Limited (OILIND)
ICICIdirect.com | Equity Research Page 12
FinancialsStable growth in revenues
We expect Oil India’s revenues to increase from Rs 8,072.8 crore in FY10to Rs 9,875 crore in FY12E at 10.6% CAGR over FY10-12E. Oil revenueswould increase from Rs 7,158.7 crore in FY10 to Rs 8,022.2 crore in FY12Emainly on account of an increase in oil sales from 25.8 mmboe in FY10 to28.4 mmboe in FY12E. Gas revenues would increase at 67.6% CAGR overFY10-12E from Rs 482.7 crore in FY10 to Rs 1,355.9 crore in FY12E. Thiswould be on account of an increase in gas sales volume from 1.9 bcm inFY10 to 2.4 bcm in FY12E and increase in net realisation from Rs 2,591.5per tscm in FY10 to Rs 5,640.3 per tscm in FY12E.
Exhibit 19: Projected revenue growth
6240.8
7414.38072.8
9127.59875.0
0
2000
4000
6000
8000
10000
FY08 FY09 FY10 FY11E FY12E
R s
C r o r e
Source: Company, ICICIdirect.com Research
Exhibit 20: Revenue break-up
Rs Crore % Rs Crore % Rs Crore % Rs Crore % Rs Crore %Oil 5441.8 87.2 6594.2 88.9 7158.7 88.7 7493.0 82.1 8022.2 81.2Gas 444.4 7.1 448.4 6.0 482.7 6.0 1160.9 12.7 1355.9 13.7LPG 78.3 1.3 90.3 1.2 76.3 0.9 83.1 0.9 83.1 0.8Transportation & Condensate 117.5 1.9 108.6 1.5 187.8 2.3 212.4 2.3 214.4 2.2Other Operating Income 158.8 2.5 172.9 2.3 167.3 2.1 178.1 2.0 199.4 2.0Total 6240.8 100.0 7414.3 100.0 8072.8 100.0 9127.5 100.0 9875.0 100.0
FY12EFY08 FY09 FY10 FY11E
Source: Company, ICICIdirect.com Research
Exhibit 21: Revenue break-up
0%
20%
40%
60%
80%
100%
FY08 FY09 FY10 FY11E FY12E
Oil Gas LPG Transportation & Condensate Other Operating Income
Source: Company, ICICIdirect.com Research
Oil India’s revenues would increase at 10.6% CAGR overFY10-12E mainly on account of an increase in crude oil andnatural gas sales volume and realisations
Contribution from natural gas sales will increase from 6% ofrevenues in FY10 to 13.7% of revenues in FY12E onaccount of an increase in APM gas prices
8/8/2019 ICICI Direct - Oil India Limited - Initiating Coverage
http://slidepdf.com/reader/full/icici-direct-oil-india-limited-initiating-coverage 13/20
Oil India Limited (OILIND)
ICICIdirect.com | Equity Research Page 13
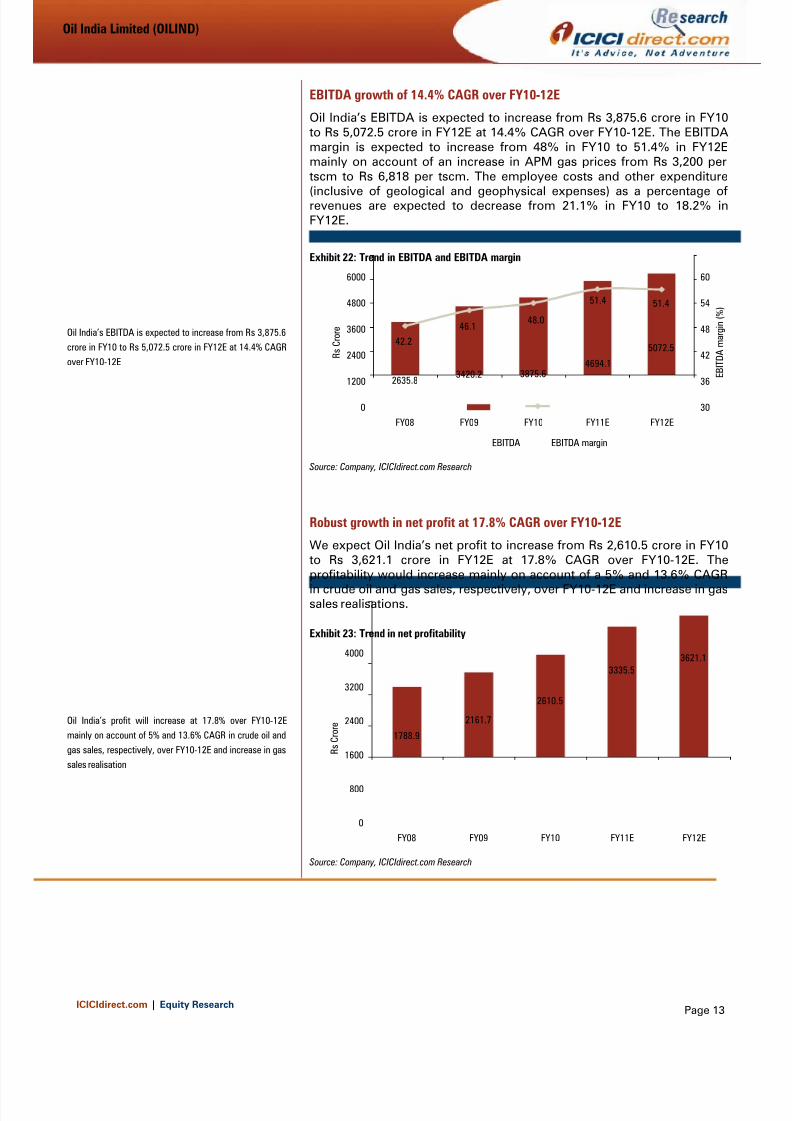
EBITDA growth of 14.4% CAGR over FY10-12E
Oil India’s EBITDA is expected to increase from Rs 3,875.6 crore in FY10to Rs 5,072.5 crore in FY12E at 14.4% CAGR over FY10-12E. The EBITDAmargin is expected to increase from 48% in FY10 to 51.4% in FY12Emainly on account of an increase in APM gas prices from Rs 3,200 per
tscm to Rs 6,818 per tscm. The employee costs and other expenditure(inclusive of geological and geophysical expenses) as a percentage ofrevenues are expected to decrease from 21.1% in FY10 to 18.2% inFY12E.
Exhibit 22: Trend in EBITDA and EBITDA margin
2635.83420.2 3875.6
4694.1
5072.542.2
46.148.0
51.4 51.4
0
1200
2400
3600
4800
6000
FY08 FY09 FY10 FY11E FY12E
R s
C r o r e
30
36
42
48
54
60
E B I T D A m a r g
i n ( % )
EBITDA EBITDA margin
Source: Company, ICICIdirect.com Research
Robust growth in net profit at 17.8% CAGR over FY10-12E
We expect Oil India’s net profit to increase from Rs 2,610.5 crore in FY10to Rs 3,621.1 crore in FY12E at 17.8% CAGR over FY10-12E. Theprofitability would increase mainly on account of a 5% and 13.6% CAGRin crude oil and gas sales, respectively, over FY10-12E and increase in gassales realisations.
Exhibit 23: Trend in net profitability
1788.9
2161.7
2610.5
3335.53621.1
0
800
1600
2400
3200
4000
FY08 FY09 FY10 FY11E FY12E
R s
C r o r e
Source: Company, ICICIdirect.com Research
Oil India’s EBITDA is expected to increase from Rs 3,875.6crore in FY10 to Rs 5,072.5 crore in FY12E at 14.4% CAGR
over FY10-12E
Oil India’s profit will increase at 17.8% over FY10-12Emainly on account of 5% and 13.6% CAGR in crude oil andgas sales, respectively, over FY10-12E and increase in gassales realisation

8/8/2019 ICICI Direct - Oil India Limited - Initiating Coverage
http://slidepdf.com/reader/full/icici-direct-oil-india-limited-initiating-coverage 14/20
Oil India Limited (OILIND)
ICICIdirect.com | Equity Research Page 14
Return on capital employed to improve marginally on higher investments
Oil India’s return on capital employed (RoCE) is expected to improvemarginally from 22.6% in FY10E to 23% in FY12E in spite of highergrowth in profitability on account of higher investments (Rs 3,439.8 croreover FY10-12E) in exploration and appraisal activities and high liquid
investments (~Rs 8,913.1 crore in FY10E) on its balance sheet. The returnon invested capital (RoIC) would still remain attractive at 56.1% in FY12E.The return on net worth (RoE) is expected to improve from 19% in FY10to 19.5% in FY12E.
Exhibit 24: Return ratios
57.3 56.1
23.024.722.628.527.0
22.6 23.2 19.0 20.7 19.5
68.163.7
80.5
0
20
40
60
80
100
FY08 FY09 FY10E FY11E FY12E
( % )
ROCE ROE ROIC
Source: Company, ICICIdirect.com Research
Oil India’s RoCE and RoE would increase marginally to 23%and 19.5%, respectively, in FY12E on account of higherinvestments in exploration activities and high liquidinvestments on its balance sheet

8/8/2019 ICICI Direct - Oil India Limited - Initiating Coverage
http://slidepdf.com/reader/full/icici-direct-oil-india-limited-initiating-coverage 15/20

8/8/2019 ICICI Direct - Oil India Limited - Initiating Coverage
http://slidepdf.com/reader/full/icici-direct-oil-india-limited-initiating-coverage 16/20
Oil India Limited (OILIND)
ICICIdirect.com | Equity Research Page 16
Financial summary
P&L statement
(Rs Crore)FY08 FY09 FY10E FY11E FY12E
Revenue 6240.8 7414.3 8072.8 9127.5 9875.0Growth (%) 18.8 8.9 13.1 8.2Op. Expenditure 3605.0 3994.1 4197.2 4433.4 4802.5EBITDA 2635.8 3420.2 3875.6 4694.1 5072.5Growth (%) 29.8 13.3 21.1 8.1Depreciation 442.8 748.0 763.8 709.7 802.9EBIT 2193.1 2672.2 3111.8 3984.4 4269.6Interest 34.4 8.7 3.7 3.4 3.4Other Income 554.7 723.6 786.9 853.0 981.8PBT 2713.4 3387.0 3895.1 4834.1 5248.0Growth (%) 24.8 15.0 24.1 8.6Tax 924.5 1225.3 1284.6 1498.6 1626.9Reported PAT 1788.9 2161.7 2610.5 3335.5 3621.1Growth (%) 20.8 20.8 27.8 8.6Adjustments 0.0 0.0 0.0 0.0 0.0Adj. Net Profit 1788.9 2161.7 2610.5 3335.5 3621.1Growth (%) 20.8 20.8 27.8 8.6
Key ratios (%)FY08 FY09 FY10E FY11E FY12E
Raw material costs 1.0 1.2 1.6 1.3 1.4Employees Cost 10.9 12.3 12.0 11.3 10.9Statutory Levies 36.2 29.9 29.2 29.1 29.0Other Expenditure 10.0 10.2 9.1 6.9 7.3Effective Tax rate 34.1 36.2 33.0 31.0 31.0Profitability ratios (%)EBITDA Margin 42.2 46.1 48.0 51.4 51.4PAT Margin 28.7 29.2 32.3 36.5 36.7Adj. PAT Margin 28.7 29.2 32.3 36.5 36.7Per share data (Rs)Revenue per share 291.6 346.5 335.7 379.6 410.7EV per share 1243.1 1154.0 1081.3 1024.8 994.4Book Value 370.7 436.0 572.4 669.0 772.8Cash per share 200.0 283.6 355.3 411.8 442.2EPS 83.6 101.0 108.6 138.7 150.6Cash EPS 104.3 136.0 140.3 168.2 184.0
DPS 27.5 30.5 34.0 36.0 40.0Costs as % to revenue except tax rate
8/8/2019 ICICI Direct - Oil India Limited - Initiating Coverage
http://slidepdf.com/reader/full/icici-direct-oil-india-limited-initiating-coverage 17/20
Oil India Limited (OILIND)
ICICIdirect.com | Equity Research Page 17
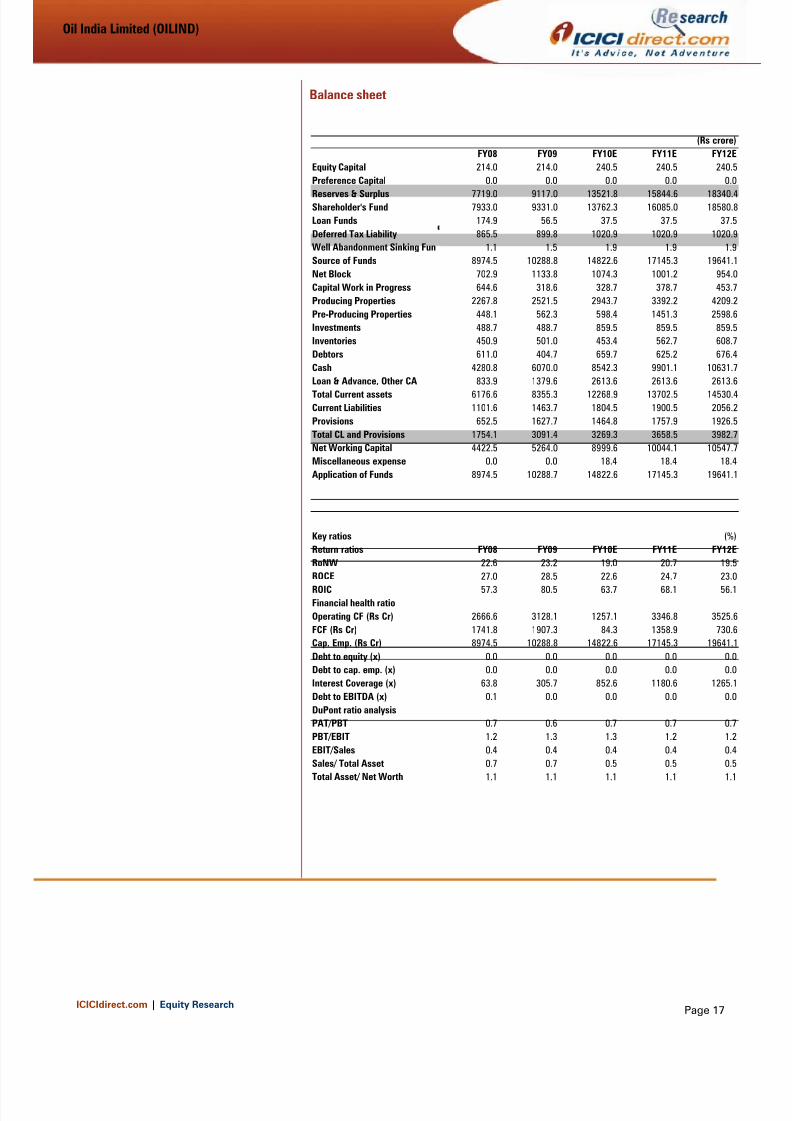
Balance sheet
(Rs crore)FY08 FY09 FY10E FY11E FY12E
Equity Capital 214.0 214.0 240.5 240.5 240.5
Preference Capital 0.0 0.0 0.0 0.0 0.0Reserves & Surplus 7719.0 9117.0 13521.8 15844.6 18340.4Shareholder's Fund 7933.0 9331.0 13762.3 16085.0 18580.8Loan Funds 174.9 56.5 37.5 37.5 37.5Deferred Tax Liability 865.5 899.8 1020.9 1020.9 1020.9Well Abandonment Sinking Fun 1.1 1.5 1.9 1.9 1.9Source of Funds 8974.5 10288.8 14822.6 17145.3 19641.1Net Block 702.9 1133.8 1074.3 1001.2 954.0Capital Work in Progress 644.6 318.6 328.7 378.7 453.7Producing Properties 2267.8 2521.5 2943.7 3392.2 4209.2Pre-Producing Properties 448.1 562.3 598.4 1451.3 2598.6Investments 488.7 488.7 859.5 859.5 859.5Inventories 450.9 501.0 453.4 562.7 608.7Debtors 611.0 404.7 659.7 625.2 676.4Cash 4280.8 6070.0 8542.3 9901.1 10631.7Loan & Advance, Other CA 833.9 1379.6 2613.6 2613.6 2613.6Total Current assets 6176.6 8355.3 12268.9 13702.5 14530.4Current Liabilities 1101.6 1463.7 1804.5 1900.5 2056.2Provisions 652.5 1627.7 1464.8 1757.9 1926.5Total CL and Provisions 1754.1 3091.4 3269.3 3658.5 3982.7Net Working Capital 4422.5 5264.0 8999.6 10044.1 10547.7Miscellaneous expense 0.0 0.0 18.4 18.4 18.4Application of Funds 8974.5 10288.7 14822.6 17145.3 19641.1
Key ratios (%)Return ratios FY08 FY09 FY10E FY11E FY12ERoNW 22.6 23.2 19.0 20.7 19.5ROCE 27.0 28.5 22.6 24.7 23.0ROIC 57.3 80.5 63.7 68.1 56.1Financial health ratioOperating CF (Rs Cr) 2666.6 3128.1 1257.1 3346.8 3525.6FCF (Rs Cr) 1741.8 1907.3 84.3 1358.9 730.6Cap. Emp. (Rs Cr) 8974.5 10288.8 14822.6 17145.3 19641.1Debt to equity (x) 0.0 0.0 0.0 0.0 0.0Debt to cap. emp. (x) 0.0 0.0 0.0 0.0 0.0Interest Coverage (x) 63.8 305.7 852.6 1180.6 1265.1Debt to EBITDA (x) 0.1 0.0 0.0 0.0 0.0DuPont ratio analysis
PAT/PBT 0.7 0.6 0.7 0.7 0.7PBT/EBIT 1.2 1.3 1.3 1.2 1.2EBIT/Sales 0.4 0.4 0.4 0.4 0.4Sales/ Total Asset 0.7 0.7 0.5 0.5 0.5Total Asset/ Net Worth 1.1 1.1 1.1 1.1 1.1

8/8/2019 ICICI Direct - Oil India Limited - Initiating Coverage
http://slidepdf.com/reader/full/icici-direct-oil-india-limited-initiating-coverage 18/20
Oil India Limited (OILIND)
ICICIdirect.com | Equity Research Page 18
Cash flow statement
(Rs crore)FY08 FY09 FY10E FY11E FY12E
Profit after Tax 1788.9 2161.7 2610.5 3335.5 3621.1
Less: Dividend Paid 688.5 763.6 956.5 1012.8 1125.3Add: Depreciation 442.8 748.0 763.8 709.7 802.9Add: Others 62.2 34.3 121.1 0.0 0.0Cash Profit 1605.3 2180.4 2520.5 3032.4 3298.7Increase/(Decrease) in CL 722.1 1337.3 177.9 389.2 324.2(Increase)/Decrease in CA 339.2 -389.6 -1441.3 -74.8 -97.3CF from Operating Activities 2666.6 3128.1 1257.1 3346.8 3525.6Purchase of Assets 924.8 1220.8 1172.8 1987.9 2795.0(Inc)/Dec in Investments -81.1 0.0 -370.8 0.0 0.0CF from Investing Activities -1006.0 -1220.8 -1543.6 -1987.9 -2795.0Inc/(Dec) in Loan Funds -639.1 -118.1 -18.5 0.0 0.0Inc/(Dec) in Sh. Cap. & Res. -16.5 0.0 2777.3 0.0 0.0CF from financing Activities -655.5 -118.1 2758.7 0.0 0.0Change in cash Eq. 1005.1 1789.2 2472.3 1358.9 730.6Op. Cash and cash Eq. 3275.7 4280.8 6070.0 8542.3 9901.1Cl. Cash and cash Eq. 4280.8 6070.0 8542.3 9901.1 10631.7
FCF Calculation
(Rs crore)FCF Calculation FY08 FY09 FY10E FY11E FY12EEBITDA 2635.8 3420.2 3875.6 4694.1 5072.5Less: Tax 924.5 1225.3 1284.6 1498.6 1626.9NOPLAT 1711.4 2194.9 2591.1 3195.5 3445.6Capex 924.8 1220.8 1172.8 1987.9 2795.0
Change in Working Capital 1061.3 947.7 -1263.4 314.4 227.0FCF 1847.8 1921.8 154.9 1522.0 877.5
Working capital ratios
FY08 FY09 FY10E FY11E FY12EFixed Asset Turnover 1.5 1.6 1.6 1.5 1.2Inventory Turnover (Days) 26.4 24.7 20.5 22.5 22.5Debtor (Days) 35.7 19.9 29.8 25.0 25.0Current Liabilities (Days) 64.4 72.1 81.6 76.0 76.0Current Ratio 3.5 2.7 3.8 3.7 3.6
Quick ratio 3.3 2.5 3.6 3.6 3.5
Valuation ratios
ValuationFY08 FY09 FY10E FY11E FY12E
Market Capitalisation 30709.0 30709.0 34504.6 34504.6 34504.6Enterprise Value (EV) 26603.1 24695.5 25999.8 24640.9 23910.3PE 17.2 14.2 13.2 10.3 9.5Price to Book Value 3.9 3.3 2.5 2.1 1.9Price to Cash EPS 13.8 10.6 10.2 8.5 7.8EV/EBITDA 10.1 7.2 6.7 5.2 4.7Market Cap/Sales 4.9 4.1 4.3 3.8 3.5EV/Sales 4.3 3.3 3.2 2.7 2.4

8/8/2019 ICICI Direct - Oil India Limited - Initiating Coverage
http://slidepdf.com/reader/full/icici-direct-oil-india-limited-initiating-coverage 19/20
Oil India Limited (OILIND)
ICICIdirect.com | Equity Research Page 19
Glossary & conversion factors
1 barrel = 5.8 mmbtu1 bcm = 1000 mmscm
1 bcm = 2.74 mmscmd1 bcm = 6.29 mmboe1 kl = 6.293 barrels1 metric tonne = 7.205 bbls1 mmt = 1.145 bcm1P Proven2P Proven plus probable3P Proven plus probable and possibleAPM Administered Price Mechanismbbls barrelsbcm billion cubic meterboepd barrels of oil equivalent per daybopd barrels of oil per dayEOR Enchanced oil recoveryGHIIP Gross hydrocarbon initially in placekl kilo Litremmbbls million barrelsmmboe million barrels of oil equivalentmmbtu million british thermal unitmmscf million standard cubic feet of gasmmscfd million standard cubic feet of gas per daymmscmd million standard cubic meter per daymmt million metric tonnemscf thousand standard cubic feet of gasPSC Production sharing contract

8/8/2019 ICICI Direct - Oil India Limited - Initiating Coverage
http://slidepdf.com/reader/full/icici-direct-oil-india-limited-initiating-coverage 20/20
Oil India Limited (OILIND)
RATING RATIONALECICIdirect.com endeavours to provide objective opinions and recommendations. ICICIdirect.com assignsatings to its stocks according to their notional target price vs. current market price and then categorises them
as Strong Buy, Buy, Add, Reduce and Sell. The performance horizon is two years unless specified and thenotional target price is defined as the analysts' valuation for a stock.
Strong Buy: 20% or more;Buy: Between 10% and 20%;Add: Up to 10%;Reduce: Up to -10%Sell: -10% or more;
Pankaj Pandey Head – Research [email protected]
ICICIdirect.com Research Desk,
ICICI Securities Limited,7 th Floor, Akruti Centre Point,MIDC Main Road, Marol Naka,Andheri (East)Mumbai – 400 093
ANALYST CERTIFICATIONWe /I, Mayur Matani MBA research analysts, authors and the names subscribed to this report, hereby certify that all of the views expressed in this research report accurately reflect our personal viewsbout any and all of the subject issuer(s) or securities. We also certify that no part of our compensation was, is, or will be directly or indirectly related to the specific recommendation(s) or view(s) in thiseport. Analysts aren't registered as research analysts by FINRA and might not be an associated person of the ICICI Securities Inc.
Disclosures:CICI Securities Limited (ICICI Securities) and its affiliates are a full-service, integrated investment banking, investment management and brokerage and financing group. We along with affiliates are leadingnderwriter of securities and participate in virtually all securities trading markets in India. We and our affiliates have investment banking and other business relationship with a significant percentage ofompanies covered by our Investment Research Department. Our research professionals provide important input into our investment banking and other business selection processes. ICICI Securitiesenerally prohibits its analysts, persons reporting to analysts and their dependent family members from maintaining a financial interest in the securities or derivatives of any companies that the analystsover.
he information and opinions in this report have been prepared by ICICI Securities and are subject to change without any notice. The report and information contained herein is strictly confidential andmeant solely for the selected recipient and may not be al tered in any way, transmitted to, copied or distributed, in part or in whole, to any other person or to the media or reproduced in any form, without
rior written consent of ICICI Securities. While we would endeavour to update the information herein on reasonable basis, ICICI Securities, its subsidiaries and associated companies, their directors andmployees (“ICICI Securities and affiliates”) are under no obligation to update or keep the information current. Also, there may be regulatory, compliance or other reasons that may prevent ICICI Securitiesrom doing so. Non-rated securities indicate that rating on a particular security has been suspended temporarily and such suspension is in compliance with applicable regulations and/or ICICI Securitiesolicies, in circumstances where ICICI Securities is acting in an advisory capacity to this company, or in certain other circumstances.
his report is based on information obtained from public sources and sources believed to be reliable, but no independent verification has been made nor is its accuracy or completeness guaranteed. Thiseport and information herein is solely for informational purpose and may not be used or considered as an offer document or solicitation of offer to buy or sell or subscribe for securities or other financialnstruments. Though disseminated to all the customers simultaneously, not all customers may receive this report at the same time. ICICI Securities will not treat recipients as customers by virtue of theireceiving this report. Nothing in this report constitutes investment, legal, accounting and tax advice or a representation that any investment or strategy is suitable or appropriate to your specificircumstances. The securities discussed and opinions expressed in this report may not be suitable for all investors, who must make their own investment decisions, based on their own investmentbjectives, financial positions and needs of specific recipient. This may not be taken in substitution for the exercise of independent judgment by any recipient. The recipient should independently evaluate
he investment risks. The value and return of investment may vary because of changes in interest rates, foreign exchange rates or any other reason. ICICI Securities and affi liates accept no liabilities for anyoss or damage of any kind arising out of the use of this report. Past performance is not necessarily a guide to future performance. Investors are advised to see Risk Disclosure Document to understand thesks associated before investing in the securities markets. Actual results may differ materially from those set forth in projections. Forward-looking statements are not predictions and may be subject tohange without notice.
CICI Securities and its affiliates might have managed or co-managed a public offering for the subject company in the preceding twelve months. ICICI Securities and affiliates might have receivedompensation from the companies mentioned in the report during the period preceding twelve months from the date of this report for services in respect of public offerings, corporate finance, investmentanking or other advisory services in a merger or specific transaction. ICICI Securities and affiliates expect to receive compensation from the companies mentioned in the report within a period of three
months following the date of publication of the research report for services in respect of public offerings, corporate finance, investment banking or other advisory services in a merger or specificansaction. It is confirmed that Mayur Matani MBA research analysts and the authors of this report have not received any compensation from the companies mentioned in the report in the preceding
welve months. Our research professionals are paid in part based on the profitability of ICICI Securities, which include earnings from Investment Banking and other business.
CICI Securities or its subsidiaries collectively do not own 1% or more of the equity securities of the Company mentioned in the report as of the last day of the month preceding the publication of theesearch report.
is confirmed that Mayur Matani MBA research analysts and the authors of this report or any of their family members does not serve as an officer, director or advisory board member of the companiesmentioned in the report.
CICI Securities may have i ssued other reports that are inconsistent with and reach different conclusion from the information presented in this report. ICICI Securities and affiliates may act upon or make usef information contained in the report prior to the publication thereof.
his report is not directed or intended for distribution to, or use by, any person or entity who is a citizen or resident of or located in any locality, state, country or other jurisdiction, where such distribution,ublication, availability or use would be contrary to law, regulation or which would subject ICICI Securities and affiliates to any registration or licensing requirement within such jurisdiction. The securitiesescribed herein may or may not be eligible for sale in all jurisdictions or to certain category of investors. Persons in whose possession this document may come are required to inform themselves of ando observe such restriction.