Ichimoku Charting - Brainy's Share Market Toolbox · Advanced Interpretation Wider or steeper the...
27
Ichimoku Charting ALAN CLEMENT – MARCH 2016 HELIXTRADER.COM
Transcript of Ichimoku Charting - Brainy's Share Market Toolbox · Advanced Interpretation Wider or steeper the...

Ichimoku ChartingALAN CLEMENT – MARCH 2016
HELIXTRADER.COM
Goals
Benefits / Limitations of Ichimoku charting
Chart construction
Chart interpretation
Advanced uses
Practise with your favourite markets
Disclaimer
Helix Trader nor any of its affiliates, directors or agents are a financial advisory service, nor
a registered financial advisor and does not provide financial advice whatsoever in any
financial products. You understand and acknowledge that there is a very high degree
of risk involved in trading securities and derivatives. In particular, trading leveraged
instruments such as Futures, Contracts for Difference or Spread Betting can amplify the
losses as well as gains achieved due to market price fluctuations and you may lose more
than your original investment.
All methods, techniques, charts or analysis presented in Helix Trader Insights are for
educational purposes only. The information provided should not be construed in any
way as a recommendations to buy or sell any financial instrument. You should always
consult with your registered financial advisor and tax advisor to determine the suitability
of any investment to your particular financial situation. Helix Trader and its affiliates,
directors or agents will not be held liable or responsible for your investment decisions.
You agree not to re-publish, re-distribute or share any information from Helix Trader
Insights, or Helix Trader Insights website content without expressly acknowledging Helix
Trader Insights and providing a link back to helixtrader.com.
Information provided in this correspondence is intended solely for informational purposes
and is obtained from sources believed to be reliable. Information is in no way
guaranteed. No guarantee of any kind is implied or possible where projections of future
conditions are attempted.
Why Listen To Me?
IFTA Certified Financial Technician
Professional background in Financial Industry
Independent Trader for 15 years
Technical Analysis column in national press
Quantitative Trading System Designer
Provide Personalised Training and Mentoring

Ichimoku Benefits
Very simple to interpret (once you know how!)
Keeps you on the right side of the market
Leading indicator
Support & Resistance zones
Overbought / Oversold conditions
Multiple timeframe confirmations
Excellent secondary indicator
Generally works well on weekly charts
Ichimoku Limitations
It’s not a trading system
Works best in trending markets
“Signals” can often be late
Can become noisy at lower timeframes
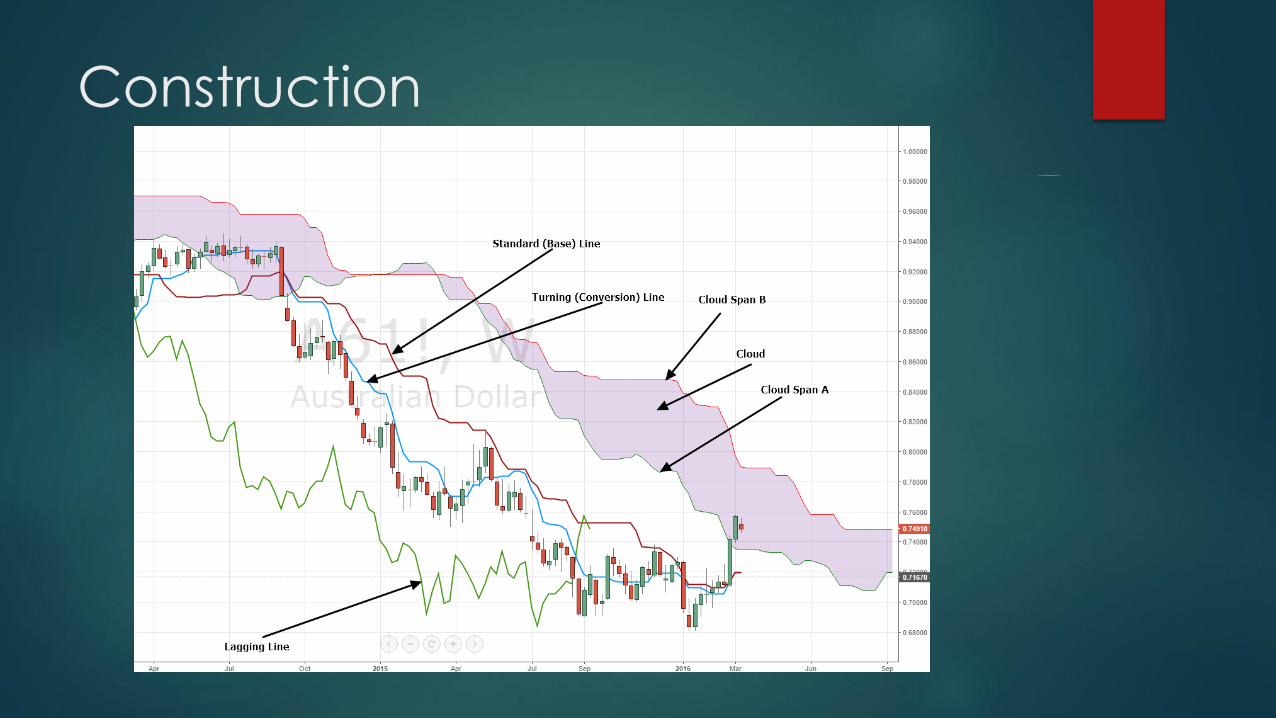
Construction

Detailed Calculation
Tenkan-sen (Conversion Line): (9-period high + 9-period low)/2)) The default setting is
9 periods and can be adjusted. On a daily chart, this line is the mid point of the 9 day
high-low range, which is almost two weeks.
Kijun-sen (Base Line): (26-period high + 26-period low)/2)) The default setting is 26
periods and can be adjusted. On a daily chart, this line is the mid point of the 26 day
high-low range, which is almost one month).
Senkou Span A (Leading Span A): (Conversion Line + Base Line)/2)) This is the
midpoint between the Conversion Line and the Base Line. The Leading Span A forms
one of the two Cloud boundaries. It is referred to as "Leading" because it is plotted 26
periods in the future and forms the faster Cloud boundary.
Senkou Span B (Leading Span B): (52-period high + 52-period low)/2)) On the daily
chart, this line is the mid point of the 52 day high-low range, which is a little less than 3
months. The default calculation setting is 52 periods, but can be adjusted. This value is
plotted 26 periods in the future and forms the slower Cloud boundary.
Chikou Span (Lagging Span): Close plotted 26 periods in the past. The default setting
is 26 periods, but can be adjusted.
Basic Interpretation
Stick to Weekly timeframe
Price and Lagging Line above cloud is Bullish
Price and Lagging Line below cloud is Bearish
Cloud projects future areas of support and resistance

S&P500 Weekly – Long Term

S&P500 Weekly - Short Term

Advanced Interpretation
Wider or steeper the cloud the greater the support & resistance
Crosses tend to happen when cloud turns thin and/or horizontal
Relative distance of price and Lagging Line from cloud can
determine extremes. Cloud tends to act as a magnet for price.
Base and Conversion line crosses can be used similar to MA crosses
Use multiple timeframes for confirmation

AUD/USD - Weekly
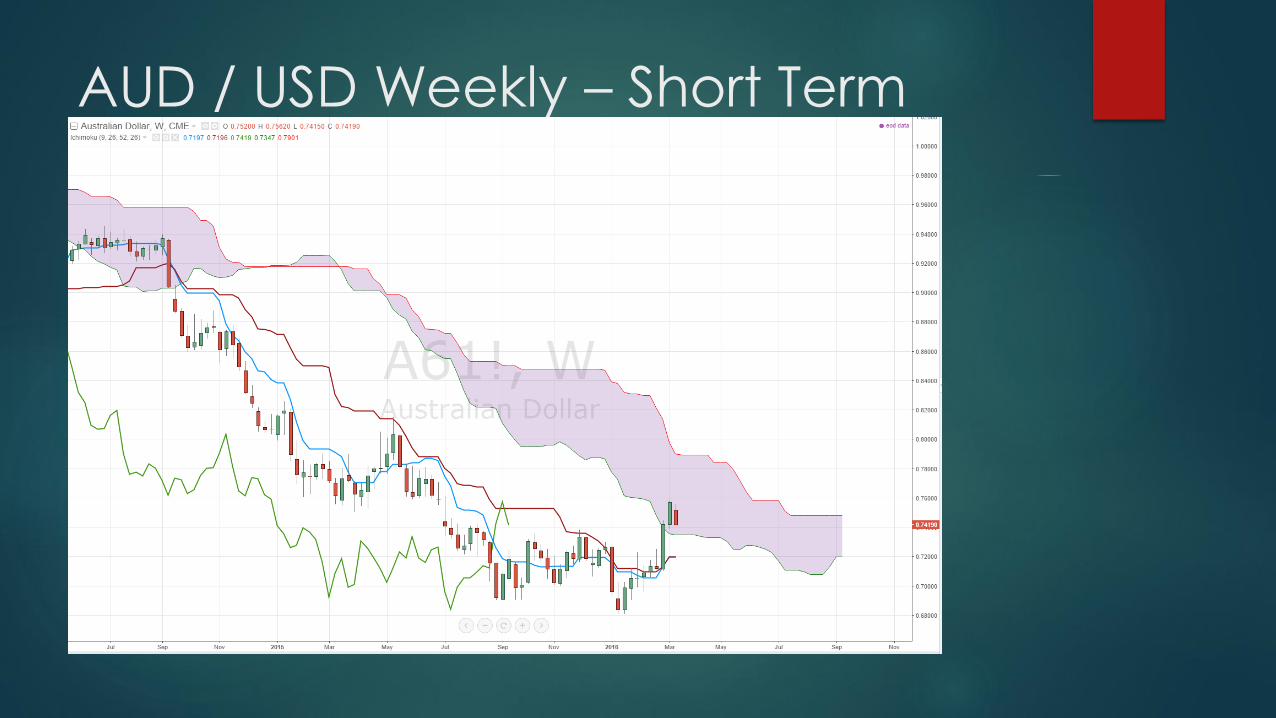
AUD / USD Weekly – Short Term
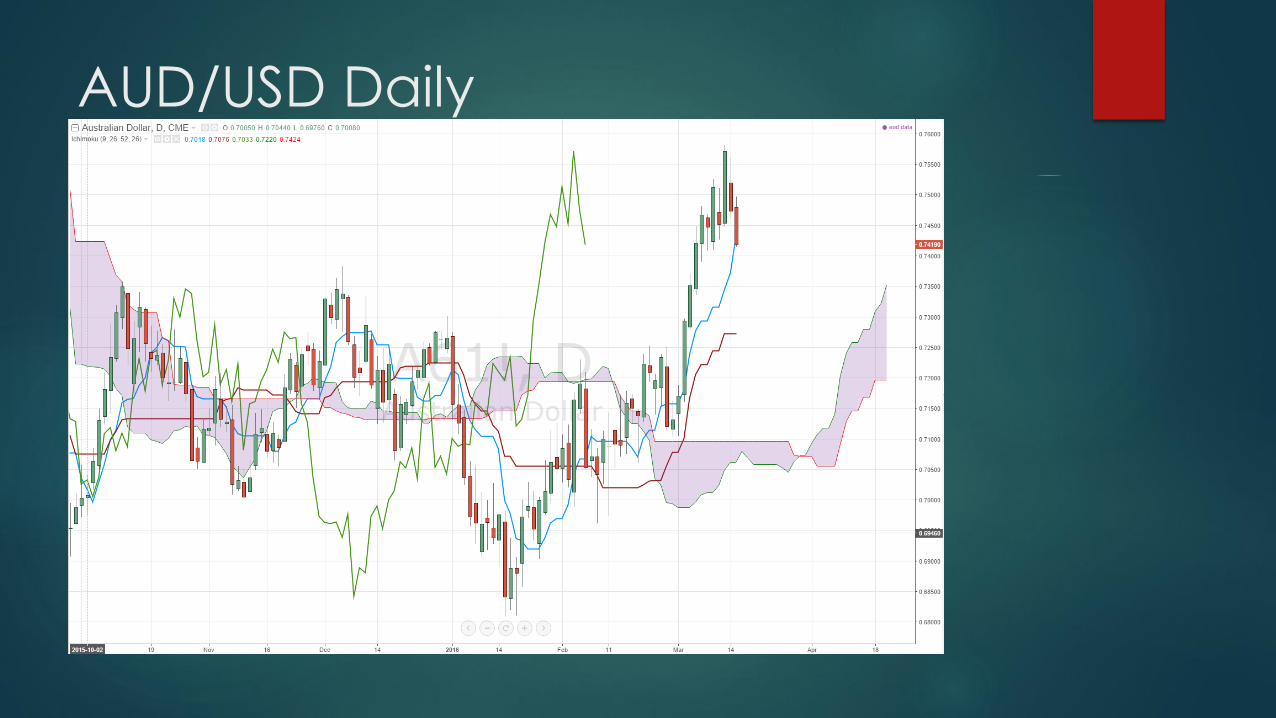
AUD/USD Daily
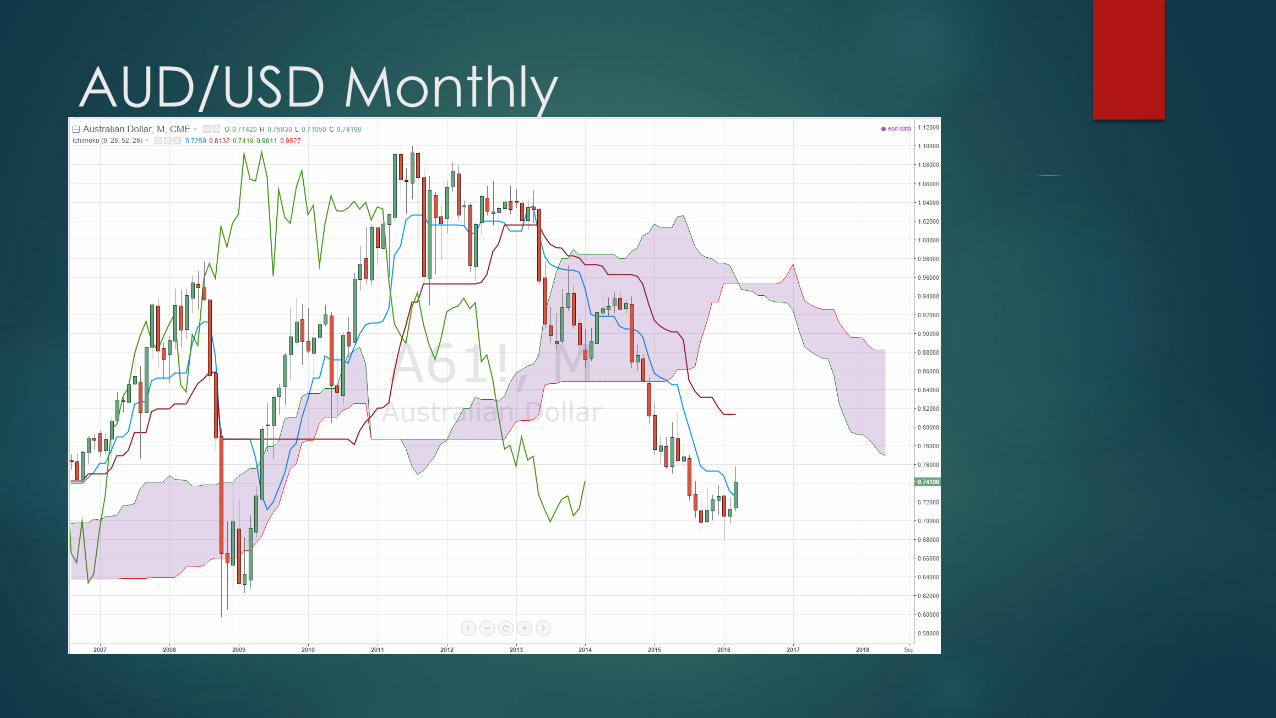
AUD/USD Monthly
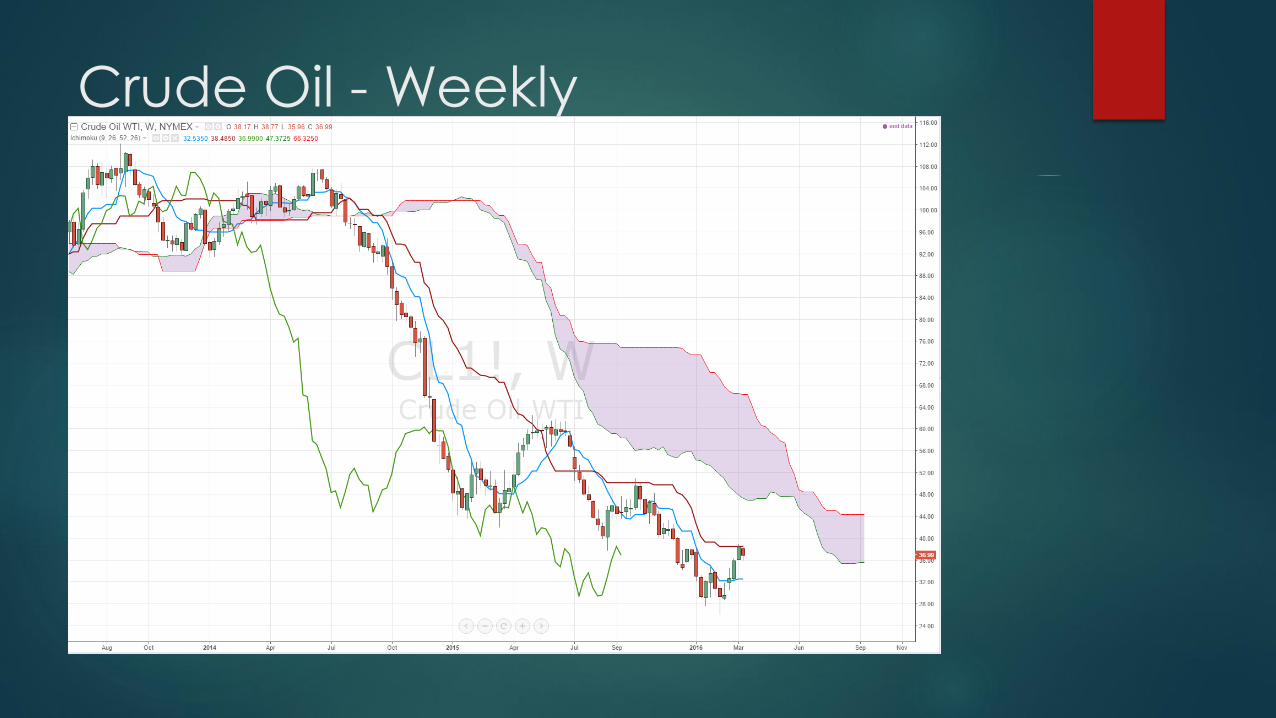
Crude Oil - Weekly
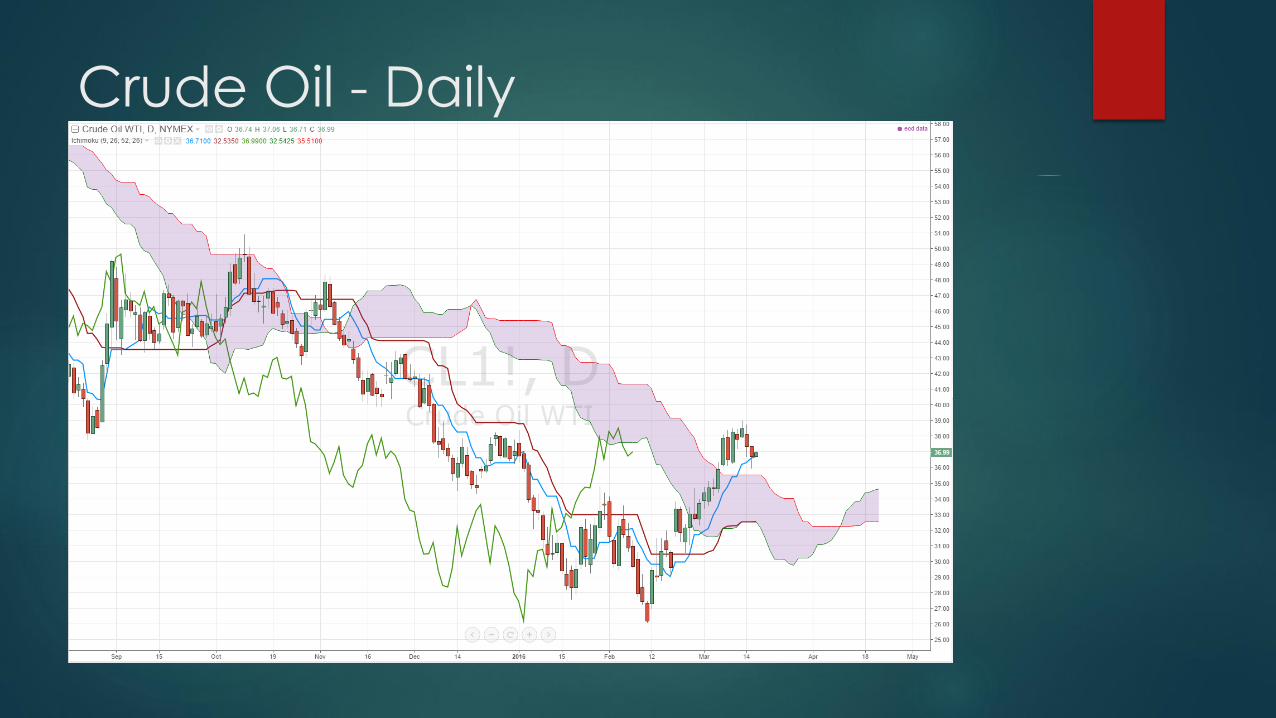
Crude Oil - Daily

S&P500 Monthly
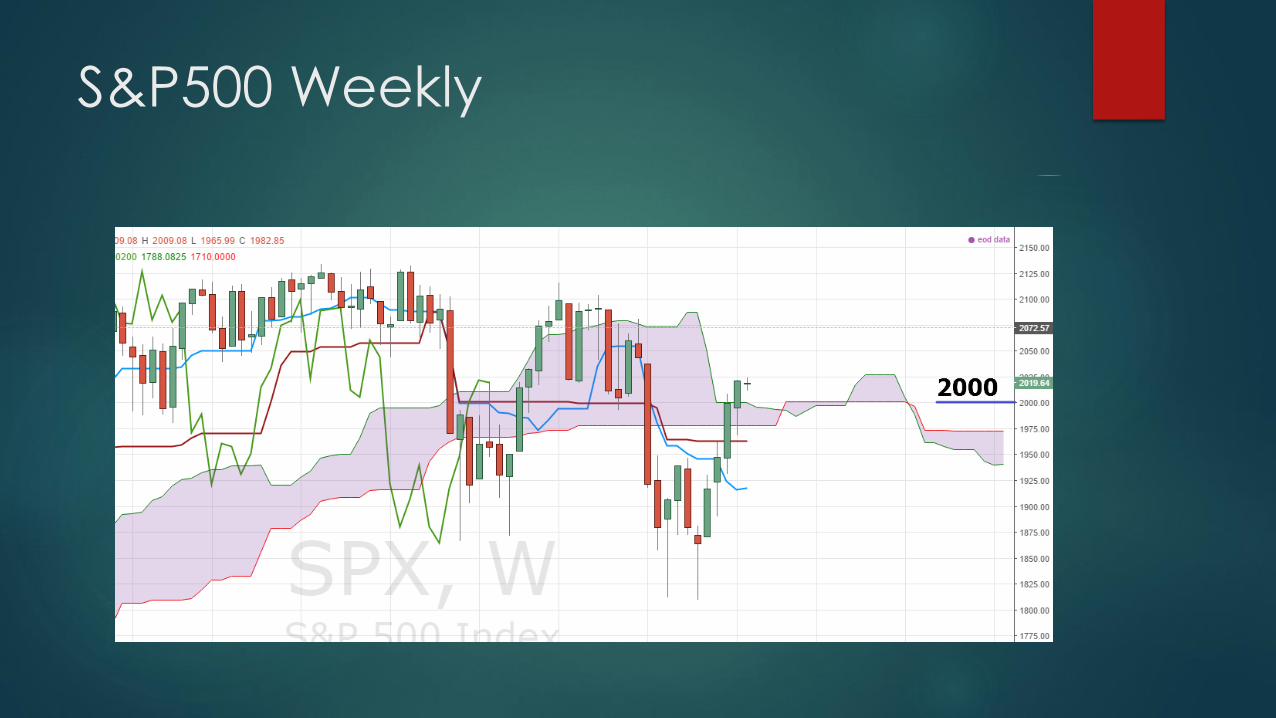
S&P500 Weekly
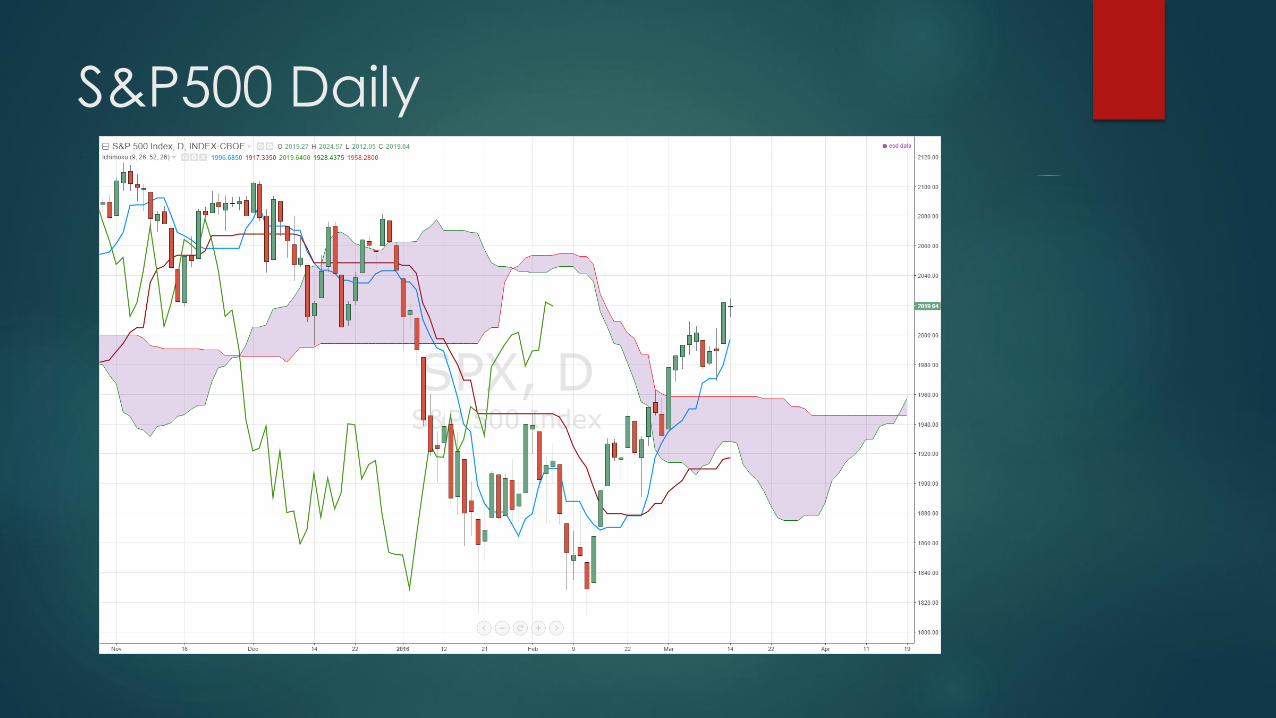
S&P500 Daily

Software
Bullcharts (obviously)
Amibroker
Tradingview.com
Stockcharts.com

Further Reading
Stockcharts.com Chart School on Ichimoku
Cloud Charts: Trading Success with the Ichimoku Techique by David
Linton

Final Thoughts
Great for gauging sentiment in the market you are interested in
Use primarily as a secondary indicator
Use other tools to refine entries and exits
Ichimoku can lower emotion by keeping you on the right side of the
market
Can be used to filter a short list of opportunities
A great addition to your technical analysis toolbox

Take Your Trading to the Next Level
Trader Coaching
Trading Systems
System Development Training
Trade systems that meets your objectives
and suit your personality & lifestyle
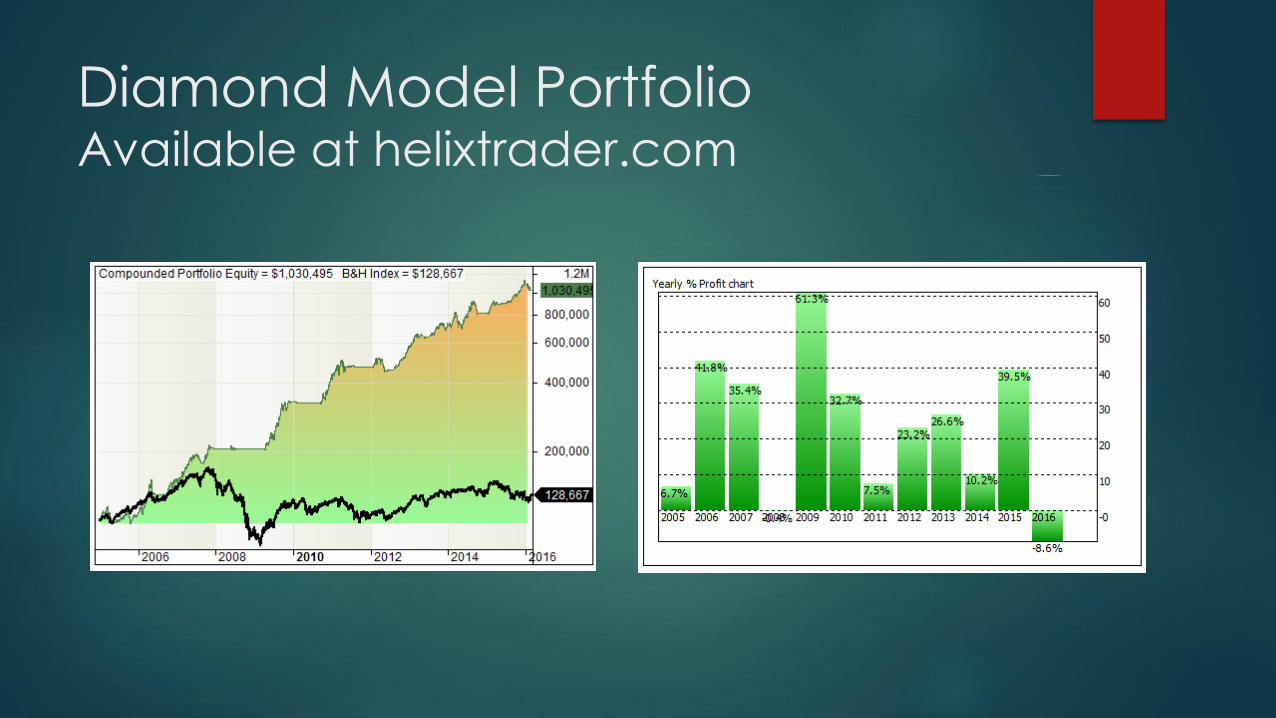
Diamond Model PortfolioAvailable at helixtrader.com

Now Let’s Practise!