ICFA-SCIC Network Monitoring Report · 4 Executive Overview Internet performance is improving each...
68
International Committee for Future Accelerators (ICFA) Standing Committee on Inter-Regional Connectivity (SCIC) Chairperson: Professor Harvey Newman, Caltech ICFA SCIC Network Monitoring Report Prepared by the ICFA SCIC Monitoring Working Group On behalf of the Working Group: Les Cottrell [email protected]
Transcript of ICFA-SCIC Network Monitoring Report · 4 Executive Overview Internet performance is improving each...

International Committee for Future Accelerators (ICFA) Standing Committee on Inter-Regional Connectivity (SCIC)
Chairperson: Professor Harvey Newman, Caltech
ICFA SCIC Network Monitoring Report
Prepared by the ICFA SCIC Monitoring Working Group On behalf of the Working Group:
Les Cottrell [email protected]

2
2010 - 2011 Report of the ICFA-SCIC Monitoring Working Group
Edited by R. Les Cottrell, Shawn McKee, Zafar Gilani
On behalf of the ICFA-SCIC Monitoring WG
Created October 15, 2010, Finished January 28, 2011
ICFA-SCIC Home Page | Monitoring WG Home Page
This report is available from:
http://www.slac.stanford.edu/xorg/icfa/icfa-net-paper-jan11/report-jan11.doc

3
Executive Overview ............................................................................................................................................ 4 Introduction ......................................................................................................................................................... 6 ICFA/SCIC Network Monitoring Working Group .................................................................................... 7
Goals of the Working Group ..................................................................................................................................... 8 Methodology ......................................................................................................................................................... 8 PingER Results .................................................................................................................................................... 8
Deployment ..................................................................................................................................................................... 8 Historical Growth of PingER Coverage Since 1998 ....................................................................................... 10 Yearly minimum RTT ................................................................................................................................................ 15 Yearly Throughput Trends ...................................................................................................................................... 16 Yearly Mean Opinion Score (MOS) trends ........................................................................................................ 20
Comparisons with Economic and Development Indicators ................................................................... 21 Human Development Index (HDI) ....................................................................................................................... 22 The Digital Opportunity Index (DOI) .................................................................................................................. 23 Global ICT Developments, 1998 to 2009 ........................................................................................................... 24
Case Studies....................................................................................................................................................... 25 East Coast of Africa Fibre ......................................................................................................................................... 25 Pakistan Education and Research Network ..................................................................................................... 25
High Performance Network Monitoring .................................................................................................... 28 New and Ongoing Monitoring and Diagnostic Efforts in HEP .................................................................. 28 LHC-OPN Monitoring ................................................................................................................................................. 36 Related HEP Network Research ............................................................................................................................ 36 Comparison with HEP Needs ................................................................................................................................. 37
Accomplishments since last report .............................................................................................................. 37 PingER Extensions .......................................................................................................................................... 38
Porting PingER Archive/Analysis Toolkit to SEECS ..................................................................................... 38 SmokePing Graphs ...................................................................................................................................................... 39 Improved PingER map .............................................................................................................................................. 40
2010 Digital Divide Publications/Presentations:....................................................................................... 40 Publications ................................................................................................................................................................... 40 Talks ................................................................................................................................................................ ................. 41
Recommendations ............................................................................................................................................ 41 Future Support ............................................................................................................................................................. 41
Acknowledgements .......................................................................................................................................... 42 Appendices ......................................................................................................................................................... 44
Appendix A: Sub-Saharan Africa - Fibre Updates for year 2010 ............................................................. 44 Appendix B: New PingER monitoring nodes in Brazil, Egypt, Mexico, Nepal and Pakistan ......... 64 Appendix C: Deployment of PerfSONAR in Pakistan .................................................................................... 65 Appendix D: Tools we Use ....................................................................................................................................... 66

4
Executive Overview
Internet performance is improving each year with throughputs typically improving by 20% per year and losses by up to 25% per year. Geosynchronous satellite connections are still important to countries with poor telecommunications infrastructure, landlocked developing countries, and for outlying areas. However, the number of countries with fibre connectivity has and continues to increase and in most cases, satellite links are used as backup or redundant links. In general for HEP countries satellite links have been or are being replaced with land-line links with improved performance in particular for Round Trip Time (RTT). On the other side of the coin Internet usage is increasing (see http://www.internetworldstats.com/stats.htm), the application demands 1
In general, throughput measured from within a region is much higher than when measured from outside. Links between the more developed regions including N. America
are growing and the expected reliability is increasing, so we cannot be complacent.
2
Africa and South Asia are two regions where the Internet has seen phenomenal growth, especially in terms of usage. However, it appears that network capacity is not keeping up with demand in these regions. In fact many sites in Africa and India appear to have throughputs less than that of a well connected (cable, DSL, etc.) home in Europe, North America, Japan or Australia. Further the end-to-end networking is often very fragile both due to last mile effects and poor infrastructure (e.g. power) at the end sites, and also due to lack of adequate network backup routes. Africa is a big target of opportunity with close to a billion people and a 1329.4% (compared to 3.9% for the world) growth in number of Internet users from 2000-2009
, E. Asia (in particular Japan, South Korea and Taiwan) and Europe are much better than elsewhere (3 - 10 times more throughput achievable). Regions such as Russia, S.E. Asia, S.E. Europe and Latin America are 3-6 years behind. Russia and S.E. Asia are catching up slowly. However, Africa is ~18 years behind Europe and even worse Africa appears to be falling further behind. Looking forward ten years to 2020, if the current rates of progress continue, then performance from N. America to Africa will be 30 times worse than to Europe or East Asia.
3
Despite Africa’s dreadful performance exemplified by almost all network measurements, recent observations of performance (see
. However, there are many challenges including lack of power, import duties, lack of skills, disease, corruption, and protectionist policies. In almost all measurements Africa stands out as having the poorest performance and even worse is falling behind much faster than any other region. Further Africa is a vast region and there are great differences in performance between different countries and regions within Africa.
Appendix A: Sub-Saharan Africa - Fibre Updates for year 2010) to many Sub-Saharan sites give reasons for hope. This is driven by the recent installation of new terrestrial (submarine) fibre optic cables, along both the East and West coasts of Africa,
1 “Application Demands Outrun Internet Improvements”, P. Sevcik, Business Communications Review, January 2006. 2 Since North America officially includes Mexico, the Encyclopedia Britannica recommendation is to use the terminology Anglo America (US + Canada). However, in this document North America is taken to mean the U.S. and Canada. 3 Internet World Statistics available at http://www.internetworldstats.com/stats1.htm

5
to provide connectivity for the 2010 World Soccer Cup in South Africa. Prior to the lighting of the first East African cable, in July of 2009, hosts were connected to other regions via geostationary satellite links, with a minimum of 450ms RTTs to anywhere. As hosts had their connections moved to the fibre optic cable, RTTs improved by factors of 2 to 3 and with the extra capacity, losses and jitter were also reduced. All this resulted in site throughput improvements of factors of 2 to 4 within a period of a couple of weeks (while the new links and hosts were configured). Furthermore, these improvements were not just to coastal countries such as Kenya, but were quickly extended to landlocked countries such as Uganda and Rwanda. For the longer term, the provision of multiple cables from different companies is resulting in competition and significant price reductions. For example in Nairobi 15 months after the arrival of the undersea cables, there is competition between 4 providers, and prices have dropped to $300/Mbps4
There is a moderate to strong positive correlation between the Internet performance metrics and various economic and development indices available from the UN and International Telecommunications Union (ITU). Besides being useful in their own right these correlations are an excellent way to illustrate anomalies and for pointing out measurement/analysis problems. The large variations between sites within a given country illustrate the need for careful checking of the results and the need for multiple sites/country to identify anomalies. Also given the difficulty of developing the human and technical indicators (at best they are updated once a year and usually much less frequently); having non-subjective indicators such as PingER that are constantly and automatically updated is a very useful complement.
. This is to be compared with the African average in 2008 of over $4000/Mbps. But it will take a while yet before the competition spreads to the smaller towns in the region.
For modern HEP collaborations and Grids there is an increasing need for high-performance monitoring to set expectations, provide planning and trouble-shooting information, and to provide steering for applications. As link performance continues to improve, the losses between developed regions are decreasing to levels that are not measureable by PingER. Though the measurements for RTT, jitter, and unreachability5 are still correct, as the measured losses go to zero this also makes the throughput derivation unreliable. Alternative solutions to measuring the throughput are available, however they can be harder to install and absorb more network bandwidth. Examples of other measurement projects using the more intense methods are the MonALISA6 project that uses both the pathload7 packet pair technique as well as file transfers, and perfSONAR8 that uses the iperf9 TCP transport mechanism. There is also a project in place at SLAC and LBNL under the perfSONAR umbrella to analyze and present data from production gridFTP10
4 Ian Moore, comment in
transfers that are heavily used in the HEP community. These projects are becoming increasingly important for links between well developed sites.
http://manypossibilities.net/african-undersea-cables/ 5 A host is considered unreachable when none of the pings sent to it there is no response to any of the pings sent to it. 6 MonALISA, see http:// monalisa.caltech.edu 7 Pathload, see http://www.cc.gatech.edu/fac/Constantinos.Dovrolis/bw-est/pathload.html 8 What is perfSONAR available at http://www.perfsonar.net/ 9 Iperf home page is available at http://dast.nlanr.net/Projects/Iperf/ 10 "The GridFTP Protocol Protocol and Software". Available http://www.globus.org/datagrid/gridftp.html and also see http://en.wikipedia.org/wiki/GridFTP

6
Given the problems with throughput derivations for low loss regions, we have introduced the Mean Opinion Score (MOS)11. This gives the quality of a phone conversation and is a function of the RTT, loss and jitter, thus combining several measures. This year we have also introduced a new metric “alpha”12
To quantify and help bridge the Digital Divide, enable world-wide collaborations, and reach-out to scientists world-wide, it is imperative to continue and extend the PingER monitoring coverage to all countries with HEP programs and significant scientific enterprises.
which for wide area networks mainly gives a measure of the directness of paths between sites.
Introduction This report may be regarded as a follow on to the May 1998 Report of the ICFA-NTF Monitoring Working Group13, the January 2003 Report of the ICFA-SCIC Monitoring Working Group14 the January 2004 Report of the ICFA-SCIC Monitoring Working Group, 15 the January 2005 Report of the ICFA-SCIC Monitoring Working Group
, 16 January 2006 Report of the
ICFA-SCIC Monitoring Working Group, the
17 January 2007 Report of the ICFA-SCIC Monitoring Working Group
, the 18 January 2008 Report of the ICFA-SCIC Monitoring Working
Group, the
19 January 2009 Report of the ICFA-SCIC Monitoring Working Group, 20 January 2010 Report of the ICFA-SCIC Monitoring Working Group
and 21
The current report updates the January 2010 report, but is complete in its own right in that it includes the tutorial information and other relevant sections from the previous report. The main changes in this year’s reports are:
.
11 Mean Opinion Score see http://en.wikipedia.org/wiki/Mean_opinion_score 12 The speed of light in fibre or copper is ~ 100km/ms. Knowing the distance (d) between the two hosts then d(km)=alpha*min_RTT(ms) 100(km/ms), where we use the min_RTT to minimize the effects of queuing and alpha accounts for the extra delays caused by network equipment (routers/switches etc.) and the indirectness of the path. The latter has the major impact on most long distance backbones. Typical values of alpha as seen by the TULIP project for reasonably direct paths are about 0.4. 13 "May 1998 Report of the ICFA NTF Monitoring Working Group". Available http://www.slac.stanford.edu/xorg/icfa/ntf/ 14 "January 2003 Report of the ICFA-SCIC Monitoring Working Group". Available http://www.slac.stanford.edu/xorg/icfa/icfa-net-paper-dec02/ 15 "January 2004 Report of the ICFA-SCIC Monitoring Working Group". Available http://www.slac.stanford.edu/xorg/icfa/icfa-net-paper-jan04/ 16 "January 2005 Report of the ICFA-SCIC Monitoring Working Group". Available http://www.slac.stanford.edu/xorg/icfa/icfa-net-paper-jan05/ 17 "January 2006 Report of the ICFA-SCIC Monitoring Working Group". Available http://www.slac.stanford.edu/xorg/icfa/icfa-net-paper-jan06/ 18 "January 2007 Report of the ICFA-SCIC Monitoring Working Group". Available http://www.slac.stanford.edu/xorg/icfa/icfa-net-paper-jan07/ 19 "January 2008 Report of the ICFA-SCIC Monitoring Working Group". Available http://www.slac.stanford.edu/xorg/icfa/icfa-net-paper-jan08/ 20 "January 2009 Report of the ICFA-SCIC Monitoring Working Group". Available http://www.slac.stanford.edu/xorg/icfa/icfa-net-paper-jan09/ 21 "January 2010 Report of the ICFA-SCIC Monitoring Working Group". Available http://www.slac.stanford.edu/xorg/icfa/icfa-net-paper-jan10/

7
• The addition of information from a new case study of the impact of newer terrestrial (sub-marine) fibres coming into production on the East and West Coasts of Africa (see Appendix A: Sub-Saharan Africa - Fibre Updates for year 2010).
• Deployment of new PingER Monitoring nodes in Mexico, Nepal, Egypt and several in Pakistan. We now have ~ 70 active monitoring hosts (an increase of ~20 hosts since last year) in 22 countries. (see Appendix B: New PingER monitoring nodes in Egypt, Mexico, Nepal and Pakistan).
• Deployment of PerfSONAR in Pakistan (see Appendix C: Deployment of PerfSONAR in Pakistan).
• Updating of the major figures and tables.
• Management of TULIP active landmarks: adding and subtracting as they fail and recover (see Appendix E: Management of TULIP active landmarks).
• Mention of 4 publications and 4 lectures (see 2010 Digital Divide Publications/Presentations).
• Extension of the PingER archive/analysis/presentation toolkit for the host in Pakistan.
ICFA/SCIC Network Monitoring Working Group
The formation of this working group was requested at the ICFA/SCIC meeting at CERN in March 200222. The mission is to: Provide a quantitative/technical view of inter-regional network performance to enable understanding the current situation and making recommendations for improved inter-regional connectivity.
The lead person for the monitoring working group was identified as Les Cottrell. The lead person was requested to gather a team of people to assist in preparing the report and to prepare the current ICFA report for the end of 2002. The team membership consists of:
Table 1: Members of the ICFA/SCIC Network Monitoring team Les Cottrell SLAC US [email protected] Richard Hughes-Jones
University of Manchester
UK and DANTE [email protected]
Sergei Berezhnev RUHEP, Moscow State.Univ.
Russia [email protected]
Sergio F. Novaes FNAL S. America [email protected] Fukuko Yuasa KEK Japan and E. Asia [email protected] Shawn McKee Michigan I2 HEP Net Mon WG,
USATLAS [email protected]
22 "ICFA/SCIC meeting at CERN in March 2002". Available http://www.slac.stanford.edu/grp/scs/trip/cottrell-icfa-mar02.html

8
Goals of the Working Group
• Obtain as uniform picture as possible of the present performance of the connectivity used by the ICFA community
• Prepare reports on the performance of HEP connectivity, including, where possible, the identification of any key bottlenecks or problem areas.
Methodology There are two complementary types of Internet monitoring reported on in this report.
1. In the first we use PingER23 which uses the ubiquitous "ping" utility available standard on most modern hosts. Details of the PingER methodology can be found in the Tutorial on Internet Monitoring & PingER at SLAC24. PingER provides low intrusiveness (~ 100bits/s per host pair monitored25
2. The second method (perfSONAR
) RTT, loss, jitter, and reachability (if a host does not respond to a set of 10 pings it is presumed to be non-reachable). The low intrusiveness enables the method to be very effective for measuring regions and hosts with poor connectivity. Since the ping server is pre-installed on all remote hosts of interest, minimal support is needed for the remote host (no software to install, no account needed etc.)
26
PingER Results
etc.) is for measuring high network and application throughput between hosts with excellent connections. Examples of such hosts are to be found at HEP accelerator sites and tier 1 and 2 sites, major Grid sites, and major academic and research sites in N. America2, Japan and Europe. The method can be quite intrusive (for each remote host being monitored from a monitoring host, it can utilize hundreds of Mbits/s or more for ten seconds to a minute, each hour). However to minimize intrusion, the US-ATLAS scheduling utilizes 20 second tests every 4 hours rather than every hour. It also requires more support from the remote host. In particular either various services must be installed and run by the local administrator or an account is required, software (servers) must be installed, disk space, compute cycles etc. are consumed, and there are security issues. The method provides expectations of throughput achievable at the network and application levels, as well as information on how to achieve it, and trouble-shooting information.
Deployment
The PingER data and results extend back to the start of 1995. They thus provide a valuable history of Internet performance. PingER now has ~70 active monitoring nodes in ~26 countries that monitor over 900 remote nodes at over 750 sites in over 165 countries (see PingER
23 "PingER". Available http://www-iepm.slac.stanford.edu/pinger/; W. Matthews and R. L. Cottrell, "The PingER Project: Active Internet Performance Monitoring for the HEP Community", IEEE Communications Magazine Vol. 38 No. 5 pp 130-136, May 2002. 24 R. L. Cottrell, "Tutorial on Internet Monitoring & PingER at SLAC". Available http://www.slac.stanford.edu/comp/net/wan-mon/tutorial.html 25 In special cases, there is an option to reduce the network impact to ~ 10bits/s per monitor-remote host pair. 26 PERFormance Service Oriented Network monitoring Architecture , see http://www.perfsonar.net/

9
Deployment27
requirements for the remote host
). These countries contain over 98% of the world's population (see Table 2) and over 99% of the online users of the Internet. Most of the hosts monitored are at educational or research sites. We try and get at least 2 hosts per country to help identify and avoid anomalies at a single host. The can be found here28
. Figure 1 below shows the locations of the monitoring and remote (monitored sites).
Figure 1 : Locations of PingER monitoring and remote sites as of Dec 2010. Red sites are monitoring sites, blue sites are beacons that are monitored by most monitoring sites, and green sites are remote sites that are
monitored by one or more monitoring sites
There are about eighteen hundred monitoring/monitored-remote-host pairs, so it is important to provide aggregation of data by hosts from a variety of "affinity groups". PingER provides aggregation by affinity groups such as HEP experiment collaborator sites, region, country, Top Level Domain (TLD), or by world region etc. The world regions, as defined for PingER, and countries monitored are shown below in Figure 2. The regions are chosen starting from the U.N. definitions29. We modify the region definitions to take into account which countries have HEP interests and to try and ensure the countries in a region have similar performance.
27 "PingER Deployment". Available http://www.slac.stanford.edu/comp/net/wan-mon/deploy.html 28 "Requirements for WAN Hosts being Monitored", Les Cottrell and Tom Glanzman. Available at http://www.slac.stanford.edu/comp/net/wan-req.html 29 "United Nations Population Division World Population Prospects Population database". Available http://esa.un.org/unpp/definition.html

10
Figure 2 Major regions of the world for PingER aggregation by regions, countries in white are not monitored
More details on the regions are provided in Table 2 that highlights the number of countries monitored in each of these regions, and the distribution of population in these regions.
Table 2: PingER Monitored Countries and populations by region Dec 2010
Regions # of Countries
Population of the Region
% of World Population
Africa 50 987805976 14.57% Balkans 10 69238964 1.02% Central Asia 9 80017292 1.18% East Asia 4 1534132345 22.62% Europe 31 526534194 7.76% Latin America 21 556994135 8.21% Middle East 13 225596597 3.33% North America 3 342360000 5.05% Oceania 4 33192700 0.49% Russia 1 141915979 2.09% S.E. Asia 11 577614703 8.52% South Asia 8 1584797000 23.37% Total 165 6660199885 98.21%
Historical Growth of PingER Coverage Since 1998
Figure 3 shows the growth in the number of hosts monitored by PingER from SLAC for each region since 1998. As can be seen, initially the main regions monitored were North America, Europe, East Asia, and Russia. These were the regions with the main HEP interest. More

11
recently the increased number of hosts monitored in developing regions such as Africa, Latin America, Middle East and South Asia is very apparent.
Figure 3 : Number of hosts monitored from SLAC by region at the end of each year 1998 – 2010
Towards the end of 2001 the number of sites monitored started dropping as sites blocked pings due to security concerns. The rate of blocking was such that, for example, out of 214 hosts that were pingable in July 2003, 33 (~15%) were no longer pingable in December 2003 even though they were still up and running (as measured by responding to TCP probes).
The increases in monitored sites towards the end of 2002 and early 2003 was due to help from the Abdus Salam Institute of Theoretical Physics (ICTP). The ICTP held a Round Table meeting on Developing Country Access to On-Line Scientific Publishing: Sustainable Alternatives30
Proposal for Real time monitoring in Africa in
Trieste in November 2002 that included a 31
Recommendations of the Round Table held in Trieste to help bridge the digital divide
. Following the meeting a formal declaration was made on
32
Internet Monitoring of Universities and Research Centers in Developing Countries
. The PingER project started collaborating closely with the ICTP to develop a monitoring project aimed at better understanding and quantifying the Digital Divide. On December 4th, 2002 the ICTP electronic Journal Distribution Service (eJDS) sent an email entitled
33
30
to their collaborators informing them of the launch of the monitoring project and requesting participation. By January 14th 2003, with the help of ICTP, we added about 23 hosts in about 17 countries including: Bangladesh, Brazil, China, Columbia, Ghana, Guatemala, India (Hyderabad and Kerala), Indonesia, Iran, Jordan, Korea, Mexico, Moldova,
Developing Country Access to On-Line Scientific Publishing: Sustainable Alternatives, Round Table meeting held at ICTP Trieste, Oct 2002. Available http://www.ictp.trieste.it/~ejds/seminars2002/program.html 31 Enrique Canessa, "Real time network monitoring in Africa - A proposal - (Quantifying the Digital; Divide)". Available http://www.ictp.trieste.it/~ejds/seminars2002/Enrique_Canessa/index.html 32 RECOMMDENDATIONS OF the Round Table held in Trieste to help bridge the digital divide. Available http://www.ictp.trieste.it/ejournals/meeting2002/Recommen_Trieste.pdf 33 Hilda Cerdeira and the eJDS Team, ICTP/TWAS Donation Programme, "Internet Monitoring of Universities and Research Centers in Developing Countries". Available http://www.slac.stanford.edu/xorg/icfa/icfa-net-paper-dec02/ejds-email.txt

12
Nigeria, Pakistan, Slovakia and the Ukraine. The increase towards the end of 2003 was spurred by preparations for the second Open Round Table on Developing Countries Access to Scientific Knowledge: Quantifying the Digital Divide 23-24 November Trieste, Italy and the WSIS conference and associated activities in Geneva December 2003.
The increases in 2004 were due to adding new sites especially in Africa, S. America, Russia and several outlying islands.
In 2005, the Pakistan Ministry Of Science and Technology (MOST) and the US State Department funded SLAC and the National University of Sciences and Technology’s (NUST), School of Electrical Engineering and Computer Sciences (SEECS, formerly known as NUST Institute of Information Technology (NIIT)) to collaborate on a project to improve and extend PingER. As part of this project and the increased interest from Internet2 in the “Hard to Reach Network Places” Special Interest Group, many new sites in the South Asia and Africa were added to increase the coverage in these regions and also to replace sites that were blocking pings. For instance we were unable to find pingable sites in Angola prior to December 2005. Also as part of this project we started to integrate PingER with the NLANR/AMP project and as a result a number of the AMP nodes were added as PingER remote hosts in the developing regions. With help of Duncan Martin and the South Africa Tertiary Education Network (TENET) (http://www.tenet.ac.za), we successfully set up a monitoring node in South Africa, which became a great help in viewing the Digital Divide from within the Divide. With the help of SEECS, NUST (www.niit.edu.pk), a monitoring node was set up at NUST and in Nov. 2005, another node was added at NTC (National Telecommunication Corporation www.ntc.net.pk), which is the service provider for the PERN (Pakistan Educational and Research Network www.pern.edu.pk).
Again in 2006 in preparation for a conference on Sharing Knowledge across the Mediterranean at ICTP Trieste Nov 6-8, 2006, we added many new sites especially in Africa. Additionally, new monitoring nodes were setup in Pakistan (National Center for Physics (NCP)), Australia (University of New South Wales) and South Korea (Kyung Hee University).
In 2007, an effort was made to find new monitored nodes in countries not previously being observed. This was:
• To improve comparisons with human and economic development indices from the ITU, the UNDP, the World Bank, the CIA and also measures of International bandwidth capacity/country.
• To better enable validation of PingER derived throughputs versus throughput measures from Ookla Speedtest.net and ZDnet speedtest.
• To prepare for case studies on South Asia34 and Sub-Saharan Africa35
• To prepare for invited talks given at the American Physical Society (APS) meeting in Jacksonville Florida
.
36, the IHY in Addis Ababa, Ethiopia37
34 “South Asia case Study”, Les Cottrell, available at: https://confluence.slac.stanford.edu/display/IEPM/South+Asia+Case+Study
, and the Sharing Knowledge
35 “Sub-Sahara case Study”, Les Cottrell, available at: https://confluence.slac.stanford.edu/display/IEPM/Sub-Sahara+Case+Study

13
Foundation in Montpellier, France38
• To prepare for a visit to NUST in Pakistan and talks to be given there.
. In addition a talk was given at the Internet2 Spring Members meeting.
• As a result of the collaboration with James Whitlock of the Bethlehem Alliance resulting in two monitoring hosts in Palestine (Jerusalem and the Gaza Strip).
As a result, in 2007, the total number of hosts monitored from SLAC went up from 334 to 442, the main increases being in Africa which went from 58 to 95 hosts, South Asia from 20 to 37 hosts, Middle East 15 to 26 hosts, and South East Asia from 12 to 22 hosts. We added over a hundred new hosts from Ookla servers which cover over 50 countries. In 2008 due to US Science budget cuts in particular in HEP, there were layoffs at SLAC and a redirection of goals that led to a much reduced support for PingER. This is discussed in the section “Outlook: cloudy” in http://www.symmetrymagazine.org/cms/?pid=1000639. Despite this, with some remaining funding from past projects, three graduate students from SEEC Pakistan and donated time it has successfully continued running. In 2009 the support for PingER continued at a similar level to that in 2008. We were fortunate to have continued support from Pakistan, including 2-3 graduate students and a lecturer, at SLAC for a year. The increase in number of hosts in Africa was enabled by invited talks in Ethiopia and Zambia, a paper at a conference in Namibia, a series of four lectures to African computing and networking people at a meeting at the ICTP in Trieste, and a talk on African Internet performance at the European Geophysical Union in Vienna.
In 2010 support for PingER continued especially in Pakistan, where about 17 new nodes were added. NUST SEECS also sent 2 students for one year each for work related to IEPM project. There was an increase in the number of hosts in Africa, Latin America, East Asia and South East Asia as well. Yearly loss trends
To assist in interpreting the losses in terms of their impact on well-known applications, we categorize the losses into quality ranges. These are shown below in Table 3.
Table 3: Quality ranges used for loss Excellent Good Acceptable Poor Very Poor Bad Loss <0.1% >=0.1% &
< 1% > =1% & < 2.5%
>= 2.5% & < 5%
>= 5% & < 12%
>= 12%
More on the effects of packet loss and RTT can be found in the Tutorial on Internet Monitoring & PingER at SLAC39, briefly: 36 “Quantitative Measurement of the Digital Divide”, Les Cottrell, Shahryar Khan, presented at the April APS meeting, Jacksonville Florida April 15, 2007 37 “Internet View of the Digital Divide, Especially for Sub-Saharan Africa,” presented by Les Cottrell at the IHY Africa Workshop 11-16 November 2007, Addis Ababa, Ethiopia 38 “Internet Connectivity in Africa” , presented by Les Cottrell at the Internet and Grids in Africa: An Asset for African Scientists for the Benefit of African Society, 10-12 December 2007, Montpellier France.

14
• At losses of 4-6% or more video-conferencing becomes irritating and non-native language speakers are unable to communicate effectively. The occurrence of long delays of 4 seconds (such as may be caused by timeouts in recovering from packet loss) or more at a frequency of 4-5% or more is also irritating for interactive activities such as telnet and X windows. Conventional wisdom among TCP researchers holds that a loss rate of 5% has a significant adverse effect on TCP performance, because it will greatly limit the size of the congestion window and hence the transfer rate, while 3% is often substantially less serious, Vern Paxson. A random loss of 2.5% will result in Voice Over Internet Protocols (VOIP) becoming slightly annoying every 30 seconds or so. A more realistic burst loss pattern will result in VOIP distortion going from not annoying to slightly annoying when the loss goes from 0 to 1%. Since TCP throughput for the standard (Reno based) TCP stack according to Mathis et. al. goes as 1460*8bits/(RTT*sqrt(loss))40
• For RTTs, studies in the late 1970s and early 1980s showed that one needs < 400ms for high productivity interactive use. VOIP requires a RTT of < 250ms or it is hard for the listener to know when to speak.
it is important to keep losses low for achieving high throughput.
Figure 4 shows the packet losses seen from SLAC to world regions for 1998 through 2010. Since losses are mainly dependent on the network edges, they tend to be independent of distance.
Figure 4: Packet Loss measured for various regions from SLAC in Nov 2010
39 R. L. Cottrell, "Tutorial on Internet Monitoring & PingER at SLAC". Available http://www.slac.stanford.edu/comp/net/wan-mon/tutorial.html 40 M. Mathis, J. Semke, J. Mahdavi, T. Ott, "The Macroscopic Behavior of the TCP Congestion Avoidance Algorithm",Computer Communication Review, volume 27, number 3, pp. 67-82, July 1997

15
It is seen that losses are lowest (best) for North America, East Asia, Europe and Oceania. They are highest (worst) for Central Asia and Africa. The improvement is roughly exponential with a factor of ~ 100 improvements in 10 years.
Yearly minimum RTT
In general for wide area paths the minimum RTT depends mainly on the length of the path between the two hosts. If the path uses a geostationary satellite (GEOS) then the round trip path for the radio signal is ~ 500ms41
. As can be seen for minimum RTT from SLAC to Africa in the figure below, there is a clear minimum RTTs threshold between 400 and 500ms between terrestrial paths and paths with GEOS links.
Figure 5: Minimum RTTs measured from SLAC to African countries, Sep 2010. If one looks at the minimum RTTs from SLAC to the world in 2008 and 2010 in the figure below, one can see the countries that have moved away from using GEOS links. This is particularly apparent for East Africa where the installation of fibre cables from Europe and from the Middle East to East African countries driven by the 2010 soccer world cup in South Africa dramatically reduced round trip delays. China’s minimum RTT has seen a tremendous decrease since 2008. In 2010 the minimum RTT dropped from being anywhere between 200 and 250ms to a maximum of 80ms. From the first internet user in Beijing in 1993, China’s online population has grown faster than anyone possibly imagined. China’s online population42 is approximately twice that of the US. China is home to fast-growing start-ups and established multi-billion dollar enterprises in social networking, games, video, music and e-commerce. Already four of the world’s top 15 websites – Baidu, QQ, Taobao and Sina – are located in China43
41 Geosynchronous satellite, see
. Such a huge market drives the need for massive improvement in architecture and consequential growth in sectors related to the internet and the World Wide Web.
http://en.wikipedia.org/wiki/Geosynchronous_satellite 42 China Internet Connection, see https://confluence.slac.stanford.edu/display/netmanpub/China+Internet+Connection 43 World’s Top 500 Global Sites, see http://www.alexa.com/topsites

16
Figure 6: Minimum RTTs from SLAC to the world in 2008 and 2010.
Yearly Throughput Trends
To combine the effects of loss and RTT we use the Mathis formula to calculate the TCP throughput. We have also reduced the effect44
norm_throughput = throughput * min_RTT(remote region) / min_rtt(monitoring_region),
of the 1/RTT in the Mathis formula for derived throughput by normalizing the throughputs using:
where:
throughput ~ 1460*8 bits/(RTT*sqrt(loss))
The results are shown in Figure 7 showing data averaged into yearly intervals.
Figure 7: Yearly averaged normalized derived TCP throughputs from the SLAC to various regions of the
world.
In particular note the improved performance as parts of Latin America moved from satellite to fibre in 2000, and the impact of moving the ESnet routing from E. Asia (in particular Japanese academic and research networks) to the US via New York in 2001 to a more direct route via the 44 A notable effect on derived throughput is that for measurements made from say a N. American site, such as SLAC, to other N. American sites, 1/RTT is large and so throughputs are artificially enhanced compared to measurements to more distant regions with longer RTTs.

17
West Coast of the US. Also note the factor of ~ 10 differences in throughput between Africa and N. America, Europe and Oceania. Finally note that Africa has been caught up and passed by S. Asia, Latin America, and Russia. Africa is now the worst off region and has the slowest rate of improvement. To make the overall changes stand out more clearly Figure 8 shows just exponential trendline fits to monthly averages of the derived throughput on a log-linear scale (exponentials show up as straight lines). These trendlines are useful to see in general how, a particular region is doing against others and over a period of time, against its past. For guidance, the top yellow line show what a 20% improvement per year would look like; this corresponds to roughly a factor of 10 in twelve years.
Figure 8: Derived Throughput kbits/sec from SLAC to the World (since the throughputs in this graph are not
normalized we have not shown N. America). The yellow line is to help show the rate of change. If one extrapolates Europe’s performance backwards to February 1992, it intercepts Africa’s performance today.
The slow increase for Europe in Figure 8 is partially an artifact of the difficulty of accurately measuring loss with a relatively small number of pings (14,400 pings/month at 10 pings/30 minute interval, i.e. a loss of one packet ~ 1/10,000 loss rate). Looking at the data points one can see that the East Asian and Oceanian trends catching Europe. Russia, Latin America and the Middle East are about 5-6 years behind Europe but are catching up. South East Asia is about 9 years behind Europe and keeping up. South Asia and Central Asia are about 12-14 years behind Europe and also keeping up. Africa as mentioned is ~ 18 years behind Europe and even worse has been falling further behind. If one extrapolates the trend lines for Africa and Europe to 2020 then at the current rate Africa’s throughput will be 30 times worse than Europe’s.
View from Europe
To assist in developing a less N. American view of the Digital Divide; we added many more hosts in developing countries to the list of hosts monitored from CERN in Geneva Switzerland.

18
We now have data going back for eight years that enables us to make some statements about performance as seen from Europe. Figure 9 shows the normalized throughput data from CERN to the rest of the world.
Figure 9: Normalized throughputs to various regions as seen from CERN.
As can be seen by comparing Figures 7 and 9 the general performance changes seen from CERN are very similar to those seen from SLAC.
Variability of performance between and within regions
The throughput results, so far presented in this report, have been measured from North American sites and to a lesser extent from Europe. This is since there is more data for a longer period available for the North American and European monitoring hosts. Table 4 shows more details of all the measured throughputs seen between monitoring and remote/monitored hosts in the major regions of the world. Each column is for all monitoring hosts in a given region, each row is for all monitored hosts in a given region. The cells are colored according to the median throughput quality for the monitoring region/monitored region pair. White is for derived throughputs > 10,000 kbits/s (good), green for <= 10,000 kbits/s and >5,000kbits/s (acceptable), yellow for <= 5,000kbits/s and > 1,000 kbits/s (poor), pink for <= 1000kbits/s (very poor) and > 100kbits/s red for <= 100kbits/s and > 1 kbits/s (bad), and grey for no measurements. The Monitoring countries are identified by the Internet two-character Top Level Domain (TLD). Just for the record CA=Canada, US=NET=GOV=United States, CH=Switzerland, DE=Denmark, UK=United Kingdom, AU=Australia, CN=China, HK=Hong Kong, KR=South Korea, TW=Taiwan, BO=Bolivia, MX=Mexico, IN=India, LK=SriLanka, PK=Pakistan, SU=Russia, DZ=Algeria, ZA=South Africa and BF=Burkina Faso. E. Asia includes China, Japan, South Korea, Taiwan; S. Asia is the Indian sub-continent; S.E. Asia includes Indonesia, Malaysia, Singapore, Thailand and Vietnam.

19
Table 4: Derived throughputs in kbits/s from monitoring hosts to monitored hosts by region of the world for November 2010.
As expected it can be seen that for most TLDs (represented in columns) the best possible throughput values represented by the outlined boxes, usually exist within a region. For example for regions with better Internet connectivity, such as Europe, higher throughput is seen from European monitoring sites to TLDs (CH, DE, IT and UK) that lie within Europe. However, if the regions are close enough in terms of connectivity, throughput values are relatively higher. For example performance is better between closely located regions such as: the Balkans and European countries; Russia and E. Asia (the Russian monitoring site is in Novosibirsk); Mexico and N. America (is better than Mexico and Latin American countries). This shows that network performance is not completely dependent on geographic proximity, but rather on how close the regions are on the map of Internet connectivity and performance. Also take for example Africa: higher throughput values are evident between Africa and the TLDs DE, IT, UK and then DZ rather than between African sites. This serves to illustrate the poor intra regional connectivity within Africa.
This table also shows that throughput values show large variability within regions (e.g. a factor of five between Burkina Faso and Algeria). To provide further insight into the variability in performance for various regions of the world seen from SLAC, Figure 10 shows various statistical measures of the losses and derived throughputs. The regions are sorted by the median of the measurement type displayed. Note the throughput graph uses a log y-scale to enable one to see the regions with poor throughput.
The most uniform region (in terms of Inter-Quartile-Range (75%-25%)/median for both derived throughput and loss) is Central Asia, probably since most of the paths use a geo-stationary satellite. The most diverse are Europe and East Asia. For Europe, Belarus stands out with poor performance. For East Asia, China stands out with relatively lower performance in terms of derived throughput.
20
Figure 10: maximum, 95, 90, 75 percentile, median, 25 percentile and minimum derived throughputs of
various regions measured from SLAC for Sep 2010 and ordered by median throughput.
Yearly Mean Opinion Score (MOS) trends
The MOS is used by the telecom industry to categorize the quality of phone calls. The MOS can be related to the loss, RTT and jitter of the circuit45
. With the emergence of Voice over IP (VoIP) it has become increasingly important to know what values of MOS are available on the Internet. A value of 5 is a perfect call; a value of 1 is no ability to communicate. The maximum MOS for VoIP is about 4.4. Typical values for usable VoIP are 4.2 to 3.5. Values below result in increasing frustration and inability to communicate. The Figure below shows MOS values from SLAC to regions of the world.
It is seen that VoIP should work well from SLAC to most regions, and be usable to Central and South Asia46
45 Calculating the MOS, see
. However it will probably not be usable to most of Africa.
http://www.slac.stanford.edu/comp/net/wan-mon/tutorial.html#mos 46 The PingER team is successfully holding weekly meetings using VoIP calls using Skype between SLAC in California and NUST in Islamabad, Pakistan. The quality is pretty good. The main problem is loss of connectivity due to power outages in Pakistan.

21
Figure 11: Mean Opinion Scores derived from PingER measurements from SLAC to regions of the world.
Comparisons with Economic and Development Indicators
The UN, the International Telecommunication Union (ITU) and various other task forces are independent expert bodies which aim to provide policy advice, based on various economic factors, to governments, funding sources, and international organization for the purpose of bridging the Digital Divide. See the table below for details.
In reality, it is difficult to classify countries according to their development. The main challenges lie in determining what factors to consider, how to measure them, how useful and pervasive they are, how well defined they are, and whether they are uniformly measured for every country. Various organizations such as the ITU, UNDP, CIA, World Bank etc. have come up with Indices based on measured items such as life expectancy, GDP, literacy, phone lines, Internet penetration etc. Although many of the above challenges are not insurmountable they can require a lot of cost and time. Thus, many of these measurements are outdated and may not depict the current state of the country.
One of the most important factors determining the economic development of a country in today’s information age is its Internet connectivity. Thus we may expect moderate to strong correlations between the economy and development of a country with its Internet performance measurement. The significance of also using PingER’s Internet measurements to characterize a country’s development is due to the fact that PingER’s data is current (up-to date within a day or so compared to say the most recent IDI data that was published in 2009 and was measured in 2007) and covers most of the countries of the world. The following table shows the most commonly used indices categorized by organizations which produce them, the number of countries covered and date of the latest data.

22
Table 5: Economic and development indicators
Abv. Name Organization No of countries
Date of Data
GDP Gross Domestic Product per capita CIA 229 2001-2008 HDI Human Development Index UNDP 182 2007-2009
DAI Digital Access Index ITU 180 1995-2003
NRI Network Readiness Index World Economic Forum
134 2008/2009
TAI Technology Achievement Index UNDP 72 1995-2000 DOI Digital Opportunity Index ITU 180 2004-2007 IDI ICT Development Index ITU 180 2002-2007 OI Opportunity Index ITU 139 1996-2003
CPI Corruption Perception Index Transparency Organization 180 2010
From this list of indices we selected the HDI and IDI (which supersedes DOI) for further analysis and comparisons with PingER measurements because they are enriched with most of the important factors, cover a large number of countries and are reasonably up-to-date.
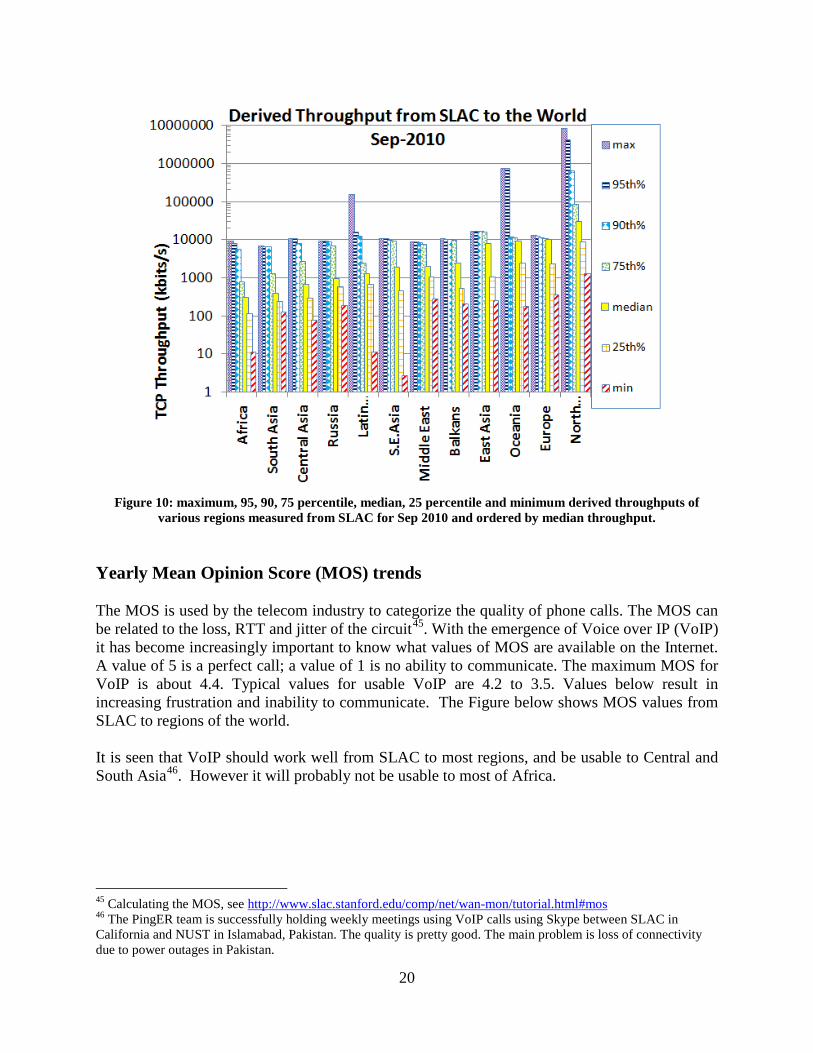
Human Development Index (HDI)
The UNDP Human Development Indicator (HDI) (see http://hdr.undp.org/reports/global/2002/en/) measures the average achievements in a country in three basic dimensions of human development:
• A long and healthy life, as measured by life expectancy at birth • Knowledge, as measured by the adult literacy rate (with two-thirds weight) and the
combined primary, secondary and tertiary education gross enrollment ratio (with one-third weight)
• A decent standard of living, as measured by GDP per capita (or Purchasing Power Parity (PPP) in US$).
23
Figure 12: Comparison of PingER derived throughputs seen from N. America to various countries and
regions versus the U.N. Development Program (UNDP) Human Development Indicator (HDI).
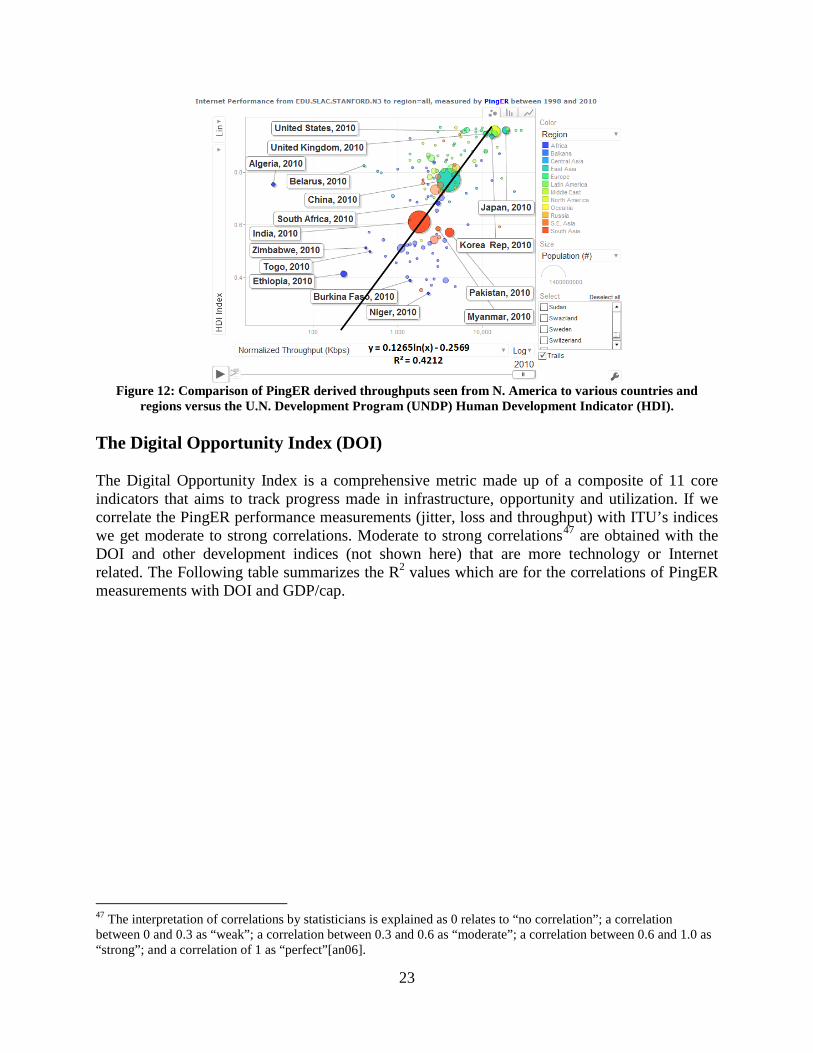
The Digital Opportunity Index (DOI)
The Digital Opportunity Index is a comprehensive metric made up of a composite of 11 core indicators that aims to track progress made in infrastructure, opportunity and utilization. If we correlate the PingER performance measurements (jitter, loss and throughput) with ITU’s indices we get moderate to strong correlations. Moderate to strong correlations47
47 The interpretation of correlations by statisticians is explained as 0 relates to “no correlation”; a correlation between 0 and 0.3 as “weak”; a correlation between 0.3 and 0.6 as “moderate”; a correlation between 0.6 and 1.0 as “strong”; and a correlation of 1 as “perfect”[an06].
are obtained with the DOI and other development indices (not shown here) that are more technology or Internet related. The Following table summarizes the R2 values which are for the correlations of PingER measurements with DOI and GDP/cap.

24
Figure 13: Normalized throughput vs. Digital Opportunity Index
Table 6: R2 values on correlations between PingER data vs. DOI and GDP/cap for 2008 Jitter (ms) Loss (%) Derived TCP Throughput Unreachability DOI 0.58 0.64 0.67 0.37 GDP/capita 0.61 0.53 0.59 0.35
The scatter-plot in the Figure 13 shows the correlation of PingER normalized derived throughput for 2010 versus DOI.
Global ICT Developments, 1998 to 2009
Despite the recent economic downturn, the use of ICT services, such as mobile phones and the Internet, seems to have suffered little from the crisis. Indeed, ITU figures display continuous growth in ICT services uptake. This is supported by continuously falling prices of devices such as computers and handsets. The steady growth of the number of mobile cellular subscriptions is striking, reaching an estimated 4.6 billion by the end of 2009 and a penetration of 67 per 100 inhabitants globally. This confirms that the demand for mobile telephony is fairly resilient, with consumers being willing to continue spending part of their disposable income on mobile services - even at times of financial constraints.

25
Figure 14: Global ICT developments from 1998 to 2009 Growth in mobile telephony continues to be strongest in the developing world where there are now more than twice as many mobile subscriptions as in the developed world (3.2 billion and 1.4 billion, respectively), reflecting the relative size of these markets. China and India alone account for over 1.2 billion subscriptions (750 million and 480 million, respectively). While in 2000, developing countries accounted for around 40% of total subscriptions, this share had increased to close to 70% by 2009. Mobile cellular penetration and internet penetration in developing countries was around 57 per 100 and 18 per 100 inhabitants respectively, by the end of 2009. While in developed countries cellular phone penetration largely exceeded 100% and internet penetration was over 64%. The relatively low cost of mobile cellular services and devices will continue to drive the mobile market growth globally.
Case Studies For the sake of continuity we discuss the case studies48
East Coast of Africa Fibre
at length as an annexure to this document. The case studies include a review of:
This has been summarized in the Executive Overview above.
Pakistan Education and Research Network
48 A complete archive of PingER case studies, https://confluence.slac.stanford.edu/display/IEPM/PingER

26
Over the last year, following a series of workshops and site visits, the team at NUST and SLAC has worked with Pakistan’s Education and Research Network (PERN) and Pakistani Universities to put together an end-to-end (E2E) network monitoring infrastructure for PERN connected higher education sites. So far they have installed the PingER monitoring tools and started gathering data at 18 sites in Pakistan. In addition they are working on a further 8 monitoring sites. This includes 4 sites (SEECS/NIIT, COMSATS, PERN and NCP/Quaid-i-Azam) which have been in place for a longer time. In 2010, a second instance of the SLAC archive-analysis site was set up at NUST. This provides backup for data and access, and improved performance for Pakistani users. Over the last year the number of monitoring host – remote host pairs (both in Pakistan) has increased from about 30 to over 500. From the data we have put together a case studyi
and are able to measure minimum and average Round Trip Times (RTT), jitter, loss, unreachability and derive throughput, directness of connections, and Mean Opinion Score (MOS).
A major concern has been the reliability of the monitoring hosts. We measure this using the unreachability metric. The
unreachability of the Pakistani PingER hosts in 2010 is shown in Table 7: % unreachability of Pakistani PingER hosts in 2010. Low numbers are good.
Figure 15: Locations of PingER hosts in pakistan. The red hosts are monitors, the green and blue are monitored (remote) hosts. The red lines show the hosts monitored from the NUST host in Islamabad. The colors of the lines indicate the average RTT in msec.

27
It is seen that several hosts exhibit high unreachability. The reasons behind the high unreachability are usually site specific and vary from lack of reliable power and a source of backup power, floods, lack of access to the site when there are problems that require physical access, lack of expertise, and lack of interest from a site.
The derived throughput seen from SLAC has increased by roughly a factor of 2 in 5 years. The Figure to the left shows that within Pakistan the throughput to Quetta is the poorest, followed by Karachi. Since most monitoring hosts are in the North of Pakistan, in particular in Islamabad, there are mainly long RTTs to Karachi and Quetta and hence low throughput (since throughput goes as 1/RTT. The MOS between Pakistani PingER hosts is shown in
the Figure to the left. It is apparent that the MOS is very variable, and according to the middle graph above appears to be decreasing slightly (getting worse) in time. Some of this decrease is
due to bringing on new hosts that have poorer MOS performance. If we fix on just aggregating the performance for hosts pairs that have been monitored for the whole period then the MOSD is fairly flat with time. The set of hosts that have been monitored for the entire page consists of: NEDUET, COMSATS, NCP, NUST, AUP, PERN, UET and LSE. In any case the MOS is well above the usability threshold of 3.5 mentioned above, so VoIP calls within
Pakistan between these hosts should be successful. To evaluate the directness of connectivity between
Pakistani hosts we use the alpha metric. The Figure below shows the alpha values between regions in Pakistan. It is based on the minimum RTTs seen between Dec 2009 and Nov 2010. It is seen that the links between Karachi and Lahore, Karachi and Islamabad, and Karachi and Peshawar are very direct (values of alpha close to one) and are also very consistent (low values of the standard deviations). Islamabad and Quetta apparently are connected very indirectly (low value of alpha).
Looking at a map the of PERN network connections49
49 See the case study at
this makes sense since the route goes via Karachi in the South and then back northwards to Quetta. The links between Islamabad and Lahore,
https://confluence.slac.stanford.edu/display/IEPM/Pakistani+Case+Study+2010-2011
Figure 18: Average Alpha measured between regions of Pakistan with the standard deviations (as error bars) and the number of host pairs contributing to the measurement.
Figure 17: Median MOS and Inter Quartile Range (IQR) between Pakistani hosts for 2010.
Figure 16: Derived throughput between Pakistani region in 2010.

28
Islamabad and Peshawar and Lahore and Peshawar all have lower values of alpha and thus appear to be more indirect and have higher variability. A common element in the links between these three regions is that they all pass through Islamabad.
High Performance Network Monitoring
New and Ongoing Monitoring and Diagnostic Efforts in HEP
PingER and the now discontinued IEPM-BW are excellent systems for monitoring the general health and capability of the existing networks used worldwide in HEP. However, we need additional end-to-end tools to provide individuals with the capability to quantify their network connectivity along specific paths in the network and also easier to use top level navigation/drill-down tools. The former are needed both to ascertain the user's current network capability as well as to identify limitations which may be impeding the user’s ultimate (expected) network performance. The latter are needed to simplify finding the relevant data.
Most HEP users are not "network wizards" and don't wish to become one. In fact as pointed out by Mathis and illustrated in Figure 19, the gap in throughput between what a network wizard and a typical user can achieve was growing significantly from the late 1980’s to the late 1990’s
Figure 19: Bandwidth achievable by a network wizard and a typical user as a function of time. Also shown are some recent network throughput achievements in
the HEP community.
Within the last decade, because of improvements in default OS TCP stack settings, new protocols, hardware, firmware and software, this gap has decreased but still remains. Because of
29
HEP's critical dependence upon networks to enable their global collaborations and grid computing environments, it is extremely important that more user specific tools be developed to support these physicists and continue to decrease the gap between what an expert can achieve and what a typical user can get “out of the box”
Efforts continue in the HEP community to develop and deploy a network measurement and diagnostic infrastructure which includes end hosts as test points along end-to-end paths in the network. This is crtical for isolating problems, identifying bottlenecks and understanding infrastructure limitations that may be impacting HEP’s ability to fully utilize their existing networks. The E2E piPEs project50 NLANR/DAST Advisor project, the 51 LISA and the 52
perfSONAR
(Localhost Information Service Agent) initiated developing an infrastructure capable of making on demand or scheduled measurements along specific network paths and storing test results and host details for future reference in a common data architecture. The project has become the organizing entity for these efforts during the last three years (2008-10) and is broadly supported (see below). The perfSONAR effort is utilizing the GGF NMWG53
perfSONAR-PS
schema to provide portability for the results. This information can be immediately used to identify common problems and provide solutions as well as to acquire a body of results useful for baselining various combinations of hardware, firmware and software to define expectations for end users. In addition the distribution includes many of the tools (PingER, NDT, Advisor, Iperf, traceroute server etc) which are the recognized standards in network testing and diagnosis
Efforts to insure commonality in both monitoring and provisioning of networks are continuing The GLIF54 DICE and 55
A primary goal is to provide as "lightweight" a client component as possible to enable widespread deployment of such a system. The LISA Java Web Start client is one example of such a client, and another is the
communities are both working toward implementing “managed” network services and the corresponding monitoring that will be needed to support their efforts. HEP (US LHCnet, the various HEP network research projects and the national labs) is working within these groups to insure our needs are being addressed.
Network Diagnostic Tester (NDT56
50 “End-to-end Performance Initiatives Performances Environment System”, Internet2, see
) tool. By using Java and Java Web Start, the most current testing client can be provided to end users as easily as opening a web page. The current NDT version supports both Linux and Windows clients and is being maintained by Rich Carlson (formerly Internet2, now DOE). In addition to inclusion in perfSONAR, the typical network client tools (NDT and NPAD) are now included in the Open Science Grid (OSG) software distributions since v2.0.0. This allows easy access to these diagnostic tools wherever OSG is deployed.
http://e2epi.internet2.edu/e2epipes//index.html 51 “Version 2.0 of Advisor Realesed”, NCSA, see http://access.ncsa.illinois.edu/Releases/05Releases/03.08.05_Version_2..html 52 “MonALISA: LISA”, Caltech, see http://monalisa.cern.ch/monalisa__Interactive_Clients__LISA.html 53 “OGF Network Measurement Working Group”, Internet2, see http://nmwg.internet2.edu/ 54 “Global Lambda Integrated Facility”, see http://www.glif.is/ 55 “DANTE-Internet2-CANARIE-ESnet collaboration, see http://www.geant2.net/server/show/conWebDoc.1308 56 http://www.internet2.edu/performance/ndt/index.html
30
The goal of easier-to-use top-level drill down navigation to the measurement data is being tackled by MonALISA57
Nagios in collaboration with the perfSONAR project. During fall of 2010
additional service monitoring capabilities were added with a package of “plugins” which allow detailed monitoring of perfSONAR services and test results. Tom Wlodek at BNL has been working closely with the USATLAS Throughput working group in developing a set of service and measurement tests that can be tracked in customized Nagios server pages setup at BNL. Some details will be shown later in this section.
The US ATLAS collaboration has made an extensive effort to improve the throughput of their Tier-1 and Tier-2 centers and has coupled this with active testing and monitoring to track performance over time. Bi-weekly meetings of the USATLAS Throughput working group focu on throughput, network measurements and related site issues.. This group is working in two primary areas: 1) automated transfer throughput testing using ATLAS production systems and 2) deployment and integration of perfSONAR at all USATLAS Tier-2 sites and the Tier-1 site at Brookhaven. We will discuss perfSONAR deployment and experience in USATLAS in the next section and will focus on the automated (and manual) throughput testing USATLAS is using here.
57 “MonALISA: Welcome”, Caltech, see http://monalisa.cacr.caltech.edu/monalisa.htm

31
Figure 20 Example production system throughput test results between to USATLAS Tier-2 centers storage areas: AGLT2_DATADISK and MWT2_UC_MCDISK from November 16, 2010 to January 15, 2011
The perfSONAR infrastructure is intended to measure the network (LAN,WAN) between perfSONAR test nodes but this is not sufficient to characterize the “end-to-end” behavior of the distributed systems in use in HEP. The USATLAS throughput group has developed some additional automated (and manual) tests to accurately measure their system capabilities and limits. Hiro Ito (BNL) has developed an automated data transfer service which sends a fixed number of files between sites using the standard ATLAS production system and records the results. Results of these tests are available at http://www.usatlas.bnl.gov/dq2/throughput where you can find details on the number of successful transfers, their throughput and timing. One example graph is shown in Figure 16 which shows test dataset transfer throughput between two USATLAS Tier-2 centers: AGLT2 and MWT2. During 2009-10, the system was extended to include Tier-2 to Tier-3 tests (in addition to the standard Tier-1 to Tier-2 tests originally defined). These results, in combination with perfSONAR results, are being used to identify problems in the overall system and isolate their likely location. One goal for 2011 is to be able to utilize the production system results and the perfSONAR results during the same time periods to more accurately localize any problems that may arise.

32
In addition to automated testing USATLAS has setup manual “Load Tests” designed to characterize the maximum transfer capability between sites. A “Load Test” TWiki page at http://www.usatlas.bnl.gov/twiki/bin/view/Admins/LoadTests has further details on some initial tests. One of the milestones of the USATLAS throughput group was achieving 1 GigaByte/sec from the Tier-1 to a set of Tier-2’s. This was demonstrated in October 2009 and is shown in Figure 21. Individual Tier-2’s with 10 gigabit Ethernet connectivity were also individually validated as being able to achieve at least 400 MBytes/sec in early 2010 as an additional milestone.
Figure 21: USATLAS Throughput milestone (1GB/sec for 1 hour)
perfSONAR in USATLAS As mentioned above, most HEP users are not interested in becoming network wizards nor do they have the expertise to diagnose network related problems. Within USATLAS a significant effort has been made to deploy and integrate perfSONAR at all Tier-1/Tier-2 sites in the US to provide a standardized set of tools and corresponding network measurements to aid in problem isolation and diagnosis as well as for baseline monitoring. The plan for USATLAS has been to deploy two perfSONAR instances (each on their own, identical hardware) at each distinct Tier-2 site (as well as the Tier-1 at BNL). We achieved a complete production-ready state in Fall of 2010 using the V3.2 release of perfSONAR-PS provided by Internet2 and ESnet.

33
Since many USATLAS Tier-2’s are physically distributed at more than one location, more than 2 systems per Tier-2 are deployed. It was important that all sites deploy identical hardware to remove hardware variations that might impact measurements. An inexpensive system with 2 1GE onboard NICs (~$635) from KOI computing was identified in Fall 2008 and has been deployed at 8 Tier-2 sites and BNL. Two systems per site are required to allow both throughput and latency tests to be undertaken which would interfere with each other if they ran on the same system. Since these systems were purchased, some issues with the particular 1 GE NIC and hard-disk controller have been identified and Internet2 has created new recommendations for future perfSONAR purchases. During 2010 the University of Michigan purchased a Dell R410 system as a possible “intergrated” hardware node intended to run both latency and bandwidth tests from a single system. This node has been made available to the perfSONAR developers and we hope to have a perfSONAR deployment capable of utilizing this hardware sometime in 2011. While all sites have systems deployed, the Western Tier-2 (WT2) at SLAC had to work with perfSONAR, ESnet and USATLAS to come up with a solution that met their production security requirements inside their border. This customized version was operational in early summer of 2010.
The perfSONAR systems in USATLAS are intended to run full-mesh tests for both throughput and latency with all other USATLAS Tier-2’s and the Tier-1. The latency role is assigned to the first node (typically designated with a ‘1’ in the DNS name) by convention while the throughput role is assigned to the second node. Installation is made straightforward by simply booting a recent ISO image provided by Internet2 and doing a one-time configuration of the node. Configuration results as well as measurements are persisted onto the local hard-disk of the system being configured.
Figure 22: Example OWAMP test between two USATLAS Tier-2's (bi-directional testing is enabled)
34
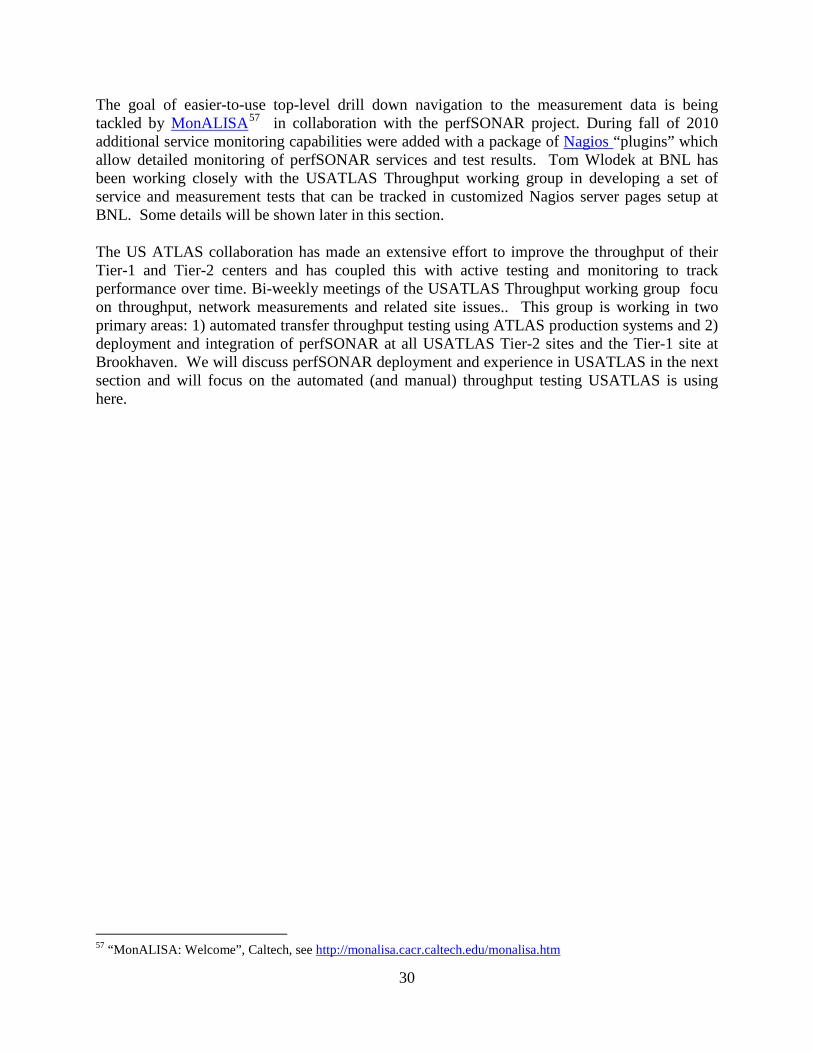
Figure 23: Example PingER graph between the Tier-1 and a Tier-2
The latency tests have two variations. The first is managed by OWAMP and measures one-way delays between the latency node and its test partner at another site. Since absolute time accuracy is critical for this test, part of a latency node configuration includes setting up a reliable time service (ntpd) configuration to insure the node keeps accurate time. The second type of latency test is provided by PingER which is configured by default to send 600 ping packets between the latency node and its target and track the results. Examples of both types of tests are shown in Figure 22 and Figure 23.
Figure 24: Example bi-directional throughput test in perfSONAR between two Tier-2s

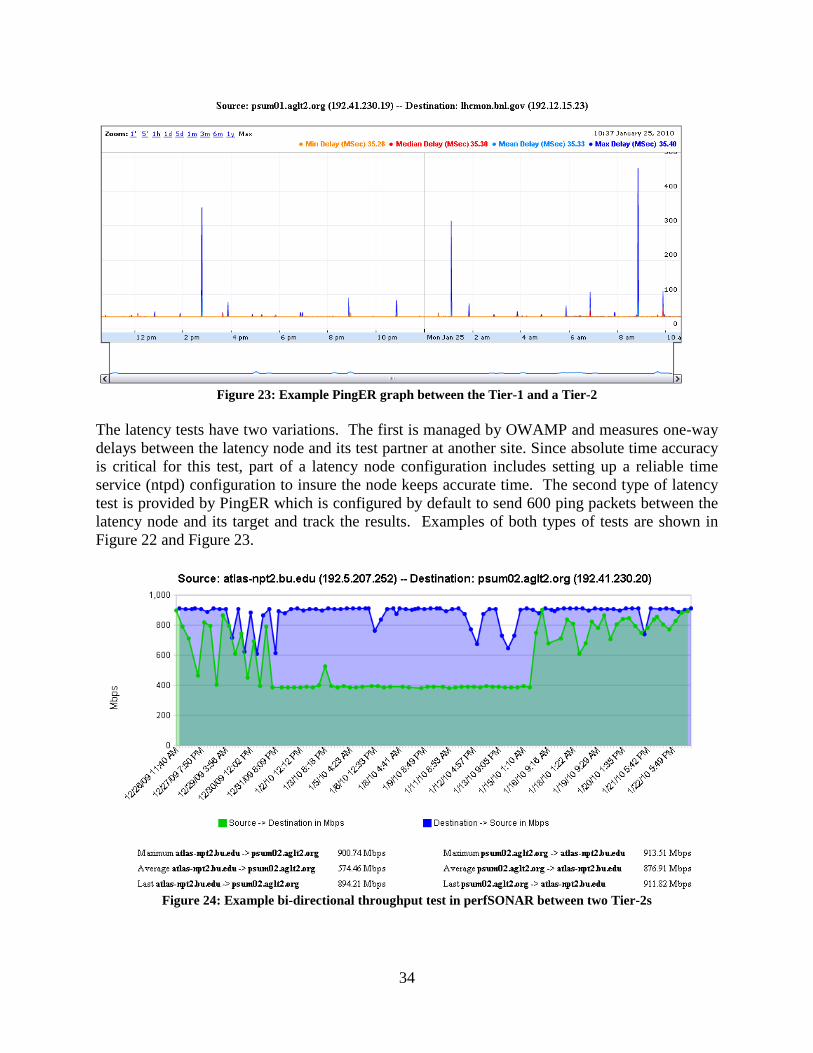
35
The second perfSONAR node measures throughput using Iperf. Example results are shown in Figure 24 which illustrates some interesting throughput changes during the 1 month of measurements shown.
Incorporating perfSONAR into USATLAS “operations” is underway starting in Fall 2010. The Throughput working group is incorporating the Nagios plugins mentioned above to track both the perfSONAR infrastructure (verifying services continue to be operational) and validating the resulting network measurements. The goal is to have the system alert sites when there are significant changes in network behavior so problems can be quickly found and fixed. An example of the service monitoring is shown in Figure 25 below.
Figure 25 Example perfSONAR monitoring using the BNL Nagios server. The detailed status of
perfSONAR services can be tracked and alerts of problems automatically sent. The two services shown in "red" indicate a known firewall issue that is being addressed.
The USATLAS group has provided important feedback to the perfSONAR distribution developers and has identified a number of bugs which impact the reliability and usability of the distribution. Once a sufficiently robust distribution is identified USATLAS plans to recommend broader perfSONAR deployment to include Tier-3 sites. Having a perfSONAR instance at Tier-3’s can help compensate for the lack of manpower and expertise at these sites and allow remote experts access to necessary information for diagnosing network or end-site issues. As of v3.2 (released in October 2010) we have achieved a level of robustness that may allow us to recommend broad deployment of perfSONAR to Tier-3 sites in 2011.
It should also be noted that having perfSONAR services running co-located with important resources provides the ability to run “on-demand” tests using the broadly deployed NDT and NPAD tools. These tools can be run from any remote location, testing to any perfSONAR instance. This is a very important additional capability that can be vital in network diagnosis.
perfSONAR is already broadly deployed in Research and Education network PoPs (Internet2, GEANT2, ESnet) and it is hoped that more collaborations within HEP will deploy perfSONAR instances co-located with their computing and storage resources. Having a more extensive deployment significantly improves the value and applicability of the overall perfSONAR infrastructure for HEP.
36
LHC-OPN Monitoring
During the last two years there has been a concerted effort to deploy and monitor the central data distribution network for the Large Hadron Collider (LHC). This network, dubbed the LHC-OPN (Optical Private Network), has been created to primarily support data distribution from the CERN Tier-0 to the various Tier-1’s worldwide. In addition, traffic between Tier-1 sites is also allowed to traverse the OPN.
Given the central role this network will play in the distribution of data it is critical that this network and its performance be well monitored. A working group was convened in Fall of 2005 to study what type of monitoring might be appropriate for this network. A number of possible solutions were examined including MonALISA, IEPM-BW/Pinger, various EGEE working group efforts and perfSONAR58
By Spring of 2006 there was a consensus that LHC-OPN monitoring should build upon the perfSONAR effort which was already being deployed in some of the most important research networks. perfSONAR is a standardized framework for capturing and sharing monitoring information, other monitoring systems can be plugged into it with some interface “glue”.
.
During 2007 a newly created organization named the E2ECU (End to End Coordination Unit), operated by the GEANT2 NOC, started using perfSONAR tools to monitor the status of almost all the circuits in the LHCOPN.
DANTE has proposed and deployed a no-cost managed network measurement service to the LHCOPN community to perform significantly more robust measurement of the LHCOPN, including active latency & bandwidth tests, link utilization, etc all based on perfSONAR tools & protocols. This deployment was completed in early 2010 and is being used to track the system of the LHCOPN and its performance.
Related HEP Network Research
There has been a significant amount of research around managed networks for HEP that we should note. There are efforts funded by the National Science Foundation (UltraLight59
Terapaths (finished
Aug 2009), PLaNetS) and Department of Energy ( 60
LambdaStation (finished Dec 2009),
61 OSCARS (finished 2009), 62
ESCPS, and the associated follow-on projects StorNet and
63
58 “Performance focused Service Oriented Network monitoring Architecture”, see
projects) which are strongly based in HEP. These projects are not primarily focused upon monitoring but all have aspects of their efforts that do provide network information
https://wiki.man.poznan.pl/perfsonar-mdm/index.php/Main_Page 59 “An Ultrascale Information System for Data Intensive Research”, see http://www.ultralight.org/web-site/ultralight/html/index.html 60 “Terapaths”, https://www.racf.bnl.gov/terapaths/ 61 “Lambda Station”, see http://www.lambdastation.org/ 62 “ESnet On-demand Secure Circuits and Advance Reservation System”, ESnet, see http://www.es.net/oscars/index.html 63 “End Site Control Plane Surface”, see https://plone3.fnal.gov/P0/ESCPS

37
applications. Some of the existing monitoring discussed in previous sections are either came out of these efforts or are being further developed by them.
In summer 2010 a new NSF MRI project was funded called DYNES64
Comparison with HEP Needs
. The DYNES collaboration (Internet2, Caltech, Michigan and Vanderbilt) intends to create a virtual distributed instrument capable of creating dynamic virtual circuits on-demand between the participating member sites. The LHC community and its data access and transport requirements are the primary “users” targeted by this new infrastructure. Funding was provided to initially deploy DYNES at 40 institutions and 14 regional networks within the United States. DYNES intends to leverage prior work related to virtual circuit construction, QoS and perfSONAR to enable the required capabilities. Instrument deployment will begin in spring 2011 and the project has a 3 year lifetime.
Previous studies of HEP needs, for example the TAN Report (http://gate.hep.anl.gov/lprice/TAN/Report/TAN-report-final.doc) have focused on communications between developed regions such as Europe and North America. In such reports packet loss less than 1%, vital for unimpeded interactive log-in, is assumed and attention is focused on bandwidth needs and the impact of low, but non-zero, packet loss on the ability to exploit high-bandwidth links. The PingER results show clearly that much of the world suffers packet loss impeding even very basic participation in HEP experiments and points to the need for urgent action.
The PingER throughput predictions based on the Mathis formula assume that throughput is mainly limited by packet loss. The 25% per year growth curve in Figure 13 is somewhat lower than the 79% per year growth in future needs that can be inferred from the tables in the TAN Report. True throughput measurements have not been in place for long enough to measure a growth trend. Nevertheless, the throughput measurements, and the trends in predicted throughput, indicate that current attention to HEP needs between developed regions could result in needs being met. In contrast, the measurements indicate that the throughput to less developed regions is likely to continue to be well below that needed for full participation in future experiments.
Accomplishments since last report
During 2010 we have been working hard to improve our monitoring systems to ensure high quality and justifiable quantity of Network Performance Metrics for 97% of the Internet. Some of our major Accomplishments, between Jan 2010 – Jan 2011 are listed below:
1. We have added 22 new nodes in PingER, to increase its coverage. 2. In order to keep track of PingER sites, we now have a quick look interface65
64 “Development of Dynamic Network System”, Internet2, see
.
http://www.internet2.edu/ion/dynes.html 65 Check Remote Site Status (http://www-wanmon.slac.stanford.edu/cgi-wrap/checkremote.cgi)

38
3. We created smokeping graphs, to provide a better look, at ill performing sites, as well as to catch any anomalies, which would be hard to identify otherwise. We have deployed smokeping graphs at NUST SEECS (Islamabad, Pakistan) in order to introduce redundancy as well as providing better tools for visualizing Pakistan’s inter-regional data.
4. The perfSONAR_PS team schedules quarterly perfSONAR releases (or shorter release periods in response to identified security problems), leveraging strong community support from USATLAS and other virtual organizations who provide testing and feedback. The latest release (perfSONAR_PS toolkit version 3.2) is now based on CentOS 5.566
5. PerfSONAR was deployed by Pakistan for the first time in South Asia. Two separate nodes for bandwidth and latency tests were deployed at NUST SEECS (Islamabad, Pakistan). This is a part of Pakistan’s Higher Education Commission (HEC) to analyze the inter-connectivity of Pakistan Education and Research Network (PERN). PERN connects all the major universities all across Pakistan.
. Previously it was a Knoppix based toolkit. This improves security and compatability.
PingER Extensions This year there have been three major extensions.
Porting PingER Archive/Analysis Toolkit to SEECS
In addition to the PingER archive sites at SLAC and FNAL a PingER archive site was setup at NUST. As is the case with the archive at SLAC, the site at NUST maintains the PingER meta-database, the PingER data and publishes the PingER reports. The setup of this PingER archive site included the following steps:
1. Setup of the PingER meta-database and an interface to manage it. 2. Synchronization of the SLAC and NUST meta-databases with SLAC taking priority.. 3. Setup of software to download, validate, analyze and aggregate PingER data from
PingER monitoring sites worldwide, and publish up-to-date PingER reports.
Archiving and publishing of results The archiving process includes more than ten sest of scripts which download, validate, analyze and aggregate and finally publish the PingER data. The documentation for all the scripts involved, their deployment and configuration details are listed online. These include:
• Generating and synchronizing configuration files (between SLAC and NUST) • Downloading PingER data from PingER monitoring nodes worldwide • Generating PingER-nodes’ maintenance information • Validation, analysis and aggregation of PingER data • Publishing PingER data, analysis reports and visualizations
66 perfSONAR toolkit shifts to CentOS 5.5 (http://psps.perfsonar.net/toolkit/releasenotes/pspt-3_2.html)

39
• Publishing miscellaneous reports such as the list of project participants67
SmokePing Graphs
Identifying a change in performance of a network link is of utmost importance. As network performance analyst working on the forefront of Internet, we recognize the need for applications and tools, which can help us, identify and analyze any anomaly. To show detailed time series we developed a SmokePing application. An example is shown below.
Figure 26: Smokeping graph showing the use the median RTT (blue) losses (background colors) and jitter
(smoke).
These graphs provide a quick look, at the performance of a link, over a period of 120 days, 30 days, 10 days, 7 days, 3 days and 1 day. The median RTT is shown as a blue line with multi layers of gray shade above and below to show the jitter. The background color, at that time, represents percentage of packet loss. Complete loss of connectivity is indicated by a black background.
These graphs are plotted using RRDs generated, periodically. One of the problems, with this model is that, the most recent data being plotted is up to a day old and is only available for up to a period of 120 days in the past.
The graphs, offer a wide variety of customizable options, shown in the Figure below, for the user to manipulate the output, in a way that he or she thinks is better. For example the height and width of the graphs are selectable, as is the period of time displayed and the choices of background colors representing the losses.
67 http://pinger.fnal.gov/participants.html

40
Figure 27: Smokeping web page showing the various options that can be selected.
The graph for any node can be viewed, by click the monitoring host link from “pingtable”, against any monitored node or a beacon site.
Improved PingER map68
• This now:
• Allows the selection of what types of hosts (monitors, beacons, remote) to display. • Selection of area to zoom in on • Ability to enter the name of a city etc and zoom into it • Selection of source host and destination country and drawing of arcs between relevant
hosts • Coloring of arcs according to selected metric value for link • Clicking on hosts provide meta data on host and ability to drill down go more details such
as: o On demand ping and traceroute between selected hosts o Display of smokeping from SLAC to the host, and pingtable plots from selected
to other hosts in its region or country of relevant information
2010 Digital Divide Publications/Presentations:
Publications
68 PingER Map, see http://www-wanmon.slac.stanford.edu/wan-mon/viper/pinger-coverage-gmap.html

41
• The Internet, Mobile Computing and Mobile Phones in Developing Countries, Les Cottrell, opening chapter in the book “m-Science Sensing, Computing and Disemmination” ISBN 92-95003-43-8, November 2010..
Talks
• African Internet Performance, Fibres and the Soccer World Cup, prepared by Les Cottrell, presented at the eGYAfrica conference, Accra, November 2010.
• Monitoring the World's Networks, Harvey Newman and Les Cottrell, Slides prepared for CHEP10, in Taipei, Taiwan October 2010.
• Collaborative DOE Network Monitoring, Yee-Ting Li, DoE Annual Review, LBNL, October 5-6 2010.
• African Internet Performance, Fibres and the Soccer World Cup, Les Cottrell, lecture presented at SPACE Weather School: Basic theory & hands-on experience, University of Helwan / Egypt, Sept 18 - Oct 3, 2010.
• How is the Internet performing, Les Cottrell, lecture presented at SPACE Weather School: Basic theory & hands-on experience, University of Helwan / Egypt, Sept 18 - Oct 3, 2010.
• Network Problem diagnosis for non-networkers, Les Cottrell, lecture presented at SPACE Weather School: Basic theory & hands-on experience, University of Helwan / Egypt, Sept 18 - Oct 3, 2010.
• Network Measurements, Les Cottrell, lecture presented at SPACE Weather School: Basic theory & hands-on experience, University of Helwan / Egypt, Sept 18 - Oct 3, 2010.
• Geolocation, Les Cottrell, lecture presented at SPACE Weather School: Basic theory & hands-on experience, University of Helwan / Egypt, Sept 18 - Oct 3, 2010.
Recommendations
There is interest from ICFA, ICTP, IHY and others to extend the monitoring further to countries with no formal HEP programs, but where there are needs to understand the Internet connectivity performance in order to aid the development of science. Africa is a region with many such countries. The idea is to provide performance within developing regions, between developing regions and between developing regions and developed regions.
We should ensure there are >=2 remote sites monitored in each Developing Country. All results should continue to be made available publicly via the web, and publicized to the HEP community and others. Typically HEP leads other sciences in its needs and developing an understanding and solutions. The outreach from HEP to other sciences is to be encouraged. The results should continue to be publicized widely.
We need assistance from ICFA and others to find sites to monitor and contacts in the developing and the rest of the world, especially where we have <= 1 site/country. A current list of countries with active nodes can be found at http://www-iepm.slac.stanford.edu/pinger/sites-per-country.html.
Future Support

42
Although not a recommendation per se, it would be disingenuous to finish without noting the following. SLAC, SEECS, NUST & FNAL are the leaders in the PingER project. The funding for the PingER effort came from the DoE MICS office since 1997, however it terminated at the end of the September 2003, since it was being funded as research and the development is no longer regarded as a research project. From 2004 onwards, development was continued with funding from the Pakistani Higher Education Commission (HEC) and the US State Department. Further funding for this research collaboration -- between SLAC and NUST -- was acquired from HEC for three years i.e. 2008-2010. This funding is primarily used for human resource development i.e. providing opportunities for graduating students to work at SLAC and participate in the research and development activities. The development consists of extending and enhancing the project, fixing known non-critical bugs, improving visualization, automating reports generated by hand today, finding new country site contacts, adding route histories and visualization, automate alarms, updating the web site for better navigation, adding more Developing Country monitoring sites/countries, and improve code portability. The daily management, operation and supervising/leading the development was continued with discretionary funding from the SLAC and FNAL HEP programs. The management and operation includes maintaining data collection and archiving, explaining needs, identifying and reopening broken connections, identifying and opening firewall blocks, finding replacement hosts, making limited special analyses and case studies, preparing and making presentations, responding to questions. The equipment performing this is currently in place at both SLAC and FNAL. Management, operation and supervision require central funding at a level of about 15% of a Full Time Equivalent (FTE) person, plus travel. This has been provided by discretionary funding from the HEP budgets of SLAC and FNAL. The 2008 cuts in the US science budget, the impact on the Department of Energy, HEP and SLAC (see http://www.science.doe.gov/News_Information/speeches/speeches/08/SC08.htm?ReleaseNumber=mr20080124-00) have meant that SLAC no longer has discretionary funding and has thus no longer officially supports the Digital Divide activities. Without funding, for the operational side, the future of PingER and reports such as this one is unclear, and the level of effort sustained in previous years will not be possible. The work this year was accomplished with funding from Pakistan to support the students and pro-bono support from SLAC. Many agencies/organizations have expressed interest (e.g DoE, ESnet, NSF, ICFA, ICTP, IDRC, UNESCO, IHY) in this work but none have so far stepped up to funding the management and operation.
Acknowledgements We gratefully acknowledge the following: the assistance from NUST SEECS in improving the PingER toolkit and management has been critical to keeping the project running, with respect to this we particularly acknowledge the support of their leader Arshad Ali; and the students and lectuers who have assisted including: Umar Kalim, Shahryar Khan, Qasim Lone, Fahad Satti and Zafar Gilani of NUST SEECS who helped in updating some of the graphs, the case studies on Africa and Pakistan and implementation of PingER tools such as TULIP. Shawn McKee of the University of Michigan kindly provided the sections on LHC-OPN Monitoring and Related Network Research. Mike Jensen provided much useful information on the status of networking

43
in Africa69
. Alberto Santoro of UERJ provided very useful information on Latin America. Sergio Novaes of UNESP and Julio Ibarra of Florida International University provided useful contacts in Latin America. We received much encouragement from Marco Zennaro and Enrique Canessa of ICTP and from the ICFA/SCIC in particular from Harvey Newman the chairman. Jared Greeno of SLAC provided very valuable system administration support. We must also not forget the help and support from the administrators of the PingER monitoring sites worldwide.
69 Mike Jensen, "Connectivity Mapping in Africa", presentation at the ICTP Round Table on Developing Country Access to On-Line Scientific Publishing: Sustainable Alternatives at ITCP, Trieste, October 2002. Available http://www.ictp.trieste.it/~ejds/seminars2002/Mike_Jensen/jensen-full.ppt

44
Appendices PingER can help in establishing comprehensive analysis of poor internet connection at any region/country which can help to eliminate/pin-point problems and hence can lead to improving bandwidth in that region. Some of our recent work is shown below in different case studies. The detailed reports are available online70
Appendix A: Sub-Saharan Africa - Fibre Updates for year 2010
.
Introduction This case study is an extension to older studies titled “Sub Saharan Africa Case Study” [see-https://confluence.slac.stanford.edu/display/IEPM/Sub-Sahara+Case+Study] and “Sub Saharan Africa Revised Statistics for 2008 and 2009” [see- https://confluence.slac.stanford.edu/display/IEPM/Sub-Saharan+Africa+-+Revised+Statistics+(2008)]. In general this case study studies and analyzes the effect of even newer Fibre around the East and West Coasts of Africa. For details see [https://confluence.slac.stanford.edu/display/IEPM/Sub-Saharan+Africa+-+Updates+for+year+2010].
In the last case study we noted the dramatic decrease in RTT due to deployment of submarine fibre cables around the East Coast of Africa for the 2010 Soccer World Cup. The work has continued with good pace and more new submarine cables have come online since then around both East and West Coasts of Africa.
In this case study we look at the current state of Internet access for Africa as measured by the PingER project and also at the effect of the new submarine cable connections71
SLAC National Accelerator Center on the RTTs
to countries of Africa as seen from the near San Francisco and from the International Centre for Theoretical Physics (ICTP) near Trieste Italy. The main effects seen so far are on the RTTs for selected sites that have converted to using the terrestrial links. As the new routes stabilize and more and more customers, e.g. academia and commercial organizations, subscribe to the service, we can expect to also see lower losses and jitter and higher through-puts together with a wider impact on deployment.
PingER monitors over 165 sites in 50 African countries that contain about 99% of Africa's population. The African countries that are not currently monitored are Chad, Comoros, Equatorial Guinea, Sao Tome & Principe and Western Sahara. The results from PingER are used heavily in this study. Below is seen a map of the PingER sites in Africa. The red dots indicate PingER monitoring sites, the blue are beacon sites that are monitored by most of the over 40 PingER monitoring sites around the world, and the green are other sites monitored by at least one monitoring site.
70 A complete archive of PingER case studies, https://confluence.slac.stanford.edu/display/IEPM/PingER 71 http://manypossibilities.net/african-undersea-cables/

45
Figure 28: PingER nodes in Africa
This study first provides updates on the new submarine fibres coming into place for East and West African coasts. It goes on to summarize the current state and trends of Internet performance for Africa and the costs particularly for West and East Africa. Following this we discuss the updates on the emerging National Research and Education Networks (NRENs) and traffic routing. Then we look at the RTTs of hosts in Morocco, Madagascar and Reunion French Colony following the start of operation of EASSy72
Submarine Fibre Cables for African Coasts
and LION cable systems, the identification of further hosts of interest, followed by the changes in RTTs as hosts later moved their routing from satellite to terrestrial routes.
To meet the bandwidth requirements for the 2010 Soccer World Cup, the East Coast of Africa was connected to South Asia, Middle-East and Europe via Seacom cable system73
functioning since July 2009. Seacom has a
capacity of 1.28 Tb/s and has been . Seacom connects South Africa, Mozambique, Tanzania, Kenya and Djibouti. However there were two limitations: Madagascar was connected only via satellite links and secondly Seacom only provides a bandwidth capacity of 1.28Tb/s which is not enough by modern requirements. To address these issues Eastern Africa Submarine Cable Systems (EASSy) and Lower Indian Ocean Network (LION) cable systems were laid out to connect East Coast of Africa, Madagascar and surrounding islands to high speed terrestrial internet connection. EASSy became operational in August 2010. It connects (from South to North) South Africa, Mozambique, Madagascar, Tanzania, Kenya, Somalia, Djibouti and Sudan. EASSy connects three more terrestrially unconnected countries i.e. (from South to North) Madagascar, Somalia and Sudan. It has an operational capacity of 3.84 Tb/s, which is exceptional in the sense that it is the highest bandwidth providing submarine cable currently operational. Towards the East, the LION cable system became operational in March 2010 having
72 The East African Submarine System http://eassy.org/ 73 “SEACOM”, see http://www.seacom.mu/index2.asp

46
a capacity of 1.30 Tb/s. It connects Madagascar to the islands of Mauritius and Reunion French Colony.
On the West Coast of Africa, phase 1 of MaIN OnE cable system was completed in July 2010. It has a capacity of 1.92 Tb/s connecting Morocco, Canary Islands, Senegal, Cote d’Ivoire, Ghana and Nigeria. The phase 2 of this cable is enroute to South Africa via Cameroon, Congo, D. R. of Congo, Angola and Namibia and due to be completed soon. It must be noted that all the countries connected via phase 1 were previously connected by SAT3/WASC having a capacity of only 0.34 Tb/s. The state of international fibres to Africa until June 2009 is shown in the figure below. At the time the only access was the SAT3/WASC/SAFE cable around the West Coast of Africa. This cable provides a major improvement for bandwidth and QoS.
Figure 29: African Submarine cables in 2008
The state today is shown in the figure below.

47
Figure 30: African submarine cables 2010-2011
Minimum RTTs of <~ 400ms are typically a signature of a geostationary link. Looking at the maps below of minimum RTTs to African countries and comparing 2009 with 2010 one can see the impact of the new fibre/terestrial routes in particular for East Africa in the apparent reduction of minimum RTTs below 400ms for several countries. However there is still a striking number of countries in Central Africa with minimum RTTs of >400ms, which is indicative that they are using GEO-Stationary (GEOS) satellite links.
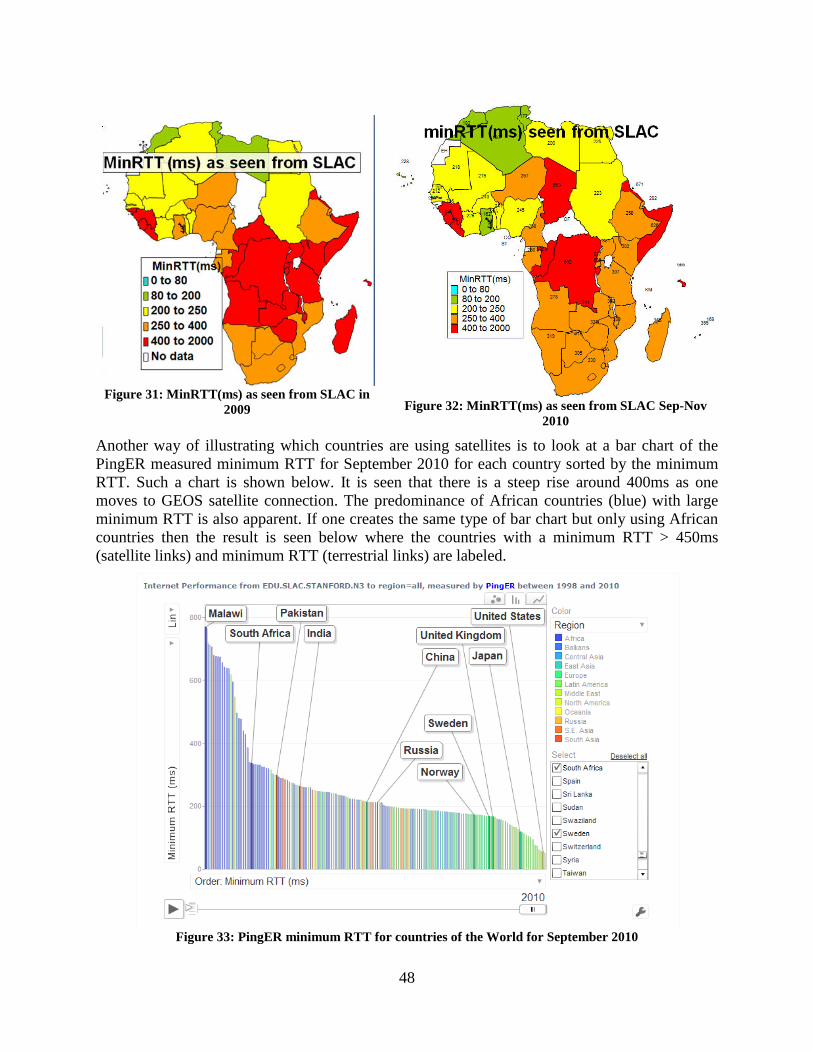
48
Figure 31: MinRTT(ms) as seen from SLAC in
2009
Figure 32: MinRTT(ms) as seen from SLAC Sep-Nov 2010
Another way of illustrating which countries are using satellites is to look at a bar chart of the PingER measured minimum RTT for September 2010 for each country sorted by the minimum RTT. Such a chart is shown below. It is seen that there is a steep rise around 400ms as one moves to GEOS satellite connection. The predominance of African countries (blue) with large minimum RTT is also apparent. If one creates the same type of bar chart but only using African countries then the result is seen below where the countries with a minimum RTT > 450ms (satellite links) and minimum RTT (terrestrial links) are labeled.
Figure 33: PingER minimum RTT for countries of the World for September 2010

49
Figure 34: PingER minimum RTT for African Countries in Africa in 2010
The next step for Africa is to extend the connections from the coast inland and to landlocked countries. This has already happened for Uganda and Rwanda. See the examples below of the reduction in RTT with the move to using the terrestrial paths.
Figure 35: Change in RTT from SLAC to Ugandatelecom.ug in September 2009

50
Figure 36: Change in RTT from SLAC to www.kie.ac.rw in September 2009
A map74
Non fibre optic Solutions of available fibres within Africa is available from the Ubuntu Alliance.
The Google-backed O3b (other 3 billion) venture has raised $1.2bn from a group of investors and banks, and says these new funds will last until the satellite launch in 2013. Its stated aim is to bring broadband coverage to much of the globe, potentially serving the 3bn - almost half the world's population - that currently lacks high speed access. Its satellites should cover all regions within 45 degrees of latitude north and south of the equator, which would include "emerging and insufficiently connected markets in Latin America, Africa, the Middle East, Asia and Australia." Its first eight satellites will be launched by Arianespace from French Guyana in 2013, though this is will be almost three years later than originally claimed by founder Greg Wyler, who said in 2008 that the system would be running by the end of 2010. When the satellites do get running, they will reach 70% of the population by orbiting four times closer to earth than usual geostationary birds, which should also reduce latency.
Current State of the African Internet The derived throughputs measured to Africa from N. America for the last decade are shown below in Figure 27. It is seen that not only do African sites lag the rest of the world in throughput, being roughly in the state that European sites were over a decade and a half ago, but also they are falling further behind with time. Further, bear in mind that for Africa, Mediterranean countries and South Africa have the better performance and central and east Africa was worst (see Figure 32). Thus the arrival of a terrestrial submarine fibre cable link to the rest of the world for E. Africa is a very significant development.
One can get an idea of how far behind Africa is compared to the rest of the world by comparing the PingER Internet throughputs, losses and Mean Opinion Scores (MOS), from the figures below:
74 See http://www.ubuntunet.net/fibre-map

51
Figure 37: Throughput from SLAC to Regions of the World
Figure 38: Losses from SLAC to Regions of the World

52
Figure 39: Mean Opinion Score (MOS) from SLAC to Regions of the World
The derived throughputs measured from monitors around the world to African countries for September to November 2010 is shown in the map below. The map shows the maximum of the average monthly derived TCP throughput75
here
for the hosts in the country. We chose the hosts with the maximum throughput since these are typically at the academic and research sites in the country and represent the best available internet connection in the country. The differences in the minimum median and maximum average monthly throughputs for hosts in each country are also shown sorted by maximum throughput in the bar-chart. A spreadsheet is available .
75 “Deriving TCP throughput from ping measurements” available at http://www.slac.stanford.edu/comp/net/wan-mon/tutorial.html#derive.

53
Figure 40: Derived Throughput from the world to Africa Sep-Nov 2010
The variability between and within African countries is shown in the Figure below.
Figure 41: Derived TCP throughput measured from the world to Africa Sep-Nov 2010
Prices in Africa Fixed broadband76 prices vary from as little as USD 4.4/Mbps in Sri Lanka, to as much as USD 1329/Mbps in the Central African Republic. East Africa contains 300M people, yet less than 3% are Internet users77
76 The 2006
. Bandwidth in Africa is still very expensive as compared to other developed parts of the world. In most African countries, with only a few exceptions, (such as Mauritius, South Africa, Cape Verde, Kenya and Senegal), fixed broadband access costs over USD 50/Mbps per month, and even more in PPP$. For example the bandwidth costs for broadband in Africa are 8 times more than the Americas and 16 times more than the Europe. Taken together with the earnings differences, what takes say 10% of an American Gross National Income (GNI) per capita will take over 480% of a Sub-Saharan GNI per capita. This is twice as low as last year
OECD report defines broadband as having download data transfer rates equal to or faster than 256 kbit/s. 77 Internet Usage in Africa (http://www.internetworldstats.com/stats.htm)

54
but still very high. The exorbitant average cost of fixed broadband in Africa, in both USD and PPP$ is illustrated in figure below.
Figure 42: Fixed broadband sub-basket by region and by level of development, 2009
Emergence of National Research and Education Networks (NRENs) & Routing In the past the area has had poor Internet connectivity with heavy use of expensive (in terms of $/Mbps) geostationary satellite connections to the outside world (see above). In addition most of the traffic between countries made use of expensive international links via Europe and the U.S. rather than more direct connections. There are active movements to create National Research and Education Networks (NRENs) in the area, see for example "Sub-Saharan Africa: An update" by Boubaker Barry. This, together with direct connections between countries will enable more direct peering. These NRENs in turn are peering with the GEANT network in Europe through the Ubuntunet Alliance. The map on the left below shows the state of African NRENs in 2010, the map on the right shows the Founding Ubuntunet Alliance members and those who have joined since the founding. The figure at the bottom shows the prediction (in October 2008) for the state of Ubuntunet connections at the end of 2009.

55
Figure 43: NRENs in Africa Oct 2010
Figure 44: Ubuntunet Alliance
Figure 45: Ubuntunet End 2009, from Duncan Martin
To understand the importance of NRENs and IXPs to reduce the use of intercontinental providers to get between African countries, we can look at the state of direct connections between African countries by measuring the traceroutes within Africa. Below on the left and the right are routes taken from South Africa to other African countries in September 2005 and August 2009 and at the bottom the routes from Burkina Faso to other African countries in August 2009. In the map on the right, countries which were only accessible by satellite have horizontal shading lines.

56
Figure 46: Routing from South Africa to Africa Sep
2005. Figure 47: Routing from South Africa to Africa Aug 2009
Figure 48: Traffic routes as seen from Burkina Faso August 2009
In September 2005 most traffic from South Africa to the rest of Africa took costly international links, only Botswana and Zimbabwe had direct routes. The situation has improved recently as direct routes from South Africa to Namibia and Botswana were added. More details on the routes to African countries from several measurement points around the world measured in spring 2009 can be seen in a spreadsheet of African routing and inferences.
Connections from Burkina Faso in August 2009 were direct to only Senegal, Mali, and Benin (in green). Most other countries in grey were reached by intercontinental connections via Europe,

57
followed by many in teal that go via Europe and N. America. Somalia was reached via Europe, N. and S. America. Burundi was reached via Europe, N. America and E. Asia.
Results Illustrating Impact of Changes To assist in the selection of hosts in this region from the pingtable results, we created a group of hosts that were each connected to one of the new cable systems connected up in 2010. This is particularly useful in comprehending the impact of deployment of new cable systems.
Morocco We have three PingER nodes in Morocco. The node www.agpe.ma shows no particular change in minimum RTT since MaIN OnE came online. The node was experiencing problems before and during June but reappeared in late June. There were considerable spikes during July with minimum RTTs jumping around. This might be due to day/night variations in internet traffic. This could also be due to reconfiguration of routing tables because of shifting to new cable system. This might also suggest the reason for decrease in spikes because of more available bandwidth.
Figure 49: www.agpe.ma from SLAC
There is a noticeable difference in the minimum RTTs for the node at www.marwan.ma. The RTT drops from 250ms in June to 200ms in July and then stabilized around 230ms from August onwards. It is interesting to observe the spikes in the month of June when the MaIN OnE wasn't online and the sudden drop in RTT during July. It is also interesting to note the stability of minimum RTTs after July.
Figure 50: www.marwan.ma from SLAC

58
Madagascar The www.pnae.mg host in Madagascar shows substantial change in minimum RTT. Before the deployment of EASSy cable system, this host was connected to rest of the world via a satellite link, reporting minimum RTT of 707ms in July. But in August things changed as the minimum RTT experienced a dramatic drop to a reasonable reading of 386ms. However it must be added that the performance is still not stable. This might be due to variation in day/night internet traffic quantity.
Figure 51: www.pnae.mg from SLAC
Reunion French Colony The host at webmail.izi.re doesn't show any appreciable difference in minimum RTT since the LION cable system became active. We do not have data as far back as March but minimum RTT readings during January, February and March were 364ms, 372ms and 390ms respectively. These readings and the graph also show that this trend continued. We observed 365ms, 364ms and 355ms of RTTs during the months of April, May and October respectively.
Figure 52: webmail.izi.re from SLAC
We have a strong reason to believe that webmail.izi.re is not in Reunion French Colony, rather it is somewhere in France. The reason we believe this is the case is by looking at the RTTs from France and Italy.

59
Seen from ICTP Trieste Italy If one compares the RTTs seen from SLAC to East and West Africa with those seen from ICTP in Trieste Italy which is much closer, then:
• for www.marwan.ma from ICTP the change is from ~62ms to ~54ms while from SLAC it is 250ms to ~200ms.
• for www.pnae.mg from ICTP the change is from 556ms to 264ms (or just over a factor of 2 times) while from SLAC it is 707ms to 386ms (or just under a factor of 2 improvement)
Though we show several time series of median RTT for hosts in various countries which have converted from GEOS to landlines, in all the countries above there are still hosts that are connected via GEOS.
Other nearby Countries Similar effects (dramatic reduction in RTTs) have also been observed for other sites in East and West African countries.
Rwanda The minimum RTT from SLAC to www.kist.ac.rw reduced from 638ms in May 2010 to 230ms in June 2010 and 227ms in October 2010. The reason for such a dramatic decrease (almost a factor of 3) is due to EASSy cable system coming online. Rwanda doesn’t directly connect to EASSy cable system. However Rwanda will get its share of EASSy pie thru Tanzania. The traceroute from SLAC to www.kist.ac.rw goes via Tiscali’s router (an Italian communications company) then thru Interoute’s network in Germany, Netherlands and the UK to Rwanda.
Figure 53: Rwanda: www.kist.ac.rw

60
Fractional Conversion The table below shows the number of hosts monitored from SLAC in the country and the number of those that used a terrestrial path as of a particular date.
Table 8: Number of monitored African hosts connected via terrestrial links
Monitored
Terrestrial
Oldest Measured Data
1st observed conversion
12/17/10
12/17/10
Angola Oct 2006
May 19, 2009
3
1
Botswana
Apr 2009
None
3
2
Ethiopia
Nov 2008
June 9, 2009
5
5
Kenya
Feb 2005
Aug 2, 2009 5
5
Lesotha
Feb 2005
None
4 4
Madagascar
Dec 2003
July 2010
3 1
Malawi
Mar 2005
Feb 2010
2
2
Mozambique
Dec 2003
May 2007
2 2
Namibia
Feb 2007
None
2
2
Rwanda
Mar 2005
Oct 17, 2009
3
3
South Africa
Feb 2005
None
14
14
Swaziland
Oct 2007
Feb 2009
3
3
Tanzania
Dec 2003
Sep 26, 2009
5
5
Uganda
Nov 2003
Aug 3, 2009
3
3
Zambia
Feb 2009
Aug 20, 2009
8 4
Zimbabwe
Feb 2007
Mar 2010
5
3

61
Other Regions in Sub-Saharan Africa On September 6th, 2009 it was reported that the Glo-1 Submarine cable landed in Lagos, Nigeria. The 9800km cable was coming from Bude in the UK to connect Nigeria to the rest of West Africa and the UK. It has landing points in Nigeria, London and Lisbon in Portugal. It is deploying 16 branching units to connect countries in West Africa. It is a project jointly executed by Globacom and its partners, Alcatel Lucent. this brings competition to the SAT3/WASC/ cable consortium. In May 2010 the Main One cable landed on the West Coast of Africa
African BGP prefixes The Border Gateway Protocol (BGP) backs the routing decisions on the Internet. It maintains a table of IP networks or 'prefixes' which designate network reachability among autonomous systems (AS). Thus the number of prefixes is roughly the number of networks that appears on the Internet. The number of BGP prefixes for Africa is shown below. The data is from BGPMon and there is a spreadsheet here. It is seen that for Africa Egypt leads by a factor of about two over South Africa (the country with the second most BGP prefixes). It is also seen that when one compares Africa with the rest of the world it has fewer networks than all other regions both for IPv4 and the upcoming IPv6 prefixes (note the number of African countries with no IPv6 prefixes).
Figure 54: Table of top 25 countries with
number of prefixes
Figure 55: African BGP prefixes per country

62
Figure 56: IPv4 BGP prefixes per country
Figure 57: IPv6 BGP prefixes per country
Further Reading • Africa Undersea CablesSub-Saharan Africa – Updates for the year 2010. • Sub-Saharan Africa – Updates for the year 2010.

63
• The Cable Guy: How to Network a Continent is a great Wired UK article that tells a compelling story illustrating the physical dimension and the challenges of deploying broadband in Africa.
• How to Cross the Digital Divide, Rwanda-Style provides an interesting case study of how Rwanda has been able to somewhat bridge the digital divide in a methodological manner.
• Internet prices to fall with surge in clients • Linking Tunisia with Italy • MANGO-NET (Made in Africa NGO NET work) • O3b (Other 3 billion) project, backed by Google

64
Appendix B: New PingER monitoring nodes in Brazil, Egypt, Mexico, Nepal and Pakistan
We have deployed new monitoring nodes in Brazil, Egypt, Mexico, Nepal and Pakistan. We now have ~ 70 monitoring hosts in 22 countries. Overall we added 2 nodes in Brazil, one in Egypt, one in Mexico City, one in Nepal and a total of 17 in Pakistan. The table below lists all the added nodes.
Table 9: New PingER monitoring sites, URLs, regions and Countries Monitoring Site URLs City Country Universidade Federal do Rio de Janeiro cc.if.ufrj.br Rio de
Janeiro Brazil
Centro Federal, de Educacao Celso Cukow ford.cefet-rj.br Rio de Janeiro
Brazil
National Authority for Remote Sensing and Space Science www.narss.sci.eg Cairo Egypt Centro de Operacion de la RED CUDI Operado por la UNAM
itzcoatl.noc.cudi.edu.mx Mexico City Mexico
Nepal Research and Education Network mon01.nren.net.np Khatmandu Nepal Allama Iqbal Open University pinger.aiou.edu.pk Islamabad Pakistan University of Arid Agriculture at Rawalpindi pinger.uaar.edu.pk Islamabad Pakistan UET at Taxila pinger.uettaxila.edu.pk Islamabad Pakistan International Islamic University at Islamabad vle.iiu.edu.pk Islamabad Pakistan NED University of Engineering & Technology npm.neduet.edu.pk Karachi Pakistan Lahore School of Economics 111.68.102.40 Lahore Pakistan Punjab University, ITC Department (pinger-itc.pu.edu.pk) pinger-itc.pu.edu.pk Lahore Pakistan FAST at Lahore pinger.lhr.nu.edu.pk Lahore Pakistan National College of Arts pinger.nca.edu.pk Lahore Pakistan UET at Lahore pinger.uet.edu.pk Lahore Pakistan Agriculture University of Peshawar pinger.aup.edu.pk Peshawar Pakistan Hazara University at Mansehra pinger.hu.edu.pk Peshawar Pakistan KUST at Kohat pinger.kohat.edu.pk Peshawar Pakistan UET at Peshawar pinger.nwfpuet.edu.pk Peshawar Pakistan FAST at Peshawar pinger.pwr.nu.edu.pk Peshawar Pakistan University of Science & Technology at Bannu pinger.ustb.edu.pk Peshawar Pakistan University of Balochistan pinger.uob.edu.pk Quetta Pakistan

65
Appendix C: Deployment of PerfSONAR in Pakistan
PerfSONAR stands for Performance Service Oriented Network ARchitecture. PerfSONAR is an infrastructure for network performance monitoring, making it easier to solve end-to-end performance problems on paths crossing several networks. It contains a set of services delivering performance measurements in a federated environment. These services act as an intermediate layer, between the performance measurement tools and the diagnostic or visualization applications. This layer is aimed at making and exchanging performance measurements between networks, using well-defined protocols.
It is significantly different from the PingER project in terms of how it performs tests and gathers results. PingER utilizes pings to derive metrics such as RTT, throughput, IPDV, etc. PerfSONAR uses IPerf and One-way latency tests to measure throughput and latency respectively over a given path crossing several networks. Another significant difference is the amount of traffic generated over the link. PingER is network efficient and introduces minimum load over the network. PerfSONAR is usually configured to introduce load over the network during tests.
PerfSONAR has an ever increasing international community of hosts that collaborate in carrying out useful inter-regional and inter-continental internet performance analyses. The Higher Education Commission (HEC) of Pakistan wanted to deploy PerfSONAR in Pakistan to analyze the performance and connectivity of Pakistan Education and Researchers Network (PERN) with the rest of the world using PerfSONAR infrastructure.
For this purpose two independent nodes for bandwidth and latency tests respectively were deployed at NUST School of Electrical Engineering and Computer Science in the capital city of Islamabad in fall 2010. These nodes were initially deployed for test purposes to take note of Pakistan’s performance monitoring needs. These needs shall be accommodated before deploying PerfSONAR infrastructure at Network operation centers of PERN throughout the country.

66
Appendix D: Tools we Use
PingER Validation Toolkit Since its inception, the size of the PingER project has grown to where it is now monitoring hosts in over 164 countries from about 42 monitoring hosts in 21 countries. With growth in the number of monitoring as well as monitored (remote) nodes, it was perceived that automated mechanisms need to be developed for managing this project. We therefore developed a tool that runs daily and reports on the following: • Database errors such as invalid or missing IP addresses, all hosts have an associated region,
each host only appears once in the database, all hosts have a latitude and longitude, the names of the monitoring hosts match the labeling of the data gathered from the monitoring host, each host has a unique IP address.
• The list of beacons are now generated from the database, as is the list of sites to be monitored
• We ping all hosts, those not responding are tested to see if they exist (i.e. they do not respond to a name service request), whether they respond to any of the common TCP ports, if so they are marked as blocking pings. If they do not ping with the IP address we try the name in case the IP address has changed.
• We track how long a host pair (monitor host/remote host) has not successfully pinged and whether the remote host is blocked.
• We keep track of how long we have been unable to gather data from each monitoring host. • We also compare the minimum RTT for sites within a region with one another and look to
see whether any are outside 3-4 standard deviations. This is designed to help find hosts that are not really located in a region (e.g. a web site proxied elsewhere).

67
PingER Metrics Motion Charts
The PingER metrics motion charts are primarily used to visualize the trends in the Internet end-to-end performance statistics measured to about 164 countries from the 40+ PingER monitoring nodes spread worldwide. Having gathered data since 1998, the charts enable the users to study the trends, step changes, significant improvements/degradations with the help of these 5-dimensional charts. The different sets of charts (w.r.t. regions) enables the users to study the progress made by countries in comparison to their neighbours as well as the world in general. Also, the charts help in spotting unusual performance estimates.
The charts were developed using Google’s motion chart widget and can be accessed online78
The tool presents PingER data since 1998 and has the following features:
in any flash enabled browser.
1. Study the trends while choosing either of the metrics listed below for any of the 4 axis (x-axis, y-axis, size of the bubble, colour of the bubble from a defined gradient).
i. Minimum Round Trip Time ii. Average Round Trip Time
iii. Normalized Derived Throughput iv. Packet Loss v. Jitter
vi. Ping Unreachability vii. Country Population
viii. Corruption Perception Index (CPI) ix. Human Development Index (HDI) x. Digital Opportunity Index (DOI)79
xi. ICT Development Index (IDI)
xii. Number of Internet users in the country xiii. Percentage of Internet Penetration
2. The fifth axis is time. The relationship of these metrics with respect to time can be observed by playing back the motion charts.
3. Since the metrics presented are gathered by PingER at intervals of 30 mins, their relationships can be studied at different granularity levels, i.e. last21days, monthly, yearly.
4. Also, the vantage point or monitoring site can be selected from the following available options:
78 PingER Metrics Motion Charts, see http://www-iepm.slac.stanford.edu/pinger/pinger-metrics-motion-chart.html 79 DOI is superseded by IDI from 2007 onwards. We maintain DOI till 2007 and IDI from 2007 onwards.
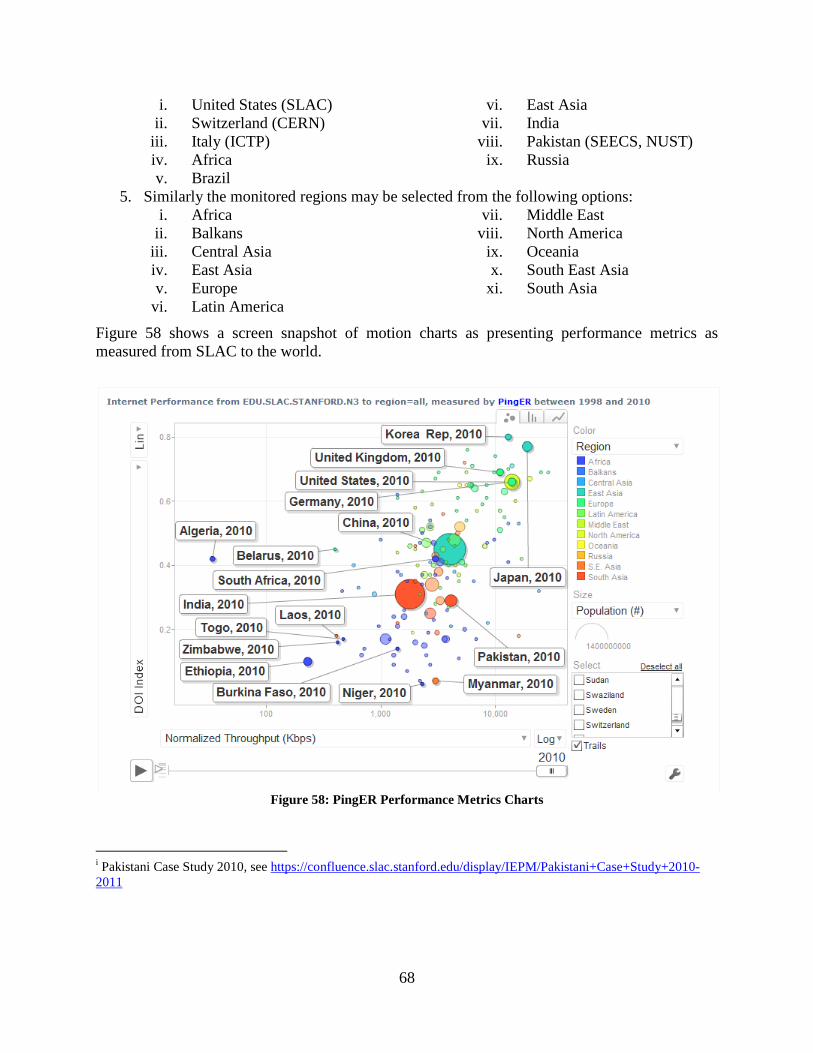
68
i. United States (SLAC) ii. Switzerland (CERN)
iii. Italy (ICTP) iv. Africa v. Brazil
vi. East Asia vii. India
viii. Pakistan (SEECS, NUST) ix. Russia
5. Similarly the monitored regions may be selected from the following options: i. Africa
ii. Balkans iii. Central Asia iv. East Asia v. Europe
vi. Latin America
vii. Middle East viii. North America
ix. Oceania x. South East Asia
xi. South Asia
Figure 58 shows a screen snapshot of motion charts as presenting performance metrics as measured from SLAC to the world.
Figure 58: PingER Performance Metrics Charts
i Pakistani Case Study 2010, see https://confluence.slac.stanford.edu/display/IEPM/Pakistani+Case+Study+2010-2011