IC GROUP ANNUAL REPORT2014/15
98
IC GROUP ANNUAL REPORT 2014/15
Transcript of IC GROUP ANNUAL REPORT2014/15
I C G R O U PA N N U A L R E P O R T 2 0 1 4 / 1 5

MANAGEMENT COMMENTARY 1 FINANCIAL HIGHLIGHTS AND KEY RATIOS
2 THE GROUP AT A GLANCE
3 FINANCIAL FACTS
4 PREFACE
6 CORPORATE STRATEGY
10 OUTLOOK
12 PERFORMANCE BY BRAND
20 FINANCIAL REVIEW
22 RISK MANAGEMENT
26 CORPORATE RESPONSIBILITY
27 CORPORATE GOVERNANCE
28 MANAGEMENT
33 SHAREHOLDER INFORMATION
CONSOLIDATED FINANCIAL STATEMENTS 36 CONSOLIDATED INCOME STATEMENT
36 CONSOLIDATED STATEMENT OF
COMPREHENSIVE INCOME
37 CONSOLIDATED STATEMENT OF FINANCIAL POSITION
38 CONSOLIDATED STATEMENT OF CHANGES IN EQUITY
39 CONSOLIDATED STATEMENT OF CASH FLOWS
40 NOTES TO THE CONSOLIDATED FINANCIAL
STATEMENTS
STATEMENTS 74 MANAGEMENT’S STATEMENT
75 THE INDEPENDENT AUDITOR’S REPORT
GROUP STRUCTURE AND KEY RATIOS 76 GROUP STRUCTURE
77 DEFINITION OF KEY RATIOS
PARENT FINANCIAL STATEMENTS 80 INCOME STATEMENT
80 STATEMENT OF COMPREHENSIVE INCOME
81 STATEMENT OF FINANCIAL POSITION
82 STATEMENT OF CHANGES IN EQUITY
83 STATEMENT OF CASH FLOWS
84 NOTES TO THE PARENT COMPANY
FINANCIAL STATEMENTS
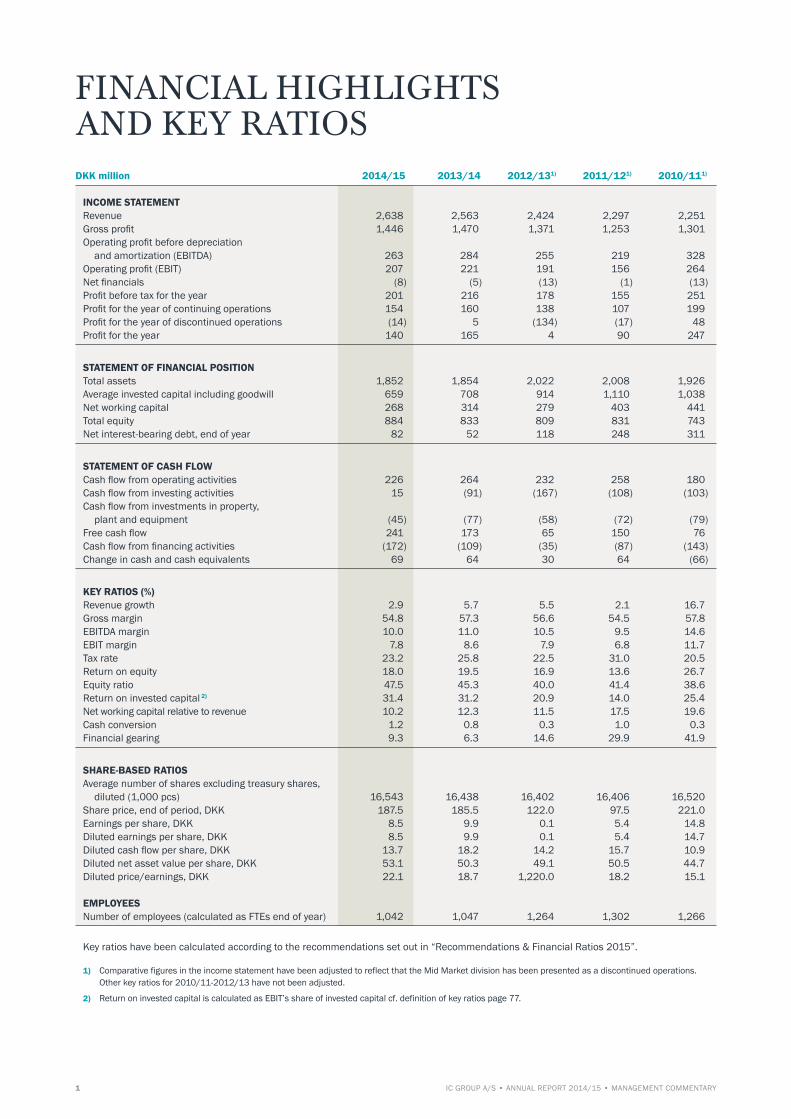
DKK million 2014/15 2013/14 2012/131) 2011/121) 2010/111)
INCOME STATEMENT Revenue 2,638 2,563 2,424 2,297 2,251 Gross profit 1,446 1,470 1,371 1,253 1,301 Operating profit before depreciation and amortization (EBITDA) 263 284 255 219 328 Operating profit (EBIT) 207 221 191 156 264 Net financials (8) (5) (13) (1) (13)Profit before tax for the year 201 216 178 155 251 Profit for the year of continuing operations 154 160 138 107 199 Profit for the year of discontinued operations (14) 5 (134) (17) 48 Profit for the year 140 165 4 90 247
STATEMENT OF FINANCIAL POSITION Total assets 1,852 1,854 2,022 2,008 1,926 Average invested capital including goodwill 659 708 914 1,110 1,038 Net working capital 268 314 279 403 441 Total equity 884 833 809 831 743 Net interest-bearing debt, end of year 82 52 118 248 311
STATEMENT OF CASH FLOW Cash flow from operating activities 226 264 232 258 180 Cash flow from investing activities 15 (91) (167) (108) (103)Cash flow from investments in property, plant and equipment (45) (77) (58) (72) (79)Free cash flow 241 173 65 150 76 Cash flow from financing activities (172) (109) (35) (87) (143)Change in cash and cash equivalents 69 64 30 64 (66)
KEY RATIOS (%) Revenue growth 2.9 5.7 5.5 2.1 16.7 Gross margin 54.8 57.3 56.6 54.5 57.8EBITDA margin 10.0 11.0 10.5 9.5 14.6 EBIT margin 7.8 8.6 7.9 6.8 11.7 Tax rate 23.2 25.8 22.5 31.0 20.5Return on equity 18.0 19.5 16.9 13.6 26.7 Equity ratio 47.5 45.3 40.0 41.4 38.6 Return on invested capital 2) 31.4 31.2 20.9 14.0 25.4 Net working capital relative to revenue 10.2 12.3 11.5 17.5 19.6 Cash conversion 1.2 0.8 0.3 1.0 0.3 Financial gearing 9.3 6.3 14.6 29.9 41.9
SHARE-BASED RATIOS Average number of shares excluding treasury shares, diluted (1,000 pcs) 16,543 16,438 16,402 16,406 16,520 Share price, end of period, DKK 187.5 185.5 122.0 97.5 221.0 Earnings per share, DKK 8.5 9.9 0.1 5.4 14.8 Diluted earnings per share, DKK 8.5 9.9 0.1 5.4 14.7 Diluted cash flow per share, DKK 13.7 18.2 14.2 15.7 10.9 Diluted net asset value per share, DKK 53.1 50.3 49.1 50.5 44.7 Diluted price/earnings, DKK 22.1 18.7 1,220.0 18.2 15.1 EMPLOYEES Number of employees (calculated as FTEs end of year) 1,042 1,047 1,264 1,302 1,266
Key ratios have been calculated according to the recommendations set out in “Recommendations & Financial Ratios 2015”.
1) Comparative figures in the income statement have been adjusted to reflect that the Mid Market division has been presented as a discontinued operations. Other key ratios for 2010/11-2012/13 have not been adjusted.
2) Return on invested capital is calculated as EBIT’s share of invested capital cf. definition of key ratios page 77.
FINANCIAL HIGHLIGHTS AND KEY RATIOS
IC GROUP A/S • ANNUAL REPORT 2014/15 • MANAGEMENT COMMENTARY1

THE GROUP AT A GLANCE
IC GROUP A/S • ANNUAL REPORT 2014/15 • MANAGEMENT COMMENTARY2
PREMIUM BRANDS
BUSINESS MODELWe create value through a well-defined business model that constitutes the plat-form for the operation and development of our Premium brands. Our business model facilitates project management, strategic sparring and knowledge sharing across our brands. It also covers a shared infra-structure that includes, among others, the Logistics and Sourcing functions and the Group’s e-commerce platform. In addition, our business model includes a number of support functions that provide cost- effective services to the Group’s brands.
Peak Performance was formed in Sweden in 1986 by passionate skiers. Today, Peak Performance is the largest brand in Scandinavia developing technical, functional and contemporary skiwear and sportswear for active leisure.
Wholesale customers: 1,918Retail stores: 32Franchise stores: 45
THE GROUPIC Group operates in the apparel and fashion industry, focusing exclusively on the Premium segment. The Group operates and develops brands with a core business of three Premium brands: Peak Performance, Tiger of Sweden and By Malene Birger.
VISION To be among the best developers of Premium brands within the industry of apparel and fashion.
MISSIONTo build successful brands by uniting business excellence with creativity and innovation.
OUTLOOKFor the financial year 2015/16, we expect our core business to continue the positive development seen in 2014/15 to drive the overall performance of the Group.
Specifically, we expect the Group to generate:Revenue growth 4%EBIT margin 10%Investments 3-4%(of annual revenue)
With its strong roots in classic menswear confection tradition and proud tailoring skills, Tiger of Sweden has, since its formation in 1903, developed into a brand distinguishing itself by offering contemporary apparel to men and women characterized by ”a different cut”.
Wholesale customers: 1,126Retail stores: 19Franchise stores: 13Concessions: 11
Since its formation in 2003, By Malene Birger has been a high-profile Danish design brand with an international appeal. The brand offers affordable luxury to fashion-conscious women representing a wide age group.
Wholesale customers: 953Retail stores: 9Franchise stores: 16Concessions: 8
AMBITIONSIt is our ambition to generate continued revenue growth while continously im-proving the profitability of the Group as a whole. To achieve this ambition, the Group’s Premium brands seek to increase their market shares in the markets in which they currently operate and at the same time gradually expand in new markets. Increased growth and earnings may in the longer term also be achieved by making adjustments to the portfolio of brands.
NON-CORE BUSINESS
The Group’s Non-core business consists of two brands: Saint Tropez and Designers Remix. IC Group has more than 1,000 employees, and its products are sold through more than 5,000 selling points, primarily in the Nordic region and in Rest of Europe.
RE
SU
LTA
CC
OU
NTS
GO
VE
RN
AN
CE
STR
ATE
GY
OV
ER
VIE
W
MANAGEMENT COMMENTARY • ANNUAL REPORT 2014/15 • IC GROUP A/S 3
FINANCIAL FACTS OF THE GROUP
Peak Performance36%
Peak Performance40%
By Malene Birger
13%
By Malene Birger
11%
Tiger of Sweden36%
Tiger of Sweden41%
Non- core15%
Non-core
8%
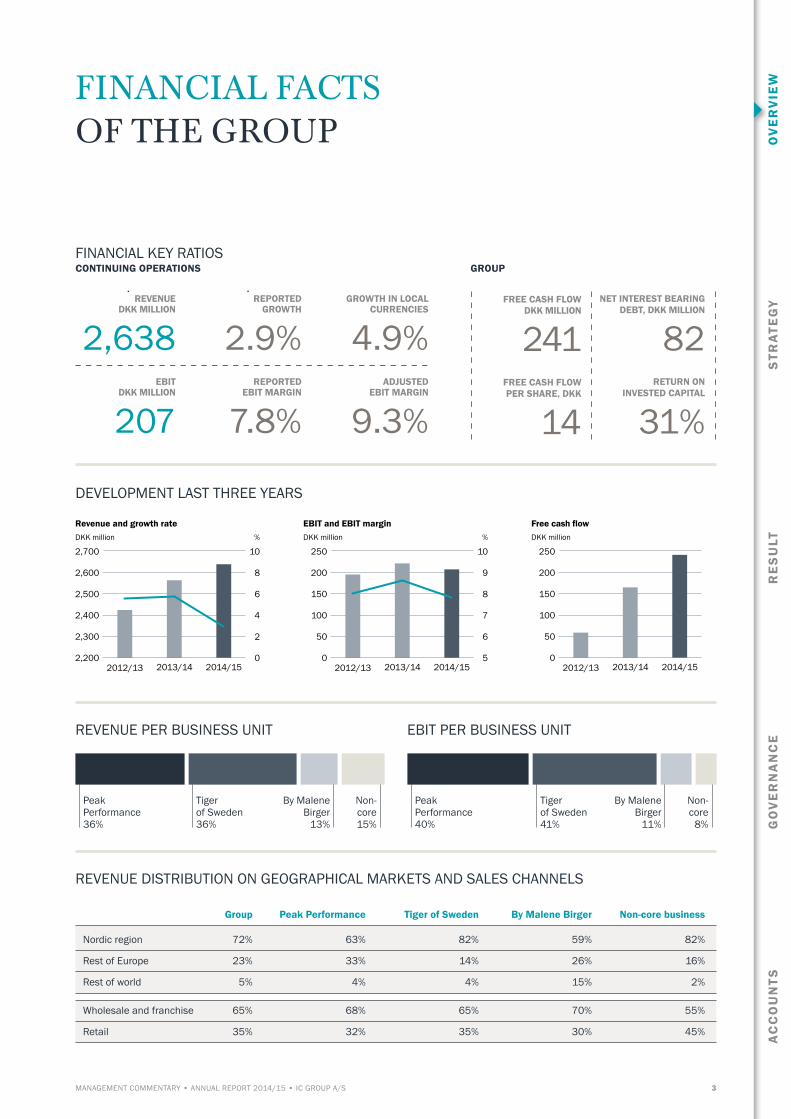
GROUP CONTINUING OPERATIONS
DEVELOPMENT LAST THREE YEARS
REVENUEDKK MILLION
2,638EBIT
DKK MILLION
207
REPORTED GROWTH
2.9%REPORTED
EBIT MARGIN
7.8%
GROWTH IN LOCAL CURRENCIES
4.9%ADJUSTED
EBIT MARGIN
9.3%
NET INTEREST BEARING DEBT, DKK MILLION
82RETURN ON
INVESTED CAPITAL
31%
FREE CASH FLOWDKK MILLION
241FREE CASH FLOW PER SHARE, DKK
14
Group Peak Performance Tiger of Sweden By Malene Birger Non-core business
Nordic region 72% 63% 82% 59% 82%
Rest of Europe 23% 33% 14% 26% 16%
Rest of world 5% 4% 4% 15% 2%
REVENUE PER BUSINESS UNIT EBIT PER BUSINESS UNIT
REVENUE DISTRIBUTION ON GEOGRAPHICAL MARKETS AND SALES CHANNELS
2014/152013/142012/13
2,700
2,600
2,500
2,400
2,300
2,200
10
8
6
4
2
0
%
Revenue and growth rateDKK million
250
200
150
100
50
0
10
9
8
7
6
5
%
2014/152013/142012/13
EBIT and EBIT marginDKK million
250
200
150
100
50
02014/152013/142012/13
Free cash flowDKK million
FINANCIAL KEY RATIOS
Wholesale and franchise 65% 68% 65% 70% 55%
Retail 35% 32% 35% 30% 45%

IC GROUP A/S • ANNUAL REPORT 2014/15 • MANAGEMENT COMMENTARY4
ADJUSTMENTS REQUIRED NOW IMPLEMENTED
Development towards a new IC GroupWith the divestment of the Mid Market division, which was completed as the financial year 2014/15 began, a significant milestone was reached in the Group’s history. We had now created the precondi-tions for a clear focus on the Premium segment, a market segment where we have a history of generating growth and increased earnings.
As a consequence of the divestment, the Group changed its name. It was formally resolved at the Group’s annual general meeting on 25 September 2014 that the future name of the Group should be IC Group. The name change was not only a mere formality, it was also a visible sign of the new and simplified business structure that we have been working on creating during the past two years.Following the divestment and the name change, adjustments of the Group business structure remained to be made. The first six months of the financial year 2014/15 were therefore marked by the work to create a Group with no ties to the former IC Companys.
As part of the agreement with the buyer, we provided support services against payment for a specifically agreed period of time following the sale. As we gradually delivered the agreed support services, we made plans for the restructuring of the Group, which led to a reduction of the costs previously covered by the Mid Market division.
In October 2014, we announced the required organizational adjustments. At the beginning of the financial year, we announced that the financial performance for the year would be impacted by idle capacity costs. However, by implementing the organizational adjustments, we took a massive step towards reducing these costs to prevent the financial year 2015/16 from being negatively impacted by idle capacity costs.
A simple business model with a strong infrastructureThe Group now presenting its annual report for 2014/15 therefore differs from the Group that opened the financial year. We now see a Group with a more simplified business structure and one strategic focus area, the Premium segment.
We have three strong Premium brands – all unique brands faced with different opportunities and challenges. However, they also share many similarities. We make efforts every day to seek to increasingly exploit these similarities. They all operate using the same infrastructure, which has been adjusted to accommodate their size, needs and potential for navigating in a market where conditions are constantly changing.
Today, consumers not only make demands on the properties and qualities of products, they increasingly expect products to always be available, offering the same look and presented in the same manner across all distribution channels. In other words, con-sumers expect the brand experience to always be the same no matter where they go. Meeting such requirements makes heavy demands on the underlying infrastructure.
We took significant steps in this area towards building the distri-bution structure of the future when in March 2015 we launched our new e-commerce platform – on time and within budget. The three Premium brands now employ the same technological IT platform but the consumer-facing expression has of course been adjusted to reflect the characteristics of the individual brand. From a technological perspective, the new e-commerce platform is up-to-date and fully integrated into the Group’s logistics function. The new platform is not only a very important and rapidly growing sales channel, it also allows us to better follow and measure consumer behaviour, offering the tools we need to get closer to the consumer and to facilitate full coherence between the different distribution channels.
Internally in the Group, the launch of the platform was a great suc-cess, resulting in maximum collaboration and maximum synergy across brands and central functions. The success has affirmed our ability to collaborate on projects across the Group and has there-fore formed a precedent on how to run projects and create value.
Progress and good performance of the Premium businessFor the financial year 2014/15, the performance of all three Premium brands was in line with expectations. Peak Performance delivered good results and worked to reclaim its position as one of the leading brands in the market for functional and contempo-rary apparel. Several product categories have been improved and adjustments have been made to the distribution set-up. There is, however, still work left to be done, such as optimization of the distribution channels and product and collection improvements, which will continue to be key focus areas for Peak Performance.
Again this year, Tiger of Sweden delivered strong growth and strengthened its presence in key growth markets, such as Germany, France and Great Britain, as well as taking the first steps in the US market. Over a number of years, we have gener-ated strong growth in Germany, which gave us a strong belief in the potential of this market, and we have therefore decided to

RE
SU
LTA
CC
OU
NTS
GO
VE
RN
AN
CE
STR
ATE
GY
OV
ER
VIE
W
MANAGEMENT COMMENTARY • ANNUAL REPORT 2014/15 • IC GROUP A/S 5
accelerate our expansion plans in this market. All the necessary preparations are now in place, and in the next few years, we expect to open a number of own-and-operated Tiger of Sweden stores in selected cities across Germany. We believe this will give extra tailwind to the brand’s strong momentum.
During the financial year, By Malene Birger implemented a number of adjustments with a view to strengthening its competi-tive capabilities in international markets. The brand also set up its own sales organization in Great Britain, an important growth market which is essential to the brand’s plans for continued inter-national expansion. Revenue increased again this year. However, the brand’s economies of scale are still inadequate, and in rela-tive terms, earnings did not increase to the same extent.
In general, performance of the Group’s core business was in line with expectations. Revenue increased by 6.9% in local currency and the EBIT margin was 11.1%, both of which were satisfactory results. For the Group’s non-core business, the overall performance did not meet expectations. Revenue for Saint Tropez in particular declined significantly, which had a negative impact on earnings.
Revenue for the Group’s continuing operations totaled DKK 2,638m. Operating profit of DKK 207m was impacted by idle capacity costs as a result of the divestment of the Mid Market division and ex-traordinary provisions made as announced in the second quarter. Revenue as well as operating profit was in line with expectations. Profit after tax for the continuing operations was DKK 154m.
Even though the Group’s performance for the year was impacted by higher costs, IC Group generated significant positive cash flow from operations, enabling the Group to – like the financial year 2013/14 – distribute extraordinary dividends in the amount of DKK 100m as announced in December 2014. The Group’s capital structure is simple and constitutes a sound platform for its long-term strategy. We continuously explore the potential for making value-adding investments. However, to the extent such investments do not absorb excess liquidity, we will continue to distribute cash to our shareholders. We believe that this is the best way to cater for their interests.
Opportunities and challenges aheadWhen taking stock of the past financial year and looking ahead, we see good opportunities as well as challenges. Each of our three Premium brands represents a great potential. They are all at different stages in their development process and will execute
their respective strategies at their own individual pace and pursue the opportunities that may arise. However, significant and lasting improvements to the general market conditions still remain to be seen. Especially in Europe, such improvements will help reinforce the growth plans launched and, in addition, may lead to further opportunities for revenue growth and increased earnings.
The Group as a whole and the individual brands are also facing challenges. But unlike in previous financial years, we have now defined a clear and unambiguous focus. In addition, we have in place a simple business structure and have introduced more rigorous methods of measurement and follow-up on all opera-tional disciplines of the Group, enabling us to better navigate under the current and future market conditions.
A specific challenge we currently face is the US dollar rate, which rose significantly in the financial year 2014/15. All things being equal, this will put earnings under pressure and will dampen the effect of the large optimization projects we launched in respect of sourcing and supply management. We will, however, not allow structural challenges to dilute out initiatives, and in the third quarter we therefore resolved to respond to the increasing costs resulting from the higher US dollar rate by increasing the prices on our products. We are not the only ones in the market to introduce such a strategy, and we also believe our Premium brands have the strength required to carry out these necessary price changes.
Preconditions for success in placeShortly before the end of the financial year, we were able to announce the sale of the Group’s head office at Raffinaderivej 10, Copenhagen. Despite the expected limited effect of the sale on the Group’s reported net profit and cash flow, the sale repre-sented a milestone on our journey towards a new IC Group. We now have in place a simple balance sheet and capital structure. Consequently, any expected positive cash flows from operations will be used exclusively to finance future growth of our business and for the distribution of capital, both actions that will benefit our shareholders. The Group has an infrastructure that supports the growth plans of our three Premium brands and a number of service functions that provide cost-effective support. We have implemented the required adjustments and now have a sound and solid platform, enabling us to execute our strategy. We need to improve our performance in respect of both growth and earnings and we are determined to do so.
IC GROUP A/S • ANNUAL REPORT 2014/15 • MANAGEMENT COMMENTARY6
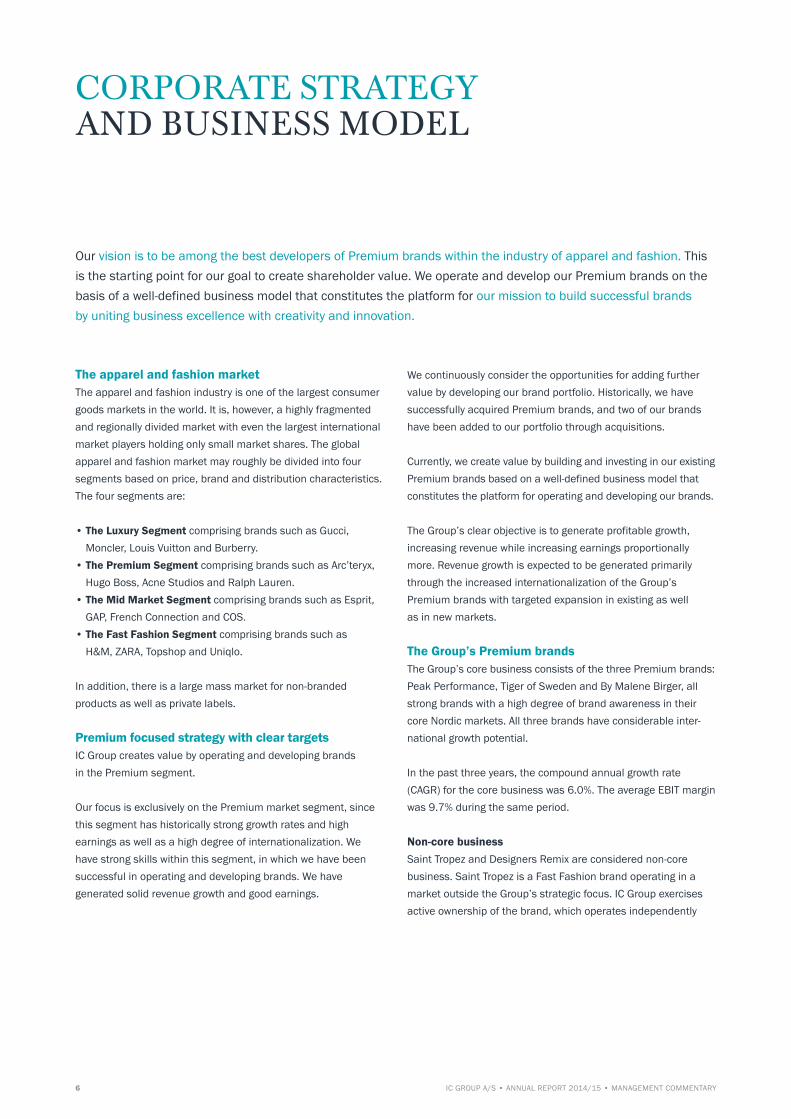
CORPORATE STRATEGY AND BUSINESS MODEL
The apparel and fashion marketThe apparel and fashion industry is one of the largest consumer goods markets in the world. It is, however, a highly fragmented and regionally divided market with even the largest international market players holding only small market shares. The global apparel and fashion market may roughly be divided into four segments based on price, brand and distribution characteristics.The four segments are:
• The Luxury Segment comprising brands such as Gucci, Moncler, Louis Vuitton and Burberry.
• The Premium Segment comprising brands such as Arc’teryx, Hugo Boss, Acne Studios and Ralph Lauren.
• The Mid Market Segment comprising brands such as Esprit, GAP, French Connection and COS.
• The Fast Fashion Segment comprising brands such as H&M, ZARA, Topshop and Uniqlo.
In addition, there is a large mass market for non-branded products as well as private labels.
Premium focused strategy with clear targetsIC Group creates value by operating and developing brands in the Premium segment.
Our focus is exclusively on the Premium market segment, since this segment has historically strong growth rates and high earnings as well as a high degree of internationalization. We have strong skills within this segment, in which we have been successful in operating and developing brands. We have generated solid revenue growth and good earnings.
We continuously consider the opportunities for adding further value by developing our brand portfolio. Historically, we have successfully acquired Premium brands, and two of our brands have been added to our portfolio through acquisitions.
Currently, we create value by building and investing in our existing Premium brands based on a well-defined business model that constitutes the platform for operating and developing our brands.
The Group’s clear objective is to generate profitable growth, increasing revenue while increasing earnings proportionally more. Revenue growth is expected to be generated primarily through the increased internationalization of the Group’s Premium brands with targeted expansion in existing as well as in new markets.
The Group’s Premium brandsThe Group’s core business consists of the three Premium brands: Peak Performance, Tiger of Sweden and By Malene Birger, all strong brands with a high degree of brand awareness in their core Nordic markets. All three brands have considerable inter-national growth potential.
In the past three years, the compound annual growth rate (CAGR) for the core business was 6.0%. The average EBIT margin was 9.7% during the same period.
Non-core businessSaint Tropez and Designers Remix are considered non-core business. Saint Tropez is a Fast Fashion brand operating in a market outside the Group’s strategic focus. IC Group exercises active ownership of the brand, which operates independently
Our vision is to be among the best developers of Premium brands within the industry of apparel and fashion. This is the starting point for our goal to create shareholder value. We operate and develop our Premium brands on the basis of a well-defined business model that constitutes the platform for our mission to build successful brands by uniting business excellence with creativity and innovation.

RE
SU
LTA
CC
OU
NTS
GO
VE
RN
AN
CE
STR
ATE
GY
OV
ER
VIE
W
7MANAGEMENT COMMENTARY • ANNUAL REPORT 2014/15 • IC GROUP A/S
and will be sold in the longer term. Designers Remix is a Premium brand currently only partly owned by the Group, for which reason it is not part of the Group’s core business. The future owner-ship of this brand will be resolved. None of the two brands are integrated into the Group’s operational platform.
The Group’s business modelThe purpose of the Group’s business model is to maximize the value of the portfolio of Premium brands. The clear focus of the business model is to improve and optimize functions and processes, together adding value to the Group. Across all function areas and brands, opportunities are available, be they big or small, to do things better, simpler and more cost-effectivly. The Group has at its disposal a vast amount of knowledge and expe-rience. By utilizing and sharing such knowledge and experience across all functions and brands, we ensure that all opportunities for improvement are identified and exploited to continuously improve and create value for our shareholders.
Knowledge sharing and optimization projects across all brandsThe Group’s business model acknowledges that all Premium brands are different and that each brand has its own unique characteristics that must be maintained and further developed. However, despite the brand differences, major advantages can be achieved from sharing knowledge, experience, structures and processes between the individual brands. Knowledge sharing benefits can be gained, for example, in respect of the collections development process, where best practice can be implemented across all brands. This also applies to go-to-market strategies and skills and to knowledge and experience of best suppliers as well as uniform terms and conditions of doing business with these suppliers.
Infrastructure constituting the platform for continued growth and brand buildingSimilarities in brand structure and work processes across a large number of areas are many, in particular in respect of the supply chain, where the Global Logistics and Global Sourcing functions
constitute key elements of the Group’s infrastructure. We aim to optimize and develop these areas to ensure that the Group has the very best basis for maintaining and further developing the competitive position of the individual brands in the market. We also aim to exploit the synergies realized by several brands using the same infrastructure.
• The Global Logistics function not only provides competitive logistics solutions to the Group’s Premium brands. It also delivers specialized high-quality solutions, which is crucial to the Group’s business relations with leading department stores in Europe, where timely delivery is vital for building and maintaining long-term relationships. In addition to its responsibility for all logistics to the Group’s wholesale and franchise customers, Global Logistics is also responsible for distribution to end-consumers of the Group’s e-commerce channel.
• Global Sourcing works closely with the design functions of each brand and is in charge of supplier management during the production process, thus helping maintain a high level of quality of the Group’s products while ensuring that costs settle at agreed levels. At the same time, the function ensures that Group guidelines and requirements for sustainable and responsible production are complied with. The Global Sourcing function also defines the strategic framework for selecting suppliers facilitated by a continued mapping of the global supplier landscape; a landscape which continues to change as pay levels increase and skills develop in the different geographical regions.
In addition, the infrastructure comprises IT and Financial Shared Services as well as the Group’s e-commerce platform, which is shared by all Premium brands. The platform is fully integrated into the logistics function and is technologically up-to-date. Not only is the e-commerce platform an important and fast-growing distribution channel, it is also an important strategic tool in developing the Group’s future “omni-channel” distribution.
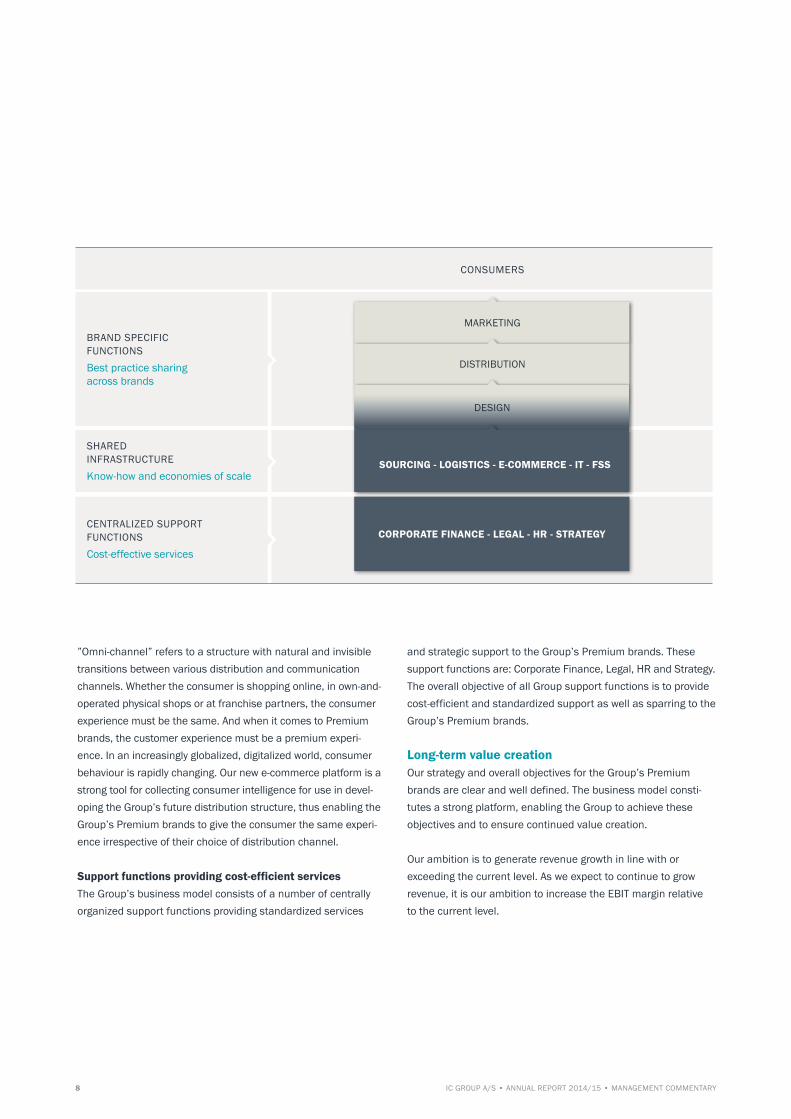
BRAND SPECIFIC FUNCTIONSBest practice sharing across brands
CENTRALIZED SUPPORT FUNCTIONSCost-effective services
FORBRUGERE
SHARED INFRASTRUCTUREKnow-how and economies of scale
IC GROUP A/S • ANNUAL REPORT 2014/15 • MANAGEMENT COMMENTARY8
”Omni-channel” refers to a structure with natural and invisible transitions between various distribution and communication channels. Whether the consumer is shopping online, in own-and-operated physical shops or at franchise partners, the consumer experience must be the same. And when it comes to Premium brands, the customer experience must be a premium experi-ence. In an increasingly globalized, digitalized world, consumer behaviour is rapidly changing. Our new e-commerce platform is a strong tool for collecting consumer intelligence for use in devel-oping the Group’s future distribution structure, thus enabling the Group’s Premium brands to give the consumer the same experi-ence irrespective of their choice of distribution channel. Support functions providing cost-efficient servicesThe Group’s business model consists of a number of centrally organized support functions providing standardized services
and strategic support to the Group’s Premium brands. These support functions are: Corporate Finance, Legal, HR and Strategy. The overall objective of all Group support functions is to provide cost-efficient and standardized support as well as sparring to the Group’s Premium brands.
Long-term value creationOur strategy and overall objectives for the Group’s Premium brands are clear and well defined. The business model consti-tutes a strong platform, enabling the Group to achieve these objectives and to ensure continued value creation.
Our ambition is to generate revenue growth in line with or exceeding the current level. As we expect to continue to grow revenue, it is our ambition to increase the EBIT margin relative to the current level.
MARKETING
CORPORATE FINANCE - LEGAL - HR - STRATEGY
DESIGN
DISTRIBUTION
SOURCING - LOGISTICS - E-COMMERCE - IT - FSS
CONSUMERS
RE
SU
LTA
CC
OU
NTS
GO
VE
RN
AN
CE
STR
ATE
GY
OV
ER
VIE
W
9MANAGEMENT COMMENTARY • ANNUAL REPORT 2014/15 • IC GROUP A/S
Investments, capital structure and dividend policyGrowth strategies and investments Based on growth strategies for the individual Premium brands, the Group expects to generate future revenue growth, partly through wholesale, distributor partnerships and franchise agreements and partly through expansion of own distribution channels. The Group’s investments in new stores will include carefully selected locations in our focus markets. Investments in developing the Group’s infrastructure are also required to ensure the most optimal support of the Group’s three Premium brands.
The Group’s future investment level must support the expansion plans of each of the Group’s Premium brands. Depending on how fast we execute these plans, the investment level may vary year on year. In the long-term, we expect the Group’s investment level to be in the region of 3-5% of Group annual revenue.
Working capital investmentsCurrently, net working capital is expected to remain at a level of 10-12% of annual revenue. Since we expect revenue to grow, this will naturally lead to working capital investments, and therefore, during periods of high growth, net working capital might exceed this level. Through efficiency improvements and strict control of the elements constituting net working capital, we work to con-tinuously minimize tied-up working capital. Relative to revenue, we therefore expect the general level of net working capital to fall in the longer term.
Capital structureThe Group aims to maintain a low level of financial gearing since, among other things, we are operating in a market sensitive to economic fluctuations. In addition, the Group’s leasehold com-mitments represent an element of operational gearing which is not insignificant. At 30 June 2015, Group operating leases were DKK 281m (including leased operating equipment, etc.).
To ensure the highest possible degree of flexibility going forward and to support the growth strategies of our core business in the best possible way, we specifically aim to keep net interest-
bearing debt at zero for the year as a whole. For this reason, the Group’s credit facilities will primarily be employed to fund seasonal fluctuations in the net working capital. Net interest-bearing debt (including discontinued operations) was DKK 82m at 30 June 2015.
With a view to maintaining a certain degree of strategic flexibility, the Group has resolved that, including Group operating leases, net interest-bearing debt may, as at 30 June constitute up to three times EBITDA should this be required. As at 30 June 2015, this key figure was 1.4 (1.3).
Dividend policyA minimum of 30% of the consolidated profit after tax will be distributed in the form of ordinary dividends in connection with the Group’s annual general meeting.
Since the Group’s cash flow is expected to increase in the years to come, we expect to accumulate considerable excess liquidity. We do not expect to change the Group’s capital structure in the future. Following the distribution of ordinary dividends, all excess liquidity may therefore be distributed to our sharehold-ers in the form of share buy-backs or extraordinary dividends. During the past two years, the Group distributed extraordinary dividends totalling the amount of DKK 200m.
10 IC GROUP A/S • ANNUAL REPORT 2014/15 • MANAGEMENT COMMENTARY
OUTLOOK
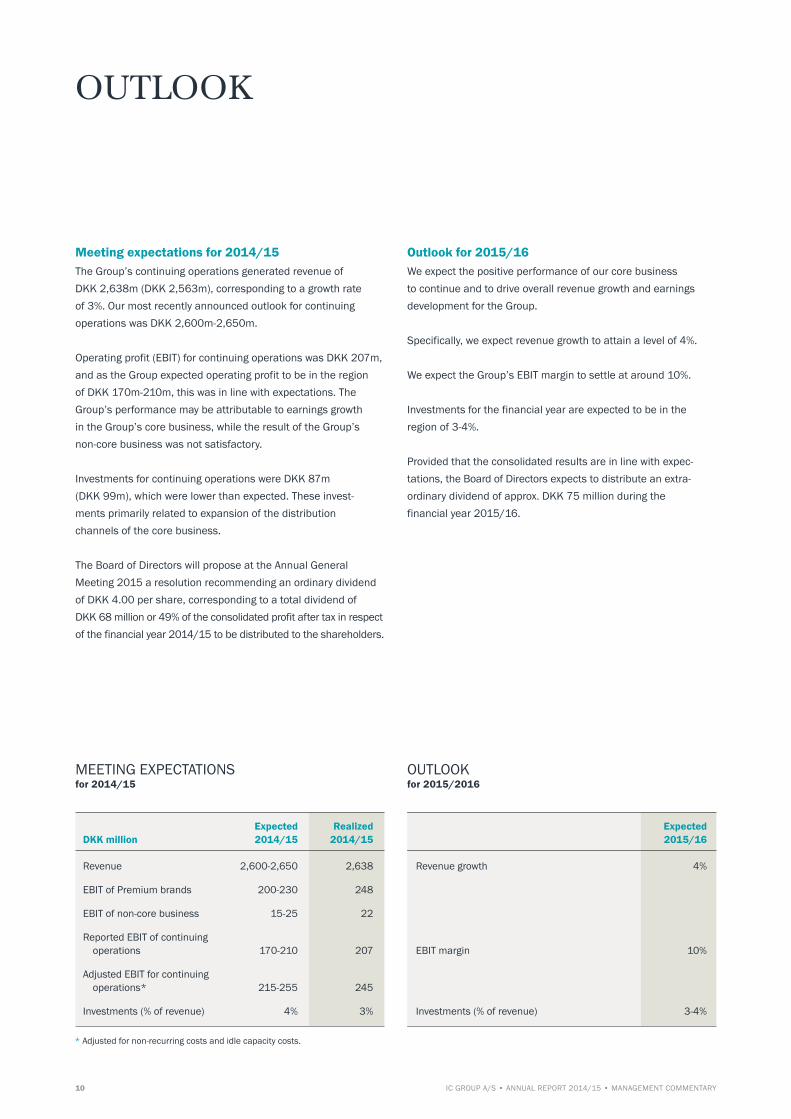
Meeting expectations for 2014/15The Group’s continuing operations generated revenue of DKK 2,638m (DKK 2,563m), corresponding to a growth rate of 3%. Our most recently announced outlook for continuing operations was DKK 2,600m-2,650m.
Operating profit (EBIT) for continuing operations was DKK 207m, and as the Group expected operating profit to be in the region of DKK 170m-210m, this was in line with expectations. The Group’s performance may be attributable to earnings growth in the Group’s core business, while the result of the Group’s non-core business was not satisfactory.
Investments for continuing operations were DKK 87m (DKK 99m), which were lower than expected. These invest- ments primarily related to expansion of the distribution channels of the core business.
The Board of Directors will propose at the Annual General Meeting 2015 a resolution recommending an ordinary dividend of DKK 4.00 per share, corresponding to a total dividend of DKK 68 million or 49% of the consolidated profit after tax in respect of the financial year 2014/15 to be distributed to the shareholders.
Outlook for 2015/16We expect the positive performance of our core business to continue and to drive overall revenue growth and earnings development for the Group.
Specifically, we expect revenue growth to attain a level of 4%.
We expect the Group’s EBIT margin to settle at around 10%.
Investments for the financial year are expected to be in the region of 3-4%.
Provided that the consolidated results are in line with expec-tations, the Board of Directors expects to distribute an extra-ordinary dividend of approx. DKK 75 million during the financial year 2015/16.
Expected Realized Expected DKK million 2014/15 2014/15 2015/16
Revenue 2,600-2,650 2,638 Revenue growth 4%
EBIT of Premium brands 200-230 248
EBIT of non-core business 15-25 22
Reported EBIT of continuing operations 170-210 207 EBIT margin 10%
Adjusted EBIT for continuing operations* 215-255 245
Investments (% of revenue) 4% 3% Investments (% of revenue) 3-4%
MEETING EXPECTATIONS for 2014/15
OUTLOOK for 2015/2016
* Adjusted for non-recurring costs and idle capacity costs.

OV
ER
VIE
WS
TRA
TEG
YR
ES
ULT
GO
VE
RN
AN
CE
AC
CO
UN
TS
A MATERIAL REQUIRING SKILL
In many ways, leather is a unique material – not only because of the way it looks, but also because of the way it is processed. To work in leather requires a special skill and a keen eye for detail. Tiger of Sweden’s leather products are produced primarily by two suppliers in India, with whom we have long-lasting partnerships. The insourcing of this product category has not only generated growth and earnings for Tiger of Sweden, but has also provided Tiger of Sweden with a number of highly specialized in-house skills, thus helping strengthen collaboration with our preferred suppliers of leather products. Both factors are vital in ensuring continued growth and development in this product category.

12 IC GROUP A/S • ANNUAL REPORT 2014/15 • MANAGEMENT COMMENTARY
PEAK PERFORMANCE The primary focus of Peak Performance this past financial year was its market positioning. In the year, adjustments were made to the brand’s product development and distribution channel with a view to strengthening the brand. This work will continue during the next financial year to contribute to our long-term target of increased growth and earnings through international expansion.
Peak PerformancePeak Performance is Scandinavia’s largest brand in the technical sports and fashion wear category. The brand was formed in 1986 by passionate skiers who called for functional skiwear that was also cool and fashionable. Since its formation, Peak Performance has been among the leading brands in the world when it comes to technical, functional and fashionable clothing.
The focus of Peak Performance is to revitalise the brand, primarily through product and collection improvements, to ensure products and collections increasingly reflect the brand’s unique character-istics, which are expressed through a combination of fashion and functionality.
In addition, Peak Performance will continue to adjust certain parts of the distribution network. Optimization of the brand’s own portfolio of stores has been completed, but the brand will also review wholesale customers and franchise partners. Peak Performance is a strong brand – this is verified by consumers as well as by market research.
Therefore, quality may never be compromised – neither in our products, nor in our distribution channels. Strong positioning in the Nordic and the regions in the Alps are crucial to our long-term focus, which is to generate growth, expand internationally and improve profitability.
The majority of revenue for 2014/15 was generated in the Nordic region, with Sweden constituting the absolute largest market. The four Nordic countries accounted for 63% of total revenue. The brand also has a strong foothold in Europe, with the markets in the Alps being particularly important. Revenue in Rest of Europe constituted 33% of revenue in 2014/15. Outside Europe, Canada is the largest market. Non-European markets accounted for a total of 4% of revenue.
Products are sold through 1,995 selling points distributed among 1,918 wholesale customers and 77 branded stores, of which 32 are own stores and 45 are franchise stores.
Products are sold through selected third-party e-commerce channels and through the Group’s e-commerce platform.
Learn more about Peak Performance at peakperformance.com
2014/152013/142012/13 2014/152013/142012/13
Revenue developmentDKK million
Geographic breakdown of revenueEBIT development and EBIT margin DKK million %
EBIT EBIT margin
Nordic region 63%
Rest of the world 4%
Rest of Europe 33%
1,250
1,100
950
800
650
500
15
12
9
6
3
0
125
100
75
50
25
0
PEAK PERFORMANCE Financial highligts and key ratios
RE
SU
LTA
CC
OU
NTS
GO
VE
RN
AN
CE
STR
ATE
GY
OV
ER
VIE
W
13MANAGEMENT COMMENTARY • ANNUAL REPORT 2014/15 • IC GROUP A/S
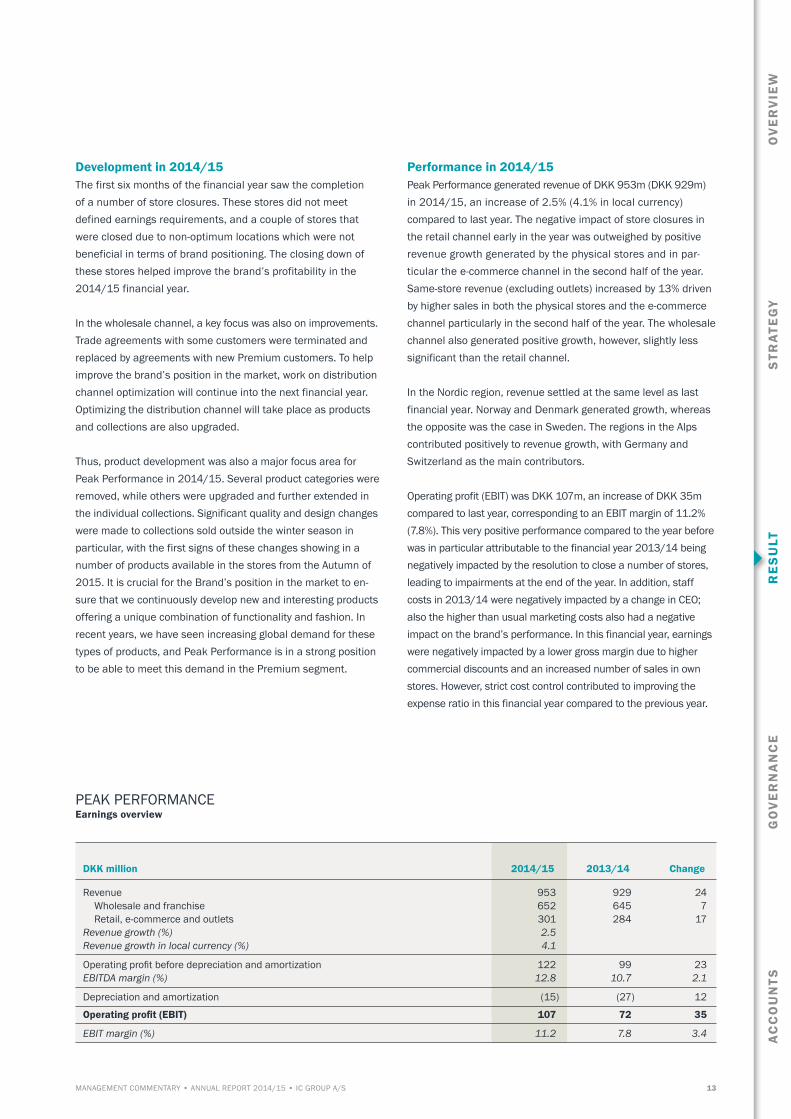
DKK million 2014/15 2013/14 Change
Revenue 953 929 24 Wholesale and franchise 652 645 7 Retail, e-commerce and outlets 301 284 17Revenue growth (%) 2.5 Revenue growth in local currency (%) 4.1
Operating profit before depreciation and amortization 122 99 23EBITDA margin (%) 12.8 10.7 2.1
Depreciation and amortization (15) (27) 12
Operating profit (EBIT) 107 72 35
EBIT margin (%) 11.2 7.8 3.4
Development in 2014/15The first six months of the financial year saw the completion of a number of store closures. These stores did not meet defined earnings requirements, and a couple of stores that were closed due to non-optimum locations which were not beneficial in terms of brand positioning. The closing down of these stores helped improve the brand’s profitability in the 2014/15 financial year.
In the wholesale channel, a key focus was also on improvements. Trade agreements with some customers were terminated and replaced by agreements with new Premium customers. To help improve the brand’s position in the market, work on distribution channel optimization will continue into the next financial year. Optimizing the distribution channel will take place as products and collections are also upgraded.
Thus, product development was also a major focus area for Peak Performance in 2014/15. Several product categories were removed, while others were upgraded and further extended in the individual collections. Significant quality and design changes were made to collections sold outside the winter season in particular, with the first signs of these changes showing in a number of products available in the stores from the Autumn of 2015. It is crucial for the Brand’s position in the market to en-sure that we continuously develop new and interesting products offering a unique combination of functionality and fashion. In recent years, we have seen increasing global demand for these types of products, and Peak Performance is in a strong position to be able to meet this demand in the Premium segment.
Performance in 2014/15Peak Performance generated revenue of DKK 953m (DKK 929m) in 2014/15, an increase of 2.5% (4.1% in local currency) compared to last year. The negative impact of store closures in the retail channel early in the year was outweighed by positive revenue growth generated by the physical stores and in par-ticular the e-commerce channel in the second half of the year. Same-store revenue (excluding outlets) increased by 13% driven by higher sales in both the physical stores and the e-commerce channel particularly in the second half of the year. The wholesale channel also generated positive growth, however, slightly less significant than the retail channel.
In the Nordic region, revenue settled at the same level as last financial year. Norway and Denmark generated growth, whereas the opposite was the case in Sweden. The regions in the Alps contributed positively to revenue growth, with Germany and Switzerland as the main contributors.
Operating profit (EBIT) was DKK 107m, an increase of DKK 35m compared to last year, corresponding to an EBIT margin of 11.2% (7.8%). This very positive performance compared to the year before was in particular attributable to the financial year 2013/14 being negatively impacted by the resolution to close a number of stores, leading to impairments at the end of the year. In addition, staff costs in 2013/14 were negatively impacted by a change in CEO; also the higher than usual marketing costs also had a negative impact on the brand’s performance. In this financial year, earnings were negatively impacted by a lower gross margin due to higher commercial discounts and an increased number of sales in own stores. However, strict cost control contributed to improving the expense ratio in this financial year compared to the previous year.
PEAK PERFORMANCE Earnings overview
14 IC GROUP A/S • ANNUAL REPORT 2014/15 • MANAGEMENT COMMENTARY
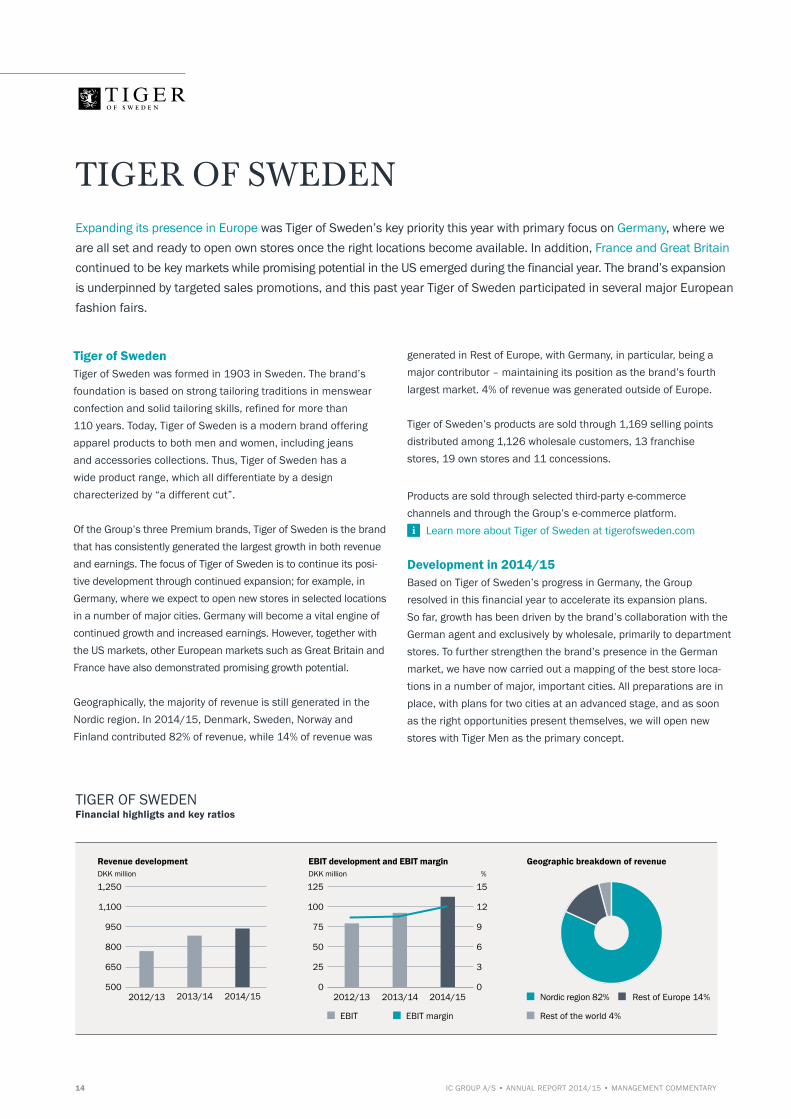
TIGER OF SWEDENExpanding its presence in Europe was Tiger of Sweden’s key priority this year with primary focus on Germany, where we are all set and ready to open own stores once the right locations become available. In addition, France and Great Britain continued to be key markets while promising potential in the US emerged during the financial year. The brand’s expansion is underpinned by targeted sales promotions, and this past year Tiger of Sweden participated in several major European fashion fairs.
Tiger of SwedenTiger of Sweden was formed in 1903 in Sweden. The brand’s foundation is based on strong tailoring traditions in menswear confection and solid tailoring skills, refined for more than 110 years. Today, Tiger of Sweden is a modern brand offering apparel products to both men and women, including jeans and accessories collections. Thus, Tiger of Sweden has a wide product range, which all differentiate by a design charecterized by “a different cut”.
Of the Group’s three Premium brands, Tiger of Sweden is the brand that has consistently generated the largest growth in both revenue and earnings. The focus of Tiger of Sweden is to continue its posi-tive development through continued expansion; for example, in Germany, where we expect to open new stores in selected locations in a number of major cities. Germany will become a vital engine of continued growth and increased earnings. However, together with the US markets, other European markets such as Great Britain and France have also demonstrated promising growth potential.
Geographically, the majority of revenue is still generated in the Nordic region. In 2014/15, Denmark, Sweden, Norway and Finland contributed 82% of revenue, while 14% of revenue was
generated in Rest of Europe, with Germany, in particular, being a major contributor – maintaining its position as the brand’s fourth largest market. 4% of revenue was generated outside of Europe.
Tiger of Sweden’s products are sold through 1,169 selling points distributed among 1,126 wholesale customers, 13 franchise stores, 19 own stores and 11 concessions.
Products are sold through selected third-party e-commerce channels and through the Group’s e-commerce platform.
Learn more about Tiger of Sweden at tigerofsweden.com
Development in 2014/15Based on Tiger of Sweden’s progress in Germany, the Group resolved in this financial year to accelerate its expansion plans. So far, growth has been driven by the brand’s collaboration with the German agent and exclusively by wholesale, primarily to department stores. To further strengthen the brand’s presence in the German market, we have now carried out a mapping of the best store loca-tions in a number of major, important cities. All preparations are in place, with plans for two cities at an advanced stage, and as soon as the right opportunities present themselves, we will open new stores with Tiger Men as the primary concept.
2014/152013/142012/13 2014/152013/142012/13
Revenue developmentDKK million
Geographic breakdown of revenueEBIT development and EBIT margin DKK million %
EBIT EBIT margin
Nordic region 82%
Rest of the world 4%
Rest of Europe 14%
1,250
1,100
950
800
650
500
15
12
9
6
3
0
125
100
75
50
25
0
TIGER OF SWEDEN Financial highligts and key ratios

RE
SU
LTA
CC
OU
NTS
GO
VE
RN
AN
CE
STR
ATE
GY
OV
ER
VIE
W
15MANAGEMENT COMMENTARY • ANNUAL REPORT 2014/15 • IC GROUP A/S
In France, Tiger of Sweden opened 18 “shop-in-shop” stores, of which 16 were based in Galleries Lafayette and two in Printemps, two of the leading department stores in France. Revenue from France is still relatively modest, but with the same high growth rates as in Germany and more selling points in the pipeline, France may develop into yet another strong growth market.
The brand generated decent revenue growth in Great Britain. However, one of the brand’s own stores did not meet expecta-tions and was therefore shut down towards the end of the financial year.
Again this year, Tiger of Sweden excelled in major marketing campaigns, and received positive and an increasing number of reviews from major European fashion media, and, futhermore, at the WGSN Global Fashion Awards, a panel of industry experts awarded Tiger of Sweden the title ”Menswear Designer of the Year”. Also, for the second year in a row, the brand was invited to showcase its designs at the renowned “London Collections: Men” fashion fair. In the financial year and for the first time ever, the brand attended the perhaps most trendsetting international fashion fair in the world; Pitti Uomo in Italy.
WGSN is one of the world’s leading foresight agencies in terms of design and fashion trends. Read more about the award at globalfashionawards.wgsn.com
Tiger Men is Tiger of Sweden’s largest and primary concept, but Tiger Jeans has also proven to be a successful brand concept. As the name indicates, the product collections are centered on jeans. The brand concept has a more raw and edgy look and displays more attitude than Tiger Men. It appeals to younger consumers, whom Tiger Jeans successfully attract and thereby introduce to Tiger of Sweden at an early stage. This may prove to be crucial in respect of brand loyalty in the long-term, especially when it comes to male consumers. In addition, during the past
couple of years, Tiger Jeans has proven to be a strong and successful brand concept in its own right. Therefore, we will test and develop the brands capabilities as a stand-alone brand and will be opening Tiger Jeans stores in, among other places, Copenhagen and Oslo during a trial period.
Performance for the yearTiger of Sweden generated revenue of DKK 943m (DKK 883m), corresponding to a growth rate of 6.9% (10.1% in local currency). Revenue from the wholesale channel increased by 9.7% driven by increasing sales of SSP products (”never-out-of-stock” products) as well as collection products. Revenue from the retail channel increased both in the physical stores and in the e-commerce channel, while revenue from the outlet channel in particular increased due to clearance of old collections and leather products, which were taken over in connection with the insourcing of the accessories collection in 2013/14. Same-store revenue (excluding outlets) increased by 8% driven by higher sales in both the physical stores and the e-commerce channel.
Geographically, strong growth in Germany and France contributed to generating overall revenue growth, while revenue growth in the Nordic region was moderate. Outside Europe, growth was driven by the US market which is relatively new to Tiger of Sweden.
Operating profit (EBIT) was DKK 112m (DKK 93m), corresponding to an EBIT margin of 11.9% against 10.5% in 2013/14. Gross margin settled at a lower level than the year before, primarily due to higher commercial discounts in connection with the clearance of old stock in the second and third quarters of the financial year. In addition, Tiger of Sweden made provisions in the fourth quarter in the amount of approx. DKK 5m to cover the risk of non-payment by a distributor. The increase in capacity costs was relatively lower than the increase in revenue, contributing posi-tively to improved earnings as a result of the lower expense ratio.
DKK million 2014/15 2013/14 Change
Revenue 943 883 60 Wholesale and franchise 617 562 55 Retail, e-commerce and outlets 326 321 5Revenue growth (%) 6.9 Revenue growth in local currency (%) 10.1
Operating profit before depreciation and amortization 124 104 20EBITDA margin (%) 13.1 11.8 1.3
Depreciation and amortization (12) (11) (1)
Operating profit (EBIT) 112 93 19
EBIT margin (%) 11.9 10.5 1.4
TIGER OF SWEDENEarnings overview

16 IC GROUP A/S • ANNUAL REPORT 2014/15 • MANAGEMENT COMMENTARY
BY MALENE BIRGERAgain this past year, By Malene Birger focused on international expansion. This not only reflected on the distribution in Great Britain, which has now been taken over from the previous agent, but also on product category upgrades, a changed collection structure, a new store concept and organizational strengthening. By Malene Birger implemented adjustments in a wide range of areas to help enhance its international growth and continue its rise.
By Malene BirgerBy Malene Birger is a high-profile Danish design brand with an international appeal offering “affordable luxury” to women. Since it was formed in 2003, the brand has seen continued progress and achieved significant recognition on the international fashion scene.
The focus of By Malene Birger is to continue its international expansion. Large fashion metropoles such as London and Paris in particular are very important to By Malene Birger’s expansion strategy, and going forward much focus will therefore be on these two cities. The markets in the Nordic region are, however, still essential to the brand and in these markets there is still untapped growth potential to be exploited. Like the other Premium brands, the target of By Malene Birger is to generate profitable revenue growth.
In the current phase of By Malene Birger’s internationalization pro-cess, an increase in capacity costs may be expected for periods at a time. In the longer term, the brand must, however, obtain greater economies of scale as revenue grows, and, as a result, profitability must improve.
Of the Group’s Premium brands, By Malene Birger has the largest geographical spread. In 2014/15, revenue from Denmark, Sweden, Norway and Finland was 59%, while revenue from other European markets was 26%. Markets outside Europe accounted for 15% of revenue, with Japan, the US and the Middle East being some of the major contributors.
By Malene Birger’s products are sold through 986 selling points distributed among 953 wholesale customers, 16 franchise stores, 9 own stores and 8 concessions.
Products are sold through selected third-party e-commerce channels and through the Group’s e-commerce platform.
Learn more about By Malene Birger at bymalenebirger.com
Development in 2014/15Like the year before, international expansion was a key priority for the brand in 2014/15. In several areas of the business, By Malene Birger made improvements by strengthening its organi-zation and launching several initiatives to help the brand success-fully establish its presence in the markets of international fashion
400
350
300
250
200
150
EBIT EBIT-margin
50
40
30
20
10
02014/152013/142012/13 2014/152013/142012/13
15
13
11
9
7
5
Revenue developmentDKK million
Geographic breakdown of revenueEBIT development and EBIT margin DKK million %
Nordic region 59%
Rest of the world 15%
Rest of Europe 26%
BY MALENE BIRGER Financial highligts and key ratios

RE
SU
LTA
CC
OU
NTS
GO
VE
RN
AN
CE
STR
ATE
GY
OV
ER
VIE
W
17MANAGEMENT COMMENTARY • ANNUAL REPORT 2014/15 • IC GROUP A/S
metropoles, including London, Paris and Tokyo. By Malene Birger has managed to gain a strong foothold in these cities in particular, which could serve as a platform for further expansion, regionally as well as to other international fashion metropoles.
By Malene Birger now operates in London with its own sales organization. The city represents in itself a large market with strong purchasing power and at the same time serves as a show-case for other markets. So far, By Malene Birger has not achieved the desired results in London, which is the reason why the part-nership with the previous London agent was terminated. However, since the beginning of the second half of 2014/15, the brand has been present in the market with its own sales organization and own London store, which has generated good performance.
As part of our efforts to establish the brand on the international fashion scene, we have implemented adjustments of By Malene Birger’s collection structure and timings throughout the year, so the timing of collections now matches that of the trend-setting fashion houses in the world – a change welcomed by the brand’s wholesale customers. We have also upgraded the brand’s collec-tion structure and products in several areas, particularly in the accessories category, with jewelry and bags constituting essential products, in our efforts to promote By Malene Birger as an inter-national fashion brand.
Finally, we initiated the renewal of By Malene Birger’s store con-cept, with the store in Antoniegade in central Copenhagen being the first one to undergo redecoration. Responses to the brand’s new concept from Nordic as well as from international customers and consumers have been very positive. The new store concept will be rolled out in all By Malene Birger stores.
Performance for the yearBy Malene Birger generated revenue of DKK 342m (DKK 326m), corresponding to a growth rate of 4.8% (6.0% in local currency). Revenue from the wholesale channel increased by 5.0%, while revenue from the retail channel grew by 4.3% driven by sound performance in the physical stores, i.e. existing stores as well as the newly acquired store in London. Same-store revenue (excluding outlets) increased by 3%, which was primarily at-tributable to the physical stores, which more than outweighed the reduced revenue from the e-commerce channel, which was impacted by a low conversion rate of website traffic into sales. Towards the end of the financial year, we saw some improvement in this area as a result of the launched initiatives.
Geographically, revenue increased in the Nordic region in par-ticular. Outside the Nordic region, the Netherlands was a decent growth contributor, whereas markets in France and Great Britain did not yield the desired results. In Great Britain performance suffered from the transition of ownership from an agency to own sales organization. Outside Europe, Japan in particular was a strong growth contributor.
Operating profit (EBIT) for 2014/15 was DKK 29m and was on par with the operating profit of DKK 28m in 2013/14. The EBIT margin was 8.5% against 8.6% the year before. Earnings for 2014/15 were impacted by a lower gross margin compared to the year before due to, among other things, a higher degree of sales in own stores and a lower gross margin on some collec-tions. Capacity costs increased compared to last year primarily due to new recruitments and the acquisition of the store in London.
DKK million 2014/15 2013/14 Change
Revenue 342 326 16 Wholesale and franchise 238 227 11 Retail, e-commerce and outlets 104 99 5Revenue growth (%) 4.8 Revenue growth in local currency (%) 6.0
Operating profit before depreciation and amortization 35 36 (1)EBITDA margin (%) 10.2 11.0 (0.8)
Depreciation and amortization (6) (8) 2
Operating profit (EBIT) 29 28 1
EBIT margin (%) 8.5 8.6 (0.1)
BY MALENE BIRGER Earnings overview

18 IC GROUP A/S • ANNUAL REPORT 2014/15 • MANAGEMENT COMMENTARY
NON-CORE BUSINESS Two of the Group’s brands are defined as Non-core business, since they are operations that either fall outside the Premium Segment or are not fully owned by IC Group.
Non-core businessSaint Tropez and Designers Remix constitute the Group’s Non-core business, with Saint Tropez accounting for approximately 75% of revenue.
Saint Tropez is a brand in the Fast Fashion segment and is not integrated into IC Group’s operational platform. The brand will continue to operate independently and will be divested when the right opportunity arises.
Designers Remix is a Premium brand which has developed well over the past few years. IC Group holds 51% and Niels and Charlotte Eskildsen, who is CEO and chief designer of the brand, respectively, holds the remaining 49% of the brand. We will seek to resolve the future ownership of this brand.
PerformanceRevenue from Non-core business declined by 5.8% to DKK 400m (DKK 425m) due to the negative impact on Saint Tropez in particular from the less successful collections over the course of the year. Revenue of Saint Tropez declined in both the wholesale and retail channels. This performance is not satisfac-tory and had a negative impact on earnings. Consequently, Saint Tropez Management launched a number of necessary initiatives, including changes to the management team. Towards the end of the year, the first indications of performance improvement began to show.
Revenue from Designers Remix settled slightly below the 2013/14 level, and the brand’s earnings also declined.
Operating profit (EBIT) from Non-core operations came to DKK 22m (DKK 34m) and the EBIT margin was 5.5% (8.0%). This lower-than-expected performance was primarily attributable to the poor performance of Saint Tropez, which failed to outweigh revenue decline through corresponding cost reductions.
DKK million 2014/15 2013/14 Change
Revenue 400 425 (25) Wholesale and franchise 219 230 (11) Retail, e-commerce and outlets 181 195 (14)Revenue growth (%) (5.8) Revenue growth in local currency (%) (5.0)
Operating profit before depreciation and amortization 31 43 (12)EBITDA margin (%) 7.8 10.1 (2.3)
Depreciation and amortization (9) (9) -
Operating profit (EBIT) 22 34 (12)
EBIT margin (%) 5.5 8.0 (2.5)
NON-CORE BUSINESS Earnings overview

OV
ER
VIE
WS
TRA
TEG
YR
ES
ULT
GO
VE
RN
AN
CE
AC
CO
UN
TS
DOWN JACKETS ARE BOTH POPULAR AND SUSTAINABLE
Peak Performance has always produced down jackets of a very high quality, using technologies that combine the most wear-resistant materials with down possess-ing high insulating power. All the downs are traceable, and have been certified by the International Down Standard. To Peak Performance, high quality and sus-tainable production are equally important. The brand’s down products are among the best-selling product categories and appeal to all types of consumers, be they dedicated skiers, business people or young people and children.

20 IC GROUP A/S • ANNUAL REPORT 2014/15 • MANAGEMENT COMMENTARY
FINANCIAL REVIEW
Revenue and gross margin Revenue for continuing operations for 2014/15 was DKK 2,638m (DKK 2,563m), corresponding to an increase of 2.9% (4.9% in local currency) driven by the Group’s Premium brands. Together, the three brands increased revenue by 6.9%. Revenue from the Group’s Non-core business declined by 5.0% in local currency due to reduced revenue from Saint Tropez. Gross profit for continuing operations, which was negatively impacted by exchange rate effects of DKK 24m, was DKK 1,446m (DKK 1,470m). Gross margin was 54.8% (57.3%) – 2.5 percentage points below the level of last year. This performance was driven by non-recurring costs of DKK 8m in the second quarter, higher discounts and the clearance of old collections.
Operating profit (EBIT)EBIT for continuing operations was DKK 207m (DKK 221m), corresponding to an EBIT margin of 7.8% (8.6%) – a decline of 0.8%, mainly due to idle capacity costs of DKK 26m following the sale of the Mid Market division, non-recurring costs of DKK 12m in the second quarter and a reduced gross margin. Adjusted for non-recurring costs of DKK 12m and idle capacity costs, the EBIT margin for the Group was 9.3%. Together, the Group’s Premium brands generated an EBIT margin of 11.1% (9.0%). Relatively, the increase in capacity costs was lower than the increase in revenue, causing the expense ratio to decline by 1.7 percentage points to 47%. The net exchange rate effect on EBIT for continuing opera-tions was negative by DKK 4m.
TaxTax on profit for the year for continuing operations was DKK 47m (DKK 56m), corresponding to an effective tax rate of 23.2% (25.8%). Profit for the year of continuing operationsProfit for the year of the Group’s continuing operations declined by DKK 6m to DKK 154m (DKK 160m). Provisions of DKK 25m were made in the second quarter to cover non-recurring costs relating to a potential future case concerning indirect taxes. After tax, total provisions were DKK 21m. Continuing operations were negatively
impacted by DKK 11m, while discontinued operations were af-fected by DKK 10m relating to the divested Mid Market division.For continuing operations, gross profit was impacted by a DKK 8m and capacity costs by DKK 4m. The remaining DKK 1m was related to financials. The tax effect thereof was positive, constituting DKK 2m.
Profit for the yearFor the Group, profit for the year came to DKK 140m (DKK 165m), which was negatively impacted by, among other things, discontinued operations, i.e. the divested Mid Market division, generating a loss of DKK 14m (profit of DKK 5). This performance was primarily a result of non-recurring costs of DKK 10m.
Working capital netAdjusted for non-cash items, working capital was DKK 268m for 2014/15, corresponding to a DKK 46m reduction compared to 2013/14. Despite increased sales activities, we reduced inventories and receivables from sales of all Premium brands as a result of the Group’s focus on reducing tied-up working capital. Working capital was 10.2% of the last 12 months trailing revenue (12.3%).
Cash flowsCash flows from operating and investing activities were DKK 241m (DKK 173m). Cash flows from operating activities declined, since the growth of continuing operations did not outweigh the reduced cash flows from the discontinued operations. Reduced cash flows from operating activities were, however, offset by increased cash flows from investing activities as a result of sale of securities. Cash flows from financing activities amounted to an outflow of DKK 172m (outflow of DKK 109m).
Equity and equity ratioAt 30 June 2015, equity increased by DKK 51m to DKK 884m (DKK 833m) driven by profit for the year and other comprehensive income, which was reduced by an ordinary dividend payment for the financial year 2013/14 and an extraordinary dividend payment in December 2014. Consequently, the equity ratio at 30 June 2015 was 47.5% (45.3%).
Revenue for continuing operations increased by 4.9% in local currency to DKK 2,638m driven by good performance of the Group’s core business. The Group’s Non-core business failed to meet expectations. Operating profit (EBIT), which was negatively impacted by idle capacity costs and provisions made in the second quarter, came to DKK 207m (DKK 221m), which is in line with expectations. Profit for the year of continuing operations was DKK 154m.
OV
ER
VIE
WS
TRA
TEG
YR
ES
ULT
GO
VE
RN
AN
CE
AC
CO
UN
TS
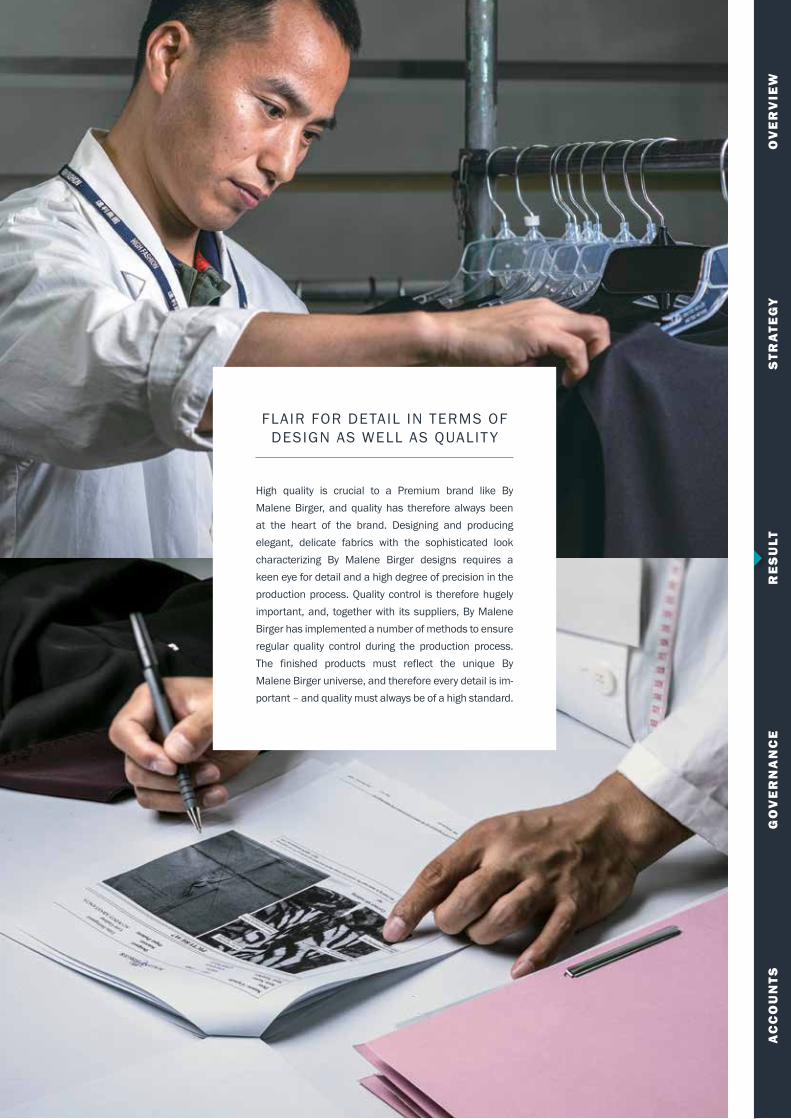
FLAIR FOR DETAIL IN TERMS OF DESIGN AS WELL AS QUALIT Y
High quality is crucial to a Premium brand like By Malene Birger, and quality has therefore always been at the heart of the brand. Designing and producing elegant, delicate fabrics with the sophisticated look characterizing By Malene Birger designs requires a keen eye for detail and a high degree of precision in the production process. Quality control is therefore hugely important, and, together with its suppliers, By Malene Birger has implemented a number of methods to ensure regular quality control during the production process. The finished products must reflect the unique By Malene Birger universe, and therefore every detail is im-portant – and quality must always be of a high standard.
22 IC GROUP A/S • ANNUAL REPORT 2014/15 • MANAGEMENT COMMENTARY
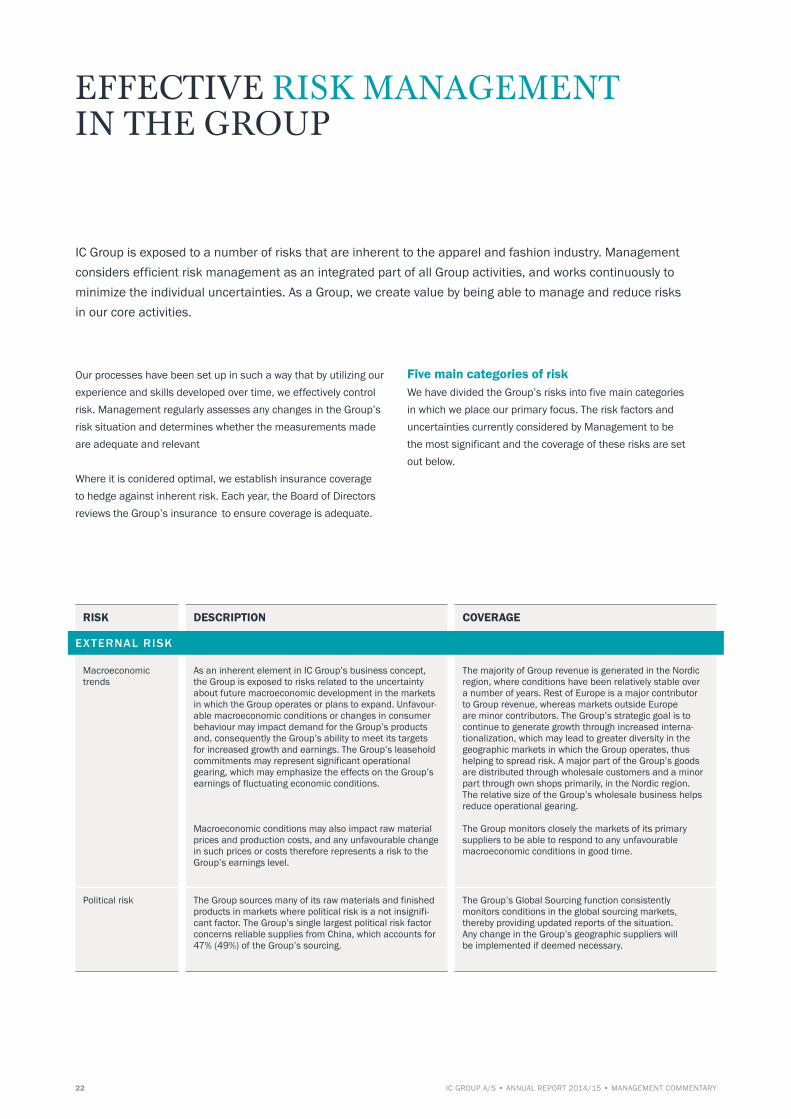
EFFECTIVE RISK MANAGEMENT IN THE GROUP
Our processes have been set up in such a way that by utilizing our experience and skills developed over time, we effectively control risk. Management regularly assesses any changes in the Group’s risk situation and determines whether the measurements made are adequate and relevant
Where it is conidered optimal, we establish insurance coverage to hedge against inherent risk. Each year, the Board of Directors reviews the Group’s insurance to ensure coverage is adequate.
Five main categories of risk We have divided the Group’s risks into five main categories in which we place our primary focus. The risk factors and uncertainties currently considered by Management to be the most significant and the coverage of these risks are set out below.
IC Group is exposed to a number of risks that are inherent to the apparel and fashion industry. Management considers efficient risk management as an integrated part of all Group activities, and works continuously to minimize the individual uncertainties. As a Group, we create value by being able to manage and reduce risks in our core activities.
RISK
Macroeconomic trends
Political risk
DESCRIPTION
As an inherent element in IC Group’s business concept, the Group is exposed to risks related to the uncertainty about future macroeconomic development in the markets in which the Group operates or plans to expand. Unfavour-able macroeconomic conditions or changes in consumer behaviour may impact demand for the Group’s products and, consequently the Group’s ability to meet its targets for increased growth and earnings. The Group’s leasehold commitments may represent significant operational gearing, which may emphasize the effects on the Group’s earnings of fluctuating economic conditions. Macroeconomic conditions may also impact raw material prices and production costs, and any unfavourable change in such prices or costs therefore represents a risk to the Group’s earnings level.
The Group sources many of its raw materials and finished products in markets where political risk is a not insignifi-cant factor. The Group’s single largest political risk factor concerns reliable supplies from China, which accounts for 47% (49%) of the Group’s sourcing.
COVERAGE
The majority of Group revenue is generated in the Nordic region, where conditions have been relatively stable over a number of years. Rest of Europe is a major contributor to Group revenue, whereas markets outside Europe are minor contributors. The Group’s strategic goal is to continue to generate growth through increased interna-tionalization, which may lead to greater diversity in the geographic markets in which the Group operates, thus helping to spread risk. A major part of the Group’s goods are distributed through wholesale customers and a minor part through own shops primarily, in the Nordic region. The relative size of the Group’s wholesale business helps reduce operational gearing. The Group monitors closely the markets of its primary suppliers to be able to respond to any unfavourable macroeconomic conditions in good time.
The Group’s Global Sourcing function consistently monitors conditions in the global sourcing markets, thereby providing updated reports of the situation. Any change in the Group’s geographic suppliers will be implemented if deemed necessary.
EXTERNAL RISK
RE
SU
LTA
CC
OU
NTS
GO
VE
RN
AN
CE
STR
ATE
GY
OV
ER
VIE
W
23MANAGEMENT COMMENTARY • ANNUAL REPORT 2014/15 • IC GROUP A/S
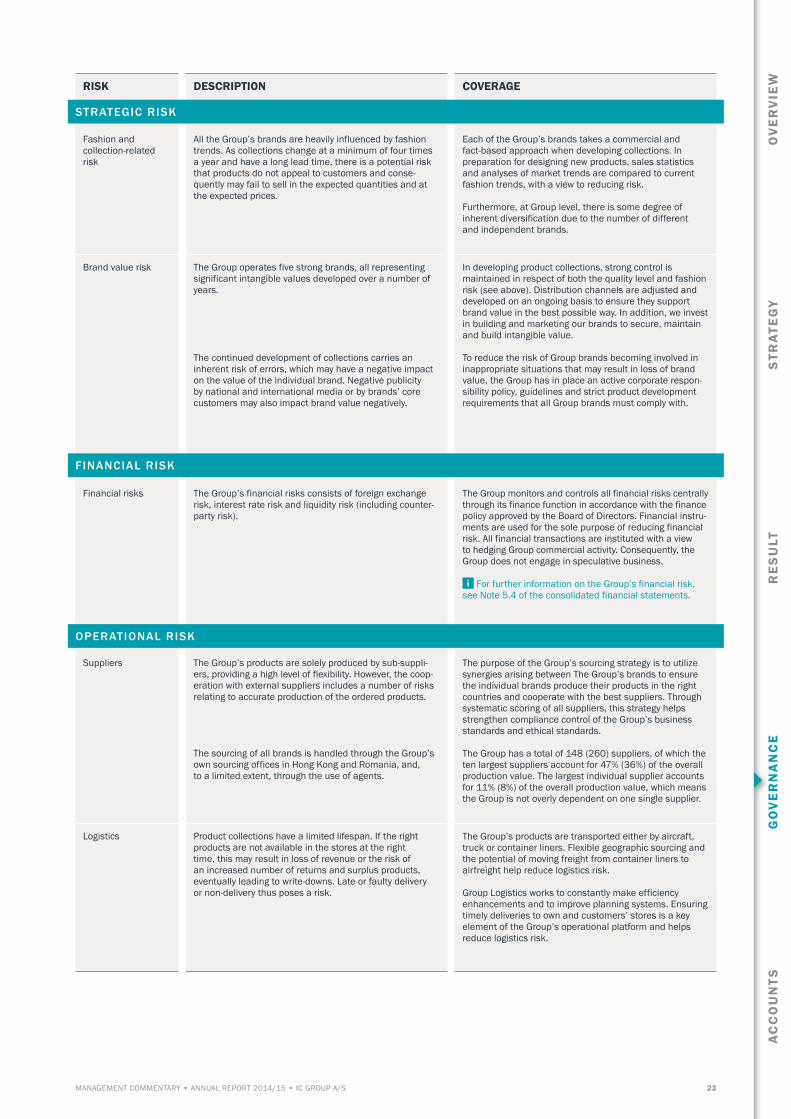
RISK
Fashion and collection-related risk
Brand value risk Financial risks Suppliers
Logistics
DESCRIPTION
All the Group’s brands are heavily influenced by fashion trends. As collections change at a minimum of four times a year and have a long lead time, there is a potential risk that products do not appeal to customers and conse-quently may fail to sell in the expected quantities and at the expected prices.
The Group operates five strong brands, all representing significant intangible values developed over a number of years. The continued development of collections carries an inherent risk of errors, which may have a negative impact on the value of the individual brand. Negative publicity by national and international media or by brands’ core customers may also impact brand value negatively. The Group’s financial risks consists of foreign exchange risk, interest rate risk and liquidity risk (including counter-party risk). The Group’s products are solely produced by sub-suppli-ers, providing a high level of flexibility. However, the coop-eration with external suppliers includes a number of risks relating to accurate production of the ordered products. The sourcing of all brands is handled through the Group’s own sourcing offices in Hong Kong and Romania, and, to a limited extent, through the use of agents.
Product collections have a limited lifespan. If the right products are not available in the stores at the right time, this may result in loss of revenue or the risk of an increased number of returns and surplus products, eventually leading to write-downs. Late or faulty delivery or non-delivery thus poses a risk.
COVERAGE
Each of the Group’s brands takes a commercial and fact-based approach when developing collections. In preparation for designing new products, sales statistics and analyses of market trends are compared to current fashion trends, with a view to reducing risk. Furthermore, at Group level, there is some degree of inherent diversification due to the number of different and independent brands.
In developing product collections, strong control is maintained in respect of both the quality level and fashion risk (see above). Distribution channels are adjusted and developed on an ongoing basis to ensure they support brand value in the best possible way. In addition, we invest in building and marketing our brands to secure, maintain and build intangible value. To reduce the risk of Group brands becoming involved in inappropriate situations that may result in loss of brand value, the Group has in place an active corporate respon-sibility policy, guidelines and strict product development requirements that all Group brands must comply with. The Group monitors and controls all financial risks centrally through its finance function in accordance with the finance policy approved by the Board of Directors. Financial instru-ments are used for the sole purpose of reducing financial risk. All financial transactions are instituted with a view to hedging Group commercial activity. Consequently, the Group does not engage in speculative business.
For further information on the Group’s financial risk, see Note 5.4 of the consolidated financial statements. The purpose of the Group’s sourcing strategy is to utilize synergies arising between The Group’s brands to ensure the individual brands produce their products in the right countries and cooperate with the best suppliers. Through systematic scoring of all suppliers, this strategy helps strengthen compliance control of the Group’s business standards and ethical standards. The Group has a total of 148 (260) suppliers, of which the ten largest suppliers account for 47% (36%) of the overall production value. The largest individual supplier accounts for 11% (8%) of the overall production value, which means the Group is not overly dependent on one single supplier.
The Group’s products are transported either by aircraft, truck or container liners. Flexible geographic sourcing and the potential of moving freight from container liners to airfreight help reduce logistics risk. Group Logistics works to constantly make efficiency enhancements and to improve planning systems. Ensuring timely deliveries to own and customers’ stores is a key element of the Group’s operational platform and helps reduce logistics risk.
STRATEGIC RISK
FINANCIAL RISK
OPERATIONAL RISK
24 IC GROUP A/S • ANNUAL REPORT 2014/15 • MANAGEMENT COMMENTARY
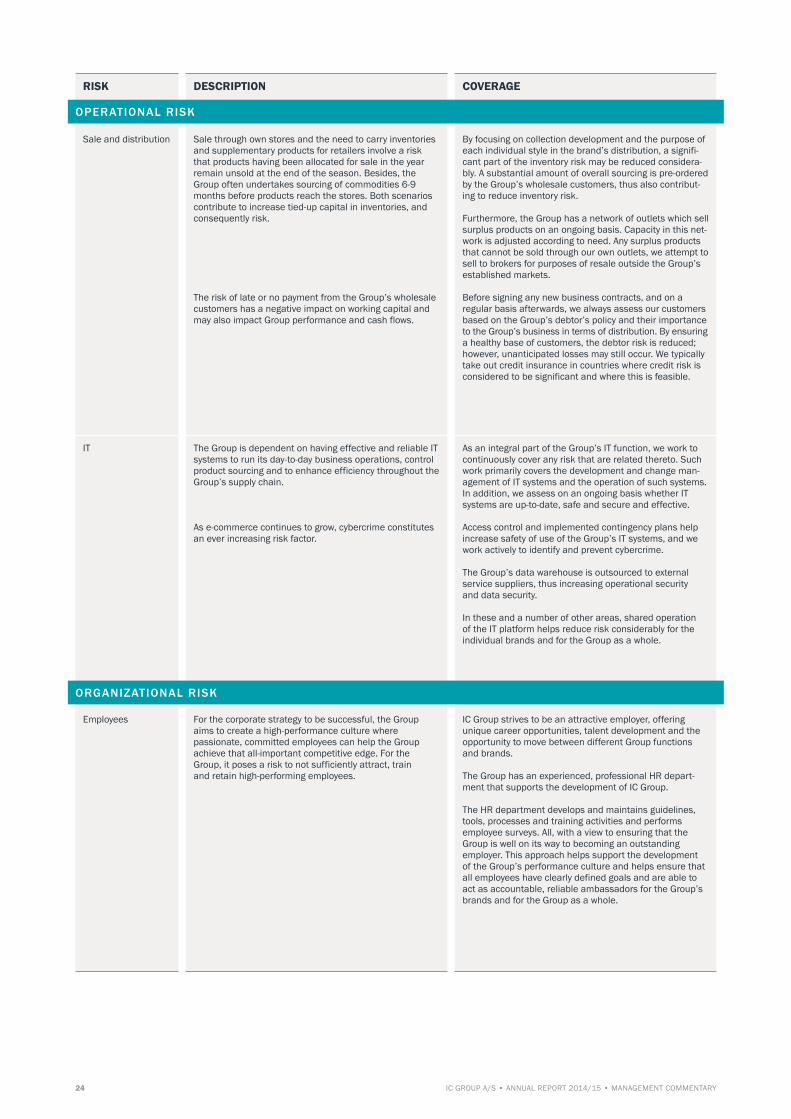
RISK
Sale and distribution
IT Employees
DESCRIPTION
Sale through own stores and the need to carry inventories and supplementary products for retailers involve a risk that products having been allocated for sale in the year remain unsold at the end of the season. Besides, the Group often undertakes sourcing of commodities 6-9 months before products reach the stores. Both scenarios contribute to increase tied-up capital in inventories, and consequently risk. The risk of late or no payment from the Group’s wholesale customers has a negative impact on working capital and may also impact Group performance and cash flows.
The Group is dependent on having effective and reliable IT systems to run its day-to-day business operations, control product sourcing and to enhance efficiency throughout the Group’s supply chain. As e-commerce continues to grow, cybercrime constitutes an ever increasing risk factor. For the corporate strategy to be successful, the Group aims to create a high-performance culture where passionate, committed employees can help the Group achieve that all-important competitive edge. For the Group, it poses a risk to not sufficiently attract, train and retain high-performing employees.
COVERAGE
By focusing on collection development and the purpose of each individual style in the brand’s distribution, a signifi-cant part of the inventory risk may be reduced considera-bly. A substantial amount of overall sourcing is pre-ordered by the Group’s wholesale customers, thus also contribut-ing to reduce inventory risk. Furthermore, the Group has a network of outlets which sell surplus products on an ongoing basis. Capacity in this net-work is adjusted according to need. Any surplus products that cannot be sold through our own outlets, we attempt to sell to brokers for purposes of resale outside the Group’s established markets. Before signing any new business contracts, and on a regular basis afterwards, we always assess our customers based on the Group’s debtor’s policy and their importance to the Group’s business in terms of distribution. By ensuring a healthy base of customers, the debtor risk is reduced; however, unanticipated losses may still occur. We typically take out credit insurance in countries where credit risk is considered to be significant and where this is feasible.
As an integral part of the Group’s IT function, we work to continuously cover any risk that are related thereto. Such work primarily covers the development and change man-agement of IT systems and the operation of such systems. In addition, we assess on an ongoing basis whether IT systems are up-to-date, safe and secure and effective. Access control and implemented contingency plans help increase safety of use of the Group’s IT systems, and we work actively to identify and prevent cybercrime. The Group’s data warehouse is outsourced to external service suppliers, thus increasing operational security and data security. In these and a number of other areas, shared operation of the IT platform helps reduce risk considerably for the individual brands and for the Group as a whole. IC Group strives to be an attractive employer, offering unique career opportunities, talent development and the opportunity to move between different Group functions and brands. The Group has an experienced, professional HR depart-ment that supports the development of IC Group. The HR department develops and maintains guidelines, tools, processes and training activities and performs employee surveys. All, with a view to ensuring that the Group is well on its way to becoming an outstanding employer. This approach helps support the development of the Group’s performance culture and helps ensure that all employees have clearly defined goals and are able to act as accountable, reliable ambassadors for the Group’s brands and for the Group as a whole.
OPERATIONAL RISK
ORGANIZATIONAL RISK
OV
ER
VIE
WS
TRA
TEG
YR
ES
ULT
AC
CO
UN
TSG
OV
ER
NA
NC
E
CRAFTSMANSHIP AND PROFESSIONAL PRIDE
Producing suits has always been Tiger of Sweden’s core expertise, developed since the formation of the brand in 1903. The combination of a highly specialized art of tailoring, exclusive Italian fabrics and modern production methods characterizes the production of Tiger of Sweden suits, which takes place in Romania. Focus is on quality in all aspects of the production process, and the brand has therefore entered into a partnership with a supplier whose staff is driven by professional pride and the ambition to perform to per-fection. It takes approx. three hours to cut, trim and sew a Tiger of Sweden suit, a process which is very effi-cient and well structured, and good craftsmanship and the quality of the end-product are never compromised.
26 IC GROUP A/S • ANNUAL REPORT 2014/15 • MANAGEMENT COMMENTARY
THE GROUP’S WORK WITH CORPORATE RESPONSIBILITY
Corporate Responsibility PolicyWe are a member of an industry facing many well-known corporate responsibility challenges, both in terms of a complex multi-level supply chain, ranging from suppliers of raw materials to finished goods suppliers as well as consumption of resources. We take these issues seriously and seek to always turn challenges into opportunities and to use our creative expertise and strong innovative skills to make a difference and to contribute to achieving sustainable development in the industry.
IC Group has joined the UN Global Compact. Our work on corporate responsibility therefore builds on the ten Principles of the initia-tive, which are based on internationally adopted declarations and conventions on human rights, labour rights, environmental protection and anti-corruption. Together, UN Global Compact and the UN Guiding Principles constitute the overall framework of the Group’s policies and implementation procedures in respect of corporate responsibility.
Joining the UN Global Compact means we have committed to taking proactive steps to comply with these principles internally as well as externally in collaboration with our suppliers, thus striving to make a positive difference and incorporate timely processes to avoid non-compliance with the Principles. We there-fore also provide a compliance hotline, enabling our employees to report any matters of non-compliance.
To read IC Group’s policy on corporate responsibility and our specific policies, go to: icgroup.net/responsibility
DiversityIC Group has signed the document “Recommendations for more women on supervisory boards”, and in the years to come, it is our policy to make determined efforts to increase the number of female executives of the Group in general. In accordance with section 99b of the Danish Financial Statements Act, the Group’s gender diversity targets and the current gender distribution are set out below.
At 30 June 2015, the number of women on the Board of Directors of IC Group A/S constituted 17%, and, like in previous years, we work to regularly recruit and train new female executives. It is our specific goal to increase the percentage of women on the Board of Directors to 33% by 2019 at the latest through a continued focus on the basis for appointing candidates to the Board of Directors. In the annual report 2013/14, it appears that the target for women on the Board of Directors was set at 29% within a period of four years. We have still not achieved this target, since the basis for recruitment did not allow for this target to be achieved in the past financial year.
The percentage of women represented on the Global Manage-ment Team remains at 29%, and we also expect to increase this percentage in the years to come.
At other Group management levels, gender distribution is equal.
As a member of the global apparel and fashion industry, IC Group is committed to operating as a socially responsible company focusing on integrity and sustainability. We strive to create value for all our stakeholders by solving and addressing the different challenges that all companies in the industry are facing.
HIGHLIGHTS IN 2014/15In the 2014/15 financial year, we focused on three areas of corporate responsibility:
• Strengthening our collaboration with major, key suppliers;• Implementing the Higg Index pilot project at specifically
chosen suppliers;• Mapping the Group’s chemicals risks.
Further information has been provided on these three areas in our Report on Corporate Responsibility constituting the statutory report on corporate responsibility pursuant to section 99a of the Danish Financial Statements Act.
To read the Group’s report on corporate responsibility, go to icgroup.net/responsibility/corporate-responsibility-report

RE
SU
LTA
CC
OU
NTS
GO
VE
RN
AN
CE
STR
ATE
GY
OV
ER
VIE
W
27MANAGEMENT COMMENTARY • ANNUAL REPORT 2014/15 • IC GROUP A/S
THE GROUP’S WORK ON CORPORATE GOVERNANCE
Protecting shareholder interestsThe Board of Directors considers it its primary responsibility to promote the long-term interests of the Group and all of its shareholders. To meet this responsibility, the Board of Directors holds six ordinary board meetings each year and ensures there is ongoing dialogue and interaction between the Chairmanship and the Executive Board.
In the Group’s Corporate Governance Report, the Board of Directors has considered the interests of the Group in relation to its stakeholders, the environment, the work performed by the Board of Directors and the Executive Board and the collaboration between these two bodies. The report outlines the framework for Management working procedures to ensure the effective, expedient and proper management of IC Group. This framework has been defined based on the Group’s Articles of Association, business concept, vision, mission, corporate values and the laws and regulations applying to Danish listed companies.
To read IC Group’s Articles of Association, go to: icgroup.net/about/corporate-governance/articles-of-association
Board of Directors and Board CommitteesThe composition of the Board of Directors is based on solid expe-rience of the fashion industry and general management skills. In addition, it is a requirement that all directors have extensive and solid business experience and proven strategy and management skills, enabling the Board of Directors to discharge their board duties in the best possible way.
Based on NASDAQ OMX Copenhagen’s recommendations, the Board of Directors has considered the need for setting up special permanent board committees, including audit, remuneration and nomination committees. Consequently, the Board of Directors has set up an audit committee, remuneration committee and an operation committee and will also regularly assess the need for specific ad hoc committees.
For more information on the Board of Directors and the individual Board committees, go to the Group’s website: icgroup.net/about/corporate-governance/board-directors
Remuneration policy and incentive payTo establish shared interests between shareholders, the Executive Board and other executives and to ensure that all such executives focus on meeting the targets of the Group, IC Group has introduced bonus schemes and share incentive programmes. The Group’s incentive programmes are not available to members of the Board of Directors.
For more information on the Group’s remuneration policy and incentive pay, go to IC Group’s website: icgroup.net/about/corporate-governance/remuneration-policy
Information on remuneration granted to the Executive Board and the Board of Directors in the financial year 2014/15 is set out in Note 6.1, while details on warrants and options granted to a number of executives and key employees are included in Note 6.2.
Ownership structure and takeover bidsA description of the Group’s ownership structure is provided in Shareholder Information and Share Performance on page 33. In the event of any takeover bids, no significant agreements will be affected.
Corporate Governance is considered an essential and crucial element in achieving the Group’s strategic objectives and targets. Consequently, Group Management development and follow-up is a process always ongoing to ensure the effective, expedient and proper management of the Group in compliance with current corporate governance recommendations.
CORPORATE GOVERNANCE RECOMMENDATIONSWith two exceptions, IC Group complies with all recommendations of NASDAQ OMX Copenhagen (which are based on recommendations issued by the Committee on Corporate Governance).
IC Group’s full Statutory Report on Corporate Governance for the financial year 2014/15 prepared according to Section 107b of the Danish Financial Statements Act is available here: icgroup.net/about/corporate-governance
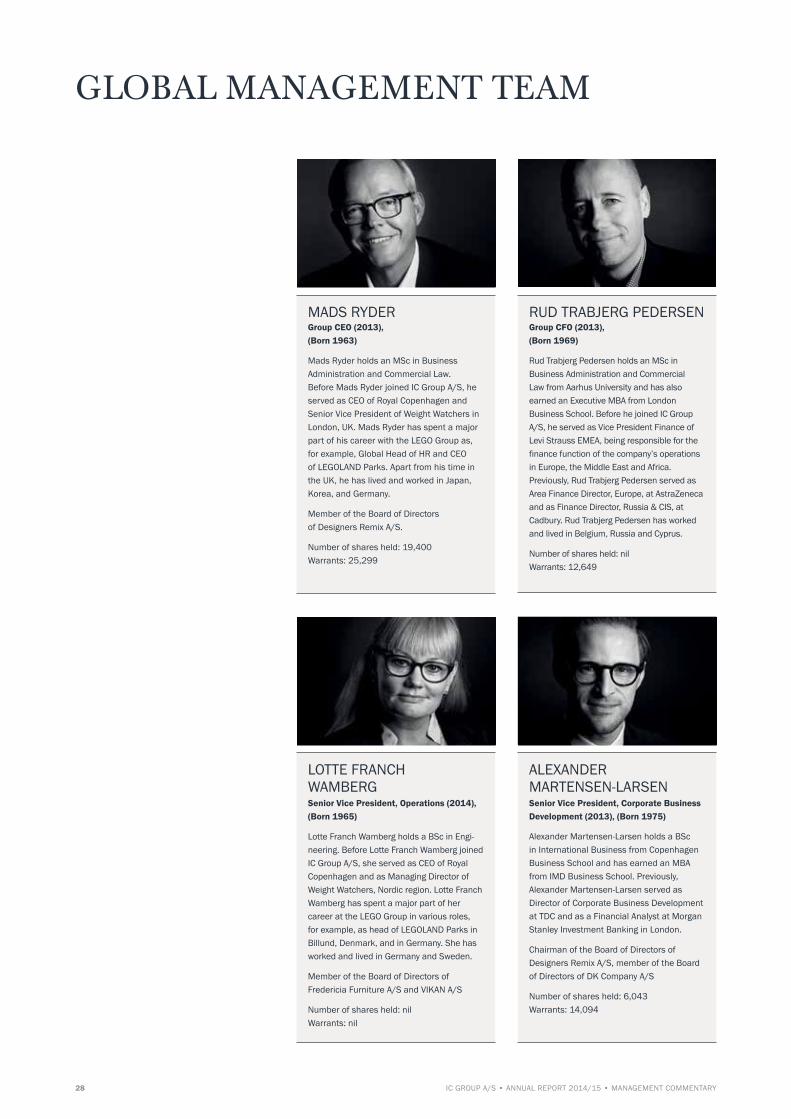
28 IC GROUP A/S • ANNUAL REPORT 2014/15 • MANAGEMENT COMMENTARY
MADS RYDERGroup CEO (2013), (Born 1963)
Mads Ryder holds an MSc in Business Administration and Commercial Law. Before Mads Ryder joined IC Group A/S, he served as CEO of Royal Copenhagen and Senior Vice President of Weight Watchers in London, UK. Mads Ryder has spent a major part of his career with the LEGO Group as, for example, Global Head of HR and CEO of LEGOLAND Parks. Apart from his time in the UK, he has lived and worked in Japan, Korea, and Germany.
Member of the Board of Directors of Designers Remix A/S.
Number of shares held: 19,400 Warrants: 25,299
RUD TRABJERG PEDERSENGroup CFO (2013), (Born 1969)
Rud Trabjerg Pedersen holds an MSc in Business Administration and Commercial Law from Aarhus University and has also earned an Executive MBA from London Business School. Before he joined IC Group A/S, he served as Vice President Finance of Levi Strauss EMEA, being responsible for the finance function of the company’s operations in Europe, the Middle East and Africa. Previously, Rud Trabjerg Pedersen served as Area Finance Director, Europe, at AstraZeneca and as Finance Director, Russia & CIS, at Cadbury. Rud Trabjerg Pedersen has worked and lived in Belgium, Russia and Cyprus.
Number of shares held: nil Warrants: 12,649
ALEXANDER MARTENSEN-LARSENSenior Vice President, Corporate Business Development (2013), (Born 1975)
Alexander Martensen-Larsen holds a BSc in International Business from Copenhagen Business School and has earned an MBA from IMD Business School. Previously, Alexander Martensen-Larsen served as Director of Corporate Business Development at TDC and as a Financial Analyst at Morgan Stanley Investment Banking in London.
Chairman of the Board of Directors of Designers Remix A/S, member of the Board of Directors of DK Company A/S
Number of shares held: 6,043 Warrants: 14,094
LOTTE FRANCH WAMBERGSenior Vice President, Operations (2014), (Born 1965)
Lotte Franch Wamberg holds a BSc in Engi-neering. Before Lotte Franch Wamberg joined IC Group A/S, she served as CEO of Royal Copenhagen and as Managing Director of Weight Watchers, Nordic region. Lotte Franch Wamberg has spent a major part of her career at the LEGO Group in various roles, for example, as head of LEGOLAND Parks in Billund, Denmark, and in Germany. She has worked and lived in Germany and Sweden.
Member of the Board of Directors of Fredericia Furniture A/S and VIKAN A/S
Number of shares held: nil Warrants: nil
GLOBAL MANAGEMENT TEAM

RE
SU
LTA
CC
OU
NTS
GO
VE
RN
AN
CE
STR
ATE
GY
OV
ER
VIE
W
29MANAGEMENT COMMENTARY • ANNUAL REPORT 2014/15 • IC GROUP A/S
NICOLAS WARSCHALOWSKICEO, Peak Performance (2014), (Born 1971)
Nicolas Warschalowski holds a BSc in Business Administration from Jönköping International Business School in Sweden and has lived and studied in Scotland. Before Nicolas Warschalowski joined Peak Performance, he served as CEO of the Swedish outdoor brand Haglöfs. Previously, Nicolas Warschalowski worked as Managing Director of Red Bull’s Carpe Diem division and as Business Team Leader of Proctor & Gamble. He has lived and worked in the USA and Austria and is now based in Stockholm.
Number of shares held: nil Warrants: nil
CHARLOTTE EGELUNDCEO, By Malene Birger (2013), (Born 1971)
Charlotte Egelund holds a BBA in International Sales and Marketing Management from Copenhagen Business Academy. Before Charlotte Egelund took up the position as CEO of By Malene Birger, she worked as Retail and Franchise Director at By Malene Birger, as CEO of BTX and as Retail and Supply Chain Director of Synoptik. Previously, Charlotte Egelund worked as Retail Manager of Cali Gry in Amsterdam, the Netherlands, being responsible for the Benelux, France and UK markets.
Number of shares held: nil Warrants: 2,248
DAVID THUNMARKERCEO, Tiger of Sweden (2008), (Born 1977)
David Thunmarker holds an MSc in Business Administration and Economics from the University of Gothenburg, School of Business, Economics and Law in Sweden and has lived and studied in Australia. Before David Thun-maker took up the position as CEO of Tiger of Sweden, he served as Export Manager and Marketing Manager of Tiger of Sweden. Previously, he worked as Management Consultant of Warp Business Advisors and Accenture.
Chairman of the Board of Directors of Vingåker Factory Outlet AB
Number of shares held: 139 Warrants: 13,167
GROUP CEO MADS RYDER*)
Operational platform
Business units
*) Executive Board of IC Group A/S
OPERATIONSLOTTE FRANCH WAMBERG
LogisticsSourcingCR
BUSINESS DEVELOPMENTALEXANDER MARTENSEN-LARSEN
StrategyM&ANon-core business
GROUP CFORUD T. PEDERSEN*)
FinanceITLegalIR
BRAND CEO NICOLAS WAR-SCHALOWSKI
Peak Performance
BRAND CEO CHARLOTTE EGELUND
By Malene Birger
BRAND CEO DAVID THUNMARKER
Tiger of Sweden
30 IC GROUP A/S • ANNUAL REPORT 2014/15 • MANAGEMENT COMMENTARY
ANDERS COLDING FRIISDeputy Chairman (Born 1963).CEO of PANDORA A/S.
Anders Colding Friis has acquired extensive national and international management experience from his current role as CEO of PANDORA A/S (former CEO of Scandinavian Tobacco Group) and as a member of the Board of Directors of other businesses.
Deputy Chairman of Industrial Employers in Copenhagen, member of the Board of Direc-tors of Topdanmark A/S and of the Executive Committee and Central Board of the Confed-eration of Danish Industry (DI).
Member of the Board of Directors (2005), the Remuneration Committee (2011) and Deputy Chairman of the Board of Directors (2014).
Considered an independent member of the Board of Directors.
Number of shares held: 6,925.
HENRIK HEIDEBYChairman (Born 1949). Former Group CEO and President of PFA Holding A/S and PFA Pension.
Henrik Heideby has acquired extensive national and international management experience and skills in financing, risk management, etc. from his previous roles as Group CEO of PFA Pension, Alfred Berg Bank and FIH Erhvervsbank and as a member of the Board of Directors of other businesses.
Chairman of the Board of Directors of Carlsberg Byen P/S and Kirk & Thorsen Invest A/S, Deputy Chairman of the Board of Directors of FIH Erhvervsbank A/S, member of the Board of Directors of C.P. Dyvig & Co. A/S and SE Blue Equity Management.
Deputy Chairman of the Board of Directors (2005) and Chairman of the Board of Direc-tors (2014), the Audit Committee (2009) and the Remuneration Committee (2014).
Considered an independent member of the Board of Directors.
Number of shares held: 12,500.
NIELS MARTINSENDeputy Chairman (Born 1948).CEO of Friheden Invest A/S.
As the founder of InWear A/S and long-time CEO of InWear Group A/S (later IC Companys A/S), Niels Martinsen has acquired extensive national and international management ex-perience and solid knowledge of the interna-tional fashion industry. Niels Martinsen also has experience as a member of the Board of Directors of other businesses.
Chairman of the Board of Directors of A/S Sadolinparken and A/S Rådhusparken and member of the Board of Directors of Friheden Invest A/S.
Member of the Board of Directors (2001) and Deputy Chairman of the Board of Directors (2014). Member of the Audit Committee (2009) and Remuneration Committee (2011).
Considered a non-independent member of the Board of Directors.
Number of shares held: 7,191,128 through Friheden Invest A/S controlled by Niels Martinsen.
BOARD OF DIRECTORS
RE
SU
LTA
CC
OU
NTS
GO
VE
RN
AN
CE
STR
ATE
GY
OV
ER
VIE
W
31MANAGEMENT COMMENTARY • ANNUAL REPORT 2014/15 • IC GROUP A/S
MICHAEL HAUGE SØRENSENMember of the Board of Directors (Born 1973).
Michael Hauge Sørensen has acquired extensive national and international management experience from a closely related industry and therefore has strong business know-how and knowledge in all areas of the value chain, including product development and marketing, international sales, retail and production.
Chairman of the Board of Directors of Kwintet AB, member of the Board of Direc-tors of Pandora A/S, Zebra A/S, Michaso Holdings Limited and Santa Fe Group A/S.
Member of the Board of Directors (2014) and the Operations Committee (2014).
Considered an independent member of the Board of Directors.
Number of shares held: 1,350.
OLE WENGELMember of the Board of Directors (Born 1949).
As former Director of Corporate Affairs of InWear Group A/S, Ole Wengel has acquired experience in management of a major international fashion business and of the international fashion industry. Throughout his many years of service with the Group, he also has acquired detailed insight into and knowledge of the Group.
Member of the Board of Directors (2003), member of the Audit Committee (2009) and Remuneration Committee (2011) and Chair-man of the Operations Committee (2014).
Considered an independent member of the Board of Directors.
Number of shares held: 43,333.
ANNETTE BRØNDHOLT SØRENSENMember of the Board of Directors (Born 1963). Independent Management Consultant.
From her previous roles as Business & Fi-nance Director and member of the Board of Directors of By Malene Birger A/S, Annette Brøndholt Sørensen has acquired experi-ence of the international fashion industry and of board responsibilities. In addition, Annette Brøndholt Sørensen has gained solid experience in management, strategy, management accounting and process opti-mization from several previous management positions at the SAS Group.
Member of the Board of Directors of Birger Christensen A/S and SOS Children’s Villages.
Member of the Board of Directors (2010) and the Operations Committee (2014).
Considered an independent member of the Board of Directors.
Number of shares held: 253.
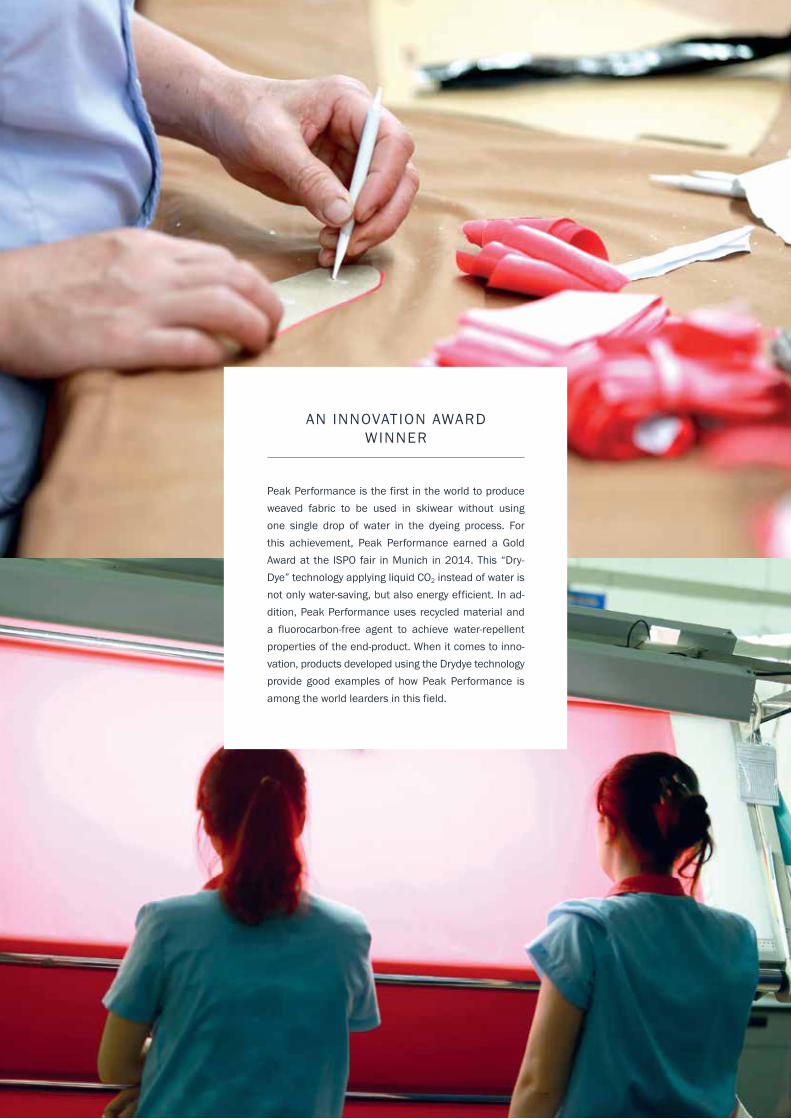
AN INNOVATION AWARD WINNER
Peak Performance is the first in the world to produce weaved fabric to be used in skiwear without using one single drop of water in the dyeing process. For this achievement, Peak Performance earned a Gold Award at the ISPO fair in Munich in 2014. This “Dry-Dye” technology applying liquid CO2 instead of water is not only water-saving, but also energy efficient. In ad-dition, Peak Performance uses recycled material and a fluorocarbon-free agent to achieve water-repellent properties of the end-product. When it comes to inno-vation, products developed using the Drydye technology provide good examples of how Peak Performance is among the world learders in this field.

RE
SU
LTA
CC
OU
NTS
GO
VE
RN
AN
CE
STR
ATE
GY
OV
ER
VIE
W
33MANAGEMENT COMMENTARY • ANNUAL REPORT 2014/15 • IC GROUP A/S
SHAREHOLDER INFORMATION AND SHARE PERFORMANCE
Share capital and share performance IC Group is a listed company and a constituent of NASDAQ OMX Copenhagen’s MidCap index.Share capital 17,0 million sharesNominal value per share 10 DKK.Closing price at 30 June 2014 185.5 DKKClosing price at 30 June 2015 187.5 DKKIncrease during the year 1.4%Highest closing price during the year (18 June 2015) 196.0 DKK
At the end of the financial year, the market value of IC Group was DKK 3.2 bn. Performance of Group Treasury sharesAt 30 June 2015, the Group owned 442.572 (467.372) shares to cover outstanding share options corresponding to 2.6% of the total number of shares issued, a decline of 0.2% compared to 30 June 2014 due to the exercise by employees of granted share options during the year.
Ownership structureAt 30 June 2015, the Group had 6,090 registered shareholders who owned a total of 98.0% of the total share capital. The Group has one share class, and the share of votes is equivalent to the share capital for the Group’s shareholders. The composition of shareholders is set out in the table below.
Investor relationsThe Group aims to maintain a high and consistent level of information to enable effective pricing of the IC Group share. To maintain a healthy dialogue with shareholders, analysts and other stakeholders about the Group’s performance, we offer webcasts following the announcement of our interim and annual reports, and Group Management regularly takes part in road-shows and investor seminars. In addition, we hold meetings with individual investors and share analysts on an ongoing basis.
For further information on the Group’s investor relations policy, financial statements, company announcements, financial calendar, etc., go to icgroup.net/investors
We aim to maintain a high and consistent level of information and an active and open dialogue with investors, analysts and other stakeholders to enable effective pricing of the Group’s shares.
SHARE PERFORMANCE (1 July 2014 = Index 100)
IC Companys A/S NASDAQ OMX MidCap NASDAQ OMX C20
140
120
100
80
60Apr 15 Jun 15Feb 15Dec 14Oct 14Jun 14 Aug 14
Index Number OwnershipDKK million of shares interest
Friheden Invest A/S* (Hørsholm, DK) 7,191,128 42.3%Hs 2.G Aps (Daugård, DK) 1,793,730 10.6%ATP (Hillerød, DK) 1,702,097 10.0%Other Danish institutional investors 3,437,397 20.2%Danish private investors 1,232,943 7.2%Foreign institutional investors 799,322 4.7%Foreign private investors 64,918 0.4%Treasury shares 442,572 2.6%Shareholders not registered by name 343,550 2.0%
Total 17,007,657 100%
* Friheden Invest A/S is controlled by Niels Martinsen, Deputy Chairman of the Board of Directors of IC Group A/S.
SHAREHOLDERS Shareholders at 30 June 2015
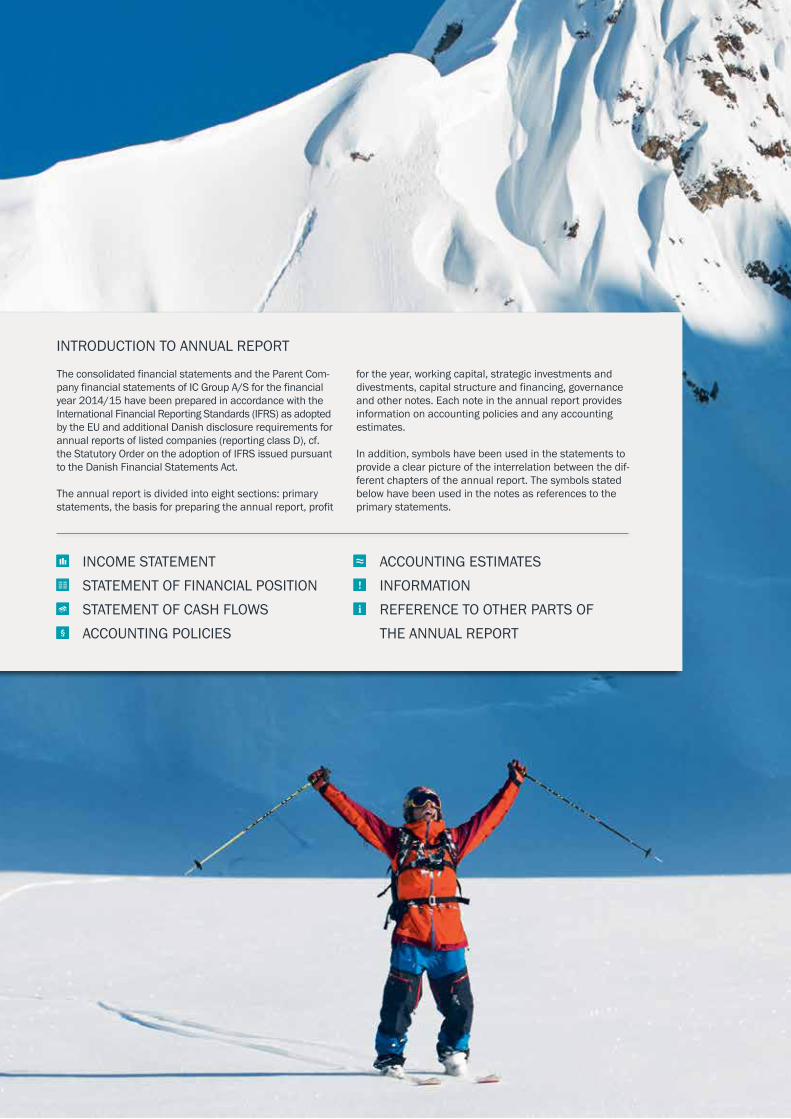
The consolidated financial statements and the Parent Com-pany financial statements of IC Group A/S for the financial year 2014/15 have been prepared in accordance with the International Financial Reporting Standards (IFRS) as adopted by the EU and additional Danish disclosure requirements for annual reports of listed companies (reporting class D), cf. the Statutory Order on the adoption of IFRS issued pursuant to the Danish Financial Statements Act.
The annual report is divided into eight sections: primary statements, the basis for preparing the annual report, profit
for the year, working capital, strategic investments and divestments, capital structure and financing, governance and other notes. Each note in the annual report provides information on accounting policies and any accounting estimates.
In addition, symbols have been used in the statements to provide a clear picture of the interrelation between the dif-ferent chapters of the annual report. The symbols stated below have been used in the notes as references to the primary statements.
INTRODUCTION TO ANNUAL REPORT
INCOME STATEMENT STATEMENT OF FINANCIAL POSITION STATEMENT OF CASH FLOWS ACCOUNTING POLICIES
ACCOUNTING ESTIMATES INFORMATION REFERENCE TO OTHER PARTS OF
THE ANNUAL REPORT
AC
CO
UN
TSR
ES
ULT
GO
VE
RN
AN
CE
STR
ATE
GY
OV
ER
VIE
W
PRIMARY STATEMENTS
CONSOLIDATED INCOME STATEMENT 36
CONSOLIDATED STATEMENT OF COMPREHENSIVE INCOME 36
CONSOLIDATED STATEMENT OF FINANCIAL POSITION 37
CONSOLIDATED STATEMENT OF CHANGES IN EQUITY 38
CONSOLIDATED STATEMENT OF CASH FLOWS 39
CHAPTER 1. BASIS FOR PREPARATION OF CONSOLIDATED FINANCIAL STATEMENTS 40
CHAPTER 2. PROFIT FOR THE YEAR
2.1 SEGMENT INFORMATION 43
2.2 STAFF COSTS 46
2.3 TAX 46
CHAPTER 3. WORKING CAPITAL
3.1 INVENTORIES 49
3.2 TRADE RECEIVABLES 50
3.3 CHANGE IN WORKING CAPITAL 51
3.4 OTHER ADJUSTMENTS TO CASH FLOW 51
CHAPTER 4. STRATEGIC INVESTMENTS AND DIVESTMENTS
4.1 INTANGIBLE ASSETS 52
4.2 PROPERTY, PLANT & EQUIPMENT 54
4.3 DISCONTINUED OPERATIONS & ASSETS CLASSIFIED AS ASSET HELD-FOR-SALE 55
4.4 INVESTMENTS IN ASSOCIATES 56
CONSOLIDATED FINANCIAL STATEMENTS
CHAPTER 5. CAPITAL STRUCTURE AND FINANCES
5.1 EQUITY 58
5.2 FINANCIAL ASSETS 59
5.3 NET INTEREST-BEARING DEBT 60
5.4 FINANCIAL RISKS AND DERIVATIVE FINANCIAL INSTRUMENTS 61
5.5 FAIR VALUE MEASUREMENT OF FINANCIAL INSTRUMENTS 64
5.6 FINANCIAL INCOME AND COSTS 65
CHAPTER 6. GOVERNANCE
6.1 REMUNERATION TO THE EXECUTIVE BOARD AND THE BOARD OF DIRECTORS 66
6.2 SHARE-BASED REMUNERATION 67
6.3 RELATED PARTIES 69
6.4 FEE TO AUDITORS ELECTED AT THE ANNUAL GENERAL MEETING 69
CHAPTER 7. OTHER NOTES
7.1 RETIREMENT BENEFIT OBLIGATIONS 70
7.2 OPERATING LEASE COMMITMENTS 71
7.3 PROVISIONS 72
7.4 CONTINGENT LIABILITIES 73
7.5 EVENTS AFTER THE REPORTING PERIOD 73

36 IC GROUP A/S • ANNUAL REPORT 2014/15 • FINANCIAL STATEMENT
CONS. INCOME STATEMENT1 JULY 2014 - 30 JUNE 2015
Note DKK million 2014/15 2013/14
2.1 Revenue 2,638 2,563 Cost of sales (1,192) (1,093)
Gross Profit 1,446 1,470
Other external costs (644) (625) 2.2 Staff costs (570) (562) Other operating income and costs 31 1
Operating profit before depreciation and amortization (EBITDA) 263 284
4.1, 4.2 Depreciation, amortization and impairment losses (56) (63)
Operating profit (EBIT) 207 221
4.4 Investments in associates 2 - 5.6 Financial income 7 15 5.6 Financial cost (15) (20)
Profit before tax 201 216
2.3 Tax on profit for the year of continuing operations (47) (56)
Profit for the year of continuing operations 154 160 4.3 Profit/loss for the year of discontinued operations (14) 5
Profit for the year 140 165
Profit allocation: Shareholders of IC Group A/S 140 164 Non-controlling interests - 1
Profit for the year 140 165
5.1 Earnings per share, DKK 8.5 9.9 5.1 Diluted earnings per share, DKK 8.5 9.9 5.1 Earnings per share of continuing operations, DKK 9.3 9.6 5.1 Diluted earnings per share of continuing operations, DKK 9.3 9.6
CONS. STATEMENT OF COMPREHENSIVE INCOME1 JULY 2014 - 30 JUNE 2015
Note DKK million 2014/15 2013/14
Profit for the year 140 165
OTHER COMPREHENSIVE INCOME Itemstobereclassifiedtotheincomestatementwhencertainconditionsaremeet: Other comprehensive income relating to associates 2 - Foreign currency translation adjustments, foreign subsidiaries 8 (22) Foreign currency translation adjustments, intercompany loans 1 9 Fair value adjustments, gains/loss on financial instruments classified as cash flow hedges 48 9 Reclassification to cost of sales, gains/loss on realized cash flow hedges (6) (20) Tax on items which can be reclassified to the income statement (10) 1 Itemswhichcannotbereclassifiedtotheincomestatement: Actuarial adjustments 1 (1)
Other comprehensive income after tax 44 (24)
Total comprehensive income 184 141
Allocation of other comprehensive income for the year: Shareholders of IC Group A/S 184 140 Non-controlling interests - 1
Total 184 141
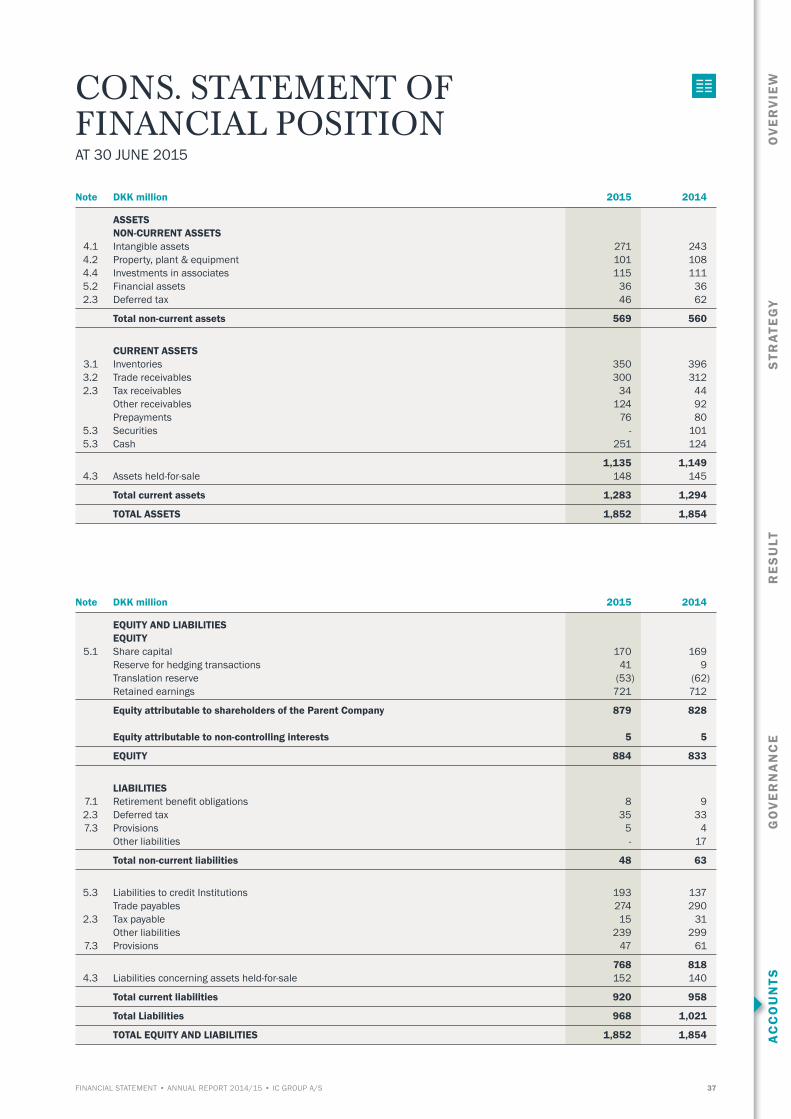
RE
SU
LTA
CC
OU
NTS
GO
VE
RN
AN
CE
STR
ATE
GY
OV
ER
VIE
W
37FINANCIAL STATEMENT • ANNUAL REPORT 2014/15 • IC GROUP A/S
CONS. STATEMENT OF FINANCIAL POSITION AT 30 JUNE 2015
Note DKK million 2015 2014
ASSETS NON-CURRENT ASSETS 4.1 Intangible assets 271 243 4.2 Property, plant & equipment 101 108 4.4 Investments in associates 115 111 5.2 Financial assets 36 36 2.3 Deferred tax 46 62
Total non-current assets 569 560
CURRENT ASSETS 3.1 Inventories 350 396 3.2 Trade receivables 300 312 2.3 Tax receivables 34 44 Other receivables 124 92 Prepayments 76 80 5.3 Securities - 101 5.3 Cash 251 124
1,135 1,149 4.3 Assets held-for-sale 148 145
Total current assets 1,283 1,294
TOTAL ASSETS 1,852 1,854
Note DKK million 2015 2014
EQUITY AND LIABILITIES EQUITY 5.1 Share capital 170 169 Reserve for hedging transactions 41 9 Translation reserve (53) (62) Retained earnings 721 712
Equity attributable to shareholders of the Parent Company 879 828 Equity attributable to non-controlling interests 5 5
EQUITY 884 833
LIABILITIES 7.1 Retirement benefit obligations 8 9 2.3 Deferred tax 35 33 7.3 Provisions 5 4 Other liabilities - 17
Total non-current liabilities 48 63
5.3 Liabilities to credit Institutions 193 137 Trade payables 274 290 2.3 Tax payable 15 31 Other liabilities 239 299 7.3 Provisions 47 61
768 818 4.3 Liabilities concerning assets held-for-sale 152 140
Total current liabilities 920 958
Total Liabilities 968 1,021
TOTAL EQUITY AND LIABILITIES 1,852 1,854

38 IC GROUP A/S • ANNUAL REPORT 2014/15 • FINANCIAL STATEMENT
CONS. STATEMENT OF CHANGES IN EQUITY1 JULY 2014 - 30 JUNE 20152015 Reserve Equity for owned by Equity hedging Trans- share- owned by Share trans- lation Retained Proposed holders of non-cont. TotalDKK million capital actions reserve earnings dividend ICG A/S interests equity
Equity at 1 July 2014 169 9 (62) 663 49 828 5 833 Profit for the year - - - 72 68 140 - 140 Other comprehensive income after tax - 32 9 3 - 44 - 44
Total comprehensive income - 32 9 75 68 184 - 184 Transactions with owners: Ordinary dividend paid - - - - (49) (49) - (49)Extraordinary dividend paid - - - (97) - (97) - (97)Share-based payments - - - 1 - 1 - 1 Exercise of share options and warrants 1 - - 11 - 12 - 12
Equity at 30 June 2015 170 41 (53) 653 68 879 5 884
2014 Reserve Equity for owned by Equity hedging Trans- share- owned by Share trans- lation Retained Proposed holders of non-cont. TotalDKK million capital actions reserve earnings dividend ICG A/S interests equity
Equity at 1 July 2013 169 17 (47) 633 33 805 4 809 Profit for the year - - - 115 49 164 1 165 Other comprehensive income after tax - (8) (15) (1) - (24) - (24)
Total comprehensive income - (8) (15) 114 49 140 1 141 Transactions with owners: Ordinary dividend paid - - - - (33) (33) - (33)Extraordinary dividend paid - - - (97) - (97) - (97)Share-based payments - - - 3 - 3 - 3 Exercise of share options - - - 10 - 10 - 10
Equity at 30 June 2014 169 9 (62) 663 49 828 5 833
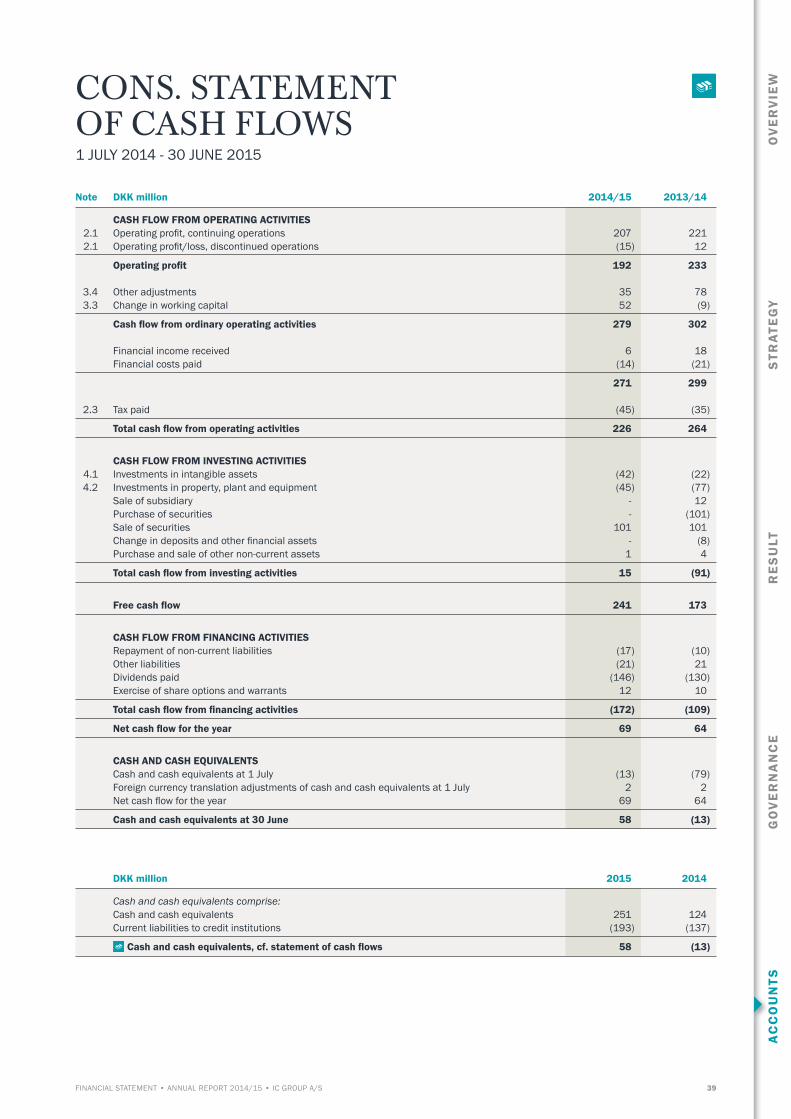
RE
SU
LTA
CC
OU
NTS
GO
VE
RN
AN
CE
STR
ATE
GY
OV
ER
VIE
W
39FINANCIAL STATEMENT • ANNUAL REPORT 2014/15 • IC GROUP A/S
CONS. STATEMENT OF CASH FLOWS 1 JULY 2014 - 30 JUNE 2015
Note DKK million 2014/15 2013/14
CASH FLOW FROM OPERATING ACTIVITIES 2.1 Operating profit, continuing operations 207 221 2.1 Operating profit/loss, discontinued operations (15) 12
Operating profit 192 233 3.4 Other adjustments 35 78 3.3 Change in working capital 52 (9)
Cash flow from ordinary operating activities 279 302 Financial income received 6 18 Financial costs paid (14) (21)
271 299 2.3 Tax paid (45) (35)
Total cash flow from operating activities 226 264
CASH FLOW FROM INVESTING ACTIVITIES 4.1 Investments in intangible assets (42) (22) 4.2 Investments in property, plant and equipment (45) (77) Sale of subsidiary - 12 Purchase of securities - (101) Sale of securities 101 101 Change in deposits and other financial assets - (8) Purchase and sale of other non-current assets 1 4
Total cash flow from investing activities 15 (91)
Free cash flow 241 173
CASH FLOW FROM FINANCING ACTIVITIES Repayment of non-current liabilities (17) (10) Other liabilities (21) 21 Dividends paid (146) (130) Exercise of share options and warrants 12 10
Total cash flow from financing activities (172) (109)
Net cash flow for the year 69 64
CASH AND CASH EQUIVALENTS Cash and cash equivalents at 1 July (13) (79) Foreign currency translation adjustments of cash and cash equivalents at 1 July 2 2 Net cash flow for the year 69 64
Cash and cash equivalents at 30 June 58 (13)
DKK million 2015 2014
Cashandcashequivalentscomprise: Cash and cash equivalents 251 124 Current liabilities to credit institutions (193) (137)
Cash and cash equivalents, cf. statement of cash flows 58 (13)
40 IC GROUP A/S • ANNUAL REPORT 2014/15 • FINANCIAL STATEMENT
CHAPTER 1 BASIS FOR PREPARATION OF THE CONSOLIDATED FINANCIAL STATEMENTS
The Group has made a number of minor reclassifications and restatements of the comparative figures in the statement of financial position.
NewIFRSstandardsissued,butnotyeteffectiveIASB has issued and the EU has adopted a number of new standards, updated some of the existing standards, including the IFRS improvement projects for 2010-2012 and 2011-2013, and introduced changes to IAS 19. These standards which will be implemented in the Group’s annual report as from 1 July 2015 will have no material impact on IC Group A/S’ annual report.
IASB has issued IFRS 9 ”Financial instruments”, a standard which is required to apply no later than 1 January 2018. IFRS 9 forms part of IASB’s project and is in replacement of IAS39. With this new standard, the classification and measurement of financial instruments and the requirements for hedging will change significantly. IC Group is currently assessing the effect of this new standard on financial instruments. The imple-mentation is not expected to have any material impact on the consolidated financial statements. The standard have not yet been adopted by the EU.
IASB has issued IFRS 15 “Revenue from Contracts with Customers” which must take effect no later than 1 January 2017. The standard is awaiting the adoption by the EU. IFRS 15 is part of a joint project with FASB and will replace IAS 18 and IAS 11. The new standard provides detailed framework definitions of revenue recognition. IC Group is currently assessing the effect of the new standard for revenue recognition. The implementation is not ex-pected to have any material impact on the consolidated financial statements.
IASB has issued a changed IAS 27 standard, ”Consolidated and Separate Financial Statements” which must take effect no later than 1 January 2016. This change provides for the application of equity value when measuring investments in subsidiaries and associates in the Parent Company financial statements. IC Group expects to utilize this opportunity. The standard is awaiting the adoption by the EU.
The list below specifies the notes/sections that include the detailed accounting policies.
1.1. SUMMARY OF SIGNIFICANT ACCOUNTING POLICIESThe consolidated financial statements reflect the financial results of many complex transactions which are consolidated into classes based on nature or function. If an item in itself is not material, it will be integrated into other items of a similar nature in the consolidated financial statements or in the notes.
The disclosure requirements provide specific information on the requirements under IFRS, unless such information is con-sidered to be insignificant to the financial decision-making of the users of these statements or considered irrelevant.
Apart from the below, the accounting policies applied remain unchanged compared to last year.
Change of segment informationAs from the Interim Report for Q3 2014/15, the Group changed its segment information. Restated comparative figures has been implemented. So far, all costs have been allocated to all Group business segments (the Premium brands and the Non-core business). To simplify and increase the transparency of the Group’s financial reporting, the impact on the performance of central functions and activities of the Group will be reported separately under the heading “Unallocated items and elimina-tions”.
In all material respects, the item ”Unallocated items and eliminations” include:
• Central income and costs that are not allocated to the Group’s business segments
• Intercompany eliminations• Any differences between costs invoiced to Group brands
and realised costs pertaining to the Group’s Premium Services functions.
See note 2.1 for a detailed description of the segments.
Implementation of new IFRS standards and interpretationsAs from the financial year ending 30 June 2015, IC Group A/S has implemented all new or changed accounting standards (IFRS) and IFRIC interpretations as adopted by the EU. This implementation has no impact on the recognition and measurement of the Group’s assets and liabilities.
The consolidated financial statements and the Parent Company financial statements, respectively, of IC Group A/S for the financial year 2014/15 have been prepared in accordance with the International Financial Reporting Standards (IFRS) as adopted by the EU and additional Danish disclosure requirements for annual reports of listed companies (Reporting class D), see the Statutory Order on adoption of IFRS issued pursuant to the Danish Financial Statements Act.

RE
SU
LTA
CC
OU
NTS
GO
VE
RN
AN
CE
STR
ATE
GY
OV
ER
VIE
W
41FINANCIAL STATEMENT • ANNUAL REPORT 2014/15 • IC GROUP A/S
ACCOUNTING POLICIES The accounting policies that considered by Management to be material to the understanding of the consolidated financial statements are set out below and described in further detail in the individual notes.
2.1 Segment information 2.2 Staff costs2.3 Tax 3.1 Inventories3.2 Trade receivables3.3 Change in working capital4.1 Intangible assets4.2 Property, plant and equipment4.3 Discontinued operations and assets classified
as held-for-sale4.4 Investments in associates5.1 Equity5.2 Financial assets5.3 Net interest-bearing debt5.4 Financial risks and derivative financial instruments5.6 Financial income and costs6.2 Share-based remuneration7.1 Retirement benefit obligations7.2 Operating lease commitments7.3 Provisions7.4 Contingent liabilities
Basis of consolidationThe consolidated financial statements consist of the financial statements of IC Group A/S (the Parent Company) and the sub-sidiaries in which the Group’s voting rights directly or indirectly exceed 50%, or in which the Group otherwise has a controlling interest.
The consolidated financial statements are prepared based on the financial statements of Parent Company and the individual subsidiaries by consolidating items of a uniform nature. Equity interests, intercompany transactions, intercompany balances, unrealized intercompany gains on inventories and dividends are eliminated.
The items of the financial statements of subsidiaries are fully recognized in the consolidated financial statements. The pro-portionate share of the results of non-controlling interests and associated companies is recognized in the consolidated income statement for the year.
The proportionate share of equity of associated companies is recognized in the financial statement of financial position under non-current assets.
Foreign currencyFunctional currencyA functional currency is determined for each of the reporting enti-ties of the Group, The functional currency is the currency in the primary economic environment in which the individual reporting entity operates. Transactions in currencies other than the function-al currency are transactions denominated in foreign currencies.
The consolidated financial statements and the Parent Company financial statements are reported in Danish kroner (DKK) which is considered the primary currency of the Group’s activities and the functional currency of the Parent company.
Foreign currency translationOn initial recognition, transactions denominated in foreign currencies are translated into the functional currency at the ex-change rate prevailing at the transaction date. Foreign exchange rate differences arising between the transaction date and the date of payment are recognized in the income statement under cost of sales or financial income or costs, respectively.
Receivables, payables and other monetary items denominated in foreign currencies are translated into the functional currency using the exchange rates prevailing at the end of the reporting period. The difference between the exchange rate prevailing at the end of the reporting period and the exchange rate at the date when the receivable or payable arose or was recorded in the most recent annual report is recognized in the income statement under revenue, sales of costs or financial income or costs, respectively. Property, plant and equipment and intangible assets, inventories and other non-monetary assets acquired in foreign currencies and measured based on historical cost are translated at the exchange rates prevailing at the transaction date.
TranslationintheconsolidatedfinancialstatementsThe statements of financial position of foreign subsidiaries are translated into DKK at the exchange rate prevailing at the end of the reporting period, while income statements are translated into DKK at monthly average exchange rates during the year. Foreign exchange differences arising from the translation of foreign sub-sidiaries’ opening equity using the exchange rates prevailing at the end of the reporting period as well as from the translation of the income statements using average exchange rates at the end of the reporting period are recognized under other comprehensive income. Foreign exchange adjustments of receivables in foreign subsidiaries that are considered to be part of the overall invest-ment in the subsidiaries are recognized under other comprehen-sive income in the consolidated financial statements and in the income statement of the Parent Company financial statements.
Other receivablesOn initial recognition, receivables are measured at fair value and subsequently at amortized cost which usually corresponds to the nominal value less write-down for bad debts. All other receivables are due for payment within 1 year and primarily relate to VAT and duties, credit card receivables, financial instruments, etc.

42 IC GROUP A/S • ANNUAL REPORT 2014/15 • FINANCIAL STATEMENT
Prepayments, assetsPrepayments recognized under assets comprise costs defrayed relating to the following financial year, including collection sam-ples, rent, insurance, etc. Prepayments are measured at cost.
Other liabilitiesOn initial recognition, other liabilities are measured at fair value less any transaction costs. Subsequently, other liabilities are measured at amortized cost. The carrying amount of amounts payable under other liabilities corresponds in all material re-spects to the fair value of the liabilities.
Other liabilities primarily relate to VAT and duties, staff liabilities, other costs payable as well as loss on financial instruments.
Statement of cash flowThe statement of cash flows shows the cash flows of the Group and the Parent Company from operating activities, investing and financing activities for the year, net cash flows for the year as well as cash and cash equivalents at the beginning and at the end of the financial year.
The statement of cash flows shows cash flow from operating activities indirectly based on operating profit.
Cash flow from operating activities is calculated as operating profit adjusted for non-cash operating items, provisions, finan-cials paid, change in working capital and tax.
Cash flow from investing activities includes payments regard-ing acquisition and sale of non-current assets and securities, including investments in businesses.
Cash flow from financing activities includes payments to and from shareholders as well as the raising and repayment of mortgage loans and other non-current liabilities not included in working capital.
Cash and cash equivalents comprise cash and net short- term bank loans forming an integral part of the Group’s cash management.
Business combinationsNewly acquired or newly established businesses are recognized in the consolidated financial statements from the acquisition date or incorporation date, respectively. The acquisition date is the date when control of the business actually passes to the Group.
Acquisitions are accounted for using the acquisition method, under which the identifiable assets, liabilities and contingent liabilities of businesses acquired are measured at fair value at the acquisition date. Acquired non-current assets held-for-sale are measured at fair value less expected cost of sales.
Restructuring costs are only recognized in the acquisition state-ment of financial position if they represent a liability to the acquired business. The tax effect of revaluations is taken into account.
The cost of a business is the fair value of the consideration paid. If the consideration is finally determined based on one ormore future events, these adjustments are recognized at fair value at the date of acquisition. Costs directly attributable to acquisitions are recognized directly in the income statement from the date of payment.
Any excess (goodwill) of the cost of an acquired business, the value of the non-controlling interest in the acquired business and the fair value of previously acquired equity interests over the fair value of the acquired assets, liabilities and contingent liabilities is recognized as an asset under intangible assets and tested for impairment once per year as a minimum. If the carrying amount of an asset exceeds its recoverable amount, the asset is written down to the reduced recoverable amount.
In case of negative differences (negative goodwill), the calculated fair values and the calculated cost of the business, the value of the non-controlling interest in the acquired business and the fair value of previously acquired equity interests are reassessed. If the difference is still negative following the reassessment, the difference is then recognized as income in the income statement.
Purchase of minority interests in a subsidiary is recognised in the consolidated financial statements as an equity transaction, and the difference between the consideration and the carrying amount is allocated to the Parent Company’s share of equity.
1.2. SIGNIFICANT ACCOUNTING ESTIMATESIn the preparation of the consolidated financial statements of IC Group, Management makes various significant accountingestimates and assumptions that may affect the reported values of assets, liabilities, income, costs, cash flow and related in-formation at the reporting date.
The significant accounting estimates are based on historical experience and other factors deemed reasonable in the circum-stances. By their nature, such estimates are subject to some uncertainty and the actual results may deviate from these esti-mates. The estimates are continuously evaluated and the effect of any changes is recognized in the relevant period.
The significant accounting estimates and assumptions deemed by Management to be material to the preparation and under-standing of the consolidated financial statements are listed below and described in more detail in the relevant notes:
SIGNIFICANT ACCOUNTING ESTIMATES2.3 Tax3.1 Inventories3.2 Trade receivables4.1 Intangible assets4.2 Property, plant and equipment4.4 Investments in associates6.2 Share-based remuneration7.1 Retirement benefit obligations7.3 Provisions

This chapter provides a specification of consolidated operating profit. The Group segments are based on three Premium brands; Peak Performance, Tiger of Sweden and By Malene Birger, which are measured by their operating profits (EBIT). The financial results of the individual segments are presented in note 2.1, and the financial performance of the Group as well as of the segments is described further in the Management Commentary on pages 12-20.
RE
SU
LTA
CC
OU
NTS
GO
VE
RN
AN
CE
STR
ATE
GY
OV
ER
VIE
W
43FINANCIAL STATEMENT • ANNUAL REPORT 2014/15 • IC GROUP A/S
2.1 SEGMENT INFORMATIONBusiness segmentsReporting to the Executive Board which is considered to be the Chief Operating Decision-Maker is based on the Group’s three core business segments: Peak Performance, Tiger of Sweden and By Malene Birger.
Mid Market division was sold in 2013/14 and is therefore classified separately as discontinued operations.
Core segmentsThe Group’s core segments comprise the following Premium brands: Peak Performance, Tiger of Sweden and By Malene Birger as well as any external third-party revenue generated from the brands’ stores.
The main target of the Group’s core segments is to generate growth through increased market penetration and international expansion with a view to increasing revenue and earnings.
CHAPTER 2 PROFIT FOR THE YEAR
Non-core businessNon-core business comprises the two brands Saint Tropez and Designers Remix which meet the qualitative criteria for aggregation of the operational segments.
The intention with the Group’s Non-core business is to divest Saint Tropez in the longer term and to resolve the future ownership of Designers Remix.
Unallocated items and eliminations”Unallocated items and eliminations” will comprise:• Central income and costs that are not allocated to
the Group’s business segments;• Intergroup eliminations;• Any differences between costs invoiced to Group brands
and realized costs pertaining to the Groups’ Premium Services functions.
FINANCIAL KEY RATIOS
REVENUE GROWTH (LOCAL CURRENCY)
4.9%Revenue growth was
driven by the Group’s core business.
OPERATING PROFIT
DKK 207mCorresponding to an EBIT margin of 7.8%.
Adjusted for non-recurring costs and capacity costs,
EBIT margin was 9.3%.
EFFECTIVE TAX RATE
23.2% (25.8%)
REVENUE PER BUSINESS UNIT
Peak Performance
Tiger of Sweden
By Malene Birger
Non-core business
36%
36%
13%
15%
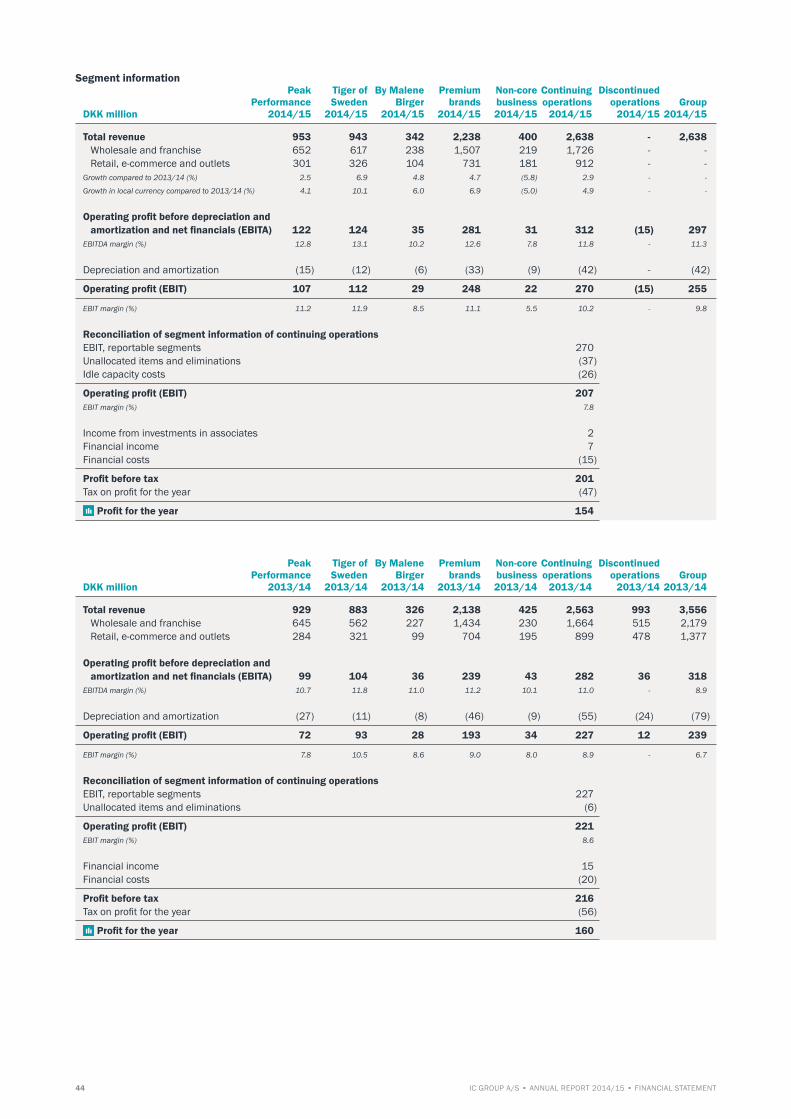
44 IC GROUP A/S • ANNUAL REPORT 2014/15 • FINANCIAL STATEMENT
Segment information Peak Tiger of By Malene Premium Non-core Continuing Discontinued Performance Sweden Birger brands business operations operations GroupDKK million 2014/15 2014/15 2014/15 2014/15 2014/15 2014/15 2014/15 2014/15
Total revenue 953 943 342 2,238 400 2,638 - 2,638 Wholesale and franchise 652 617 238 1,507 219 1,726 - - Retail, e-commerce and outlets 301 326 104 731 181 912 - -Growthcomparedto2013/14(%) 2.5 6.9 4.8 4.7 (5.8) 2.9 - -
Growthinlocalcurrencycomparedto2013/14(%) 4.1 10.1 6.0 6.9 (5.0) 4.9 - -
Operating profit before depreciation and amortization and net financials (EBITA) 122 124 35 281 31 312 (15) 297 EBITDAmargin(%) 12.8 13.1 10.2 12.6 7.8 11.8 - 11.3
Depreciation and amortization (15) (12) (6) (33) (9) (42) - (42)
Operating profit (EBIT) 107 112 29 248 22 270 (15) 255
EBITmargin(%) 11.2 11.9 8.5 11.1 5.5 10.2 - 9.8
Reconciliation of segment information of continuing operations EBIT, reportable segments 270 Unallocated items and eliminations (37) Idle capacity costs (26)
Operating profit (EBIT) 207 EBIT margin (%) 7.8
Income from investments in associates 2 Financial income 7 Financial costs (15)
Profit before tax 201 Tax on profit for the year (47)
Profit for the year 154
Peak Tiger of By Malene Premium Non-core Continuing Discontinued Performance Sweden Birger brands business operations operations GroupDKK million 2013/14 2013/14 2013/14 2013/14 2013/14 2013/14 2013/14 2013/14
Total revenue 929 883 326 2,138 425 2,563 993 3,556 Wholesale and franchise 645 562 227 1,434 230 1,664 515 2,179 Retail, e-commerce and outlets 284 321 99 704 195 899 478 1,377 Operating profit before depreciation and amortization and net financials (EBITA) 99 104 36 239 43 282 36 318 EBITDAmargin(%) 10.7 11.8 11.0 11.2 10.1 11.0 - 8.9
Depreciation and amortization (27) (11) (8) (46) (9) (55) (24) (79)
Operating profit (EBIT) 72 93 28 193 34 227 12 239
EBITmargin(%) 7.8 10.5 8.6 9.0 8.0 8.9 - 6.7
Reconciliation of segment information of continuing operations EBIT, reportable segments 227 Unallocated items and eliminations (6)
Operating profit (EBIT) 221 EBIT margin (%) 8.6
Financial income 15 Financial costs (20)
Profit before tax 216 Tax on profit for the year (56)
Profit for the year 160
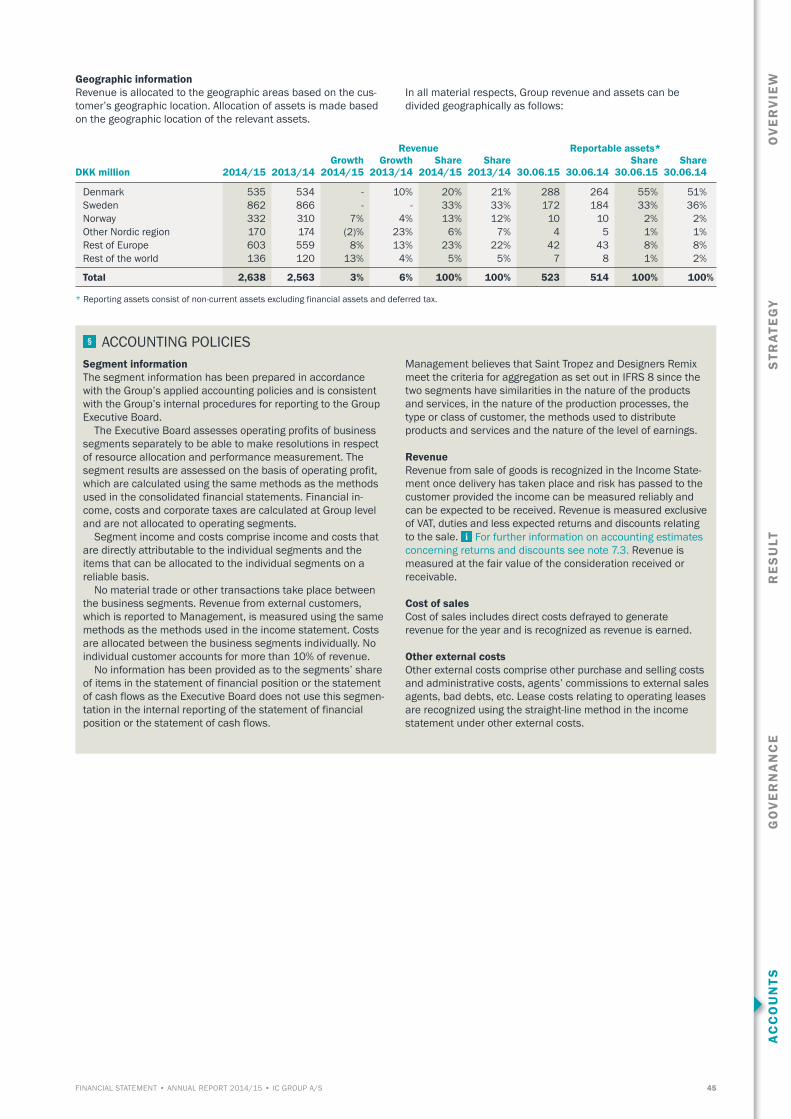
RE
SU
LTA
CC
OU
NTS
GO
VE
RN
AN
CE
STR
ATE
GY
OV
ER
VIE
W
45FINANCIAL STATEMENT • ANNUAL REPORT 2014/15 • IC GROUP A/S
Geographic informationRevenue is allocated to the geographic areas based on the cus-tomer’s geographic location. Allocation of assets is made based on the geographic location of the relevant assets.
In all material respects, Group revenue and assets can be divided geographically as follows:
Revenue Reportable assets* Growth Growth Share Share Share Share
DKK million 2014/15 2013/14 2014/15 2013/14 2014/15 2013/14 30.06.15 30.06.14 30.06.15 30.06.14
Denmark 535 534 - 10% 20% 21% 288 264 55% 51%Sweden 862 866 - - 33% 33% 172 184 33% 36%Norway 332 310 7% 4% 13% 12% 10 10 2% 2%Other Nordic region 170 174 (2)% 23% 6% 7% 4 5 1% 1%Rest of Europe 603 559 8% 13% 23% 22% 42 43 8% 8%Rest of the world 136 120 13% 4% 5% 5% 7 8 1% 2%
Total 2,638 2,563 3% 6% 100% 100% 523 514 100% 100%
* Reporting assets consist of non-current assets excluding financial assets and deferred tax.
ACCOUNTING POLICIES Segment informationThe segment information has been prepared in accordance with the Group’s applied accounting policies and is consistent with the Group’s internal procedures for reporting to the Group Executive Board. The Executive Board assesses operating profits of business segments separately to be able to make resolutions in respect of resource allocation and performance measurement. The segment results are assessed on the basis of operating profit, which are calculated using the same methods as the methods used in the consolidated financial statements. Financial in-come, costs and corporate taxes are calculated at Group level and are not allocated to operating segments. Segment income and costs comprise income and costs that are directly attributable to the individual segments and the items that can be allocated to the individual segments on a reliable basis. No material trade or other transactions take place between the business segments. Revenue from external customers, which is reported to Management, is measured using the same methods as the methods used in the income statement. Costs are allocated between the business segments individually. No individual customer accounts for more than 10% of revenue. No information has been provided as to the segments’ share of items in the statement of financial position or the statement of cash flows as the Executive Board does not use this segmen-tation in the internal reporting of the statement of financial position or the statement of cash flows.
Management believes that Saint Tropez and Designers Remix meet the criteria for aggregation as set out in IFRS 8 since the two segments have similarities in the nature of the products and services, in the nature of the production processes, the type or class of customer, the methods used to distribute products and services and the nature of the level of earnings.
RevenueRevenue from sale of goods is recognized in the Income State-ment once delivery has taken place and risk has passed to the customer provided the income can be measured reliably and can be expected to be received. Revenue is measured exclusive of VAT, duties and less expected returns and discounts relating to the sale. For further information on accounting estimates concerning returns and discounts see note 7.3. Revenue is measured at the fair value of the consideration received or receivable.
Cost of salesCost of sales includes direct costs defrayed to generate revenue for the year and is recognized as revenue is earned.
Other external costsOther external costs comprise other purchase and selling costs and administrative costs, agents’ commissions to external sales agents, bad debts, etc. Lease costs relating to operating leases are recognized using the straight-line method in the income statement under other external costs.

46 IC GROUP A/S • ANNUAL REPORT 2014/15 • FINANCIAL STATEMENT
2.2 STAFF COSTS
DKK million 2014/15 2013/14
Total salaries, remuneration, etc. can be specified as follows:Remuneration to the Board of Directors, cf. note 6.1 4 3 Salaries and remuneration 470 452 Defined contribution plans, cf. note 7.1 23 27 Defined benefit plans, cf. note 7.1 1 1 Other social security costs 54 54 Share-based payments 1 3 Other staff costs 17 22
Total staff costs 570 562
Average number of Group employees 1,045 1,156
ACCOUNTING POLICIES Staff costs include salaries, remuneration, retirement benefit schemes, share-based payments and other staff costs to the Group’s employees, including the members of the Executive Board and Board of Directors. Staff costs are recognized in the financial year in which the individual employee provides the related service. Costs relating
to long-term employee benefits, e.g., share-based payments are recognized in the period to which they relate. See note 6.1 for further information on remuneration of Management and note 6.2 for further information on the Group’s share option programs and warrants programs.
2.3 TAXTax for the year
DKK million 2014/15 2013/14
Current taxCurrent tax for the year under review 36 46 Prior-year adjustments, current tax 2 1 Foreign non-income dependent taxes 1 2
Total current tax 39 49
Deferred taxChange in deferred tax 17 8 Prior-year adjustments, deferred tax (3) 2 Adjustment regarding changes in tax rates, deferred tax 2 3
Total deferred tax 16 13
Tax for the year 55 62
Recognized as follows: Tax on profit for the year of continuing operations 47 56
Tax on profit/loss of discontinued operations (2) 7 Tax on other comprehensive income 10 (1)
Tax for the year 55 62
Net tax receivable/(payable) at 1 July 13 30 Tax payable on profit for the year (38) (50)Tax paid during the financial year 45 35 Disposal in connection with sale - (1)Foreign currency translation adjustments, etc. (1) (1)
Net tax receivable at 30 June 19 13
Recognized as follows: Tax receivable 34 44 Tax payable (15) (31)
Net tax receivable at 30 June 19 13

RE
SU
LTA
CC
OU
NTS
GO
VE
RN
AN
CE
STR
ATE
GY
OV
ER
VIE
W
47FINANCIAL STATEMENT • ANNUAL REPORT 2014/15 • IC GROUP A/S
Breakdown on tax on profit for the year of continuing operations is as follows:
DKK million 2014/15 2013/14
Calculated tax on profit before tax, 23.5% (24.5%) 47 53 Effect of other non-taxable income and other non-deductible costs 2 1 Effect of adjustment regarding changes in tax rates, deferred tax 2 3 Effect of net deviation on tax in foreign subsidiaries relative to 23.50% (24.50%), net (2) (6)Foreign non-income dependent taxes 1 2 Prior-year adjustments (1) 3 Revaluation of tax losses, etc. (2) (1)Other adjustments - 1
Total 47 56
Effective tax rate for the year (%) 23.2 25.8
Tax on other comprehensive income Foreign currency translation adjustments, subsidiaries - (2)Fair value adjustment of financial instruments held as cash flow hedges (10) 3
Total tax on other comprehensive income (10) 1
Deferred tax
DKK million 2015 2014
Deferred tax at 1 July 29 43 Foreign currency translation adjustments - 1 Prior-year adjustments 3 (2)Adjustment regarding changes in tax rates (2) (3)Disposal in connection with sale - (3)Deferred tax on other comprehensive income (10) 1 Change in deferred tax on profit/loss for the year (7) (8)
Deferred tax at 30 June, net 13 29
Recognized as follows: Deferred tax assets 46 62
Deferred tax assets realting to assets held-for-sale 2 - Deferred tax liabilities (35) (33)
Deferred tax at 30 June, net 13 29
Breakdown of deferred tax at 30 June as follows:Gross deferred tax assets and liabilities 74 90 Unrecognized tax assets (61) (61)
Deferred tax at 30 June, net 13 29
Unrecognized tax assets relate to tax losses where it is considered sufficiently unlikely that they be utillized within the foreseeable future. In all material respects, the unrecognized tax losses have no expiry date.
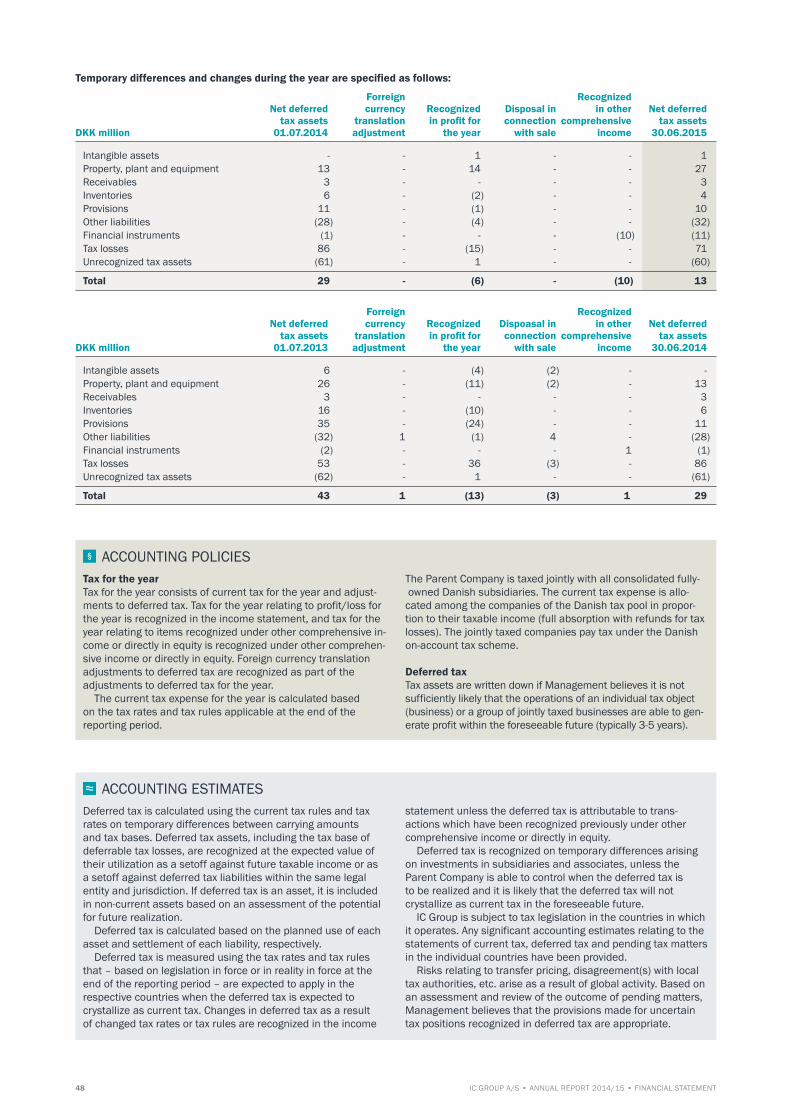
48 IC GROUP A/S • ANNUAL REPORT 2014/15 • FINANCIAL STATEMENT
Temporary differences and changes during the year are specified as follows:
Forreign Recognized Net deferred currency Recognized Disposal in in other Net deferred tax assets translation in profit for connection comprehensive tax assets DKK million 01.07.2014 adjustment the year with sale income 30.06.2015
Intangible assets - - 1 - - 1 Property, plant and equipment 13 - 14 - - 27 Receivables 3 - - - - 3 Inventories 6 - (2) - - 4 Provisions 11 - (1) - - 10 Other liabilities (28) - (4) - - (32)Financial instruments (1) - - - (10) (11)Tax losses 86 - (15) - - 71 Unrecognized tax assets (61) - 1 - - (60)
Total 29 - (6) - (10) 13
Forreign Recognized Net deferred currency Recognized Dispoasal in in other Net deferred tax assets translation in profit for connection comprehensive tax assets DKK million 01.07.2013 adjustment the year with sale income 30.06.2014
Intangible assets 6 - (4) (2) - - Property, plant and equipment 26 - (11) (2) - 13 Receivables 3 - - - - 3 Inventories 16 - (10) - - 6 Provisions 35 - (24) - - 11 Other liabilities (32) 1 (1) 4 - (28)Financial instruments (2) - - - 1 (1)Tax losses 53 - 36 (3) - 86 Unrecognized tax assets (62) - 1 - - (61)
Total 43 1 (13) (3) 1 29
ACCOUNTING POLICIES Tax for the yearTax for the year consists of current tax for the year and adjust-ments to deferred tax. Tax for the year relating to profit/loss for the year is recognized in the income statement, and tax for the year relating to items recognized under other comprehensive in-come or directly in equity is recognized under other comprehen-sive income or directly in equity. Foreign currency translationadjustments to deferred tax are recognized as part of the adjustments to deferred tax for the year. The current tax expense for the year is calculated based on the tax rates and tax rules applicable at the end of the reporting period.
The Parent Company is taxed jointly with all consolidated fully- owned Danish subsidiaries. The current tax expense is allo-cated among the companies of the Danish tax pool in propor-tion to their taxable income (full absorption with refunds for tax losses). The jointly taxed companies pay tax under the Danish on-account tax scheme.
Deferred taxTax assets are written down if Management believes it is not sufficiently likely that the operations of an individual tax object(business) or a group of jointly taxed businesses are able to gen-erate profit within the foreseeable future (typically 3-5 years).
ACCOUNTING ESTIMATESDeferred tax is calculated using the current tax rules and tax rates on temporary differences between carrying amounts and tax bases. Deferred tax assets, including the tax base of deferrable tax losses, are recognized at the expected value of their utilization as a setoff against future taxable income or as a setoff against deferred tax liabilities within the same legal entity and jurisdiction. If deferred tax is an asset, it is included in non-current assets based on an assessment of the potential for future realization. Deferred tax is calculated based on the planned use of each asset and settlement of each liability, respectively. Deferred tax is measured using the tax rates and tax rules that – based on legislation in force or in reality in force at the end of the reporting period – are expected to apply in the respective countries when the deferred tax is expected to crystallize as current tax. Changes in deferred tax as a result of changed tax rates or tax rules are recognized in the income
statement unless the deferred tax is attributable to trans-actions which have been recognized previously under other comprehensive income or directly in equity. Deferred tax is recognized on temporary differences arising on investments in subsidiaries and associates, unless the Parent Company is able to control when the deferred tax is to be realized and it is likely that the deferred tax will not crystallize as current tax in the foreseeable future. IC Group is subject to tax legislation in the countries in which it operates. Any significant accounting estimates relating to the statements of current tax, deferred tax and pending tax matters in the individual countries have been provided. Risks relating to transfer pricing, disagreement(s) with local tax authorities, etc. arise as a result of global activity. Based on an assessment and review of the outcome of pending matters, Management believes that the provisions made for uncertain tax positions recognized in deferred tax are appropriate.
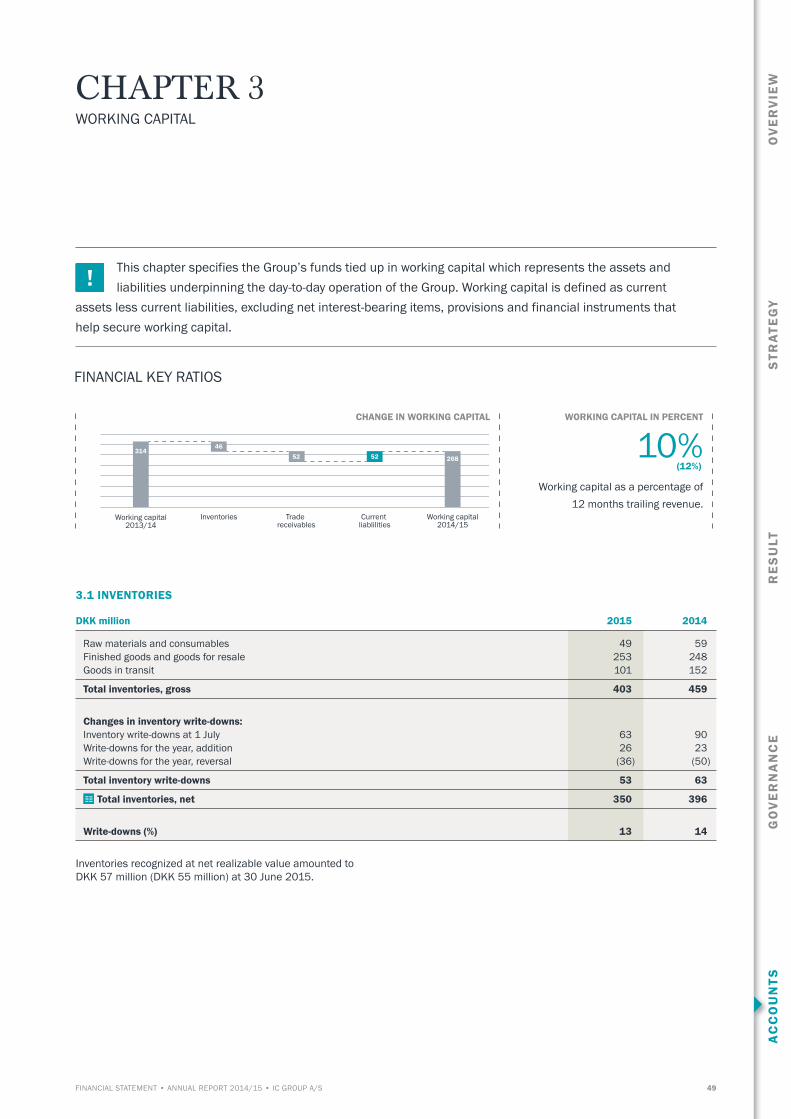
This chapter specifies the Group’s funds tied up in working capital which represents the assets and liabilities underpinning the day-to-day operation of the Group. Working capital is defined as current assets less current liabilities, excluding net interest-bearing items, provisions and financial instruments that help secure working capital.
RE
SU
LTA
CC
OU
NTS
GO
VE
RN
AN
CE
STR
ATE
GY
OV
ER
VIE
W
49FINANCIAL STATEMENT • ANNUAL REPORT 2014/15 • IC GROUP A/S
CHAPTER 3 WORKING CAPITAL
3.1 INVENTORIES
DKK million 2015 2014
Raw materials and consumables 49 59 Finished goods and goods for resale 253 248 Goods in transit 101 152
Total inventories, gross 403 459
Changes in inventory write-downs: Inventory write-downs at 1 July 63 90 Write-downs for the year, addition 26 23 Write-downs for the year, reversal (36) (50)
Total inventory write-downs 53 63
Total inventories, net 350 396
Write-downs (%) 13 14
Inventories recognized at net realizable value amounted to DKK 57 million (DKK 55 million) at 30 June 2015.
CHANGE IN WORKING CAPITAL
FINANCIAL KEY RATIOS
Inventories Trade receivables
Current liablilities
Working capital2014/15
Working capital2013/14
31446
52 26852
WORKING CAPITAL IN PERCENT
10% (12%)
Working capital as a percentage of 12 months trailing revenue.

50 IC GROUP A/S • ANNUAL REPORT 2014/15 • FINANCIAL STATEMENT
ACCOUNTING POLICIES Inventories are measured at cost using the FIFO method. Inven-tories are written down to the lower of cost and net realizable value. The cost of raw materials and consumables includes the purchase price and direct costs to take delivery of the products. The cost of finished products includes the cost of raw materi-
als, consumables, external production costs and costs relating to delivery of the products. The net realizable value of finished products is determined as the expected selling price less costs incurred to execute the sale.
ACCOUNTING ESTIMATESBy nature, product collections have a limited life-span. If the right products are not available in the stores at the right time, this may result in lost revenue or a potentially higher number of returned and surplus products leading to write-downs. The
measurement of inventories is based on an individual assess-ment of season and age and on the realization risk assessed to exist for individual product items.
3.2 TRADE RECEIVABLES
DKK million 2015 2014
Not yet due 253 239 Due, 1-60 days 25 40 Due, 61-120 days 13 11 Due more than 120 days 9 22
Total trade receivables, net 300 312
Change in write-downs of trade receivables for the year: Write-downs at 1 July 50 69 Change in write-downs for the year 9 (11)Realized loss for the year (20) (8)
Total write-downs 39 50
The most significant write-downs constitute a former Franchise partner in Schwizerland in the amount of DKK 10 million. In general, the receivables do not carry interest until between 30 and 60 days after the date of invoice. After this date, interest is charged to the outstanding amount.
The Group has recognized DKK 2 million (DKK 4 million) in connection with interest on overdue trade receivables for 2014/15.
ACCOUNTING POLICIES On initial recognition, receivables are measured at fair value and subsequently at amortized cost which usually corresponds to the nominal value less provision for bad debts.
Receivables are written down to net realizable value correspond-ing to the amount of expected future net payments received on the receivables. Write-downs are calculated on the basis of indi-vidual assessments of the receivables.
ACCOUNTING ESTIMATESLoss on trade receivables are written down by Management as a result of expected inability to pay by customers. When assessing whether Group write-downs are adequate, Management makes an analysis of the age distribution, past payment patterns/pay-
ment behavior and customer credit worthiness and any change of customer terms and conditions of payment. Credit periods vary according to customs of the individual markets.
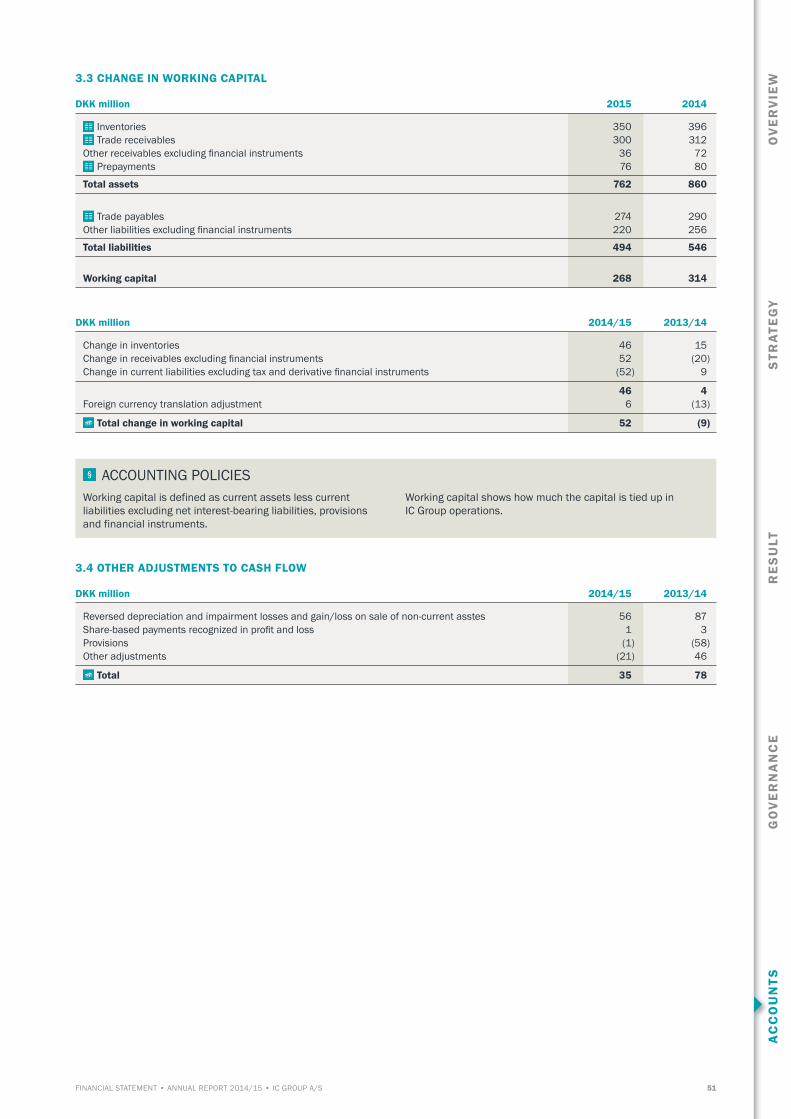
RE
SU
LTA
CC
OU
NTS
GO
VE
RN
AN
CE
STR
ATE
GY
OV
ER
VIE
W
51FINANCIAL STATEMENT • ANNUAL REPORT 2014/15 • IC GROUP A/S
3.3 CHANGE IN WORKING CAPITAL
DKK million 2015 2014
Inventories 350 396 Trade receivables 300 312
Other receivables excluding financial instruments 36 72 Prepayments 76 80
Total assets 762 860
Trade payables 274 290
Other liabilities excluding financial instruments 220 256
Total liabilities 494 546
Working capital 268 314
DKK million 2014/15 2013/14
Change in inventories 46 15 Change in receivables excluding financial instruments 52 (20)Change in current liabilities excluding tax and derivative financial instruments (52) 9
46 4Foreign currency translation adjustment 6 (13)
Total change in working capital 52 (9)
ACCOUNTING POLICIES Working capital is defined as current assets less current liabilities excluding net interest-bearing liabilities, provisions and financial instruments.
Working capital shows how much the capital is tied up in IC Group operations.
3.4 OTHER ADJUSTMENTS TO CASH FLOW
DKK million 2014/15 2013/14
Reversed depreciation and impairment losses and gain/loss on sale of non-current asstes 56 87 Share-based payments recognized in profit and loss 1 3 Provisions (1) (58)Other adjustments (21) 46
Total 35 78
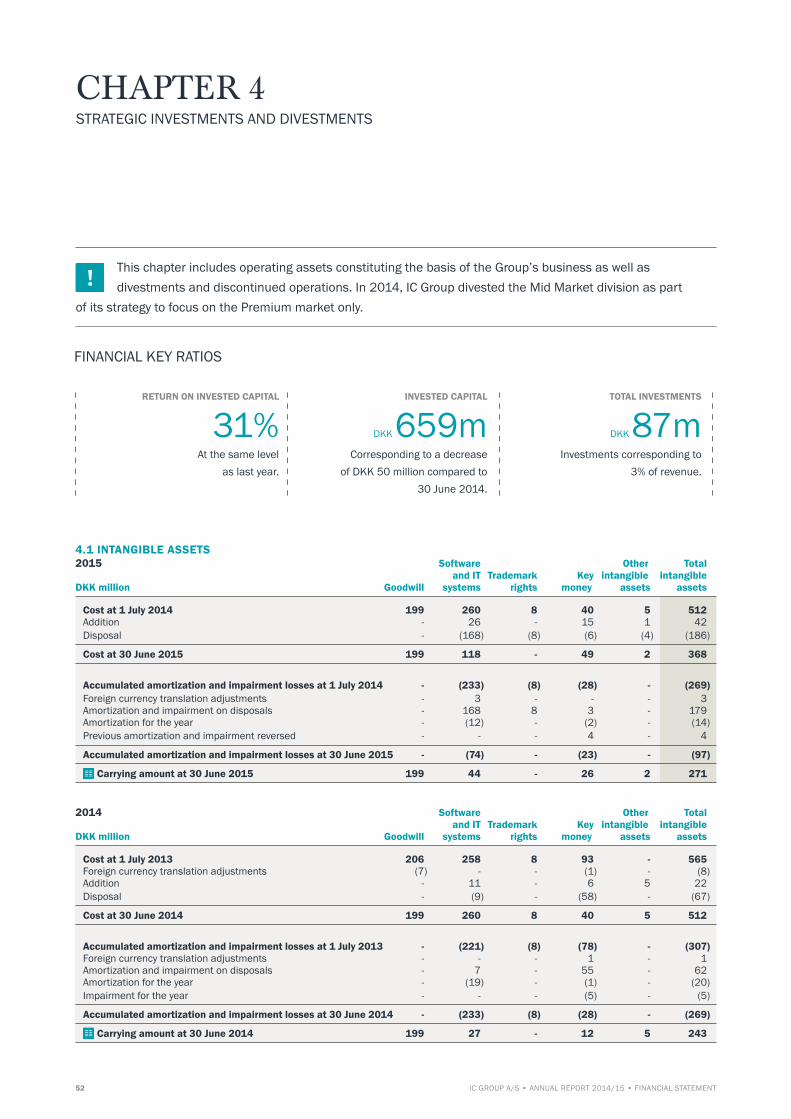
52 IC GROUP A/S • ANNUAL REPORT 2014/15 • FINANCIAL STATEMENT
CHAPTER 4 STRATEGIC INVESTMENTS AND DIVESTMENTS
4.1 INTANGIBLE ASSETS2015 Software Other Total
and IT Trademark Key intangible intangibleDKK million Goodwill systems rights money assets assets
Cost at 1 July 2014 199 260 8 40 5 512 Addition - 26 - 15 1 42 Disposal - (168) (8) (6) (4) (186)
Cost at 30 June 2015 199 118 - 49 2 368
Accumulated amortization and impairment losses at 1 July 2014 - (233) (8) (28) - (269)Foreign currency translation adjustments - 3 - - - 3Amortization and impairment on disposals - 168 8 3 - 179 Amortization for the year - (12) - (2) - (14)Previous amortization and impairment reversed - - - 4 - 4
Accumulated amortization and impairment losses at 30 June 2015 - (74) - (23) - (97)
Carrying amount at 30 June 2015 199 44 - 26 2 271
2014 Software Other Total and IT Trademark Key intangible intangible
DKK million Goodwill systems rights money assets assets
Cost at 1 July 2013 206 258 8 93 - 565 Foreign currency translation adjustments (7) - - (1) - (8)Addition - 11 - 6 5 22 Disposal - (9) - (58) - (67)
Cost at 30 June 2014 199 260 8 40 5 512
Accumulated amortization and impairment losses at 1 July 2013 - (221) (8) (78) - (307)Foreign currency translation adjustments - - - 1 - 1 Amortization and impairment on disposals - 7 - 55 - 62 Amortization for the year - (19) - (1) - (20)Impairment for the year - - - (5) - (5)
Accumulated amortization and impairment losses at 30 June 2014 - (233) (8) (28) - (269)
Carrying amount at 30 June 2014 199 27 - 12 5 243
FINANCIAL KEY RATIOS
This chapter includes operating assets constituting the basis of the Group’s business as well as divestments and discontinued operations. In 2014, IC Group divested the Mid Market division as part of its strategy to focus on the Premium market only.
RETURN ON INVESTED CAPITAL
31%At the same level
as last year.
INVESTED CAPITAL
DKK 659mCorresponding to a decrease
of DKK 50 million compared to 30 June 2014.
TOTAL INVESTMENTS
DKK 87mInvestments corresponding to
3% of revenue.

RE
SU
LTA
CC
OU
NTS
GO
VE
RN
AN
CE
STR
ATE
GY
OV
ER
VIE
W
53FINANCIAL STATEMENT • ANNUAL REPORT 2014/15 • IC GROUP A/S
Goodwill distributionGoodwill arisen from business combinations is distributed – on the date of take-over – to the cash-generating units that are expected
to benefit financially from the take-over. The carrying amount of goodwill was distributed on the cash-generating units as follows:
DKK million 2015 2014
Tiger of Sweden AB 84 84 Peak Performance AB 51 51 Saint Tropez A/S 37 37 IC Group Norway AS – the Peak Performance activity of the business (Premium Outdoor) 27 27
Carrying amount of goodwill 199 199
ACCOUNTING POLICIES GoodwillOn initial recognition, goodwill is measured and recognized as set out in “Business combinations” (chapter 1). Subsequently, goodwill is measured at cost less accumulated impairment losses. Goodwill is not amortized, but tested at least once a year for impairment. The carrying amount of goodwill is allocated to the Group’s cash-generating units at the date of take-over. The determina-tion of cash-generating units is based on the management structure and on internal financial management.
Key moneyPayments to take over leases (“key money”) are classified as leasehold rights. Leasehold rights are amortized over the lease period or the useful life if this is shorter. The basis of amortiza-tion is reduced by any write-downs. Leasehold rights with an indeterminable useful life are not amortized, but tested for impairment annually.
Software and ITSoftware and IT development are amortized over the useful life of 3-7 years. Cost includes the acquisition price as well as costs arising directly from the acquisition and until the date on which the asset is ready for use. Amortization is provided on a straight-line basis over the expected useful life of the asset.
ACCOUNTING ESTIMATESImpairment test The recoverable amount of the individual cash-generating units to which the goodwill amounts have been allocated are calcu-lated based on the units’ present value, i.e. discounting back of any expected, future cash flows, compared with the carrying amounts. Future cash flows are based on business plans and budgets of the entities during the strategy period for 2014/15-2018/19. The most important parameters in the calculation of the net present value are revenue, EBITDA, invetments in working capital as well as the applied discount rate. The busi-ness plans are based on Management’s specific assessment of the business units’ expected performance during the strategy period. When calculating the net present value, a discount rate of 10.50% before tax or 8.19% after tax was applied. Compared to 2013/14, this changed from 13.78% before tax and 10.40%
after tax due to an adjustment of the Group’s risk premium. The growth rate applied is 0% (0%). An impairment test of the carrying amount of goodwill was conducted at 30 June 2015. In general, goodwill amounts are not important in terms of expected earnings and cash-flows, for which reason the Group assessed that impairment of goodwill was required neither in 2014/15 nor in 2013/14.
Key money Impairment tests were conducted at 30 June 2015, and Man-agement resolved that last year’s write-downs of DKK 4 million be reversed since the recoverable amount exceeded the total carrying amount. For the financial year 2014/15, total write-downs of leasehold rights constituted DKK 0 million (DKK 5 milion).
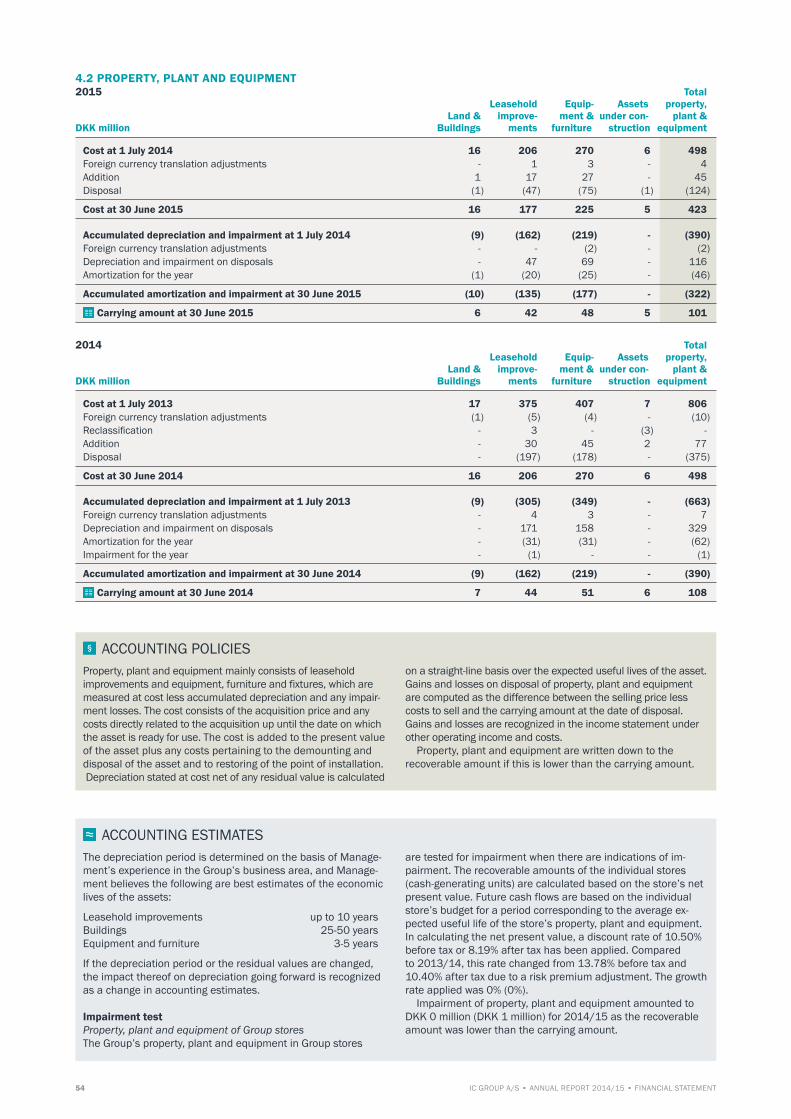
54 IC GROUP A/S • ANNUAL REPORT 2014/15 • FINANCIAL STATEMENT
4.2 PROPERTY, PLANT AND EQUIPMENT2015 Total Leasehold Equip- Assets property,
Land & improve- ment & under con- plant & DKK million Buildings ments furniture struction equipment
Cost at 1 July 2014 16 206 270 6 498 Foreign currency translation adjustments - 1 3 - 4Addition 1 17 27 - 45 Disposal (1) (47) (75) (1) (124)
Cost at 30 June 2015 16 177 225 5 423
Accumulated depreciation and impairment at 1 July 2014 (9) (162) (219) - (390)Foreign currency translation adjustments - - (2) - (2)Depreciation and impairment on disposals - 47 69 - 116 Amortization for the year (1) (20) (25) - (46)
Accumulated amortization and impairment at 30 June 2015 (10) (135) (177) - (322)
Carrying amount at 30 June 2015 6 42 48 5 101
2014 Total Leasehold Equip- Assets property,
Land & improve- ment & under con- plant & DKK million Buildings ments furniture struction equipment
Cost at 1 July 2013 17 375 407 7 806 Foreign currency translation adjustments (1) (5) (4) - (10)Reclassification - 3 - (3) - Addition - 30 45 2 77 Disposal - (197) (178) - (375)
Cost at 30 June 2014 16 206 270 6 498
Accumulated depreciation and impairment at 1 July 2013 (9) (305) (349) - (663)Foreign currency translation adjustments - 4 3 - 7 Depreciation and impairment on disposals - 171 158 - 329 Amortization for the year - (31) (31) - (62)Impairment for the year - (1) - - (1)
Accumulated amortization and impairment at 30 June 2014 (9) (162) (219) - (390)
Carrying amount at 30 June 2014 7 44 51 6 108
ACCOUNTING POLICIES Property, plant and equipment mainly consists of leasehold improvements and equipment, furniture and fixtures, which are measured at cost less accumulated depreciation and any impair-ment losses. The cost consists of the acquisition price and any costs directly related to the acquisition up until the date on which the asset is ready for use. The cost is added to the present value of the asset plus any costs pertaining to the demounting and disposal of the asset and to restoring of the point of installation. Depreciation stated at cost net of any residual value is calculated
on a straight-line basis over the expected useful lives of the asset. Gains and losses on disposal of property, plant and equipment are computed as the difference between the selling price less costs to sell and the carrying amount at the date of disposal. Gains and losses are recognized in the income statement under other operating income and costs. Property, plant and equipment are written down to the recoverable amount if this is lower than the carrying amount.
ACCOUNTING ESTIMATESThe depreciation period is determined on the basis of Manage-ment’s experience in the Group’s business area, and Manage-ment believes the following are best estimates of the economic lives of the assets:
Leasehold improvements up to 10 years Buildings 25-50 years Equipment and furniture 3-5 years
If the depreciation period or the residual values are changed, the impact thereof on depreciation going forward is recognized as a change in accounting estimates.
Impairment test Property,plantandequipmentofGroupstoresThe Group’s property, plant and equipment in Group stores
are tested for impairment when there are indications of im-pairment. The recoverable amounts of the individual stores (cash-generating units) are calculated based on the store’s net present value. Future cash flows are based on the individual store’s budget for a period corresponding to the average ex-pected useful life of the store’s property, plant and equipment. In calculating the net present value, a discount rate of 10.50% before tax or 8.19% after tax has been applied. Compared to 2013/14, this rate changed from 13.78% before tax and 10.40% after tax due to a risk premium adjustment. The growth rate applied was 0% (0%). Impairment of property, plant and equipment amounted to DKK 0 million (DKK 1 million) for 2014/15 as the recoverable amount was lower than the carrying amount.
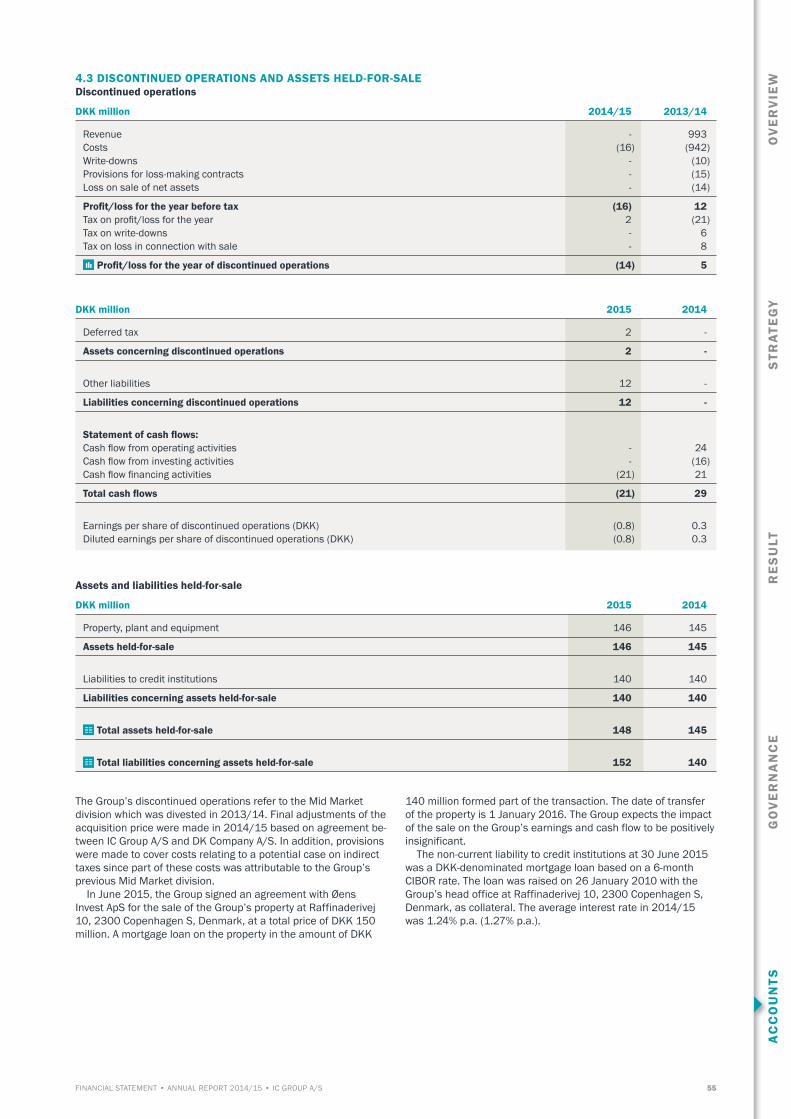
RE
SU
LTA
CC
OU
NTS
GO
VE
RN
AN
CE
STR
ATE
GY
OV
ER
VIE
W
55FINANCIAL STATEMENT • ANNUAL REPORT 2014/15 • IC GROUP A/S
4.3 DISCONTINUED OPERATIONS AND ASSETS HELD-FOR-SALE Discontinued operations
DKK million 2014/15 2013/14
Revenue - 993 Costs (16) (942)Write-downs - (10)Provisions for loss-making contracts - (15)Loss on sale of net assets - (14)
Profit/loss for the year before tax (16) 12 Tax on profit/loss for the year 2 (21)Tax on write-downs - 6 Tax on loss in connection with sale - 8
Profit/loss for the year of discontinued operations (14) 5
DKK million 2015 2014
Deferred tax 2 -
Assets concerning discontinued operations 2 -
Other liabilities 12 -
Liabilities concerning discontinued operations 12 -
Statement of cash flows: Cash flow from operating activities - 24 Cash flow from investing activities - (16)Cash flow financing activities (21) 21
Total cash flows (21) 29
Earnings per share of discontinued operations (DKK) (0.8) 0.3 Diluted earnings per share of discontinued operations (DKK) (0.8) 0.3
Assets and liabilities held-for-sale
DKK million 2015 2014
Property, plant and equipment 146 145
Assets held-for-sale 146 145
Liabilities to credit institutions 140 140
Liabilities concerning assets held-for-sale 140 140
Total assets held-for-sale 148 145
Total liabilities concerning assets held-for-sale 152 140
The Group’s discontinued operations refer to the Mid Market division which was divested in 2013/14. Final adjustments of the acquisition price were made in 2014/15 based on agreement be-tween IC Group A/S and DK Company A/S. In addition, provisions were made to cover costs relating to a potential case on indirect taxes since part of these costs was attributable to the Group’s previous Mid Market division. In June 2015, the Group signed an agreement with Øens Invest ApS for the sale of the Group’s property at Raffinaderivej 10, 2300 Copenhagen S, Denmark, at a total price of DKK 150 million. A mortgage loan on the property in the amount of DKK
140 million formed part of the transaction. The date of transfer of the property is 1 January 2016. The Group expects the impact of the sale on the Group’s earnings and cash flow to be positively insignificant. The non-current liability to credit institutions at 30 June 2015 was a DKK-denominated mortgage loan based on a 6-month CIBOR rate. The loan was raised on 26 January 2010 with the Group’s head office at Raffinaderivej 10, 2300 Copenhagen S, Denmark, as collateral. The average interest rate in 2014/15 was 1.24% p.a. (1.27% p.a.).

56 IC GROUP A/S • ANNUAL REPORT 2014/15 • FINANCIAL STATEMENT
ACCOUNTING POLICIES Discontinued operations are major brands or geographical areas which have been divested or which are held-for-sale according to an overall plan. The results of discontinued operations are presented as sep-arate items in the income statement consisting of the operating profit/loss after tax of the relevant operation and any gains or losses on fair value adjustment or sale of the assets relating thereto. Cash flow from discontinued operations has been included in the consolidated statement of cash flows under cash flows from operating, investing and financing activities and has been specified in the notes. Non-current assets and groups of assets held-for-sale, includ-ing assets relating to discontinued operations, are presented as separate items in the statement of financial position under
current assets. Liabilities directly relating to the relevant as-sets and discontinued operations are presented under current liabilities in the statement of financial position. Assets are clas-sified as held-for-sale if their carrying amounts will be primarily recovered through a sale transaction within 12 months according to a formal plan, rather than through continued use. Impairment losses arising at the initial classification of held-for-sale as well as any subsequent gains or losses measured at the lower of the carrying amount or the fair value less costs to sell are recognized in the income statement under the relevant items. Information on gains and losses is provided in the notes. Non-current assets held-for-sale are not depreciated or amor-tized, but are written down to fair value less expected costs to sell where this is lower than the carrying amount. Comparative figures in the statement of financial position are not adjusted.
4.4 INVESTMENTS IN ASSOCIATES
DKK million 2015 2014
Cost at 1 July 111 - Addition - 111
Cost at 30 June 111 111
Adjustments at 1 July - - Share of comprehensive income 2 - Share of profit for the year 2 -
Adjustments at 30 June 4 -
Carrying amount at 30 June 115 111
The investment relates to DK Company A/S (DK0010302488) having its registered office in Ikast, Denmark. The ownership interest was acquired in connection with the divestment of the
Mid Market division in 2013/14. DK Company A/S’ financial year runs from 1 January until 31 December.
DKK million 2014/15 2013/14
DK Company A/SProfit and lossRevenue 2,156 1,582 Profit for the year 24 42 Other comprehensive income 20 (1)Total comprehensive income 44 41
Financial position Non-current assets 1,253 1,262 Current assets 554 473 Non-current liabilities 161 12 Current liabilities 509 623 Equity 1,137 1,100
The financial information stated above is based on estimates and includes purchase price allocation. Goodwill amounts to DKK 71 million. Purchase price allocation was completed in the financial year, leading to a cost of DKK 4 million recognized as discontinued operations.
See note 4.3 discontinued operations and assets classified as held-for-sale.

RE
SU
LTA
CC
OU
NTS
GO
VE
RN
AN
CE
STR
ATE
GY
OV
ER
VIE
W
57FINANCIAL STATEMENT • ANNUAL REPORT 2014/15 • IC GROUP A/S
DKK million 2015 2014
Reconciliation of carrying amount IC Group’s share of DK Company A/S’ equity 20 12 Goodwill concerning DK Company A/S 71 71 Other intangible assets 24 28
Carrying amount at 30 June 115 111
ACCOUNTING POLICIES Investments in associates are recognized and measured in the consolidated financial statements in accordance with the equity method.This means that the investments are measured at the proportionate share of the entities’ equity value less or plus the proportionate intercompany gains and losses and plus the carrying amount of goodwill.
Investments in associates with a negative equity value are measured at DKK nil. Acquisitions of investments in associates are accounted for using the acquisition method.
ACCOUNTING ESTIMATESIC Group received 10.11% shares in DK Company A/S as part of its consideration for the sale of the Mid Market division to DK Company A/S. Management believes that considering the circumstances of the shareholding and the underlying owner-ship agreement, the influence of IC Group A/S is consider-able and that the shares should therefore be recognized as investments in associates according to the IFRS consolidation package.
Since DK Company A/S is listed on NASDAQ OMX First North, but has only a limited number of shares in circulation and a very low daily trading volume, Management does not believe the share price represents the market value of the shares. Management has therefore resolved to use multiples based on a peer group of companies to test whether write-down of investments in associates is required. No write-downs were made at 30 June 2015.
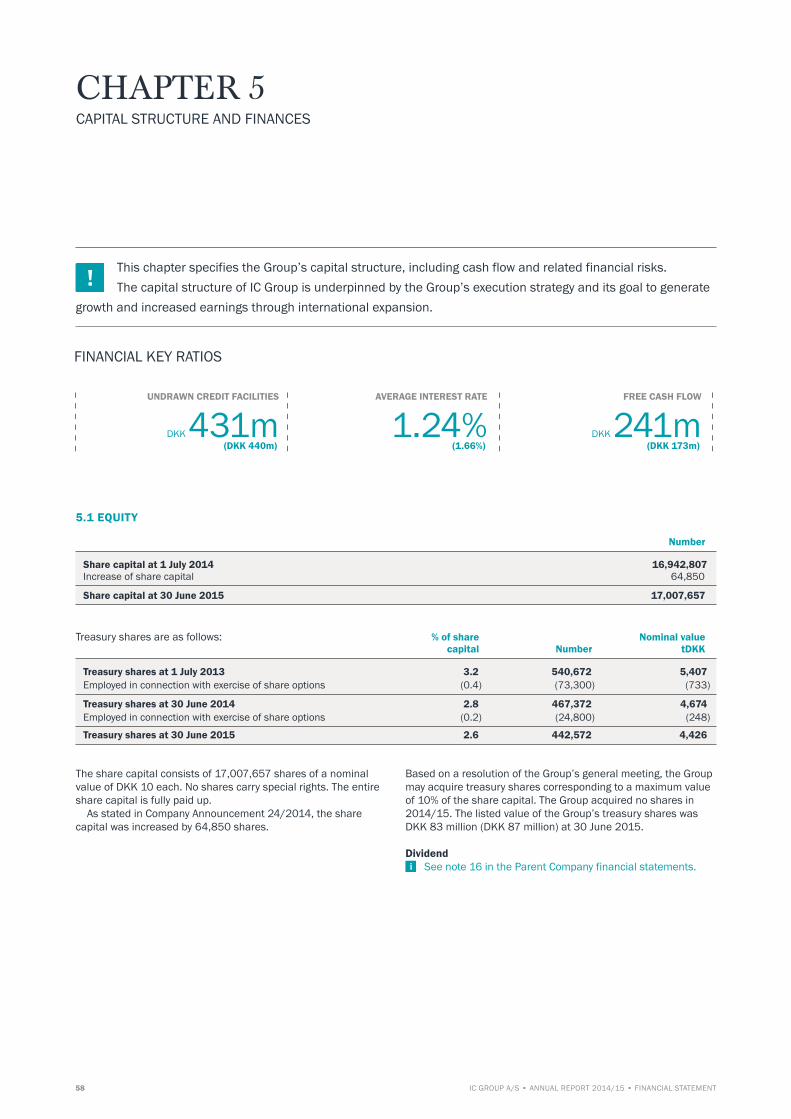
58 IC GROUP A/S • ANNUAL REPORT 2014/15 • FINANCIAL STATEMENT
CHAPTER 5 CAPITAL STRUCTURE AND FINANCES
5.1 EQUITY Number
Share capital at 1 July 2014 16,942,807Increase of share capital 64,850
Share capital at 30 June 2015 17,007,657
Treasury shares are as follows: % of share Nominal value
capital Number tDKK
Treasury shares at 1 July 2013 3.2 540,672 5,407 Employed in connection with exercise of share options (0.4) (73,300) (733)
Treasury shares at 30 June 2014 2.8 467,372 4,674 Employed in connection with exercise of share options (0.2) (24,800) (248)
Treasury shares at 30 June 2015 2.6 442,572 4,426
The share capital consists of 17,007,657 shares of a nominal value of DKK 10 each. No shares carry special rights. The entire share capital is fully paid up. As stated in Company Announcement 24/2014, the share capital was increased by 64,850 shares.
Based on a resolution of the Group’s general meeting, the Group may acquire treasury shares corresponding to a maximum value of 10% of the share capital. The Group acquired no shares in 2014/15. The listed value of the Group’s treasury shares was DKK 83 million (DKK 87 million) at 30 June 2015. Dividend
See note 16 in the Parent Company financial statements.
UNDRAWN CREDIT FACILITIES
DKK 431m (DKK 440m)
AVERAGE INTEREST RATE
1.24% (1.66%)
FREE CASH FLOW
DKK 241m (DKK 173m)
FINANCIAL KEY RATIOS
This chapter specifies the Group’s capital structure, including cash flow and related financial risks. The capital structure of IC Group is underpinned by the Group’s execution strategy and its goal to generate growth and increased earnings through international expansion.
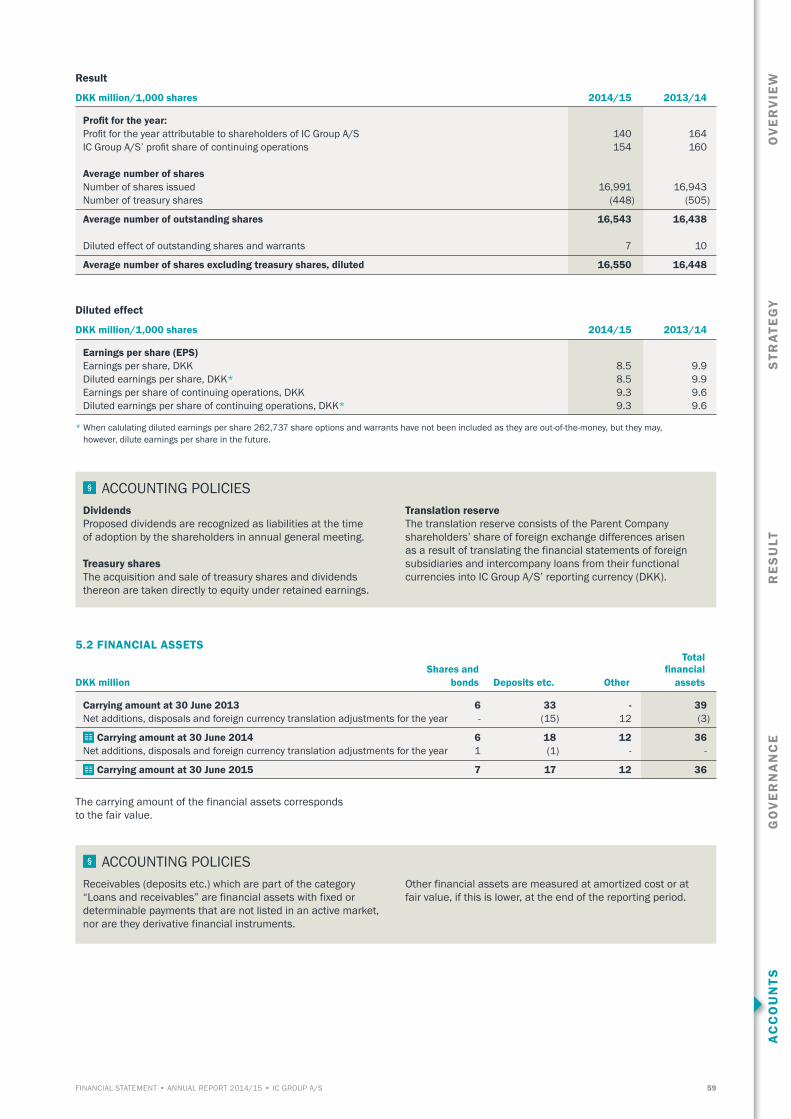
RE
SU
LTA
CC
OU
NTS
GO
VE
RN
AN
CE
STR
ATE
GY
OV
ER
VIE
W
59FINANCIAL STATEMENT • ANNUAL REPORT 2014/15 • IC GROUP A/S
Result
DKK million/1,000 shares 2014/15 2013/14
Profit for the year:Profit for the year attributable to shareholders of IC Group A/S 140 164 IC Group A/S’ profit share of continuing operations 154 160
Average number of shares Number of shares issued 16,991 16,943 Number of treasury shares (448) (505)
Average number of outstanding shares 16,543 16,438
Diluted effect of outstanding shares and warrants 7 10
Average number of shares excluding treasury shares, diluted 16,550 16,448
Diluted effect
DKK million/1,000 shares 2014/15 2013/14
Earnings per share (EPS)Earnings per share, DKK 8.5 9.9 Diluted earnings per share, DKK* 8.5 9.9 Earnings per share of continuing operations, DKK 9.3 9.6 Diluted earnings per share of continuing operations, DKK* 9.3 9.6
* When calulating diluted earnings per share 262,737 share options and warrants have not been included as they are out-of-the-money, but they may, however, dilute earnings per share in the future.
ACCOUNTING POLICIES DividendsProposed dividends are recognized as liabilities at the time of adoption by the shareholders in annual general meeting.
Treasury sharesThe acquisition and sale of treasury shares and dividends thereon are taken directly to equity under retained earnings.
Translation reserveThe translation reserve consists of the Parent Company shareholders’ share of foreign exchange differences arisen as a result of translating the financial statements of foreign subsidiaries and intercompany loans from their functional currencies into IC Group A/S’ reporting currency (DKK).
5.2 FINANCIAL ASSETS Total Shares and financial
DKK million bonds Deposits etc. Other assets
Carrying amount at 30 June 2013 6 33 - 39 Net additions, disposals and foreign currency translation adjustments for the year - (15) 12 (3)
Carrying amount at 30 June 2014 6 18 12 36 Net additions, disposals and foreign currency translation adjustments for the year 1 (1) - -
Carrying amount at 30 June 2015 7 17 12 36
The carrying amount of the financial assets corresponds to the fair value.
ACCOUNTING POLICIES Receivables (deposits etc.) which are part of the category “Loans and receivables” are financial assets with fixed or determinable payments that are not listed in an active market, nor are they derivative financial instruments.
Other financial assets are measured at amortized cost or at fair value, if this is lower, at the end of the reporting period.
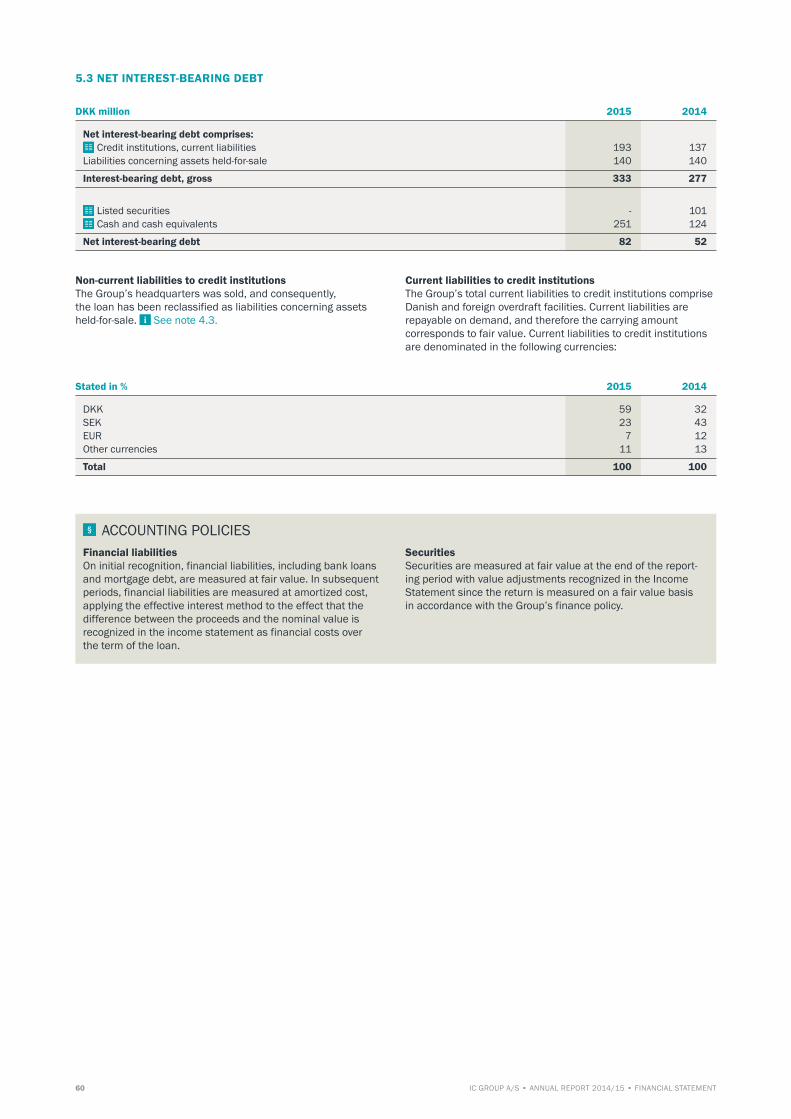
60 IC GROUP A/S • ANNUAL REPORT 2014/15 • FINANCIAL STATEMENT
5.3 NET INTEREST-BEARING DEBT
DKK million 2015 2014
Net interest-bearing debt comprises: Credit institutions, current liabilities 193 137
Liabilities concerning assets held-for-sale 140 140
Interest-bearing debt, gross 333 277
Listed securities - 101 Cash and cash equivalents 251 124
Net interest-bearing debt 82 52
Non-current liabilities to credit institutionsThe Group’s headquarters was sold, and consequently, the loan has been reclassified as liabilities concerning assets held-for-sale. See note 4.3.
Current liabilities to credit institutions The Group’s total current liabilities to credit institutions comprise Danish and foreign overdraft facilities. Current liabilities are repayable on demand, and therefore the carrying amount corresponds to fair value. Current liabilities to credit institutions are denominated in the following currencies:
Stated in % 2015 2014
DKK 59 32 SEK 23 43 EUR 7 12 Other currencies 11 13
Total 100 100
ACCOUNTING POLICIES Financial liabilitiesOn initial recognition, financial liabilities, including bank loans and mortgage debt, are measured at fair value. In subsequent periods, financial liabilities are measured at amortized cost, applying the effective interest method to the effect that the difference between the proceeds and the nominal value is recognized in the income statement as financial costs over the term of the loan.
SecuritiesSecurities are measured at fair value at the end of the report-ing period with value adjustments recognized in the IncomeStatement since the return is measured on a fair value basis in accordance with the Group’s finance policy.

RE
SU
LTA
CC
OU
NTS
GO
VE
RN
AN
CE
STR
ATE
GY
OV
ER
VIE
W
61FINANCIAL STATEMENT • ANNUAL REPORT 2014/15 • IC GROUP A/S
5.4 FINANCIAL RISKS AND DERIVATIVE FINANCIAL INSTRUMENTS
Foreign exchange riskThe Group’s foreign exchange risk (transaction risk) is handled centrally by the Group’s Finance Department. The Parent Com-pany’s functional currency is DKK, and foreign exchange posi-tions are generally hedged vis-à-vis DKK. The Group’s subsidiar-ies are not exposed to any significant currency risk. The Group’s primary transaction risk relates to the buying and selling of goods in foreign currencies. The major part of Group sourcing is made in the Far East in HKD, USD and USD-related currencies, while income and capacity costs are primarily in DKK, SEK, NOK, EUR and other European currencies. Consequently, hedging of foreign exchange risk is only limited. Hedge accounting and hedging of operational risks take place by means of forward contracts and/or options. Generally, hedging is based on a 15-month horizon. The Group’s EUR currency risk primarily relating to current EUR
securities is considered to be insignificant since the Danish Krone is pegged to the Euro. Other foreign currency positions are hedged at 30 June 2015. Hedging of the Group’s transaction exposure is made based on an overall estimate of the cash flow demand for the future 15 months. As a general rule, the Group’s cash flows in all major currencies are hedged except for EUR. Foreign exchange contracts relate exclusively to hedging of selling and buying of goods pursuant to the Group’s policy thereon. Hedging of the Group’s transaction exposure is made based on an overall estimate of the cash flow demand for the future 15 months. At 30 June 2015, the Group’s risks for the coming 0-15 months can be specified as follows:
Net Average At 30 june 2015 Expected Expected Hedges Hedges Hedges Net position hedgingDKK million inflow outflow 0-6 m. 7-12 m. 13-15 m. position DKK rate
EUR 75 (46) - - - 29 218 - USD 5 (122) 57 38 22 - - 605 HKD - (237) 111 84 44 - - 79 SEK 594 (8) (275) (221) (90) - - 80 NOK 368 (3) (167) (150) (48) - - 86 GBP 6 - (3) (3) (1) - - 955 CHF 15 - (8) (5) (2) - - 652 CAD 8 - (4) (4) (1) - - 519
Net Average
At 30 june 2014 Expected Expected Hedges Hedges Hedges Net position hedgingDKK million inflow outflow 0-6 m. 7-12 m. 13-15 m. position DKK rate
EUR 88 (59) - - - 29 217 - USD 6 (92) 26 41 19 - - 549 HKD - (186) 116 51 19 - - 72 SEK 464 (15) (206) (170) (73) - - 84 NOK 303 (4) (133) (122) (44) - - 90 GBP 8 (1) (3) (3) (1) - - 884 CHF 15 - (7) (5) (3) - - 608 CAD 11 - (6) (4) (1) - - 515
Hedge accounting of cash flowsNet outstanding foreign exchange contracts at 30 June 2015 for
the Group and the Parent Company designated and qualifying as hedge accounting of cash flow are as follows:
2015 2014 Fair value Fair value adjustment adjustments recognized recognized in statement in statement of other of other Notial compr. Maturity Notial compr. MaturityDKK million principal* income in months principal* Iincome in months
HKD 200 56 0-15 86 (4) 0-15 USD 107 11 0-15 186 (2) 0-15 SEK (586) (5) 0-15 (449) 11 0-15 NOK (365) 7 0-15 (299) 7 0-15 Other (29) (18) 0-15 - (4) 0-15
Total at 30 June 51 8
* Positive principal amounts on foreign exchange contracts indicate a purchase of the currency in question. Negative principal amounts indicate a sale.
Costs of DKK 0.6 million relating to ineffective cash flow hedges have been recognized in the income statement for 2014/15
(income DKK 0.2 million). Ineffective cash flow hedges are recognized in the income statement under financial items.

62 IC GROUP A/S • ANNUAL REPORT 2014/15 • FINANCIAL STATEMENT
Currency hedges of recognized assets and liabilitiesOpen foreign exchange contracts for the Group and the Parent
Company qualifying as hedges of recognized assets and liabilities are as follows:
2015 2014 Fair value Fair value adjustment adjustment recognized recognized Notial in income Maturity Notial in income MaturityDKK million principal* statement in months principal* statement in months
HKD 37 5 0-15 23 (5) 0-15 USD 10 11 0-15 31 (1) 0-15
Total at 30 June 16 (6)
* Positive principal amounts on foreign exchange contracts indicate a purchase of the currency in question. Negative principal amounts indicate a sale.
Fair value adjustments relating to realized hedge transactions have been recognized in the consolidated income statement under cost of sales. The fair values have been calculated based on current interest rate curves and foreign exchange rates at 30 June 2015. Neither the Group nor the Parent Company had any open foreign exchange contracts that did not qualify for hedge accounting at 30 June 2015 or at 30 June 2014. The recognized positive/negative market values under equity have been treated in accordance with the rules for hedging of future cash flows and are closed/adjusted during the year according to the hedge accounting principles.
The net position of the Group calculated according to the value-at-risk method will as a maximum result in a loss of DKK 0.9 million (DKK 0.4 million).The calculation is made using a 95% confidence interval with a term of 6 months. Value-at-risk states the amount that as a maximum may be lost on a position calculated using his-torical volatilities on the different currencies as well as correlations between the currencies. The existing categories of financial assets and liabilities are as follows:
DKK million 2015 2014
Listed securities - 101 Unlisted shares and bonds recognized under non-current assets (shares) 7 6 Derivative financial instruments (trading portfolio) 12 12
Financial assets at fair value recognized in the income statement 19 119
Derivative financial instruments for hedging of recognized assets and liabilities recognized under current assets (other receivables) 16 - Derivative financial instruments for hedging of future cash flows, recognized under current assets (other receivables) 74 18
Financial assets for hedging purposes 90 18
Deposits (financial assets) 17 18 Trade receivables 300 312 Other receivables 36 72 Cash and cash equivalents 251 124
Loans and receivables 604 526
Total financial assets 713 663
Liabilities to credit institutions (current liabilities) 193 137 Trade payables 274 290 Share of other liabilities recognized at amortized cost (non-current liabilities) - 17 Share of other liabilities recognized at amortized cost (current liabilities) 220 277
Financial liabilities measured at amortized cost 687 721Derivative financial instruments for hedging of recognized assets and liabilities recognized under current liabilities (other liabilities) - 6 Derivative financial instruments for hedging of future cash flows, recognized under current liabilities (other liabilities) 22 10
Financial liabilities for hedging purposes 23 16
Total financial liabilities 710 737
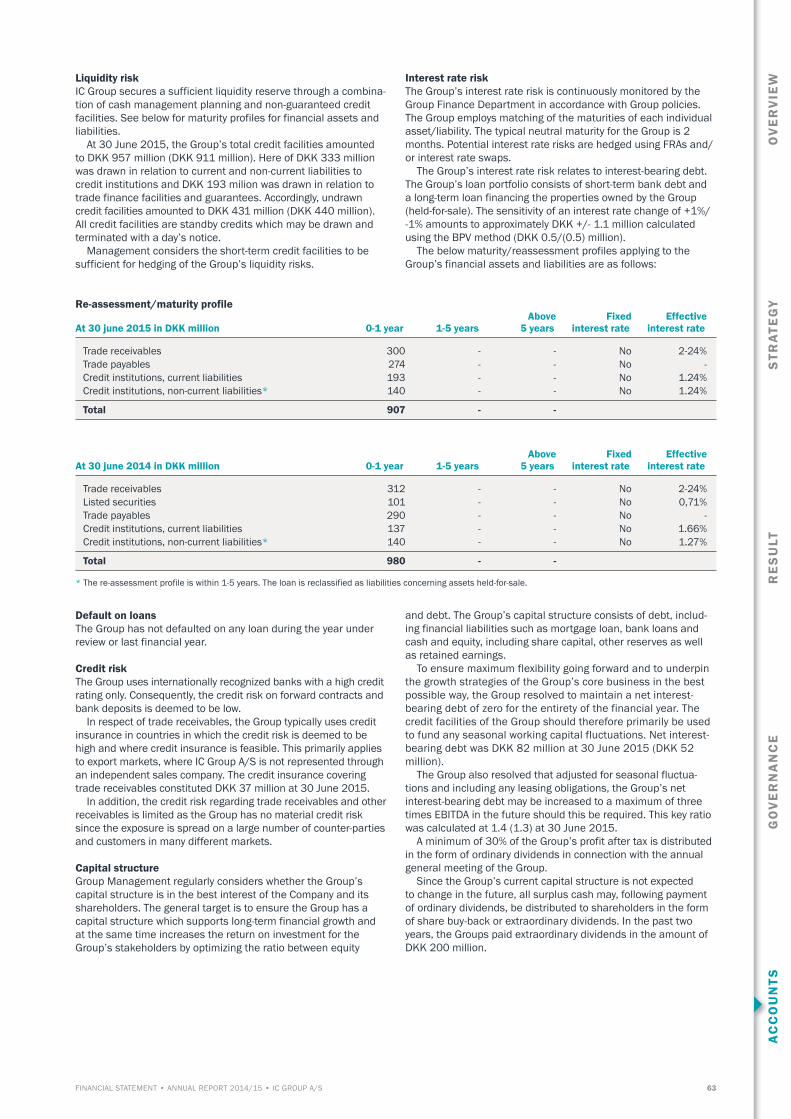
RE
SU
LTA
CC
OU
NTS
GO
VE
RN
AN
CE
STR
ATE
GY
OV
ER
VIE
W
63FINANCIAL STATEMENT • ANNUAL REPORT 2014/15 • IC GROUP A/S
Liquidity risk IC Group secures a sufficient liquidity reserve through a combina-tion of cash management planning and non-guaranteed credit facilities. See below for maturity profiles for financial assets and liabilities. At 30 June 2015, the Group’s total credit facilities amounted to DKK 957 million (DKK 911 million). Here of DKK 333 million was drawn in relation to current and non-current liabilities to credit institutions and DKK 193 milion was drawn in relation to trade finance facilities and guarantees. Accordingly, undrawn credit facilities amounted to DKK 431 million (DKK 440 million). All credit facilities are standby credits which may be drawn and terminated with a day’s notice. Management considers the short-term credit facilities to be sufficient for hedging of the Group’s liquidity risks.
Interest rate riskThe Group’s interest rate risk is continuously monitored by the Group Finance Department in accordance with Group policies. The Group employs matching of the maturities of each individual asset/liability. The typical neutral maturity for the Group is 2 months. Potential interest rate risks are hedged using FRAs and/or interest rate swaps. The Group’s interest rate risk relates to interest-bearing debt. The Group’s loan portfolio consists of short-term bank debt and a long-term loan financing the properties owned by the Group (held-for-sale). The sensitivity of an interest rate change of +1%/ -1% amounts to approximately DKK +/- 1.1 million calculated using the BPV method (DKK 0.5/(0.5) million). The below maturity/reassessment profiles applying to the Group’s financial assets and liabilities are as follows:
Re-assessment/maturity profile Above Fixed Effective
At 30 june 2015 in DKK million 0-1 year 1-5 years 5 years interest rate interest rate
Trade receivables 300 - - No 2-24%Trade payables 274 - - No -Credit institutions, current liabilities 193 - - No 1.24%Credit institutions, non-current liabilities* 140 - - No 1.24%
Total 907 - -
Above Fixed EffectiveAt 30 june 2014 in DKK million 0-1 year 1-5 years 5 years interest rate interest rate
Trade receivables 312 - - No 2-24%Listed securities 101 - - No 0,71%Trade payables 290 - - No -Credit institutions, current liabilities 137 - - No 1.66%Credit institutions, non-current liabilities* 140 - - No 1.27%
Total 980 - -
* The re-assessment profile is within 1-5 years. The loan is reclassified as liabilities concerning assets held-for-sale.
Default on loans The Group has not defaulted on any loan during the year under review or last financial year.
Credit riskThe Group uses internationally recognized banks with a high credit rating only. Consequently, the credit risk on forward contracts and bank deposits is deemed to be low. In respect of trade receivables, the Group typically uses credit insurance in countries in which the credit risk is deemed to be high and where credit insurance is feasible. This primarily applies to export markets, where IC Group A/S is not represented through an independent sales company. The credit insurance covering trade receivables constituted DKK 37 million at 30 June 2015. In addition, the credit risk regarding trade receivables and other receivables is limited as the Group has no material credit risk since the exposure is spread on a large number of counter-parties and customers in many different markets.
Capital structureGroup Management regularly considers whether the Group’s capital structure is in the best interest of the Company and its shareholders. The general target is to ensure the Group has a capital structure which supports long-term financial growth and at the same time increases the return on investment for the Group’s stakeholders by optimizing the ratio between equity
and debt. The Group’s capital structure consists of debt, includ-ing financial liabilities such as mortgage loan, bank loans and cash and equity, including share capital, other reserves as well as retained earnings. To ensure maximum flexibility going forward and to underpin the growth strategies of the Group’s core business in the best possible way, the Group resolved to maintain a net interest-bearing debt of zero for the entirety of the financial year. The credit facilities of the Group should therefore primarily be used to fund any seasonal working capital fluctuations. Net interest-bearing debt was DKK 82 million at 30 June 2015 (DKK 52 million). The Group also resolved that adjusted for seasonal fluctua-tions and including any leasing obligations, the Group’s net interest-bearing debt may be increased to a maximum of three times EBITDA in the future should this be required. This key ratio was calculated at 1.4 (1.3) at 30 June 2015. A minimum of 30% of the Group’s profit after tax is distributed in the form of ordinary dividends in connection with the annual general meeting of the Group. Since the Group’s current capital structure is not expected to change in the future, all surplus cash may, following payment of ordinary dividends, be distributed to shareholders in the form of share buy-back or extraordinary dividends. In the past two years, the Groups paid extraordinary dividends in the amount of DKK 200 million.
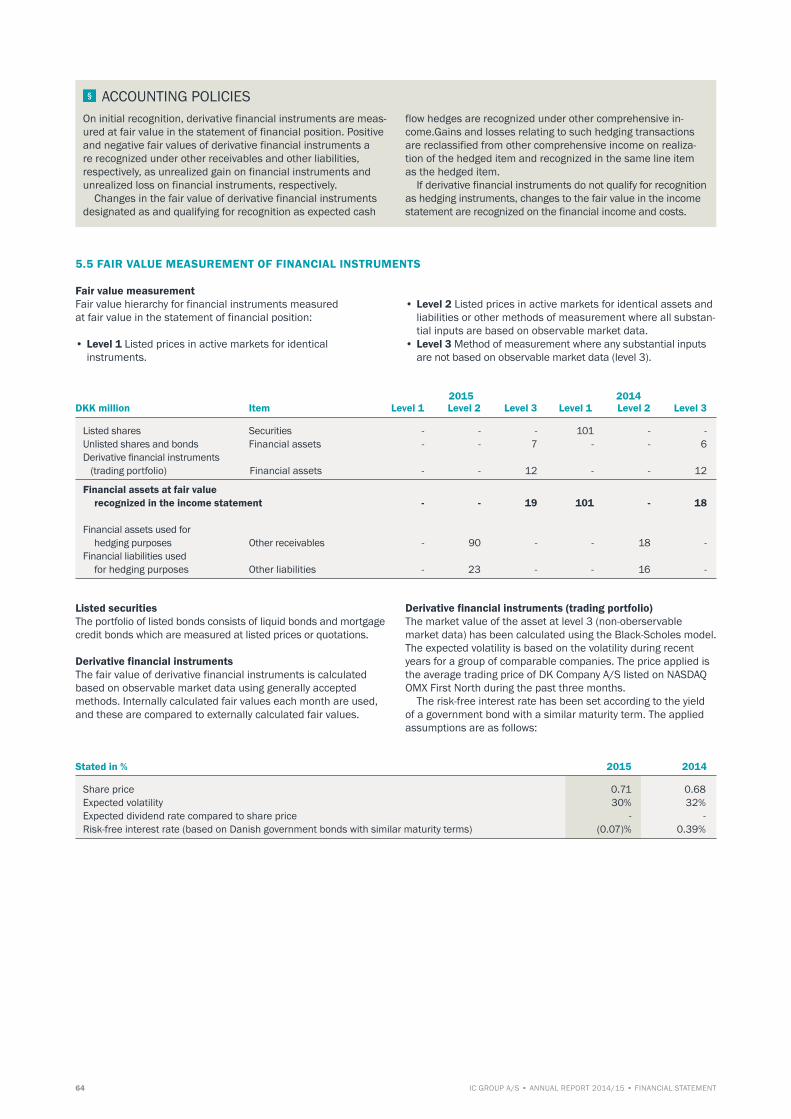
64 IC GROUP A/S • ANNUAL REPORT 2014/15 • FINANCIAL STATEMENT
ACCOUNTING POLICIES On initial recognition, derivative financial instruments are meas-ured at fair value in the statement of financial position. Positive and negative fair values of derivative financial instruments a re recognized under other receivables and other liabilities, respectively, as unrealized gain on financial instruments and unrealized loss on financial instruments, respectively. Changes in the fair value of derivative financial instruments designated as and qualifying for recognition as expected cash
flow hedges are recognized under other comprehensive in-come.Gains and losses relating to such hedging transactions are reclassified from other comprehensive income on realiza-tion of the hedged item and recognized in the same line item as the hedged item. If derivative financial instruments do not qualify for recognition as hedging instruments, changes to the fair value in the income statement are recognized on the financial income and costs.
5.5 FAIR VALUE MEASUREMENT OF FINANCIAL INSTRUMENTS
Fair value measurementFair value hierarchy for financial instruments measured at fair value in the statement of financial position:
• Level 1 Listed prices in active markets for identical instruments.
• Level 2 Listed prices in active markets for identical assets and liabilities or other methods of measurement where all substan-tial inputs are based on observable market data.
• Level 3 Method of measurement where any substantial inputs are not based on observable market data (level 3).
2015 2014DKK million Item Level 1 Level 2 Level 3 Level 1 Level 2 Level 3
Listed shares Securities - - - 101 - - Unlisted shares and bonds Financial assets - - 7 - - 6 Derivative financial instruments (trading portfolio) Financial assets - - 12 - - 12
Financial assets at fair value recognized in the income statement - - 19 101 - 18
Financial assets used for hedging purposes Other receivables - 90 - - 18 - Financial liabilities used for hedging purposes Other liabilities - 23 - - 16 -
Listed securitiesThe portfolio of listed bonds consists of liquid bonds and mortgage credit bonds which are measured at listed prices or quotations.
Derivative financial instrumentsThe fair value of derivative financial instruments is calculated based on observable market data using generally accepted methods. Internally calculated fair values each month are used, and these are compared to externally calculated fair values.
Derivative financial instruments (trading portfolio)The market value of the asset at level 3 (non-oberservable market data) has been calculated using the Black-Scholes model.The expected volatility is based on the volatility during recent years for a group of comparable companies. The price applied is the average trading price of DK Company A/S listed on NASDAQ OMX First North during the past three months. The risk-free interest rate has been set according to the yield of a government bond with a similar maturity term. The applied assumptions are as follows:
Stated in % 2015 2014
Share price 0.71 0.68Expected volatility 30% 32%Expected dividend rate compared to share price - -Risk-free interest rate (based on Danish government bonds with similar maturity terms) (0.07)% 0.39%

RE
SU
LTA
CC
OU
NTS
GO
VE
RN
AN
CE
STR
ATE
GY
OV
ER
VIE
W
65FINANCIAL STATEMENT • ANNUAL REPORT 2014/15 • IC GROUP A/S
5.6 FINANCIAL INCOME AND COSTS
DKK million 2014/15 2013/14
Financial income:Interest on bank deposits 2 2 Interest on receivables 2 4
Interest income from financial assets not measured at fair value 4 6 Interest income on securities 1 1 Realized gain on ineffective derivative financial instruments 2 8
Total financial income 7 15
Financial costs: Interest on liabilities to credit institutions (4) (5)Interest on mortgage loans (2) (3)Other interest costs (4) (1)
Interest costs from financial liabilities not measured at fair value (10) (9)Fair value adjustments on securities (1) (1)Realized loss on ineffective derivative financial instruments (3) (7)Net loss on foreign currency translation (1) (3)
Total financial costs (15) (20)
Net financials (8) (5)
ACCOUNTING POLICIES Financial income and costs include interest, realized and unrealized foreign currency translation adjustments, fair value adjustment of derivative financial instruments which do not qualify for hedge accounting and supplements, deductions and allowances relating to payment of tax.
Interest income and costs are accrued based on the principal and the effective rate of interest. The effective rate of interest is the discount rate to be used in discounting expected future payments relating to the financial asset or the financial liability so that the current value thereof corresponds to the carrying amount of the asset or liability, respectively.

66 IC GROUP A/S • ANNUAL REPORT 2014/15 • FINANCIAL STATEMENT
CHAPTER 6 GOVERNANCE
This chapter contains governance-related information, including remuneration to the Executive Board and the Board of Directors and share-based remuneration to employees.
6.1 REMUNERATION TO THE EXECUTIVE BOARD AND THE BOARD OF DIRECTORS Remuneration to the Board of Directors, Executive Board and other executives is as follows:
Board of Executive Other Board of Executive Other Directors Board executives Directors Board executives
DKK ’000 2014/15 2014/15 2014/15 2013/14 2013/14 2013/14
Remuneration to the Board of Directors 2,981 - - 2,325 - -Remuneration to the Audit Committee 390 - - 375 - -Remuneration to the Remuneration Committee 196 - - 185 - -Remuneraton to the Operations Committee 297 - - - - -Salaries and remuneration etc. - 7,939 21,557 - 8,727 19,924 Severance payments - - 2,841 - 6,629 5,100 Bonus payments - 1,333 4,784 - 4,563 7,372 Defined contribution plans - - 1,003 - - 1,891 Share-based payments - 423 58 - 1,101 1,219
I alt 3,864 9,695 30,243 2,885 21,020 35,506
DKK ’000 2014/15 2013/14
Remuneration to the Board of Directors:Henrik Heideby (Chairman) 1,059 650 Niels Martinsen (Deputy Chairman) 752 625 Anders Colding Friis (Deputy Chairman) 649 481 Ole Wengel 616 529 Michael Hauge Sørensen (Joined 24 September 2014) 319 - Annette Brøndholt Sørensen 394 300 Per Bank (resigned 24 September 2014) 75 300
Total 3,864 2,885
Of which remuneration to the Audit Committee is:Henrik Heideby (Chairman) 182 175 Niels Martinsen 104 100 Ole Wengel 104 100
Total 390 375
Of which remuneration to the Remuneration Committee is:Henrik Heideby (Chairman) 38 - Ole Wengel 58 85 Anders Colding Friis 50 50 Niels Martinsen 50 50
Total 196 185
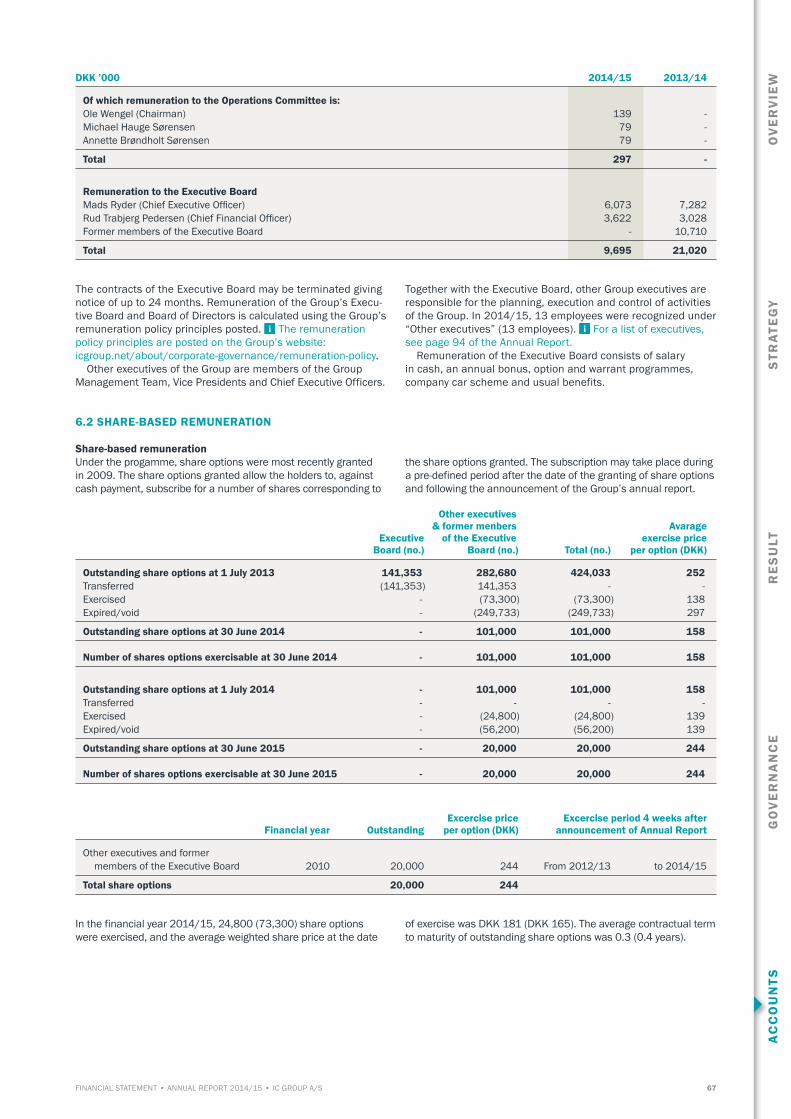
RE
SU
LTA
CC
OU
NTS
GO
VE
RN
AN
CE
STR
ATE
GY
OV
ER
VIE
W
67FINANCIAL STATEMENT • ANNUAL REPORT 2014/15 • IC GROUP A/S
DKK ’000 2014/15 2013/14
Of which remuneration to the Operations Committee is:Ole Wengel (Chairman) 139 - Michael Hauge Sørensen 79 - Annette Brøndholt Sørensen 79 -
Total 297 -
Remuneration to the Executive BoardMads Ryder (Chief Executive Officer) 6,073 7,282 Rud Trabjerg Pedersen (Chief Financial Officer) 3,622 3,028 Former members of the Executive Board - 10,710
Total 9,695 21,020
The contracts of the Executive Board may be terminated giving notice of up to 24 months. Remuneration of the Group’s Execu- tive Board and Board of Directors is calculated using the Group’s remuneration policy principles posted. The remuneration policy principles are posted on the Group’s website: icgroup.net/about/corporate-governance/remuneration-policy. Other executives of the Group are members of the Group Management Team, Vice Presidents and Chief Executive Officers.
Together with the Executive Board, other Group executives are responsible for the planning, execution and control of activities of the Group. In 2014/15, 13 employees were recognized under “Other executives” (13 employees). For a list of executives, see page 94 of the Annual Report. Remuneration of the Executive Board consists of salary in cash, an annual bonus, option and warrant programmes, company car scheme and usual benefits.
6.2 SHARE-BASED REMUNERATION
Share-based remunerationUnder the progamme, share options were most recently granted in 2009. The share options granted allow the holders to, against cash payment, subscribe for a number of shares corres ponding to
the share options granted. The subscription may take place during a pre-defined period after the date of the granting of share options and following the announcement of the Group’s annual report.
Other executives & former menbers Avarage Executive of the Executive exercise price Board (no.) Board (no.) Total (no.) per option (DKK)
Outstanding share options at 1 July 2013 141,353 282,680 424,033 252 Transferred (141,353) 141,353 - - Exercised - (73,300) (73,300) 138 Expired/void - (249,733) (249,733) 297
Outstanding share options at 30 June 2014 - 101,000 101,000 158
Number of shares options exercisable at 30 June 2014 - 101,000 101,000 158
Outstanding share options at 1 July 2014 - 101,000 101,000 158 Transferred - - - - Exercised - (24,800) (24,800) 139 Expired/void - (56,200) (56,200) 139
Outstanding share options at 30 June 2015 - 20,000 20,000 244
Number of shares options exercisable at 30 June 2015 - 20,000 20,000 244
Excercise price Excercise period 4 weeks after Financial year Outstanding per option (DKK) announcement of Annual Report
Other executives and former members of the Executive Board 2010 20,000 244 From 2012/13 to 2014/15
Total share options 20,000 244
In the financial year 2014/15, 24,800 (73,300) share options were exercised, and the average weighted share price at the date
of exercise was DKK 181 (DKK 165). The average contractual term to maturity of outstanding share options was 0.3 (0.4 years).
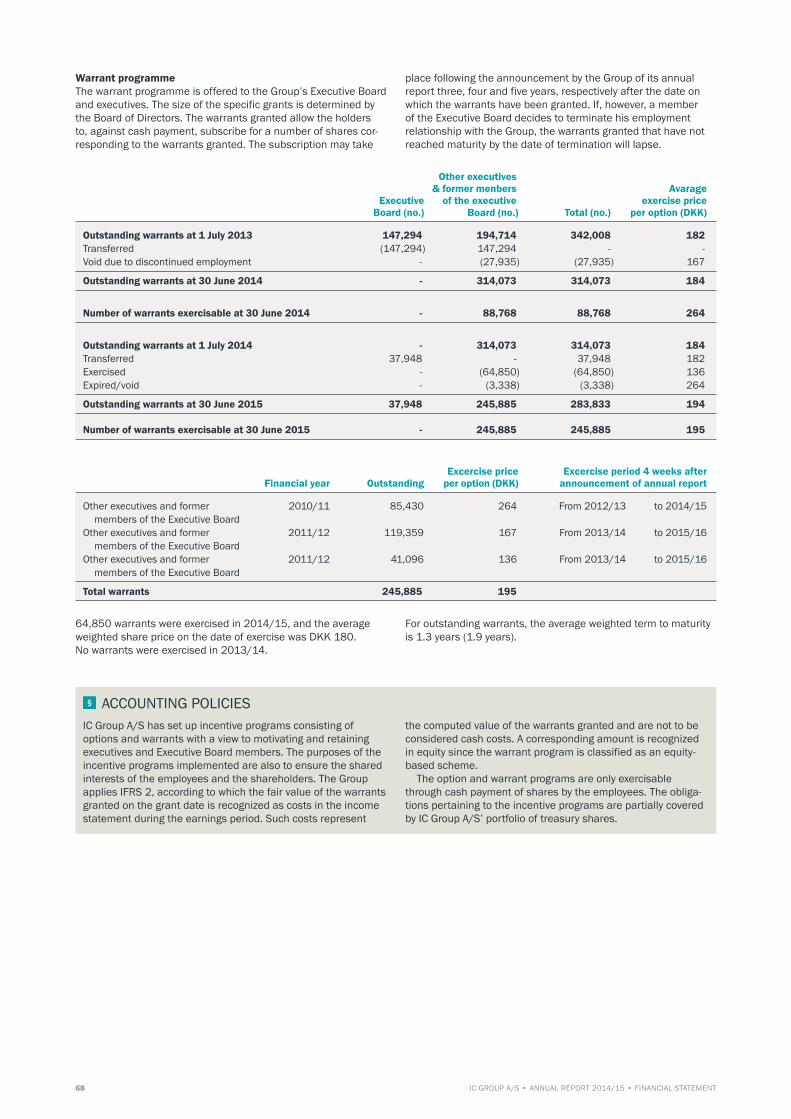
68 IC GROUP A/S • ANNUAL REPORT 2014/15 • FINANCIAL STATEMENT
Warrant programmeThe warrant programme is offered to the Group’s Executive Board and executives. The size of the specific grants is determined by the Board of Directors. The warrants granted allow the holders to, against cash payment, subscribe for a number of shares cor-responding to the warrants granted. The subscription may take
place following the announcement by the Group of its annual report three, four and five years, respectively after the date on which the warrants have been granted. If, however, a member of the Executive Board decides to terminate his employment relationship with the Group, the warrants granted that have not reached maturity by the date of termination will lapse.
Other executives & former menbers Avarage Executive of the executive exercise price Board (no.) Board (no.) Total (no.) per option (DKK)
Outstanding warrants at 1 July 2013 147,294 194,714 342,008 182 Transferred (147,294) 147,294 - - Void due to discontinued employment - (27,935) (27,935) 167
Outstanding warrants at 30 June 2014 - 314,073 314,073 184
Number of warrants exercisable at 30 June 2014 - 88,768 88,768 264
Outstanding warrants at 1 July 2014 - 314,073 314,073 184 Transferred 37,948 - 37,948 182 Exercised - (64,850) (64,850) 136 Expired/void - (3,338) (3,338) 264
Outstanding warrants at 30 June 2015 37,948 245,885 283,833 194
Number of warrants exercisable at 30 June 2015 - 245,885 245,885 195
Excercise price Excercise period 4 weeks after Financial year Outstanding per option (DKK) announcement of annual report
Other executives and former 2010/11 85,430 264 From 2012/13 to 2014/15 members of the Executive BoardOther executives and former 2011/12 119,359 167 From 2013/14 to 2015/16 members of the Executive BoardOther executives and former 2011/12 41,096 136 From 2013/14 to 2015/16 members of the Executive Board
Total warrants 245,885 195
64,850 warrants were exercised in 2014/15, and the average weighted share price on the date of exercise was DKK 180. No warrants were exercised in 2013/14.
For outstanding warrants, the average weighted term to maturity is 1.3 years (1.9 years).
ACCOUNTING POLICIES IC Group A/S has set up incentive programs consisting of options and warrants with a view to motivating and retaining executives and Executive Board members. The purposes of the incentive programs implemented are also to ensure the shared interests of the employees and the shareholders. The Group applies IFRS 2, according to which the fair value of the warrants granted on the grant date is recognized as costs in the income statement during the earnings period. Such costs represent
the computed value of the warrants granted and are not to be considered cash costs. A corresponding amount is recognized in equity since the warrant program is classified as an equity-based scheme. The option and warrant programs are only exercisable through cash payment of shares by the employees. The obliga-tions pertaining to the incentive programs are partially covered by IC Group A/S’ portfolio of treasury shares.

RE
SU
LTA
CC
OU
NTS
GO
VE
RN
AN
CE
STR
ATE
GY
OV
ER
VIE
W
69FINANCIAL STATEMENT • ANNUAL REPORT 2014/15 • IC GROUP A/S
ACCOUNTING ESTIMATESThe market value of IC Group A/S’ options and warrants is cal-culated using the so-called Black-Scholes model for valuation of options. The assumptions applied appear from the table below:
DKK million 2014/15 2013/14
Black-Scholes value 38.95 -Share price 182 -Exercise price 182 -Expected volatility 34% -Expected dividend rate compared to the share price 2.5% -Risk-free interest rate (based on Danish government bonds in respect of maturity) 0.36% -Maturity 4 years -
• The exercise price is determined as the higher of either the closing price of the IC Group A/S share on the grant date or the average closing price on any of the preceding 5 trading days.
• The volatility is calculated based on the daily closing prices during the past three financial years. The calculation term codrresponds to the minimum term to maturity of the warrants granted.
• The expected dividend rate is estimated on the basis of ordinary dividend payment history.
• The risk-free interest rate is determined on the basis of 5-year Danish government bonds.
• Based on previous experience, the date of exercise is assumed to be in the middle of the exercise period, and maturity is therefore assumed to be four years.
The total fair value of the warrants granted was DKK 1.5 million at the grant date. No warrants or options were granted in the financial year 2013/14.
6.3 RELATED PARTIES
IC Group A/S has no related parties with controlling influence. IC Group A/S’ related parties with significant influence include associated companies, their board of directors, executive boards and other executives as well as their related family members. Related parties also comprise companies in which the individuals mentioned above have material interest.
Associated companies IC Group provided transition services to the associated company, DK Company A/S, in 2014/15, of which DKK 34m is recognized in the in the Consolidated Income Statement as “Revenue”, DKK 29m is recognised under “Other operating income” and DKK 0.3m is net receivables.
Board of Directors, Executive Board and other executives In the financial year there were no transactions other than payment of ordinary remuneration See note 6.1.
6.4 FEE TO AUDITORS ELECTED AT THE ANNUAL GENERAL MEETING
DKK million 2014/15 2013/14
Statutory audit 3 3 Tax consultancy - 1 Other services 4 4
Total 7 8

70 IC GROUP A/S • ANNUAL REPORT 2014/15 • FINANCIAL STATEMENT
CHAPTER 7 OTHER NOTES
7.1 RETIREMENT BENEFIT OBLIGATIONS
The Group has used external and independent actuaries for the statement of retirement benefit obligations.
DKK million 2014/15 2013/14
Recognized in profit or loss: Contributions to defined contribution plans 23 27Recognized under defined benefit plans, total 1 1
Total recognized obligations in profit or loss 24 28
The retirement benefit obligations are specified as follows:
DKK million 2015 2014
Present value of defined benefit plans 43 46 Fair value of the assets of the plans (42) (43)
Net retirement benefit obligations 1 3 Other retirement benefit obligations 7 6
Total net retirement benefit obligations 8 9
The development of the present value of defined benefit plans is specified as follows:
DKK million 2015 2014
Retirement benefit obligations at 1 July 46 39 Recognized in profit or loss: Retirement benefit obligations for the year - 1 Calculated interest on obligations - 1 Actuarial gains/losses (other comprehensive income): - Demographic changes recognized in other comprehensive income (5) - - Economic changes recognized in other comprehensive income 2 5
Total recognized obligations regarding defined benefit plans 43 46
In addition, an amount of DKK 7 million (DKK 6 million) attribut-able to retirement benefit obligations in one of the Group compa-nies has been included, hedged by shares and recognized under
financial assets. The retirement benefit obligations are expected to be paid as follows:
DKK million 2015 2014
Retirement benefit assets at 1 July (43) (36)Recognized in profit or loss: Calculated interest on obligations (1) (1)Actuarial gains/losses (other comprehensive income): - Demographic changes recognized in other comprehensive income 3 (6)- Economic changes recognized in other comprehensive income (1) -
Total recognized obligations regarding defined benefit plans (42) (43)
Chapter 7 contains other statutory notes which are considered to be less significant to the general understanding of IC Group’s annual report.
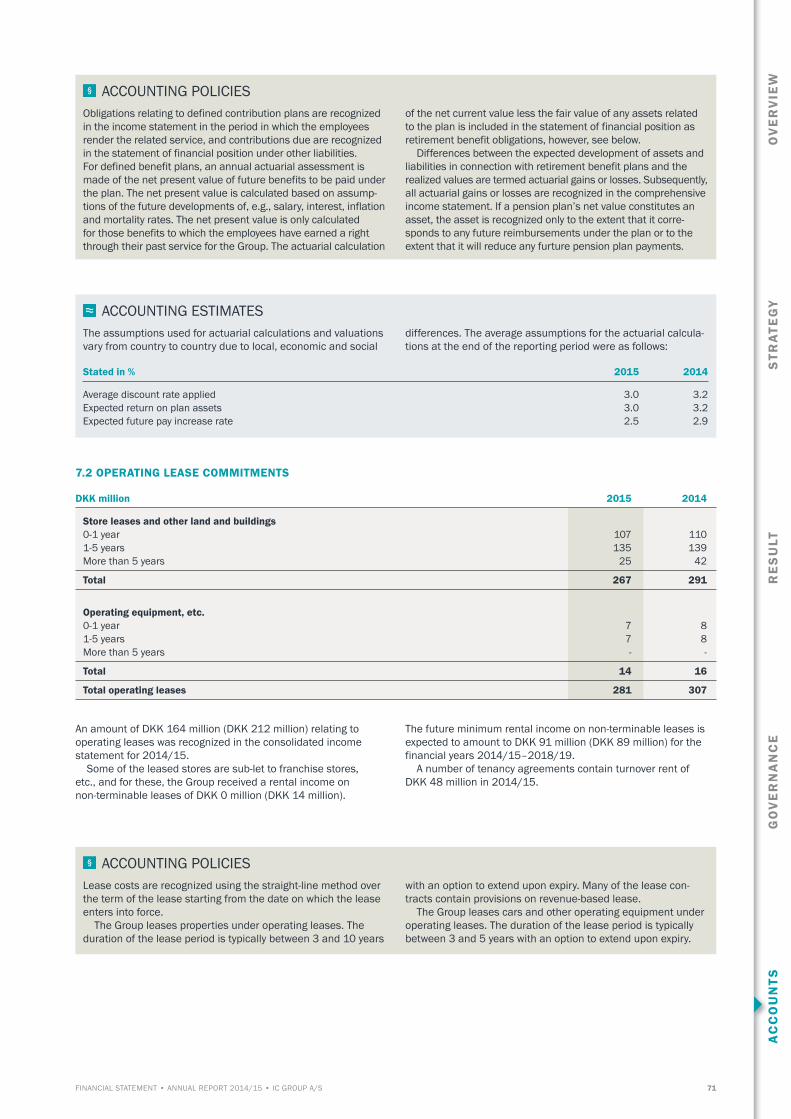
RE
SU
LTA
CC
OU
NTS
GO
VE
RN
AN
CE
STR
ATE
GY
OV
ER
VIE
W
71FINANCIAL STATEMENT • ANNUAL REPORT 2014/15 • IC GROUP A/S
ACCOUNTING POLICIES Obligations relating to defined contribution plans are recognized in the income statement in the period in which the employees render the related service, and contributions due are recognized in the statement of financial position under other liabilities.For defined benefit plans, an annual actuarial assessment is made of the net present value of future benefits to be paid under the plan. The net present value is calculated based on assump-tions of the future developments of, e.g., salary, interest, inflation and mortality rates. The net present value is only calculated for those benefits to which the employees have earned a right through their past service for the Group. The actuarial calculation
of the net current value less the fair value of any assets related to the plan is included in the statement of financial position as retirement benefit obligations, however, see below. Differences between the expected development of assets and liabilities in connection with retirement benefit plans and the realized values are termed actuarial gains or losses. Subsequently, all actuarial gains or losses are recognized in the comprehensive income statement. If a pension plan’s net value constitutes an asset, the asset is recognized only to the extent that it corre-sponds to any future reimbursements under the plan or to the extent that it will reduce any furture pension plan payments.
ACCOUNTING ESTIMATESThe assumptions used for actuarial calculations and valuations vary from country to country due to local, economic and social
differences. The average assumptions for the actuarial calcula-tions at the end of the reporting period were as follows:
Stated in % 2015 2014
Average discount rate applied 3.0 3.2Expected return on plan assets 3.0 3.2Expected future pay increase rate 2.5 2.9
7.2 OPERATING LEASE COMMITMENTS
DKK million 2015 2014
Store leases and other land and buildings 0-1 year 107 1101-5 years 135 139More than 5 years 25 42
Total 267 291
Operating equipment, etc. 0-1 year 7 81-5 years 7 8More than 5 years - -
Total 14 16
Total operating leases 281 307
An amount of DKK 164 million (DKK 212 million) relating to operating leases was recognized in the consolidated income statement for 2014/15. Some of the leased stores are sub-let to franchise stores, etc., and for these, the Group received a rental income on non-terminable leases of DKK 0 million (DKK 14 million).
The future minimum rental income on non-terminable leases is expected to amount to DKK 91 million (DKK 89 million) for the financial years 2014/15–2018/19. A number of tenancy agreements contain turnover rent of DKK 48 million in 2014/15.
ACCOUNTING POLICIES Lease costs are recognized using the straight-line method over the term of the lease starting from the date on which the lease enters into force. The Group leases properties under operating leases. The duration of the lease period is typically between 3 and 10 years
with an option to extend upon expiry. Many of the lease con-tracts contain provisions on revenue-based lease. The Group leases cars and other operating equipment under operating leases. The duration of the lease period is typically between 3 and 5 years with an option to extend upon expiry.
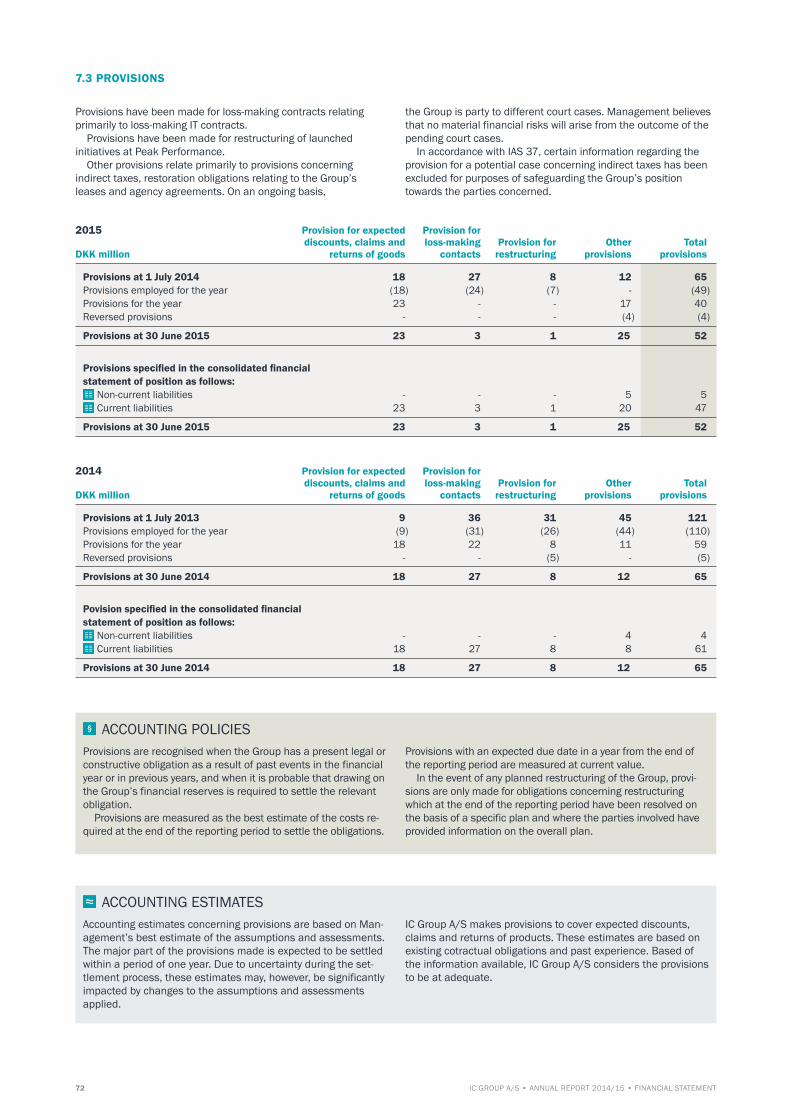
72 IC GROUP A/S • ANNUAL REPORT 2014/15 • FINANCIAL STATEMENT
7.3 PROVISIONS
Provisions have been made for loss-making contracts relating primarily to loss-making IT contracts. Provisions have been made for restructuring of launched initiatives at Peak Performance. Other provisions relate primarily to provisions concerning indirect taxes, restoration obligations relating to the Group’s leases and agency agreements. On an ongoing basis,
the Group is party to different court cases. Management believes that no material financial risks will arise from the outcome of the pending court cases. In accordance with IAS 37, certain information regarding the provision for a potential case concerning indirect taxes has been excluded for purposes of safeguarding the Group’s position towards the parties concerned.
2015 Provision for expected Provision for discounts, claims and loss-making Provision for Other Total
DKK million returns of goods contacts restructuring provisions provisions
Provisions at 1 July 2014 18 27 8 12 65 Provisions employed for the year (18) (24) (7) - (49)Provisions for the year 23 - - 17 40 Reversed provisions - - - (4) (4)
Provisions at 30 June 2015 23 3 1 25 52
Provisions specified in the consolidated financial statement of position as follows:
Non-current liabilities - - - 5 5 Current liabilities 23 3 1 20 47
Provisions at 30 June 2015 23 3 1 25 52
2014 Provision for expected Provision for discounts, claims and loss-making Provision for Other Total
DKK million returns of goods contacts restructuring provisions provisions
Provisions at 1 July 2013 9 36 31 45 121 Provisions employed for the year (9) (31) (26) (44) (110)Provisions for the year 18 22 8 11 59 Reversed provisions - - (5) - (5)
Provisions at 30 June 2014 18 27 8 12 65
Povision specified in the consolidated financial statement of position as follows:
Non-current liabilities - - - 4 4 Current liabilities 18 27 8 8 61
Provisions at 30 June 2014 18 27 8 12 65
ACCOUNTING POLICIES Provisions are recognised when the Group has a present legal or constructive obligation as a result of past events in the financial year or in previous years, and when it is probable that drawing on the Group’s financial reserves is required to settle the relevant obligation. Provisions are measured as the best estimate of the costs re-quired at the end of the reporting period to settle the obligations.
Provisions with an expected due date in a year from the end of the reporting period are measured at current value. In the event of any planned restructuring of the Group, provi-sions are only made for obligations concerning restructuring which at the end of the reporting period have been resolved on the basis of a specific plan and where the parties involved have provided information on the overall plan.
ACCOUNTING ESTIMATESAccounting estimates concerning provisions are based on Man-agement’s best estimate of the assumptions and assessments. The major part of the provisions made is expected to be settled within a period of one year. Due to uncertainty during the set-tlement process, these estimates may, however, be significantly impacted by changes to the assumptions and assessments applied.
IC Group A/S makes provisions to cover expected discounts, claims and returns of products. These estimates are based on existing cotractual obligations and past experience. Based of the information available, IC Group A/S considers the provisions to be at adequate.

RE
SU
LTA
CC
OU
NTS
GO
VE
RN
AN
CE
STR
ATE
GY
OV
ER
VIE
W
73FINANCIAL STATEMENT • ANNUAL REPORT 2014/15 • IC GROUP A/S
7.4 CONTINGENT LIABILITIES
DKK million 2015 2014
Guarantees and other collateral security 428 604
The Group has entered into binding agreements with suppliers for delivery of collections until 31 December 2015, of which the majority is tied to sales orders entered into with wholesale customers.
At 30 June 2015, the Group was not involved in any pending litigation which may have a material impact on the Group’s financial position.
ACCOUNTING POLICIES Contingent liabilities comprise potential liabilities where it is yet to be confirmed whether these will cause an outflow of
the Group’s resources or actual liabilities which cannot be reliably measured.
7.5 EVENTS AFTER THE REPORTING PERIOD
No material events have taken place after the reporting period that have not been recognized or included in this Annual Report.
74 IC GROUP A/S • ANNUAL REPORT 2014/15 • FINANCIAL STATEMENT
STATEMENTS
Copenhagen, 2 September 2015
Executive Board:
MADS RYDER RUD TRABJERG PEDERSEN Group CEO Group CFO
Board of Directors:
HENRIK HEIDEBY NIELS ERIK MARTINSEN ANDERS COLDING FRIIS Chairman Deputy Chairman Deputy Chairman
ANNETTE BRØNDHOLT SØRENSEN MICHAEL HAUGE SØRENSEN OLE WENGEL
MANAGEMENT’S STATEMENT
The Board of Directors and the Executive Board have today con-sidered and approved the Annual Report of IC Group A/S for thefinancial year ending 30 June 2015.
The Annual Report is prepared in accordance with International Financial Reporting Standards as adopted by the EU and Danishdisclosure requirements for listed companies.
In our opinion, the consolidated financial statements and the Parent Company financial statements give a true and fair view of the Group’s and the Parent Company’s financial position at 30 June 2015 and of the results of their operations and cash flows for the financial year ending 30 June 2015.
We further believe the Management Commentary contains a fair review of the development of the Group’s and the Parent Com-pany’s operations and financial affairs, the financial performance for the year as well as the Parent Company’s financial position and the financial position of the entities as a whole which are included in the consolidated financial statements, and provides a description of the most significant risks and uncertainty factors that the Group and the Parent Company are facing.
We recommend that the Annual Report be adopted by the Annual General Meeting.
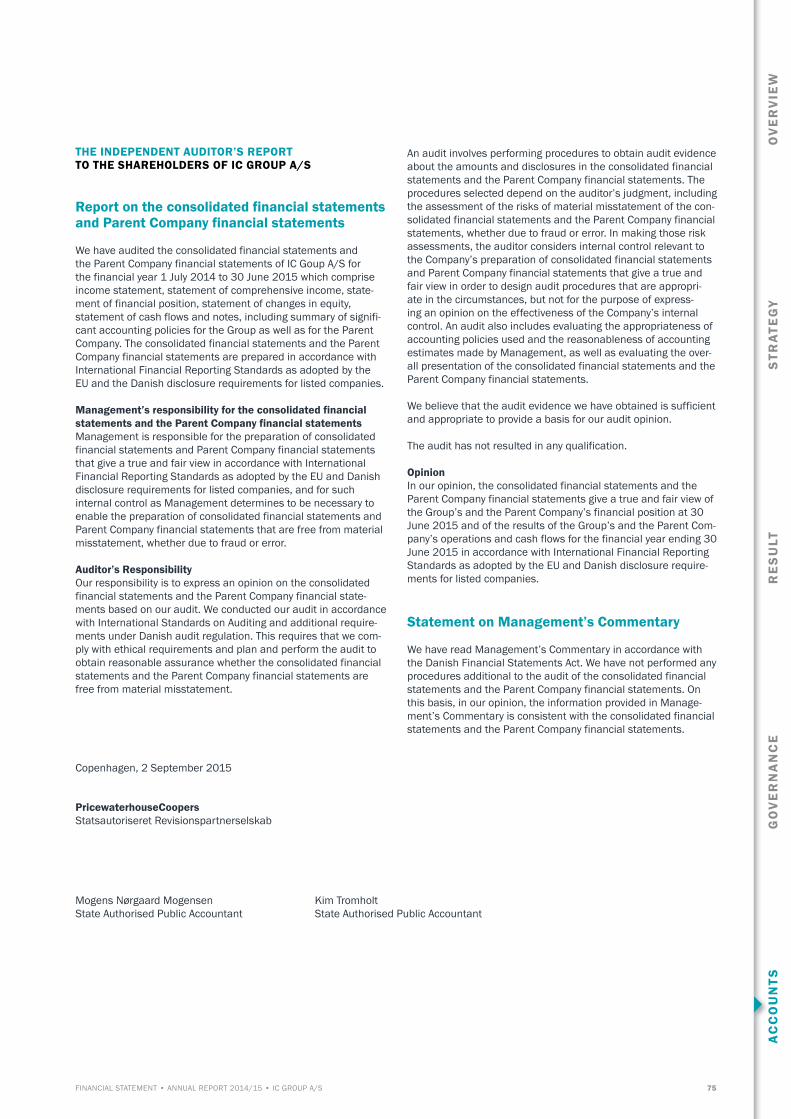
RE
SU
LTA
CC
OU
NTS
GO
VE
RN
AN
CE
STR
ATE
GY
OV
ER
VIE
W
75FINANCIAL STATEMENT • ANNUAL REPORT 2014/15 • IC GROUP A/S
THE INDEPENDENT AUDITOR’S REPORTTO THE SHAREHOLDERS OF IC GROUP A/S
Report on the consolidated financial statements and Parent Company financial statements
We have audited the consolidated financial statements and the Parent Company financial statements of IC Goup A/S for the financial year 1 July 2014 to 30 June 2015 which comprise income statement, statement of comprehensive income, state-ment of financial position, statement of changes in equity, statement of cash flows and notes, including summary of signifi-cant accounting policies for the Group as well as for the Parent Company. The consolidated financial statements and the Parent Company financial statements are prepared in accordance with International Financial Reporting Standards as adopted by the EU and the Danish disclosure requirements for listed companies.
Management’s responsibility for the consolidated financial statements and the Parent Company financial statementsManagement is responsible for the preparation of consolidated financial statements and Parent Company financial statements that give a true and fair view in accordance with International Financial Reporting Standards as adopted by the EU and Danish disclosure requirements for listed companies, and for such internal control as Management determines to be necessary to enable the preparation of consolidated financial statements and Parent Company financial statements that are free from material misstatement, whether due to fraud or error.
Auditor’s Responsibility Our responsibility is to express an opinion on the consolidated financial statements and the Parent Company financial state-ments based on our audit. We conducted our audit in accordance with International Standards on Auditing and additional require-ments under Danish audit regulation. This requires that we com-ply with ethical requirements and plan and perform the audit to obtain reasonable assurance whether the consolidated financial statements and the Parent Company financial statements are free from material misstatement.
An audit involves performing procedures to obtain audit evidence about the amounts and disclosures in the consolidated financial statements and the Parent Company financial statements. The procedures selected depend on the auditor’s judgment, including the assessment of the risks of material misstatement of the con-solidated financial statements and the Parent Company financial statements, whether due to fraud or error. In making those risk assessments, the auditor considers internal control relevant to the Company’s preparation of consolidated financial statements and Parent Company financial statements that give a true and fair view in order to design audit procedures that are appropri-ate in the circumstances, but not for the purpose of express-ing an opinion on the effectiveness of the Company’s internal control. An audit also includes evaluating the appropriateness of accounting policies used and the reasonableness of accounting estimates made by Management, as well as evaluating the over-all presentation of the consolidated financial statements and the Parent Company financial statements.
We believe that the audit evidence we have obtained is sufficient and appropriate to provide a basis for our audit opinion.
The audit has not resulted in any qualification.
OpinionIn our opinion, the consolidated financial statements and the Parent Company financial statements give a true and fair view of the Group’s and the Parent Company’s financial position at 30 June 2015 and of the results of the Group’s and the Parent Com-pany’s operations and cash flows for the financial year ending 30 June 2015 in accordance with International Financial Reporting Standards as adopted by the EU and Danish disclosure require-ments for listed companies.
Statement on Management’s Commentary
We have read Management’s Commentary in accordance with the Danish Financial Statements Act. We have not performed any procedures additional to the audit of the consolidated financial statements and the Parent Company financial statements. On this basis, in our opinion, the information provided in Manage-ment’s Commentary is consistent with the consolidated financial statements and the Parent Company financial statements.
Copenhagen, 2 September 2015
PricewaterhouseCoopersStatsautoriseret Revisionspartnerselskab
Mogens Nørgaard Mogensen Kim Tromholt State Authorised Public Accountant State Authorised Public Accountant

76 IC GROUP A/S • ANNUAL REPORT 2014/15 • FINANCIAL STATEMENT
GROUP STRUCTURE AT 30 JUNE 2015 Share capitalCompany Contry Currency 1,000 units
Subsidiaries, fully ownedIC Group Denmark A/S Denmark DKK 500Saint Tropez af 1993 A/S Denmark DKK 500By Malene Birger A/S Denmark DKK 500Raffinaderivej 10 A/S Denmark DKK 500IC Group Norway AS Norway NOK 9,450Tiger of Sweden AB Sweden SEK 501IC Group Sweden AB Sweden SEK 50,000Vingåker Factory Outlet AB Sweden SEK 200Peak Performance Production AB Sweden SEK 400S T Sweden AB Sweden SEK 100By Malene Birger AB Sweden SEK 100IC Group Finland Oy Finland EUR 384IC Group Netherlands Holding BV Netherlands EUR 2,269IC Group Netherlands BV Netherlands EUR 16IC Group Netherlands Administration BV Netherlands EUR 23IC Group UK Ltd.* UK GBP 4,350IC Group Germany G.m.b.H. Germany EUR 26IC Group Verwaltungs G.m.b.H. Germany EUR 1,432IC Group Austria G.m.b.H. Austria EUR 413IC Group Switzerland AG Schwitzerland CHF 3,101IC Group Spain S.A. Spain EUR 1,400IC Group France SARL France EUR 457IC Group Poland Sp. Z o.o. Poland PLN 126InWear S.p.z.o.o Poland PLN 2,500IC Companys Hungary Kft. Hungary HUF 10,546IC Group CZ s.r.o. Czech Rep. CZK 2,000IC Group Hong Kong Ltd. Hong Kong HKD 10,000IC Companys (Shanghai) Ltd. China CNY 5,289IC Group Romania Sourcing SAL Romania ROL 1,317Peak Performance Italy SRL Italy EUR 10IC Group Belgium N.V. Belgium EUR 400IC Group Canada INC. Canada CAD 500
Subsidiary, equity share of 51% Designers Remix A/S Denmark DKK 500
Associate, equity share of 10.11% DK Company A/S Denmark DKK 68,078
* The company has qualified for audit exemption in the UK, cf. the derogation clauses set out in section 479A of the UK company law “The Companies Act 2006”.

RE
SU
LTA
CC
OU
NTS
GO
VE
RN
AN
CE
STR
ATE
GY
OV
ER
VIE
W
77FINANCIAL STATEMENT • ANNUAL REPORT 2014/15 • IC GROUP A/S
DEFINITION OF KEY RATIOS
Revenue for the year – Revenue last year Revenue growth (%) = Revenue last year
Gross profitGross margin (%) = Revenue
Operating profit before depreciation and amortizationEBITDA-margin (%) = Revenue
Operating profitEBIT margin (%) = Revenue Profit for the year excl. non-controlling interestsReturn on equity (%) = Average equity excl. non-controlling interests
Equity year-end excl. non-controlling interests Equity ratio (%) = Total assets year-end Net average working capital plus intangible assets and property, plant and equipment less provisions.Average invested capital = Goodwill included represents total acquired goodwill after write-down for impairment.
Operating profitReturn on invested capital (%) = Average capital employed including goodwill
Net working capital compared to Net working capital, at the end of period12 months trailing revenue = Revenue
Free cash flowCash conversion = Profit for the year (EBIT) Short-term and long-term liabilities to credit institutionsNet interest-bearing debt = and lease debt less cash and cash equivalents Net interest-bearing debtFinancial gearing (%) = Equity at end of period
Profit attributable to shareholders of the Parent CompanyEarnings per share = Average number of shares excluding treasury shares
Profit attributable to shareholders of the Parent CompanyDiluted earnings per share = Average number of shares excluding treasury shares, diluted
Cash flow from operating activitiesDiluted cash flow per share = Average number of shares excluding treasury shares, diluted
Equity at year-end excluding non-controlling interestsDiluted net assets value per share = Number of shares at year-end excluding treasury shares, diluted
Market price per share at year-endDiluted price/earnings = Diluted earnings per share A store measured on same-store data with unchanged location, sales area, Same-store definition = name an comparable figures for a full financial year.


AC
CO
UN
TSR
ES
ULT
GO
VE
RN
AN
CE
STR
ATE
GY
OV
ER
VIE
W
PRIMARY STATEMENTS
INCOME STATEMENT 80
STATEMENT OF COMPREHENSIVE INCOME 80
STATEMENT OF FINANCIAL POSITION 80
STATEMENT OF CHANGES IN EQUITY 82
STATEMENT OF CASH FLOWS 83
1 BASIS FOR PREPARATION OF PARENT COMPANY FINANCIAL STATEMENTS 84
NOTES – INCOME STATEMENT
2 REVENUE 84
3 FEE TO AUDITORS ELECTED AT THE ANNUAL GENERAL MEETING 84
4 STAFF COSTS 84
5 OTHER OPERATING INCOME AND COSTS 85
6 FINANCIAL INCOME AND COSTS 85
7 TAX 86
PARENT COMPANY FINANCIAL STATEMENT
NOTES – STATEMENT OF FINANCIAL POSITION
8 INTANGIBLE ASSETS 88
9 PROPERTY, PLANT AND EQUIPMENT 88
10 INVESTMENTS IN SUBSIDIARIES AND ASSOCIATES 89
11 FINANCIAL ASSETS 89
12 INVENTORIES 90
13 TRADE RECEIVABLES 90
14 NET INTEREST-BEARING DEBT 90
15 SHARE CAPITAL 90
16 DIVIDENDS 91
17 PROVISIONS 91
18 OPERATING LEASE COMMITMENTS 91
19 CHANGE IN WORKING CAPITAL 92
20 OTHER ADJUSTMENTS TO CASH FLOW 92
NOTES – SUPPLEMENTARY INFORMATION
21 CONTINGENT LIABILITIES 92
22 FINANCIAL RISKS AND DERIVATIVE FINANCIAL INSTRUMENTS 92
23 RELATED PARTIES 92
24 EVENTS AFTER THE REPORTING PERIOD 92

80 IC GROUP A/S • ANNUAL REPORT 2014/15 • FINANCIAL STATEMENT
INCOME STATEMENT1 JULY 2014 - 30 JUNE 2015
Note DKK million 2014/15 2013/14
2 Revenue 1,049 1,420 Cost of sales (972) (1,236)
Gross profit 77 184 Other external costs (99) (130) 4 Staff costs (133) (211) 5 Other operating income and costs 99 127
Operating profit before depreciation and amortization (EBITDA) (56) (30) 8, 9 Depreciation, amortization and impairment losses (14) (24)
Operating profit (EBIT) (70) (54) 10 Income from investments in subsidiaries 39 170 6 Financial income 19 41 6 Financial costs (28) (34)
Profit/loss before tax (40) 123 7 Tax on profit for the year 14 20
Profit for the year (26) 143
Profit allocation: 16 Proposed dividend 68 49 Retained earnings (94) 94
Profit for the year (26) 143
STATEMENT OF COMPREHENSIVE INCOME1 JULY 2014 - 30 JUNE 2015
Note DKK million 2014/15 2013/14
Profit for the year (26) 143
OTHER COMPREHENSIVE INCOME Itemstobereclassifiedtotheincomestatementwhencertainconditionsaremeet: Fair value adjustments, gains/loss on financial instruments classified as cash flow hedges 48 9 Reclassification to income statement, gains/loss on realized cash flow hedges (6) (20) Tax on items which may be reclassified to the income statement (10) 1
Total other comprehensive income after tax 32 (10)
Total comprehensive income 6 133
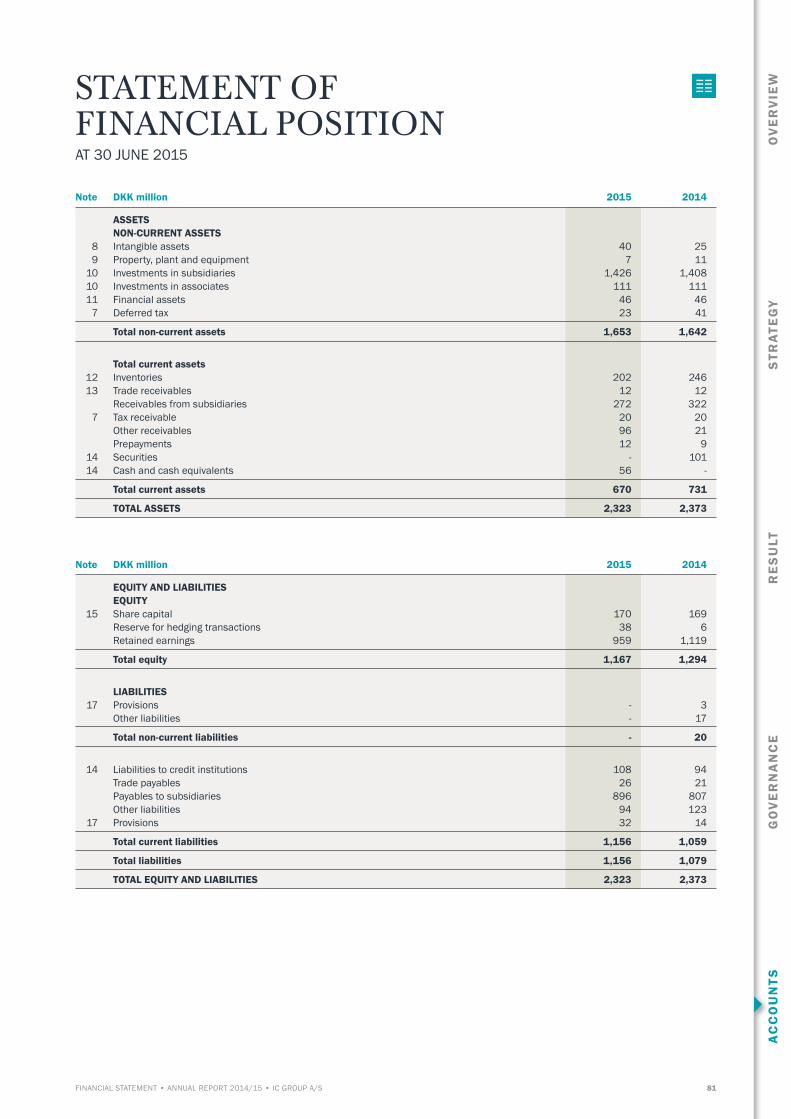
RE
SU
LTA
CC
OU
NTS
GO
VE
RN
AN
CE
STR
ATE
GY
OV
ER
VIE
W
81FINANCIAL STATEMENT • ANNUAL REPORT 2014/15 • IC GROUP A/S
STATEMENT OF FINANCIAL POSITIONAT 30 JUNE 2015
Note DKK million 2015 2014
ASSETS NON-CURRENT ASSETS 8 Intangible assets 40 25 9 Property, plant and equipment 7 11 10 Investments in subsidiaries 1,426 1,408 10 Investments in associates 111 111 11 Financial assets 46 46 7 Deferred tax 23 41
Total non-current assets 1,653 1,642
Total current assets 12 Inventories 202 246 13 Trade receivables 12 12 Receivables from subsidiaries 272 322 7 Tax receivable 20 20 Other receivables 96 21 Prepayments 12 9 14 Securities - 101 14 Cash and cash equivalents 56 -
Total current assets 670 731
TOTAL ASSETS 2,323 2,373
Note DKK million 2015 2014
EQUITY AND LIABILITIES EQUITY 15 Share capital 170 169 Reserve for hedging transactions 38 6 Retained earnings 959 1,119
Total equity 1,167 1,294
LIABILITIES 17 Provisions - 3 Other liabilities - 17
Total non-current liabilities - 20
14 Liabilities to credit institutions 108 94 Trade payables 26 21 Payables to subsidiaries 896 807 Other liabilities 94 123 17 Provisions 32 14
Total current liabilities 1,156 1,059
Total liabilities 1,156 1,079
TOTAL EQUITY AND LIABILITIES 2,323 2,373

82 IC GROUP A/S • ANNUAL REPORT 2014/15 • FINANCIAL STATEMENT
STATEMENT OF CHANGES IN EQUITY1 JULY 2014 - 30 JUNE 20152015 Reserve for Share hedging Retained Proposed TotalDKK million capital transactions earnings dividend equity
Equity at 1 July 2014 169 6 1,070 49 1,294 Profit for the year - - (94) 68 (26)Other comprehensive income after tax - 32 - - 32
Total comprehensive income - 32 (4) 68 6 Transactions with owners: Ordinary dividend paid - - - (49) (49)Extraordinary dividend paid - - (97) - (97)Share-based payments - - 1 - 1 Exercise of share options and warrants 1 - 11 - 12
Equity at 30 June 2015 170 38 891 68 1,167
2014 Reserve for Share hedging Retained Proposed TotalDKK million capital transactions earnings dividend equity
Equity at 1 July 2013 169 16 1,060 33 1,278 Profit for the year - - 94 49 143 Other comprehensive income - (10) - - (10)
Total comprehensive income - (10) 94 49 133 Transactions with owners: Ordinary dividend paid - - - (33) (33)Extraordinary dividend paid - - (97) - (97)Share-based payments - - 3 - 3 Exercise of share options - - 10 - 10
Equity at 30 June 2014 169 6 1,070 49 1,294

RE
SU
LTA
CC
OU
NTS
GO
VE
RN
AN
CE
STR
ATE
GY
OV
ER
VIE
W
83FINANCIAL STATEMENT • ANNUAL REPORT 2014/15 • IC GROUP A/S
STATEMENT OF CASH FLOWS 1 JULY 2014 - 30 JUNE 2015
Note DKK million 2014/15 2013/14
CASH FLOW FROM OPERATING ACTIVITIES Operating loss (70) (54) 20 Other adjustments 21 16 19 Change in working capital 144 79
Cash flow from ordinary operating activities 95 41 Financial income received 5 11 Financial cost paid (9) (15)
Cash flow from operating activities 91 37 7 Tax refunded 21 12
Total cash flow from operating activities 112 49
CASH FLOW FROM INVESTING ACTIVITIES 8 Investments in intangible assets (26) (10) 9 Investments in property, plant and equipment (1) (7) Investments in subsidiaries (47) (47) Sale of subsidiaries - 37 Purchase of securities - (101) Sale of securities 101 101 Change in deposits and other financial assets - 1 Dividend received, proceeds in connection with liquidation, etc. 54 104
Total cash flow from investing activities 81 78
Free cash flow 193 127
CASH FLOW FROM FINANCING ACTIVITIES Repayment of non-current liabilities (17) (10) Ordinary dividend paid (49) (33) Extraordinary dividend paid (97) (97) Exercise of share options and warrants 12 10
Total cash flow from financing activities (151) (130)
Net cash flow for the year 42 (3)
CASH AND CASH EQUIVALENTS Cash and cash equivalents at 1 July (94) (91) Net cash flow for the year 42 (3)
Cash and cash equivalents at 30 June (52) (94)
DKK million 2015 2014
Cashandcashequivalentscomprises: Cash and cash equivalents 56 - Current liabilities to credit institutions (108) (94)
Cash and cash equivalents, cf. statement of cash flows (52) (94)
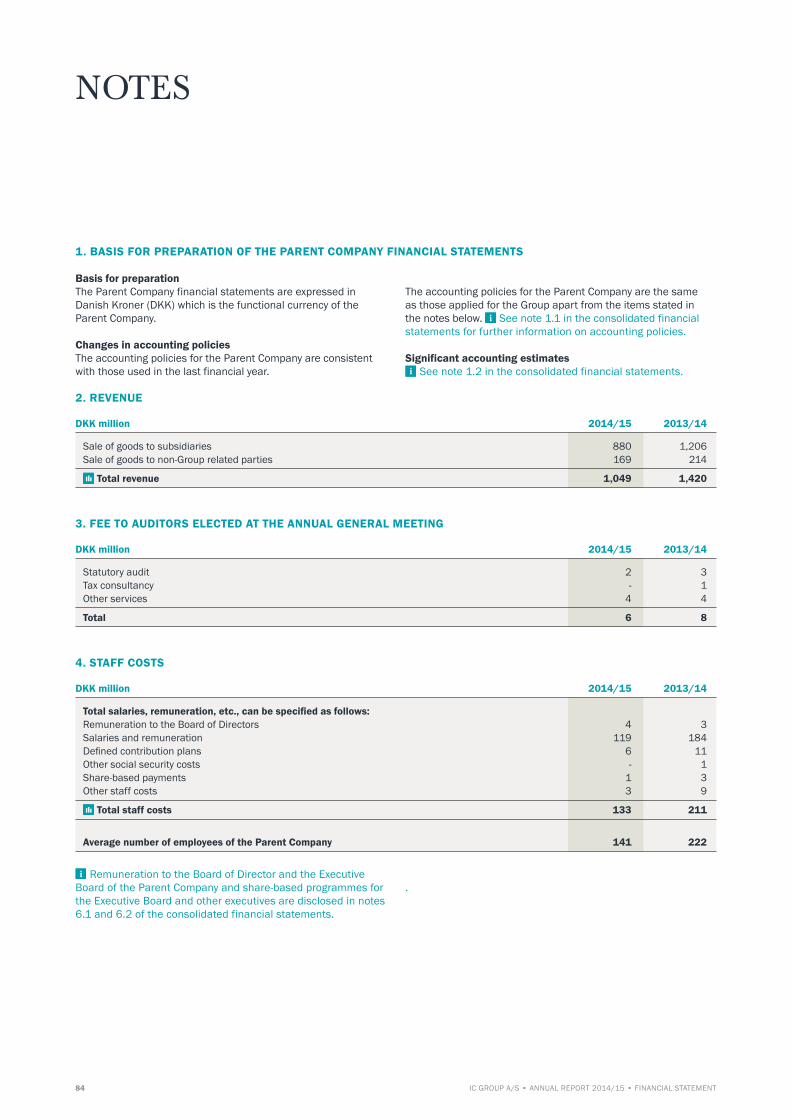
84 IC GROUP A/S • ANNUAL REPORT 2014/15 • FINANCIAL STATEMENT
1. BASIS FOR PREPARATION OF THE PARENT COMPANY FINANCIAL STATEMENTS
Basis for preparationThe Parent Company financial statements are expressed in Danish Kroner (DKK) which is the functional currency of the Parent Company.
Changes in accounting policies The accounting policies for the Parent Company are consistent with those used in the last financial year.
The accounting policies for the Parent Company are the same as those applied for the Group apart from the items stated in the notes below. See note 1.1 in the consolidated financial statements for further information on accounting policies.
Significant accounting estimates See note 1.2 in the consolidated financial statements.
2. REVENUE
DKK million 2014/15 2013/14
Sale of goods to subsidiaries 880 1,206Sale of goods to non-Group related parties 169 214
Total revenue 1,049 1,420
3. FEE TO AUDITORS ELECTED AT THE ANNUAL GENERAL MEETING
DKK million 2014/15 2013/14
Statutory audit 2 3 Tax consultancy - 1 Other services 4 4
Total 6 8
4. STAFF COSTS
DKK million 2014/15 2013/14
Total salaries, remuneration, etc., can be specified as follows: Remuneration to the Board of Directors 4 3 Salaries and remuneration 119 184 Defined contribution plans 6 11 Other social security costs - 1 Share-based payments 1 3 Other staff costs 3 9
Total staff costs 133 211
Average number of employees of the Parent Company 141 222
Remuneration to the Board of Director and the Executive Board of the Parent Company and share-based programmes for the Executive Board and other executives are disclosed in notes 6.1 and 6.2 of the consolidated financial statements.
.
NOTES

RE
SU
LTA
CC
OU
NTS
GO
VE
RN
AN
CE
STR
ATE
GY
OV
ER
VIE
W
85FINANCIAL STATEMENT • ANNUAL REPORT 2014/15 • IC GROUP A/S
5. OTHER OPERATING INCOME AND COSTS
DKK million 2014/15 2013/14
Services provided to subsidiaries 74 94 Loss on sale of non-current assets (1) - Sales proceeds and other operating income and costs 26 33
Total other operating income and costs 99 127
Administration fees paid by subsidiaries to the Parent Company cover their share of the Group’s overhead costs which are
recognized as other operating costs under Other operating in-come and costs.
ACCOUNTING POLICIES Other operating income and costs contain items of a secondary nature in relation to the main activities, including profit and loss on sale of intangible assets and property, plant and equipment.
6. FINANCIAL INCOME AND COSTS
DKK million 2014/15 2013/14
Financial income: Interest on receivables from subsidiaries 14 22 Interest on bank deposits 2 1
Interest income from financial assets not measured at fair value 16 23 Interest income on securities - 1 Realized gain on derivative financial instruments 2 8 Net gain on foreign currency translation 1 9
Total financial income 19 41
Financial costs: Interest on liabilities to credit institutions (6) (4)Interest on payables to subsidiaries (17) (21)
Interest costs from financial liabilities not measured at fair value (23) (25) Fair value adjustments on securities (1) (1)Realized loss on derivative financial instruments (3) (7)Net loss on foreign currency translation (1) (1)
Total financial costs (28) (34)
Net financials (9) 7
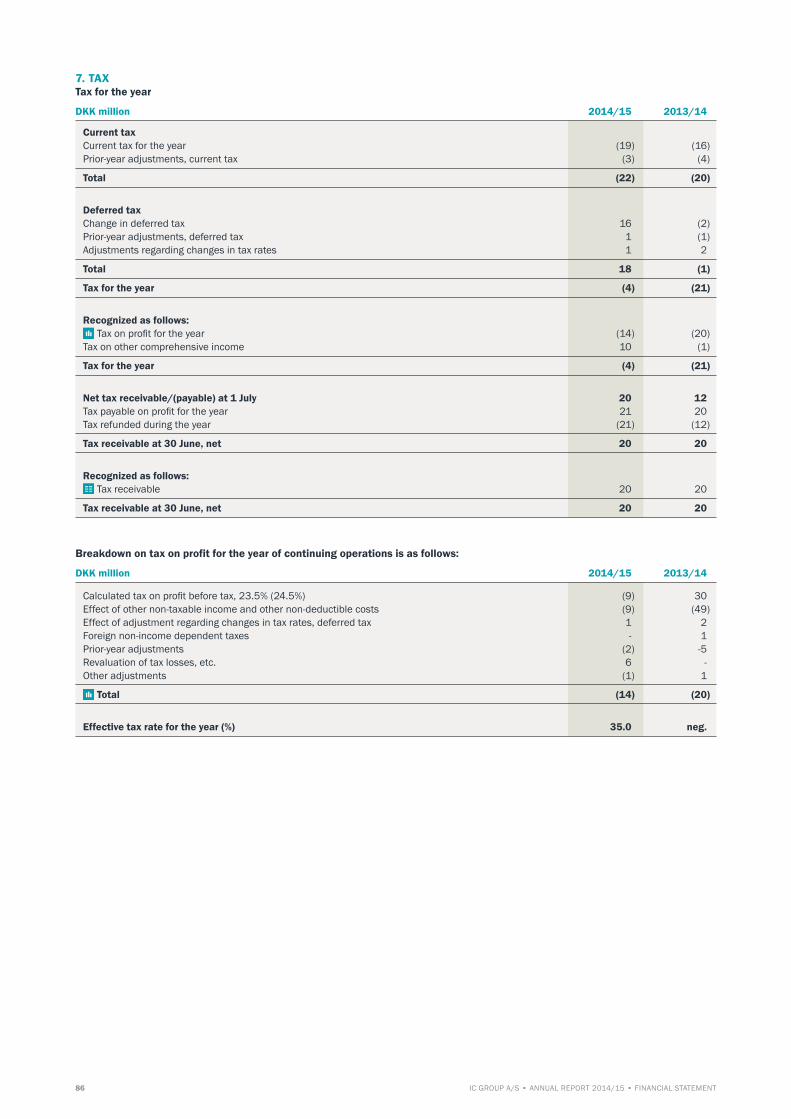
86 IC GROUP A/S • ANNUAL REPORT 2014/15 • FINANCIAL STATEMENT
7. TAXTax for the year
DKK million 2014/15 2013/14
Current tax Current tax for the year (19) (16)Prior-year adjustments, current tax (3) (4)
Total (22) (20)
Deferred tax Change in deferred tax 16 (2)Prior-year adjustments, deferred tax 1 (1)Adjustments regarding changes in tax rates 1 2
Total 18 (1)
Tax for the year (4) (21)
Recognized as follows:
Tax on profit for the year (14) (20)Tax on other comprehensive income 10 (1)
Tax for the year (4) (21)
Net tax receivable/(payable) at 1 July 20 12 Tax payable on profit for the year 21 20 Tax refunded during the year (21) (12)
Tax receivable at 30 June, net 20 20
Recognized as follows:
Tax receivable 20 20
Tax receivable at 30 June, net 20 20
Breakdown on tax on profit for the year of continuing operations is as follows:
DKK million 2014/15 2013/14
Calculated tax on profit before tax, 23.5% (24.5%) (9) 30 Effect of other non-taxable income and other non-deductible costs (9) (49) Effect of adjustment regarding changes in tax rates, deferred tax 1 2 Foreign non-income dependent taxes - 1 Prior-year adjustments (2) -5 Revaluation of tax losses, etc. 6 -Other adjustments (1) 1
Total (14) (20)
Effective tax rate for the year (%) 35.0 neg.
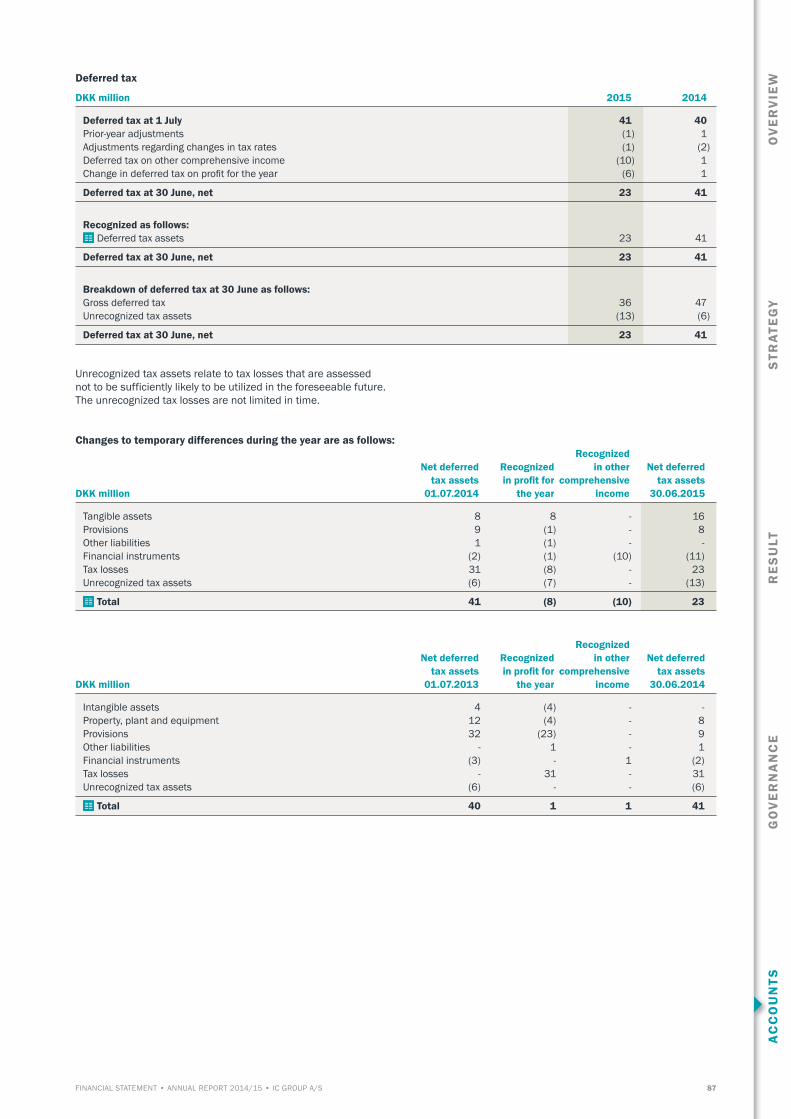
RE
SU
LTA
CC
OU
NTS
GO
VE
RN
AN
CE
STR
ATE
GY
OV
ER
VIE
W
87FINANCIAL STATEMENT • ANNUAL REPORT 2014/15 • IC GROUP A/S
Deferred tax
DKK million 2015 2014
Deferred tax at 1 July 41 40 Prior-year adjustments (1) 1 Adjustments regarding changes in tax rates (1) (2)Deferred tax on other comprehensive income (10) 1 Change in deferred tax on profit for the year (6) 1
Deferred tax at 30 June, net 23 41
Recognized as follows:
Deferred tax assets 23 41
Deferred tax at 30 June, net 23 41
Breakdown of deferred tax at 30 June as follows: Gross deferred tax 36 47 Unrecognized tax assets (13) (6)
Deferred tax at 30 June, net 23 41
Unrecognized tax assets relate to tax losses that are assessed not to be sufficiently likely to be utilized in the foreseeable future.The unrecognized tax losses are not limited in time.
Changes to temporary differences during the year are as follows: Recognized Net deferred Recognized in other Net deferred tax assets in profit for comprehensive tax assets
DKK million 01.07.2014 the year income 30.06.2015
Tangible assets 8 8 - 16 Provisions 9 (1) - 8 Other liabilities 1 (1) - - Financial instruments (2) (1) (10) (11)Tax losses 31 (8) - 23 Unrecognized tax assets (6) (7) - (13)
Total 41 (8) (10) 23
Recognized Net deferred Recognized in other Net deferred tax assets in profit for comprehensive tax assets
DKK million 01.07.2013 the year income 30.06.2014
Intangible assets 4 (4) - - Property, plant and equipment 12 (4) - 8 Provisions 32 (23) - 9 Other liabilities - 1 - 1 Financial instruments (3) - 1 (2)Tax losses - 31 - 31 Unrecognized tax assets (6) - - (6)
Total 40 1 1 41

88 IC GROUP A/S • ANNUAL REPORT 2014/15 • FINANCIAL STATEMENT
8. INTANGIBLE ASSETS Total2015 Software and IT Trademark intangibleDKK million systems rights assets
Cost at 1 July 2014 252 8 260 Addition 26 - 26 Disposal (168) (8) (176)
Cost at 30 June 2015 110 - 110
Accumulated amortization and impairment at 1 July 2014 (227) (8) (235)Amortization and impairment on disposals 168 8 176 Amortization for the year (11) - (11)
Accumulated amortization and impairment at 30 June 2015 (70) - (70)
Carrying amount at 30 June 2015 40 - 40
Total2014 Software and IT Trademark intangibleDKK million systems rights assets
Cost at 1 July 2013 250 8 258 Addition 10 - 10 Disposal (8) - (8)
Cost at 30 June 2014 252 8 260
Accumulated amortization and impairment at 1 July 2013 (217) (8) (225)Amortization and impairment on disposals 7 - 7 Amortization for the year (17) - (17)
Accumulated amortization and impairment at 30 June 2014 (227) (8) (235)
Carrying amount at 30 June 2014 25 - 25
9. PROPERTY, PLANT AND EQUIPMENT Total 2015 Leasehold Equipment Assets under property, plantDKK million improvements & furniture construction & equipment
Cost at 1 July 2014 4 51 5 60 Addition - 1 - 1 Disposal (3) (21) (2) (26)
Cost at 30 June 2015 1 31 3 35
Accumulated depreciation and impairment at 1 July 2014 (4) (45) - (49)Depreciation and impairment on disposals 3 21 - 24 Amortization for the year - (3) - (3)
Accumulated depreciation and impairment at 30 June 2015 (1) (27) - (28)
Carrying amount at 30 June 2015 - 4 3 7
Total 2014 Leasehold Equipment Assets under property, plantDKK million improvements & furniture construction & equipment
Cost at 1 July 2013 7 67 3 77 Addition - 2 5 7 Disposal (3) (18) (3) (24)
Cost at 30 June 2014 4 51 5 60
Accumulated depreciation and impairment at 1 July 2013 (5) (55) - (60)Amortization and impairment on disposals 2 16 - 18 Amortization for the year (1) (6) - (7)
Accumulated depreciation and impairment at 30 June 2014 (4) (45) - (49)
Carrying amount at 30 June 2014 - 6 5 11

RE
SU
LTA
CC
OU
NTS
GO
VE
RN
AN
CE
STR
ATE
GY
OV
ER
VIE
W
89FINANCIAL STATEMENT • ANNUAL REPORT 2014/15 • IC GROUP A/S
10. INVESTMENTS IN SUBSIDIARIES AND ASSOCIATES
2015 DKK million Subsidiaries Associates
Cost at 1 July 2014 1,767 111 Reclassification (86) - Addition 44 -
Cost at 30 June 2015 1,725 111
Write-downs at 1 July 2014 (359) - Reclassification 86 - Addition (26) -
Write-downs at 30 June 2015 (299) -
Total carrying amount at 30 June 2015 1,426 111
2014 DKK million Subsidiaries Associates
Cost at 1 July 2013 1,822 - Addition 45 111 Disposal (100) -
Cost at 30 June 2014 1,767 111
Write-downs at 1 July 2013 (359) -
Write-downs at 30 June 2014 (359) -
Total carrying amount at 30 June 2014 1,408 111
For an overview of the Group structure, see page 76 of this Annual Report. Income from investments in subsidiaries amounted to net DKK 39 million (positive DKK 170 million), comprising dividends from subsidiaries less write-downs of investments and receivables for the year.
For the financial year 2014/15, an amount of DKK 11 million relating to previous write-downs of short-term receivables from subsidiaries (income of DKK 67 million) was recognized in the income statement.
ACCOUNTING POLICIES Investments in subsidiaries and associates are measured at cost. An impairment test is conducted when carrying amount of investments exceeds the carrying amount of net assets in
the consolidated financial statements. If the cost is higher than the recoverable amount, it will be written down to the lower amount.
11. FINANCIAL ASSETS Longterm receivables from Total financial
Mio. DKK subsidiaries Deposits etc. Other assets
Carrying amount at 1 July 2013 33 4 - 37 Net additions, disposals and foreign currency translation adjustments for the year (2) (1) 12 9
Carrying amount at 30 June 2014 31 3 12 46 Net additions, disposals and foreign currency translation adjustments for the year - - - -
Carrying amount at 30 June 2015 31 3 12 46
All intercompany loans are interest-bearing.
ACCOUNTING POLICIES On initial recognition, receivables from subsidiaries in the Par-ent Company financial statements are measured at fair value and subsequently at amortized cost which usually corresponds
to the nominal value less write-downs for bad debts. No security was received for the loans. The carrying amount of the financial assets corresponds to the fair value.

90 IC GROUP A/S • ANNUAL REPORT 2014/15 • FINANCIAL STATEMENT
12. INVENTORIES
DKK million 2015 2014
Finished goods and goods for resale 117 105 Goods in transit 99 148
Total inventories, gross 216 253
Changes in inventory write-downs: Inventory write-downs at 1 July 7 12 Write-down for the year, addition 12 7 Write-down for the year, reversal (5) (12)
Total inventory write-downs 14 7
Total inventories, net 202 246
Write-downs (%) 6 3
Inventories recognized at net realizable value amounted to DKK 24 million (DKK 13 million) at 30 June 2015.
13. TRADE RECEIVABLES
DKK million 2015 2014
Not yet due 9 8 Due, 1-60 days 3 2 Due. 61-120 days - - Due more than 120 days - 2
Total trade receivables, net 12 12
Changes in trade receivables write-downs:Write-downs at 1 July 1 4 Change in write-downs for the year 1 (3)
Total write-downs 2 1
In all material respects, the carrying amounts of trade receiva-bles correspond to their fair values. In general, trade receiva-bles do not carry interest until between 30 and 60 days after
the invoice date. After this date, interest is charged to the outstanding amount.
14. NET INTEREST-BEARING DEBT
DKK million 2015 2014
Net interest-bearing debt comprises:Credit institutions, current liabilities 108 94
Interest-bearing debt, gross 108 94
Listed bonds - 101 Cash and cash equivalents 56 -
Net interest-bearing debt 52 (7)
15. SHARE CAPITAL
For information on distribution of share capital on number of shares, etc., see note 5.1 to the consolidated financial statements.
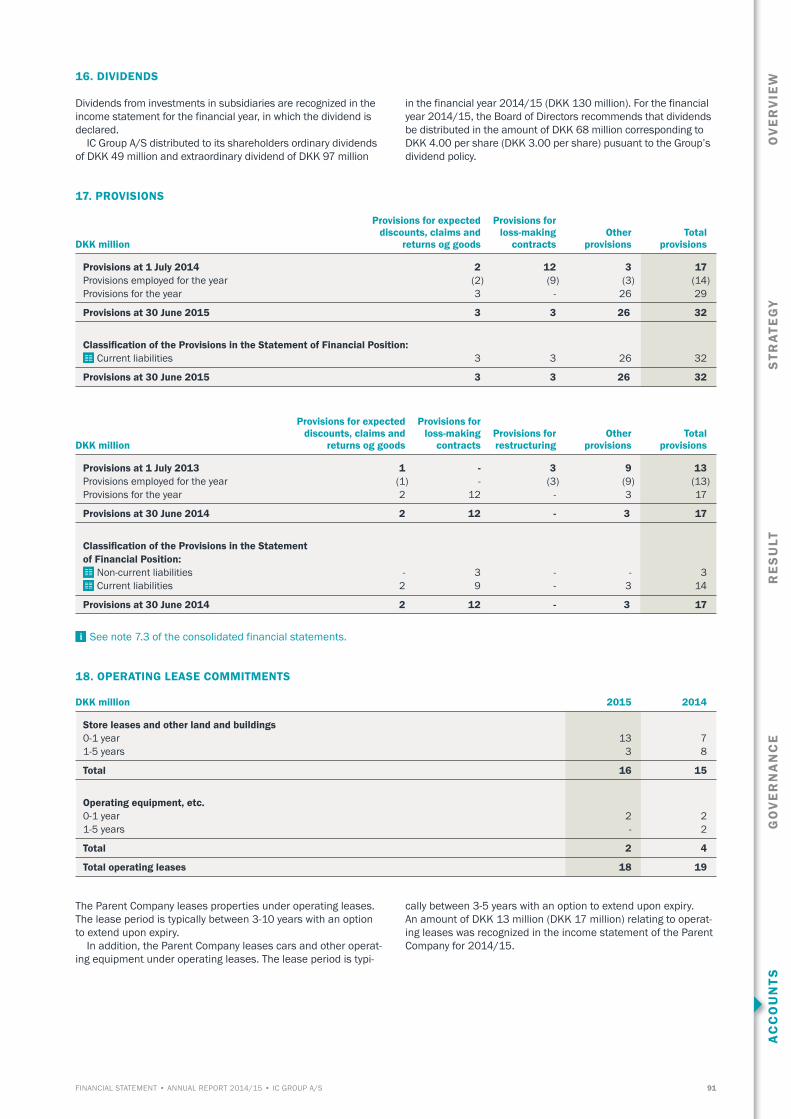
RE
SU
LTA
CC
OU
NTS
GO
VE
RN
AN
CE
STR
ATE
GY
OV
ER
VIE
W
91FINANCIAL STATEMENT • ANNUAL REPORT 2014/15 • IC GROUP A/S
16. DIVIDENDS
Dividends from investments in subsidiaries are recognized in the income statement for the financial year, in which the dividend isdeclared. IC Group A/S distributed to its shareholders ordinary dividends of DKK 49 million and extraordinary dividend of DKK 97 million
in the financial year 2014/15 (DKK 130 million). For the financial year 2014/15, the Board of Directors recommends that dividends be distributed in the amount of DKK 68 million corres ponding to DKK 4.00 per share (DKK 3.00 per share) pusuant to the Group’s dividend policy.
17. PROVISIONS Provisions for expected Provisions for discounts, claims and loss-making Other Total
DKK million returns og goods contracts provisions provisions
Provisions at 1 July 2014 2 12 3 17 Provisions employed for the year (2) (9) (3) (14)Provisions for the year 3 - 26 29
Provisions at 30 June 2015 3 3 26 32
Classification of the Provisions in the Statement of Financial Position:
Current liabilities 3 3 26 32
Provisions at 30 June 2015 3 3 26 32
Provisions for expected Provisions for discounts, claims and loss-making Provisions for Other Total
DKK million returns og goods contracts restructuring provisions provisions
Provisions at 1 July 2013 1 - 3 9 13 Provisions employed for the year (1) - (3) (9) (13)Provisions for the year 2 12 - 3 17
Provisions at 30 June 2014 2 12 - 3 17
Classification of the Provisions in the Statement of Financial Position:
Non-current liabilities - 3 - - 3 Current liabilities 2 9 - 3 14
Provisions at 30 June 2014 2 12 - 3 17
See note 7.3 of the consolidated financial statements.
18. OPERATING LEASE COMMITMENTS
DKK million 2015 2014
Store leases and other land and buildings 0-1 year 13 71-5 years 3 8
Total 16 15
Operating equipment, etc. 0-1 year 2 21-5 years - 2
Total 2 4
Total operating leases 18 19
The Parent Company leases properties under operating leases. The lease period is typically between 3-10 years with an option to extend upon expiry. In addition, the Parent Company leases cars and other operat-ing equipment under operating leases. The lease period is typi-
cally between 3-5 years with an option to extend upon expiry.An amount of DKK 13 million (DKK 17 million) relating to operat-ing leases was recognized in the income statement of the Parent Company for 2014/15.

92 IC GROUP A/S • ANNUAL REPORT 2014/15 • FINANCIAL STATEMENT
19. CHANGE IN WORKING CAPITAL DKK million 2015 2014
Inventories 202 246 Trade receivables 12 12 Receivables from subsidiaries 272 322 Other receivables excluding derivative financial instruments 8 2 Prepayments 12 9
Total assets 506 591
Trade payables 26 21 Payables to subsidiaries 896 807 Other liabilities excluding derivative financial instruments 72 107
Total liabilities 994 935
Working capital (486) (344)
DKK million 2014/15 2013/14
Change in inventories 44 (13)Change in net liability to subsidiaries 139 106 Change in receivables excluding derivative financial instruments (9) (20)Change in current liabilities excluding derivative financial instruments (30) 6
Total change in working capital 144 79
20. OTHER ADJUSTMENTS IN CASH FLOW
DKK million 2014/15 2013/14
Reversed depreciation and impairment losses and gain/loss on sale of non-current asstes 14 24 Share-based payments recognized in profit and loss 1 3 Provisions 16 - Other adjustments (10) (11)
Total 21 16
21. CONTINGENT LIABILITIES
DKK million 2015 2014
Guarantiees and others collateral securities relating to subsidiraries 418 559Other guarantiees and collateral securities - 11
The Parent Company has issued letters of comfort to certain subsidiaries.
22. FINANCIAL RISKS AND DERIVATIVE FINANCIAL INSTRUMENTS
Please see note 5.4 in the consolidated financial statements.
23. RELATED PARTIES
Please see note 6.3 in the consolidated financial statements. The Parent Company transactions with subsidiaries are disclosed in the relevant notes to the Parent Company.
24. EVENTS AFTER THE REPORTING PERIOD
Please see note 7.5 in the consolidated financial statements.

AC
CO
UN
TSR
ES
ULT
GO
VE
RN
AN
CE
STR
ATE
GY
OV
ER
VIE
W
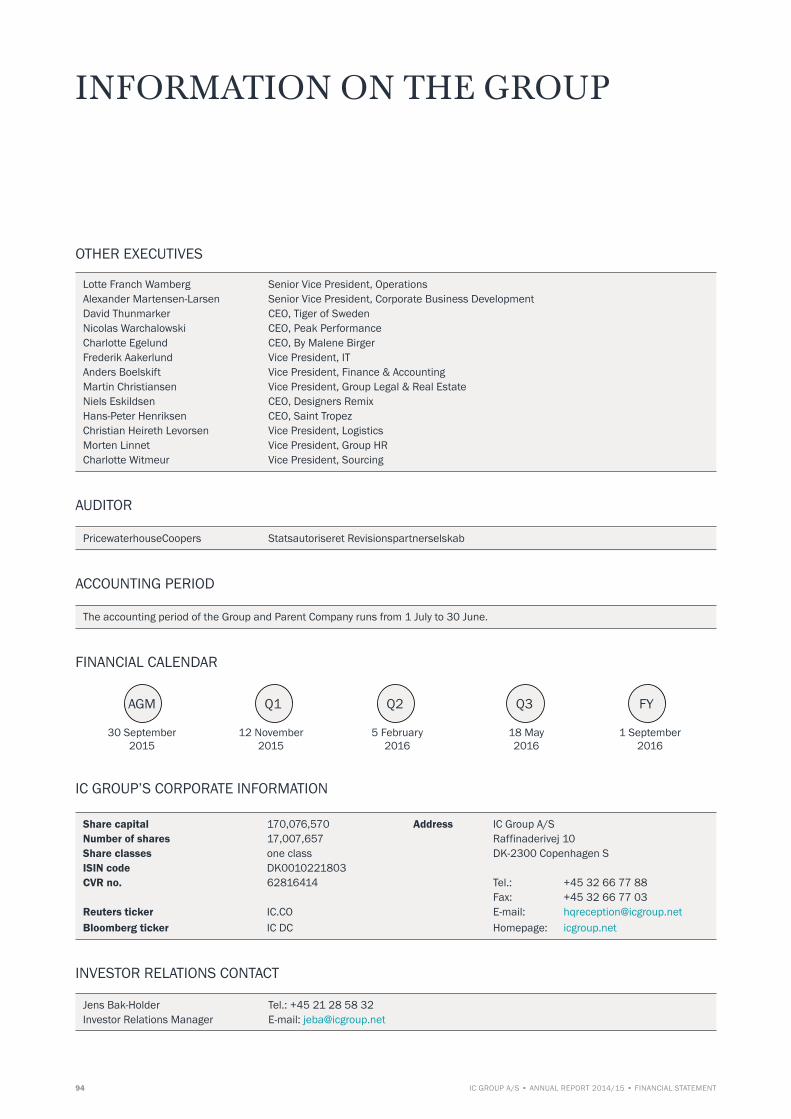
94 IC GROUP A/S • ANNUAL REPORT 2014/15 • FINANCIAL STATEMENT
OTHER EXECUTIVES
Lotte Franch Wamberg Senior Vice President, OperationsAlexander Martensen-Larsen Senior Vice President, Corporate Business DevelopmentDavid Thunmarker CEO, Tiger of SwedenNicolas Warchalowski CEO, Peak PerformanceCharlotte Egelund CEO, By Malene BirgerFrederik Aakerlund Vice President, ITAnders Boelskift Vice President, Finance & AccountingMartin Christiansen Vice President, Group Legal & Real Estate Niels Eskildsen CEO, Designers RemixHans-Peter Henriksen CEO, Saint Tropez Christian Heireth Levorsen Vice President, Logistics Morten Linnet Vice President, Group HRCharlotte Witmeur Vice President, Sourcing
AUDITOR
PricewaterhouseCoopers Statsautoriseret Revisionspartnerselskab
ACCOUNTING PERIOD
The accounting period of the Group and Parent Company runs from 1 July to 30 June.
FINANCIAL CALENDAR
30 September 12 November 5 February 18 May 1 September 2015 2015 2016 2016 2016
IC GROUP’S CORPORATE INFORMATION
Share capital 170,076,570 Address IC Group A/SNumber of shares 17,007,657 Raffinaderivej 10Share classes one class DK-2300 Copenhagen SISIN code DK0010221803CVR no. 62816414 Tel.: +45 32 66 77 88 Fax: +45 32 66 77 03Reuters ticker IC.CO E-mail: [email protected] Bloomberg ticker IC DC Homepage: icgroup.net
INVESTOR RELATIONS CONTACT
Jens Bak-Holder Tel.: +45 21 28 58 32Investor Relations Manager E-mail: [email protected]
INFORMATION ON THE GROUP
AGM Q1 Q2 Q3 FY

FORWARD-LOOKING STATEMENTS
This Annual Report contains forward-looking statements, including statements regarding the Group’s future operating profit, financial position, inventory, cash flows, group and brand strategies as well as plans for the future. Forward-looking statements include, without limitation, any statement that may predict, indicate or imply future results, performance or achievements, and may contain the words “believes”, “expects”, estimates”, “projects”, “plans”, anticipates”, “continues” and “intends” or any variations of such words or other words with similar meaning. The statements are based on Management’s reasonable expectations and forecasts at the time of disclosure of the Annual Report. Any such statements are subject to risks and uncertainties and a number of different factors, of which many are beyond IC Group A/S’ control, can mean that the actual development and actual result will differ significantly from the expectations contained in the Annual Report. Without being exhaustive, such factors include general economics and commercial factors, including market and competitive matters, supplier issues and financial issues. Accordingly, forward-looking statements should not be relied on as a prediction of actual results.
THE ENGLISH VERSION OF THE ANNUAL REPORT HAS BEEN TRANSLATED FROM DANISH. THE DANISH VERSION SHALL GOVERN FOR ALL PURPOSES AND PREVAIL IN CASE OF ANY DISCREPANCY WITH THE ENGLISH VERSION.
EDITOR: INVESTOR RELATIONS · publication: 2 SEPTEMBER 2015 · DESIGN: AMO DESIGN · PRINT: KAILOW A/S