
IBRC 2 Bridge B-20-148 on US-151 With Fiber Reinforced...
64
IBRC 2 Bridge B-20-148 on US-151 With Fiber Reinforced Polymer Reinforced Concrete Deck Contract Number: 1009-03-10 August 2002 - September 2005 Submitted by: L.C. Bank, M.G. Oliva, J.S. Russell D.A. Jacobson, M. Conachen, T. Ringelstetter, A. Spottiswoode Department of Civil and Environmental Engineering University of Wisconsin-Madison Madison, WI 53706 J. Carter, R. Henke, Alfred Benesch and Company Kenosha, WI Submitted to: Wisconsin Department of Transportation (WisDOT) DTID – Research Section ATTN: Scot Becker P.O. Box 7916 Madison, WI 53707-7916 Date: June 22, 2006 FINAL REPORT
Transcript of IBRC 2 Bridge B-20-148 on US-151 With Fiber Reinforced...

IBRC 2 Bridge B-20-148 on US-151
With Fiber Reinforced Polymer Reinforced Concrete Deck
Contract Number: 1009-03-10
August 2002 -
September 2005
Submitted by:
L.C. Bank, M.G. Oliva, J.S. Russell D.A. Jacobson, M. Conachen, T. Ringelstetter,
A. Spottiswoode Department of Civil and Environmental Engineering
University of Wisconsin-Madison Madison, WI 53706
J. Carter, R. Henke,
Alfred Benesch and Company Kenosha, WI
Submitted to: Wisconsin Department of Transportation (WisDOT)
DTID – Research Section ATTN: Scot Becker
P.O. Box 7916 Madison, WI 53707-7916
Date: June 22, 2006
FINAL REPORT


i
Disclaimer This research was partially funded through the Wisconsin Department of Transportation under Project #1009-03-10. The contents of this report reflect the views of the authors who are responsible for the facts and the accuracy of the data presented herein. The contents do not necessarily reflect the official views of the Wisconsin Department of Transportation or the Federal Highway Administration at the time of publication. This document is disseminated under the sponsorship of the Department of Transportation in the interest of information exchange. The United States Government assumes no liability for its contents or use thereof. This document does not constitute a standard, specification, or regulation. The United States Government does not endorse products or manufacturers. Trade and manufacturers’ names appear in this report only because they are considered essential to the object of the document.

ii
Acknowledgements The authors would like to acknowledge the support and contributions of the following individuals without whom the research would not have been successfully completed: Stan Woods, Gerry Anderson, and Bao Tran from the Wisconsin Department of Transportation John Hooks and Tom Strock from the Federal Highway Administration Bruce Nelson and Dennis McMonigal from Strongwell Dan Rosolack from the County Materials Corporation in Eau Claire Antonio Nanni, Fabio Matta, Nestore Galati, and Eli Hernandez from the University of Missouri-Rolla Bill Lang and John Dreger at UW Structures and Materials Testing Laboratory UW undergraduates and graduate students Aaron Monroe, Brian Girgen, Lab Charles, Chad Mertz, Virgil Abloh, Adam Berg, Nathan Klett, Scott Markowski, Andrew Kuether, Robbie Sivak, Aaron Flouro, George Dale, Eric Baker, Blair Hildahl and Randy Kolinske.

iii
Technical Report Documentation Page 1. Report No. IBRC-002
2. Government Accession No.
3. Recipient’s Catalog No
4. Title and Subtitle Bridge B-20-148 on US-151 with Fiber Reinforced Polymer Reinforced Concrete Deck
5. Report Date May 31, 2006 6. Performing Organization Code
7. Authors L. C. Bank, M. G. Oliva, J. S. Russell, D Jacobson, M. Conachen, T.Ringelstetter, A. Spottiswoode, J. Carter, R. Henke.
8. Performing Organization Report No. IBRC-002
9. Performing Organization Name and Address Department of Civil and Environmental Engineering University of Wisconsin-Madison Madison, WI 53706
10. Work Unit No. (TRAIS) 11. Contract or Grant No. 1009-03-10
12. Sponsoring Agency Name and Address Wisconsin Department of Transportation 4802 Sheboygan Avenue Madison, WI 53707-7965
13. Type of Report and Period Covered Final Report (Aug 2002 – Sept 2005) 14. Sponsoring Agency Code 04-08-02-00-00
15. Supplementary Notes This research was funded by the Wisconsin DOT through the FHWA Innovative Bridge Research & Construction Program. Wisconsin DOT Contact: Scot Becker. 16. Abstract In this research project the use of an innovative modular three-dimensional fiber-reinforced polymer (FRP) grating reinforcement system as a viable method of reinforcing concrete bridge decking was examined. Laboratory tests were conducted as a way to validate the FRP grating-reinforced deck design of a Wisconsin state-owned bridge structure. The University of Wisconsin-Madison (UW) teamed up with the Wisconsin Department of Transportation (WisDOT) and a private bridge engineering/consulting firm to implement a modular FRP reinforcement system in one of the State’s bridge decks in an effort to increase the long-term durability of the bridge structure and expedite the construction process. A specification was developed that allowed for competitive bidding from multiple manufacturers. During the construction, quality control reports were provided by the manufacturer as well as independent quality assurance tests by the University of Wisconsin. The case study bridge, utilizing FRP reinforcement, was constructed along side a twin control bridge fabricated with conventional epoxy-coated rebar. The construction process was carefully monitored and documented for a comprehensive constructability analysis that considers labor efforts and material costs. After construction was complete, a full scale load test was conducted by the University of Missouri Rolla in order to benchmark the performance of the two bridges for comparison with a future five year study. Construction of the De Neveu Creek Bridge (B-20-148) was successfully completed in April of 2004.
17. Key Words Bridges, concrete, three-dimensional fiber reinforced polymer (FRP) grating system, material specification, load testing
18. Distribution Statement No restriction. This document is available to the public through the National Technical Information Service, 5285 Port Royal Road, Springfield, VA 22161
19. Security Classif. (of this report) Unclassified
19. Security Classif. (of this page) Unclassified
20. No. of Pages 54
21. Price
Form DOT F 1700.7 (8-72) Reproduction of completed page authorized

iv
Executive Summary Bridge B-20-148 on US-151 with Fiber Reinforced Concrete Deck Project Summary In this research project the use of an innovative modular three-dimensional fiber-reinforced polymer (FRP) grating reinforcement system as a viable method of reinforcing concrete bridge decking was examined. Laboratory tests were conducted as a way to validate the FRP grating-reinforced deck design of a Wisconsin state-owned bridge structure. The University of Wisconsin-Madison (UW) teamed up with the Wisconsin Department of Transportation (WisDOT) and a private bridge engineering/consulting firm to implement a modular FRP reinforcement system in one of the State’s bridge decks in an effort to increase the long-term durability of the bridge structure and expedite the construction process. A specification was developed that allowed for competitive bidding from multiple manufacturers. During the construction, quality control reports were provided by the manufacturer as well as independent quality assurance tests by the University of Wisconsin. The case study bridge, utilizing FRP reinforcement, was constructed along side a twin control bridge fabricated with conventional epoxy-coated rebar. The construction process was carefully monitored and documented for a comprehensive constructability analysis that considers labor efforts and material costs. After construction was complete, a full scale load test was conducted by the University of Missouri Rolla in order to benchmark the performance of the two bridges for comparison with a future five year study. Construction of the De Neveu Creek Bridge (B-20-148) was successfully completed in April of 2004. Background FRP is of great interest to State and Federal transportation agencies for its potential to mitigate corrosion of the reinforcement in reinforced concrete bridge decks exposed to highly corrosive environments (such as road de-icing salts or marine environments) and prolong the lifespan of bridge structures. The research program is supported by the FHWA and was awarded funding through the FHWA’s Innovative Bridge Research and Construction (IBRC) Program. Process The research process consisted of laboratory testing and subsequent analysis to investigate the structural adequacy, deck failure modes, serviceability, fatigue resistance, and overall behavior of the FRP-reinforced deck under simulated AASHTO design truck wheel loads. A series of five full-scale prototype deck slabs with varying support, span, and edge restraint configurations were tested under concentrated loading. As a secondary study, a series of three beams were tested in a two-span continuous configuration to determine one-way bending and negative moment capacity of the deck system. Based on results from ultimate capacity tests, empirical models for predicting the shear capacity of the FRP grating-reinforced deck system were recommended for design. In the construction process specifications were developed against which the quality control results submitted by the manufacturer were compared. After construction of the bridges, load testing was carried out to serve as a base line for a long-term monitoring program. Findings and Conclusions
• The use of an innovative, non-metallic, and modular FRP double-layer bi-directional grating reinforcement system as a structurally safe method of reinforcing the concrete De Neveu Creek Bridge was successfully demonstrated through a series of laboratory tests and subsequence analysis.
• Laboratory tests demonstrated that the use of a prefabricated modular three-dimensional FRP grid system
with integrated chairs is a viable and rapidly installed reinforcement system. The series of ultimate capacity tests performed on deck slab specimens used a patch load that simulated the tire contact area of an HS-20 design truck double wheel illustrated that punching shear was the critical failure mode. In comparing the test capacities of the slab specimens to service loads associated with the AASHTO HS-20

v
design truck (16 kips), factors of safety for the FRP-reinforced deck system were calculated to be approximately 7.5 for the simply-supported slab specimens
• The constructability analysis illustrated that the FRP cages could be placed faster than the epoxy-coated
rebar. The labor effort for the optimized placement of the FRP cages was 93 labor hours and 13 hours of crane operation. The epoxy-coated steel required 275 labor hours and 34 hours of crane operation. Despite the savings found in the field labor efforts, according to the line item bid prices, the overall cost of the FRP grid was approximately six times the cost of the epoxy-coated steel.
• The development of the material specification was a critical step in the success of the project. The
material specification produced for this project accomplished this by tabulating requirements for material and physical properties for each component along side the ASTM tests to be used to determine the tabulated properties.
• The in-situ load testing confirmed a good response of the bridges at serviceability loads, since the
experimental deflections were found to be smaller than the theoretical values determined according to the design provisions (AASHTO, 1996).
Recommendations for Action
• Consider more progressive deck designs. This is especially worthwhile in bridge designs having wide flange girders spaced very closely together (such as De Neveu Creek Bridge) where the current design is highly conservative. This optimizing could reduce the up-front costs of the FRP system.
• Perform additional experiments to test alternate splice methods between the FRP reinforcement cages
and alternate shear connectors.
• Establish methods to create a realistic FRP reinforced bridge life-time cost analysis. The analysis could be used to directly compare FRP reinforced bridge decks to conventional steel reinforced bridge decks.
• Heightened competition in the bid process would lower the cost of the overall product. The specification
written in this report allowed for a competitive bid, however due to the novel nature of the system, the contractor selected to use the manufacturer that produced the specimens used in the laboratory testing at the UW-Madison. Also, the economy of size would bring the cost of the system down. The manufacturer suggested that loosening the quality control on properties such as glass transition temperature could reduce the costs of outside testing.
• Work with the contractor to develop a lifting plan such that the crane usage can be optimized, while
ensuring that the FRP grids are not damaged during the lifting.
• Conduct additional research into the use of stay-in-place formwork systems to decrease the bridge deck construction time.
• Continue long-term monitoring of the prototype bridge and its twin for comparison to determine the
long-term performance of the FRP reinforced bridge deck. The Wisconsin DOT contact for more information on this research activity is: Mr. Scot Becker Wisconsin Department of Transportation 4802 Sheboygan Avenue Madison, WI 53707-7965
vi
Table of Contents
1 Introduction......................................................................................................................................................... 1 1.1 Objectives ....................................................................................................................................................3 1.2 Scope ...........................................................................................................................................................3
2 Background Review............................................................................................................................................ 4 2.1 Background..................................................................................................................................................4 2.2 FRP Materials ..............................................................................................................................................4 2.3 Fiber-Reinforced Polymer Reinforcing System...........................................................................................4
3 Design Phase Activities ...................................................................................................................................... 5 3.1 Laboratory Testing of Prototype Deck Panels .............................................................................................5 3.2 Details of Test Specimens............................................................................................................................6 3.3 Slab Testing Procedures and Results (specimens 1-3, 7 and 8) ...................................................................8
3.3.1 Slab Testing Procedures (specimens 1-3, 7 and 8).............................................................................8 3.3.2 Slab Testing Results (specimens 1-3, 7 and 8).................................................................................10
3.4 Beam Testing Procedures and Results (Specimens 4-6)............................................................................12 3.4.1 Beam Testing Procedures (Specimens 4 -6).....................................................................................12 3.4.2 Beam Testing Results (Specimens 4 -6)...........................................................................................13
3.5 Predicted Capacities versus Actual Performance.......................................................................................15 3.5.1 Slab Punching Shear Capacity .........................................................................................................15 3.5.2 Beam Shear Capacity .......................................................................................................................19
3.6 Conclusions of Design Phase Activities ....................................................................................................19 4 Construction Phase Monitoring......................................................................................................................... 21
4.1 Introduction ...............................................................................................................................................21 4.2 Material Specification Compliance............................................................................................................21 4.3 Specifications and Special Provisions .......................................................................................................21
4.3.1 Special Provisions ............................................................................................................................21 4.3.2 Specifications ...................................................................................................................................22
4.4 Quality Assurance Tests ............................................................................................................................22 4.5 Quality Assurance Testing Report .............................................................................................................22 4.6 Constructability Analysis...........................................................................................................................22
4.6.1 Construction Observations / Description..........................................................................................22 4.6.2 Cost Analysis – FRP Components ...................................................................................................23 4.6.3 Overall Cost of the Bridges..............................................................................................................24
4.7 Load Testing ..............................................................................................................................................25 4.7.1 Load Trucks .....................................................................................................................................26
4.8 Finite Element Method Simulations ..........................................................................................................27 4.9 Conclusions of Construction Phase Activities ...........................................................................................29
5 Follow on Design Studies ................................................................................................................................. 30 5.1 Introduction ...............................................................................................................................................30 5.2 SIP Formwork Optimization Research ......................................................................................................30 5.3 Field Implementation of Gridform System – Greene County, MO ...........................................................31 5.4 Conclusions ...............................................................................................................................................32
6 Conclusions and Recommendations.................................................................................................................. 33 6.1 Conclusions ...............................................................................................................................................33 6.2 Recommendations......................................................................................................................................33
Appendix A: Special Provisions for Modular 3-D FRP Reinforcement Cage ..................................................... 38 Appendix B: Material Specification for FRP Materials ....................................................................................... 50 Appendix C: Selected Bridge............................................................................................................................... 53

vii
List of Tables Table 3-1 Test specimen details .................................................................................................................................6 Table 3-2 Initial cracking loads, deflections at service loads, and deflections at ultimate for slab Specimens 1-3, 7,
and 8.................................................................................................................................................................11 Table 3-3 A summary of ultimate capacity test results for Specimens 1-3, 7, and 8. ..............................................11 Table 3-4 Span Factors of safety relative to service loads for Specimens 1-3, 7, and 8 ..........................................12 Table 3-5 Summary of span deflections at service and ultimate loads during the ultimate capacity tests on
Specimens 4-6. .................................................................................................................................................14 Table 3-6 Summary of ultimate capacity test results for Specimens 4-6. ................................................................14 Table 3-7 Test to predicted punching shear capacity ratios for reinforcement ratio ρ1 ............................................16 Table 3-8 Test to predicted punching shear capacity ratios for reinforcement ratio ρ2 ............................................17 Table 3-9 Test to predicted punching shear capacity ratios for reinforcement ratio ρ3 ............................................17 Table 3-10 Test to predicted shear capacity ratios for select empirical models intended for FRP-reinforced
concrete design.................................................................................................................................................19 Table 4-1 Breakdown of Manufacturing Costs of FRP Cages .................................................................................24 Table 4-2 Line Item Pricing of Bridge Deck Components for B-20-148 and B-20-149..........................................24 Table 4-3 Comparison of Total Labor and Equipment Hours..................................................................................25 Table A-7-1 Reporting Requirements for Constituent Materials of FRP cage ........................................................42 Table A-7-2 Limiting Physical and Mechanical Properties for FRP Cage Materials ..............................................43 Table B-8-1 Comparison of QA Results for GV-1 with Specified Requirements and Strongwell Results .............50 Table B-8-2 Comparison of QA Results for GV-2 with Specified Requirements and Strongwell Results .............51 Table B-8-3 Comparison of QA Results for GV-3 with Specified Requirements and Strongwell Results .............52

viii
List of Figures Figure 1-1 Final Placement of FRP Cage (northbound passage) ...............................................................................1 Figure 1-2 Installation of Rebar Joining Parapet to the FRP Cage (northbound passage) .........................................2 Figure 1-3 Measuring Load Test Deflections on the completed bridge B-20-148 using Reflective Prisms and a
Total Station.......................................................................................................................................................2 Figure 2-1 Unloading of a full-size FRP bi-layer FRP reinforcement cage at the UW..............................................5 Figure 3-1 FRP cage Detail, Components Labeled According to Material Classifications .......................................6 Figure 3-2 Typical cross-section of FRP reinforcement system within a concrete deck. ..........................................7 Figure 3-3 Overlapping splice region of the FRP reinforcement cage.......................................................................7 Figure 3-4 Wide flange 54W girder supports after being cut through the webs. Notice the epoxy coated stirrups
and surface-roughened region down the center of the flanges. ..........................................................................8 Figure 3-5 Elevation view of the simply-supported test set-up used for Specimens 1-3. ..........................................9 Figure 3-6 Flexurally-restrained test configuration for Specimen 8 (supported by 54W girder flanges) ................10 Figure 3-7 Ultimate capacity load versus displacement plots for Specimens 1-3, 7, and 8. ....................................12 Figure 3-8 Two-span five-point bending configuration used for the flexural tests performed on beam Specimens 4-
6. Specimen 4 is shown...................................................................................................................................13 Figure 3-9 Elevation view of the two-span test set-up used for the testing of beam Specimens 4-6. ......................13 Figure 3-10 Post-failure photo showing the shear failure between the central support and east load actuator.
Negative moment flexural cracking over the central support can also be seen. ...............................................14 Figure 3-11 Ultimate capacity load versus LVDT displacement for Specimens 4-6. ..............................................15 Figure 3-12 The proposed empirical model for punching shear capacity provides a good fit for the IBRC and
Bank/Xi test capacities. ....................................................................................................................................18 Figure 4-1 FRP Cage Assembly at Strongwell Manufacturing Plant.......................................................................21 Figure 4-2 Placement of Bulb Tee Girders ..............................................................................................................23 Figure 4-3 Remaining work on FRP Cage Placement after First Day of Placement................................................23 Figure 4-4 Targets Mounted on Bridge Girders.......................................................................................................25 Figure 4-5 Plan View of Strain Gauge and Prism Locations on B-20-148 FRP ......................................................26 Figure 4-6 Cross Section at Mid-span Showing Strain Gauge Profile .....................................................................26 Figure 4-7 B-20-148 FRP, Transverse Deflections at Mid-span, Stops 1-4.............................................................27 Figure 4-8 Finite Element Model of Bridge B-20-148.............................................................................................27 Figure 4-9 Comparison between FEM Model and Experimental Results (Test 1 to 4) ...........................................28 Figure 4-10 Comparison between FEM Model and Experimental Results (Vertical Deflections at Midspan, Test 1
to 4) ..................................................................................................................................................................29 Figure 5-1 SafPlank panel reinforcement detail.......................................................................................................30 Figure 5-2 Gridform reinforcement detail (a) I-bar, (b) Cross-rods, (c) Shear connector, (d) FRP Plate. ...............31 Figure 5-3 Existing underside of Greene County Bridge (Matta, 2005) ..................................................................31 Figure 5-4 Installation of Gridform panels (Matta, 2005)........................................................................................32 Figure 5-5 Greene County Bridge - completed structure .........................................................................................32 Figure A-0-1 Schematic of test assembly for measuring performance ....................................................................45 Figure A-0-2 A deflection limit is provided for the top surface of the FRP cage under vertical loading. ...............45 Figure A-0-3 Load application locations for lateral load test assembly. ..................................................................46 Figure A-0-4 Acceptance criteria for lateral load test. .............................................................................................46 Figure A-0-5 Loading on a sub-assembly for the in-plane racking test. .................................................................47 Figure C-0-1 Plan view of bridge B-20-148 (FRP)..................................................................................................53 Figure C-0-2 Plan view of bridge B-20-149 (steel) .................................................................................................54

1
1 Introduction
The Wisconsin Department of Transportation (WisDOT) proposed, with the support of the Federal Highway Administration’s (FHWA) Innovative Bridge Research and Construction (IBRC) program, to use a modular three-dimensional Fiber Reinforced Polymer (FRP) pultruded grid reinforcement system in the construction of a concrete bridge deck on a major bridge structure. This proposal was due to the fact that experimental studies have been conducted over the past several years using pultruded FRP materials as reinforcement in concrete and results have shown that the reinforcement system is a viable and perhaps advantageous alternative to conventional reinforcement for concrete bridge structures. The WisDOT sought to investigate the FRP-reinforced bridge deck system in order to provide bridge life-cycle savings to the taxpayers of Wisconsin by reducing construction times and increasing long-term durability of the bridge system (Bank et al, 2005).
As a result, the WisDOT teamed up with the University of Wisconsin-Madison and bridge engineering/consulting firm Alfred Benesch and Company to investigate the advantages of using a modular FRP reinforcement system in one of the State’s bridge decks. The research program consisted of four primary phases: develop an efficient yet structurally adequate FRP three-dimensional reinforcement cage, investigate the strength and serviceability of concrete bridge decks reinforced with this system through laboratory testing, implement the proven design in a prototype bridge deck, and as a long-term study, monitor bridge performance and durability.
The modular three-dimensional FRP reinforcement cage systems were intended to be pre-fabricated, pre-sized, and pre-assembled off-site (at the manufacturer’s facility) and delivered to the bridge site prepared for rapid placement. This considerably reduced construction time as no tying of reinforcing bars for deck reinforcement was necessary. Studies by the WisDOT determined that improvements to the US 151 corridor near the city of Fond du Lac, Wisconsin were needed to reduce traffic congestion, improve traffic flow, and reduce crash rates. There were eight segments of highway planned for renovation between 2002 and 2008. The proposed prototype bridge, which this report describes, is part of a new state-owned bridge structure over De Neveu Creek on US Highway 151. The bridge serves as the northbound passage in a twin bridge structure, Figure 1-1 illustrates the construction of the FRP reinforced bridge. Its southbound counterpart was constructed with a conventional steel-reinforced concrete bridge deck.
Figure 1-1 Final Placement of FRP Cage (northbound passage)
Each bridge of the twin bridge system was a skewed and sloped single-span, two-lane structure with a span of 130’ (39.65m) and a width of nearly 45’ (13.73m). Both bridge decks were 8” (203mm) in thickness and supported in a partially composite fashion by 54” (137.2cm) deep prestressed concrete bulb tee girders spaced at 6’5” (1.96m) on center. A haunch between the girder and the bridge deck measured between 1¼” to 3” (31.75mm

2
to 76.2mm). The support width of the girder top flange was 48” (1.22m), so while the spacing of the supports were 6’5” (1.96m), the deck clear spans were only 2’5” (73.7cm). Exterior girder bridge deck overhangs and parapets on the northbound bridge were constructed from conventionally formed and steel reinforced concrete since federally approved FRP parapets are unavailable, as seen in Figure 1-2.
Figure 1-2 Installation of Rebar Joining Parapet to the FRP Cage (northbound passage)
Upon completion of the bridge decks, load tests were performed on both the steel and FRP reinforced decks, (Figure 1-3). The results obtained were used to compare the performance of the FRP deck to that of the conventional steel reinforced deck. Each bridge was tested using fully loaded H-20 dump trucks positioned to induce the largest deflections. A follow on design study was performed to explore the possible savings of integrating the double FRP grid layer with a stay-in-place form to eliminate the need for temporary formwork.
Figure 1-3 Measuring Load Test Deflections on the completed bridge B-20-148 using Reflective Prisms and
a Total Station

3
1.1 Objectives Objectives of the project included: investigating the adequacy of deck design for typical bridge service loading, identifying FRP-reinforced concrete bridge deck limit states, understanding deck failure modes, developing appropriate distribution factors for FRP reinforcement cage reinforced bridge decks, and assessing the fatigue performance of the FRP reinforcement cage system. The main objective also included a realistic constructability analysis to compare the cost-effectiveness of an innovative FRP deck system to a conventional system when two bridges of identical design and construction are compared side-by-side. The cost-effectiveness was subdivided into the construction cost of the material and labor. A further objective was to demonstrate that a load-testing program and a long-term monitoring program could be used to determine realistic in-situ comparisons between an innovative FRP bridge deck system and a conventional concrete system. The final objective was to demonstrate that a team consisting of State DOT engineers, private bridge design consulting engineers, vendors of proprietary FRP products, and university researchers can work together in a synergistic manner to develop innovative analytical methods, experimental procedures, designs, specifications and construction practices using FRP materials for highway bridge engineering. 1.2 Scope The University of Wisconsin’s involvement in the IBRC project to investigate the proposed FRP reinforcement cage system can be split into three distinct phases: Phase I: The first phase was the preliminary engineering phase during which researchers at the UW worked closely with design engineers at Alfred Benesch and Company and an FRP manufacturer Strongwell, Inc. to develop a three-dimensional modular FRP reinforcement system, and subsequently, develop design procedures for a FRP-reinforced bridge deck. After a working deck design was completed, laboratory testing was performed at the University of Wisconsin Structures and Materials Testing Laboratory to validate the design, confirm the predicted behaviors of the FRP-reinforced deck system, and develop models to predict deck capacities.
Phase II: The second phase consisted of evaluating the performance of the FRP materials produced for use in the actual De Neveu Creek Bridge construction. The UW had been charged with developing an AASHTO type material specification and quality control testing program for FRP materials used in highway construction. Quality assurance testing of all individual FRP reinforcement components and performance testing of the overall FRP reinforcement cage system, to consider reinforcement cage integrity, were conducted per this specification. In addition, UW researchers performed a real-time constructability study comparing cost-effectiveness of the FRP-reinforced deck with the conventional reinforced deck. Post-construction, non-destructive load testing was subsequently performed on the De Neveu Creek Bridge to verify design assumptions and assess the effective load distribution widths in the deck.
Phase III: The final phase will include a long-term performance monitoring program. Over the next five years, researchers at Marquette University in Milwaukee will conduct visual inspection and nondestructive testing. The primary goal of this monitoring will be to determine if there is a difference in the performance of the FRP and conventional bridge deck reinforcement system.

4
2 Background Review
2.1 Background In its 2003 Annual Report, the U.S. Department of Transportation’s Bureau of Transportation Statistics (BTS) estimated highway transportation related final demand to make up about 11% of the gross domestic product (US BTS, 2004). Highway bridges are a vital component of this transportation infrastructure. According to the Federal Highway Administration’s (FHWA) most recent National Bridge Inventory, there are more than 592,000 bridges currently open to traffic in the U.S. Given the importance of the transportation infrastructure, it is alarming to discover that nearly 30% of those bridges are considered structurally deficient or functionally obsolete by the FHWA (FHWA, 2004). In Wisconsin alone, 2,650 bridges out of 13,651 total bridges have been categorized as structurally deficient and/or functionally obsolete. Corrosion of steel is a major cause of deterioration in structurally deficient bridges due to the vulnerability of steel when exposed to high concentrations of chlorides such as that used in snow and ice removal or present in marine environments (FHWA, 2004, Koch et al., 2001, and Charleson et al., 1997). 2.2 FRP Materials Fiber reinforced polymer (FRP) composites have shown potential to alleviate the problems related to durability. Bridge decking is one promising application for which FRP composites would be advantageous because of the FRP’s resistance to corrosion. The long-term durability offered by an FRP deck reinforcement system could potentially extend the service life of the bridge deck and reduce maintenance costs, thereby improving life cycle cost efficiency. The construction advantages of using a modular FRP reinforcement system are also of interest for future bridges. All FRP deck reinforcement cages can be completely fabricated by a manufacturer and delivered ready for placement. Reductions in construction labor costs are expected due to elimination of reinforcement bar placing and tying. In addition, use of this system is expected to shorten the overall time of construction, and as a result, minimize economic loss due to traffic downtime. 2.3 Fiber-Reinforced Polymer Reinforcing System One of the criteria of the IBRC Program is to utilize readily available construction materials in a new and innovative manner (Bank en al, 2005). Thus, the UW proposed a modular bi-layer grid reinforcement cage system that was a unique variation of commonly produced single-layer FRP grating, modified in ways that still mesh with current manufacturing/fabrication processes. A primary advantage of this deck solution, compared to other FRP deck solutions, was that it fit in more readily with current bridge construction methods and was less costly than other FRP deck solutions (such as carbon fiber NEFMAC grid reinforcement or FRP pultruded composite decks). Each layer of the double layer reinforcement system was composed of a bi-directional FRP grating (or grid) panel. The grating panels consisted of pultruded 1.5” deep “I” bars spaced 4” on center as the main reinforcement (oriented transversely with respect to girder supports and traffic) and pultruded locking cross-rods, also spaced 4” on center and perpendicularly oriented to the I-bars, as longitudinal (parallel with girders and traffic) and temperature/shrinkage reinforcement. The size of the individual FRP cages was specified to be 84” in width by 510” in length (see Figure 2-1). The FRP reinforcement materials proposed for this research were composed of vinyl ester thermosetting resins and E-glass reinforcement fibers.

5
Figure 2-1 Unloading of a full-size FRP bi-layer FRP reinforcement cage at the UW.
3 Design Phase Activities
3.1 Laboratory Testing of Prototype Deck Panels The purpose of the design phase was to validate the design for the FRP grid system through laboratory testing and hence, confirm the predicted behaviors of the FRP-reinforced deck system. Punching shear was recognized as the critical failure mode of bridge decks that were transversely reinforced and continuous over longitudinal girders (Perdikaris et al., 1989). Punching shear capacities of five deck panels (slabs) which had varying dimensions, support conditions, and end restraint conditions; were determined. No prior punching shear tests had been performed on deck systems of this type. To demonstrate acceptable performance for a service load condition, each of the five slabs intended for ultimate capacity testing were first subjected to a simulated design truck dual-wheel service load. In addition, three beams were tested to determine the flexural capacity of the FRP-reinforced bridge deck in a negative moment region. The UW worked with a precast concrete company, County Prestress Corporation of Eau Claire, WI, to produce the test specimens. All but one of the test specimens was cast outdoors at the County Prestress plant. One was prepared and cast indoors at the University of Wisconsin-Madison’s Structures and Materials Testing Laboratory. Each specimen constructed for laboratory testing was a full scale representation of the proposed De Neveu Creek bridge deck design. All test specimens were 8” in thickness, the specimen details can be seen in Table 3-1.
One slab (Specimen 3) and one beam (Specimen 5) specimen utilized a “fabric” lay-up in its main I-bar reinforcement, while the other specimens contained I-bars with the “standard” lay-up. Based on comparative performance through the service load range and the ultimate capacities of the test specimens, the “fabric” FRP I-bar lay-up did not provide any significant strength or stiffness advantage over the “standard” I-bar lay-up. Also considering the higher cost of the fabric lay-up I-bars, their unexceptional structural performance in comparison to the standard bars did not justify the additional expenditure. For more details on FRP lay-ups, refer to Ozel (2002).

6
Table 3-1 Test specimen details Specimen
ID Type Width Length Reinforcement Type (Cage ID)
Span Configuration Proposed Testing
Service Load PerformanceAccelerated Fatigue
Ultimate CapacityService Load Performance
Deformed SurfaceUltimate Capacity
Service Load PerformanceDeformed SurfaceUltimate Capacity
Flexural Performance(Initial Cracking)
Negative Moment CapacityFlexural Performance
(Initial Cracking)Negative Moment Capacity
Flexural PerformanceAccelerated Fatigue
Negative Moment CapacityService Load Performance
Ultimate Capacity
Service Load PerformanceUltimate Capacity
3' 14' Standard (S3-3) Two-Span
7 Slab 6'-6" 14' Standard (S2-1) Simulated Multiple Span
6 Beam
Simulated Multiple SpanStandard (S1-3)14'6'-6"Slab8
5 Beam 3' 14' Fabric (S3-1) Two-Span
Two-SpanStandard (S3-2)14'3'Beam4
3 Slab 6'-6" 7'-6" Fabric (S1-1) Simply Supported
2 Slab 6'-6" 7'-6" Standard (S1-2) Simply Supported
Simply SupportedStandard (S1-4)7'-6"6'-6"Slab1
3.2 Details of Test Specimens The positions of the FRP I-bar and cross rod pieces in each grid layer were maintained by intersections of the grid components themselves. The roughly ovular cross-rods penetrated through the webs of the I-bars; the cross-rods, which were larger than the holes in the I-bar webs, were notched at the intersection in order to fit through the web and provide a mechanical “lock”. Figure 3-1 illustrates an FRP cage detail.
Figure 3-1 FRP cage Detail, Components Labeled According to Material Classifications
GV-1 Cross Rod Component
GV-2 Primary I bar Component
GV-3 Shear Connection Component

7
Each individual cross rod was composed of three separate pieces. Two notched “spacer” components were placed through and around the I-bar webs. A third “wedge” component was pushed between the two spacer pieces to spread the notched pieces outward and tight against the perimeters of the holes in the I-bar webs and lock the bars into position. The cross-rod pieces were fused together with an epoxy to make a single cross-rod, and in the process, each I-bar and cross-rod intersection also became epoxied. A typical cross-section of the reinforcement system is shown in Figure 3-2.
Figure 3-2 Typical cross-section of FRP reinforcement system within a concrete deck.
The modular “pick and place” nature of the FRP reinforcement cage system proposed for the De Neveu Creek Bridge construction limited the overall size of each cage (see Figure 3-3). Dimensions were governed by that which could be delivered on a standard flatbed semi-truck trailer and easily hoisted by crane without damaging the grid materials in any way. A one-foot overlap splice was selected as a means of joining two adjacent FRP reinforcement cages.
Figure 3-3 Overlapping splice region of the FRP reinforcement cage.
In order to best represent the actual bridge support conditions, 54” wide flange precast bulb tee concrete girders, just like those specified for the De Neveu Creek Bridge project, were used as supports for test specimen 8 (see Figure 3-4 and Figure 3-6). Since FRP reinforcement cage apertures and girder stirrup locations did not coincide, the stirrups had to be cut and individually bent to allow the FRP grid system to be placed. No haunch was present between the girder flanges and the concrete slab. In the construction phase, the combination of the haunch and modified girder stirrups eliminated this problem.

8
Figure 3-4 Wide flange 54W girder supports after being cut through the webs. Notice the epoxy coated
stirrups and surface-roughened region down the center of the flanges.
A Wisconsin DOT Grade D, Size 1 (¾” max. aggregate size) concrete design mix, having a 28-day target compressive strength of 4,000 psi, was specified for all test specimens. 3.3 Slab Testing Procedures and Results (specimens 1-3, 7 and 8) All laboratory testing was performed in the Structures and Materials Testing Laboratory (SMTL) at the University of Wisconsin-Madison (1341 Engineering Hall) using a MTS 110 kip and Miller 200 kip capacity closed-loop servo hydraulic actuator.
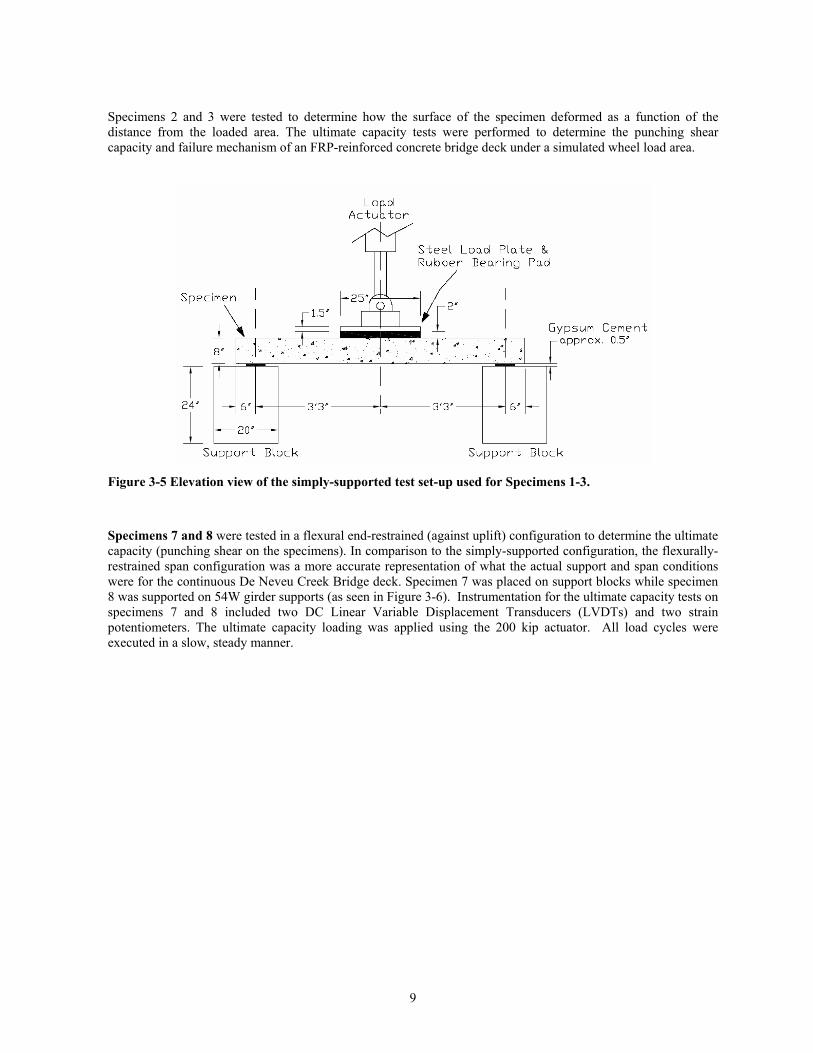
3.3.1 Slab Testing Procedures (specimens 1-3, 7 and 8) Load was applied to the center of each slab specimen using a 1.5” thick steel load plate, which was attached to a hydraulic load actuator head by bolts welded to the load plate. The load area of the plate was intended to represent the contact area of a dual-tire truck wheel. The length and widthwise dimensions of the plate were selected to be 10”x 25”, based on a length to width ratio suggested by AASHTO (1996) Article 3.30 and the HS-20 design truck wheel load.
Specimens 1-3 were tested in a simply-supported configuration (see Figure 3-5). Ultimate capacity (punching shear) tests, deformed surface tests, and a fatigue test were performed on these specimens. The primary objectives of the slab tests were to investigate the performance of the deck at service loads, the long-term fatigue resistance of the deck, how effectively the FRP reinforcement system distributes load, mode of failure, and the ultimate capacity of the deck system. All of the test specimens were tested to failure to determine the ultimate load and failure mechanism for each specimen.
Specimen 1 was tested to investigate the long-term durability at service loads for the FRP-reinforced concrete bridge deck. Instrumentation for the fatigue portion of the test consisted of one DC Linear Variable Displacement Transducer (LVDT). The accelerated fatigue cycle loading peaked at 20.4 kips and bottomed out at 4.4 kips. The 16 kip range between the peak and valley loads was chosen to represent the AASHTO HS-20 design truck wheel load (without impact). A minimum 4.4 kips was maintained during the fatigue cycling to ensure that no reversal stresses were experienced in the specimens. The load cycles were completed in segments of 200,000 cycles. Ten segments were performed to simulate the fatigued condition of a bridge deck, which put the total number of fatigue cycles at two million.
9
Specimens 2 and 3 were tested to determine how the surface of the specimen deformed as a function of the distance from the loaded area. The ultimate capacity tests were performed to determine the punching shear capacity and failure mechanism of an FRP-reinforced concrete bridge deck under a simulated wheel load area.
Figure 3-5 Elevation view of the simply-supported test set-up used for Specimens 1-3.
Specimens 7 and 8 were tested in a flexural end-restrained (against uplift) configuration to determine the ultimate capacity (punching shear on the specimens). In comparison to the simply-supported configuration, the flexurally-restrained span configuration was a more accurate representation of what the actual support and span conditions were for the continuous De Neveu Creek Bridge deck. Specimen 7 was placed on support blocks while specimen 8 was supported on 54W girder supports (as seen in Figure 3-6). Instrumentation for the ultimate capacity tests on specimens 7 and 8 included two DC Linear Variable Displacement Transducers (LVDTs) and two strain potentiometers. The ultimate capacity loading was applied using the 200 kip actuator. All load cycles were executed in a slow, steady manner.

10
Figure 3-6 Flexurally-restrained test configuration for Specimen 8 (supported by 54W girder flanges)
3.3.2 Slab Testing Results (specimens 1-3, 7 and 8) The failure mechanism of all slab specimens in which failure was achieved was clearly punching shear. This was not interpreted that the deck slabs experienced purely shear behavior. A large amount of flexural cracking was observed in all of the deck specimens throughout the testing, especially during the first 50-60% of applied loading. Taking this into consideration, the overall behavior of the deck slabs would best be described as a hybrid behavior in which a combination of flexural and punching shear characteristics were observed. The results can be seen in Table 3-2 and Table 3-3. The I-Bar Type “S” and “F” displayed in Table 3-3 refer to standard and fabric lay-up, described in Section 3.1. Numerous longitudinal flexural cracks formed in the spans of the simply-supported specimens and propagated upwards nearly to the top surface of the slab as the test progressed. This occurred to a lesser degree in the flexurally-restrained specimens (Specimens 7 and 8), but was accompanied by longitudinal flexural cracking on the top surface of the slab over and adjacent to the supports. The punching shear failure plane occurred through the splice region of the FRP reinforcement cage system in all slab tests for which failure was achieved. Once a punch had begun, the splice would allow the specimen to “peel” apart at that region (spliced FRP reinforcement cages were not mechanically connected).

11
Table 3-2 Initial cracking loads, deflections at service loads, and deflections at ultimate for slab Specimens 1-3, 7, and 8.
Load Deflection Load Deflection(in) (kips) (kips) (in) (kips) (in)
1 17.5 16.0 0.044 120.8 1.79
2 16.8 16.0 0.054 120.6 1.69
3 18.8 16.0 0.045 119.3 1.58
7 72 N/A *** 16.0 0.010 162.2 0.82
8 29 N/A *** 16.0 0.003 201.7 * 0.07 *
* Failure was never achieved. Capacity of load actuator was exceeded.** Live-load service deflections of Specimens 1-3 in cracked state (after initial cracking due to service + impact factored load); in the case of Specimen 1, cracked and also post-fatigue. Specimen 4 and 5 were not cracked aside from that endured during the test setup (see Chapter 6 for discussion).***Specimens 7 and 8 endured slight cracking during the test set-up, prior to any loading.
Deflections at Ultimate
72 Simply Supported
Simulated Multiple Span
Specimen ID Clear Span Span
Configuration
Initial Cracking
Load
Service Deflections **
Table 3-3 A summary of ultimate capacity test results for Specimens 1-3, 7, and 8.
Specimen ID
Slab Dimensions
Span Configuration I-Bar Type Concrete
StrengthUltimate Capacity
(ft) (psi) (kips)1 S 5507 120.8
2 S 5343 120.6
3 F 5347 119.3
7 S 4973 162.2
8 S 7407 > 201.7
Simply Supported6.5 x 7.5
* Failure was never achieved. Capacity of load actuator was exceeded.
Failure Mode
Punching Shear
Punching Shear
Punching Shear
Punching Shear
N/A *6.5 x 14 Simulated
Multiple Span
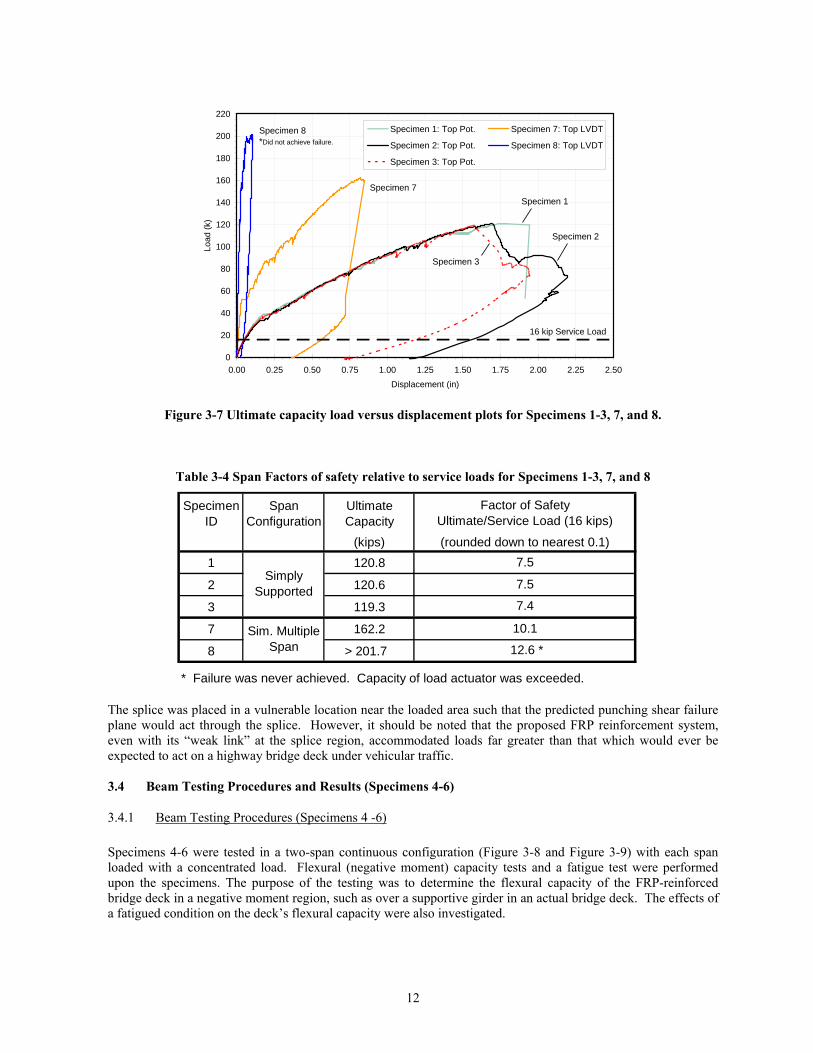
The ultimate capacity load versus displacement plots from each of the individual slab tests can be seen in Figure 3-7. The load versus displacement plots and the ultimate capacities of the simply supported slab tests (Specimens 1-3) correlated well with each other, showing excellent test repeatability. In comparison, the strength and stiffness of Specimens 7 and 8 was increased considerably when restraint was lent to the ends of the slabs. Edge restraint has been shown to enhance the failure load, even though the primary mode of failure has not changed (Hewitt and Batchelor, 1975), due to compressive membrane, or “arching”, action. Table 3-4 illustrates the factors of safety of the slab tests relative to the required service load.
12
16 kip Service Load
0
20
40
60
80
100
120
140
160
180
200
220
0.00 0.25 0.50 0.75 1.00 1.25 1.50 1.75 2.00 2.25 2.50Displacement (in)
Load
(k)
Specimen 1: Top Pot. Specimen 7: Top LVDT
Specimen 2: Top Pot. Specimen 8: Top LVDT
Specimen 3: Top Pot.
Specimen 8 *Did not achieve failure.
Specimen 7
Specimen 3
Specimen 2
Specimen 1
Figure 3-7 Ultimate capacity load versus displacement plots for Specimens 1-3, 7, and 8.
Table 3-4 Span Factors of safety relative to service loads for Specimens 1-3, 7, and 8
Specimen ID
Span Configuration
Ultimate Capacity
(kips)1 120.8
2 120.6
3 119.3
7 162.2
8 > 201.7
* Failure was never achieved. Capacity of load actuator was exceeded.
7.5
7.5
7.4
10.1
Factor of Safety Ultimate/Service Load (16 kips)
(rounded down to nearest 0.1)
Simply Supported
Sim. Multiple Span 12.6 *
The splice was placed in a vulnerable location near the loaded area such that the predicted punching shear failure plane would act through the splice. However, it should be noted that the proposed FRP reinforcement system, even with its “weak link” at the splice region, accommodated loads far greater than that which would ever be expected to act on a highway bridge deck under vehicular traffic. 3.4 Beam Testing Procedures and Results (Specimens 4-6)
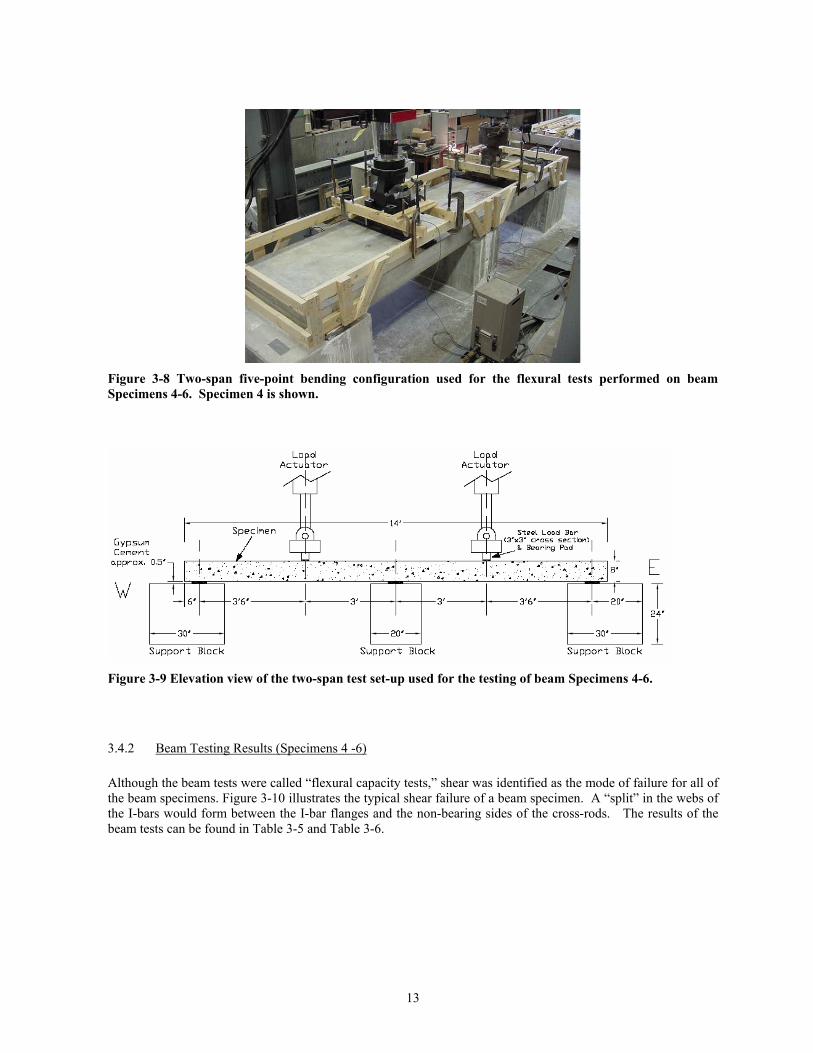
3.4.1 Beam Testing Procedures (Specimens 4 -6) Specimens 4-6 were tested in a two-span continuous configuration (Figure 3-8 and Figure 3-9) with each span loaded with a concentrated load. Flexural (negative moment) capacity tests and a fatigue test were performed upon the specimens. The purpose of the testing was to determine the flexural capacity of the FRP-reinforced bridge deck in a negative moment region, such as over a supportive girder in an actual bridge deck. The effects of a fatigued condition on the deck’s flexural capacity were also investigated.
13
Figure 3-8 Two-span five-point bending configuration used for the flexural tests performed on beam Specimens 4-6. Specimen 4 is shown.
Figure 3-9 Elevation view of the two-span test set-up used for the testing of beam Specimens 4-6.
3.4.2 Beam Testing Results (Specimens 4 -6) Although the beam tests were called “flexural capacity tests,” shear was identified as the mode of failure for all of the beam specimens. Figure 3-10 illustrates the typical shear failure of a beam specimen. A “split” in the webs of the I-bars would form between the I-bar flanges and the non-bearing sides of the cross-rods. The results of the beam tests can be found in Table 3-5 and Table 3-6.

14
Figure 3-10 Post-failure photo showing the shear failure between the central support and east load
actuator. Negative moment flexural cracking over the central support can also be seen.
Table 3-5 Summary of span deflections at service and ultimate loads during the ultimate capacity tests on Specimens 4-6.
Ave. Load West Span East Span Ave. Load West Span East Span(in) (kips) (in) (in) (kips) (in) (in)
4 16.03 0.062 0.043 67.7 0.942 0.933
5 16.04 0.077 0.075 68.1 0.93 0.904
6 16.01 0.058 0.048 85.6 0.947 0.953
Span Configuration
Service Deflections * Deflections at Ultimate
3' x 14' Two-Span
Specimen ID Clear Span
* Live load service deflections of Specimens 4-6 in cracked state (after initial cracking); for Specimens 4 and 5, the initial cycles were performed to 24 kips. In the case of Specimen 6, the specimen was initially cracked and also fatigued (all to 20.4 kips).
Table 3-6 Summary of ultimate capacity test results for Specimens 4-6.
Specimen ID
Beam Dimensions
Span Configuration I-Bar Type Concrete
StrengthUltimate
Cap. WestUltimate
Cap. EastAverage Capacity
Failure Mode (Span)
(ft) (psi) (kips) (kips) (kips)4 S 5253 69.9 65.5 67.7 Shear (W)
5 F 5197 73.9 62.3 68.1 Shear (E)
6 S 5027 85.3 85.9 85.6 Shear (E)
3' x 14' Two-Span
In order to investigate the fatigue resistance the FRP grid-reinforced deck system, accelerated fatigue cycling was performed upon a slab specimen (Specimen 1) and a beam specimen (Specimen 6) to ascertain whether or not the fatigued condition would have any effect on deck stiffness or ultimate strength. Based on the results of fatigue tests performed in a controlled laboratory environment, it was concluded that the FRP-reinforced concrete deck had good fatigue life.
When considering the ultimate capacity of the fatigued deck specimens compared to non-fatigued test specimens, any adverse effects that the fatigue cycling might have had on the deck were rendered negligible. No discernable changes in stiffness or strength were detected through comparison of the load versus displacement plots or ultimate capacities for Specimen 1 (fatigued) and Specimens 2 and 3 (non-fatigued). The same held true for the beam specimens, in fact, Specimen 6 (fatigued) failed at a much higher load than its non-fatigued counterparts.
15
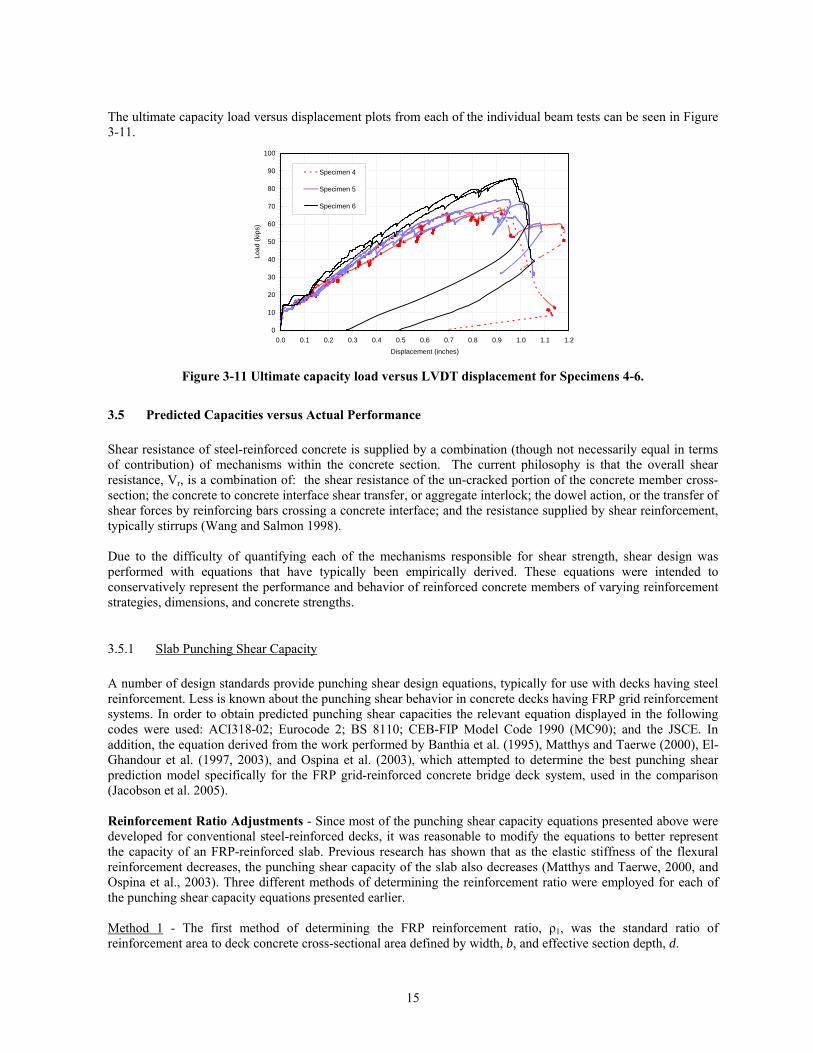
The ultimate capacity load versus displacement plots from each of the individual beam tests can be seen in Figure 3-11.
0
10
20
30
40
50
60
70
80
90
100
0.0 0.1 0.2 0.3 0.4 0.5 0.6 0.7 0.8 0.9 1.0 1.1 1.2
Displacement (inches)
Load
(kip
s)
Specimen 4
Specimen 5
Specimen 6
Figure 3-11 Ultimate capacity load versus LVDT displacement for Specimens 4-6.
3.5 Predicted Capacities versus Actual Performance Shear resistance of steel-reinforced concrete is supplied by a combination (though not necessarily equal in terms of contribution) of mechanisms within the concrete section. The current philosophy is that the overall shear resistance, Vr, is a combination of: the shear resistance of the un-cracked portion of the concrete member cross-section; the concrete to concrete interface shear transfer, or aggregate interlock; the dowel action, or the transfer of shear forces by reinforcing bars crossing a concrete interface; and the resistance supplied by shear reinforcement, typically stirrups (Wang and Salmon 1998).
Due to the difficulty of quantifying each of the mechanisms responsible for shear strength, shear design was performed with equations that have typically been empirically derived. These equations were intended to conservatively represent the performance and behavior of reinforced concrete members of varying reinforcement strategies, dimensions, and concrete strengths.
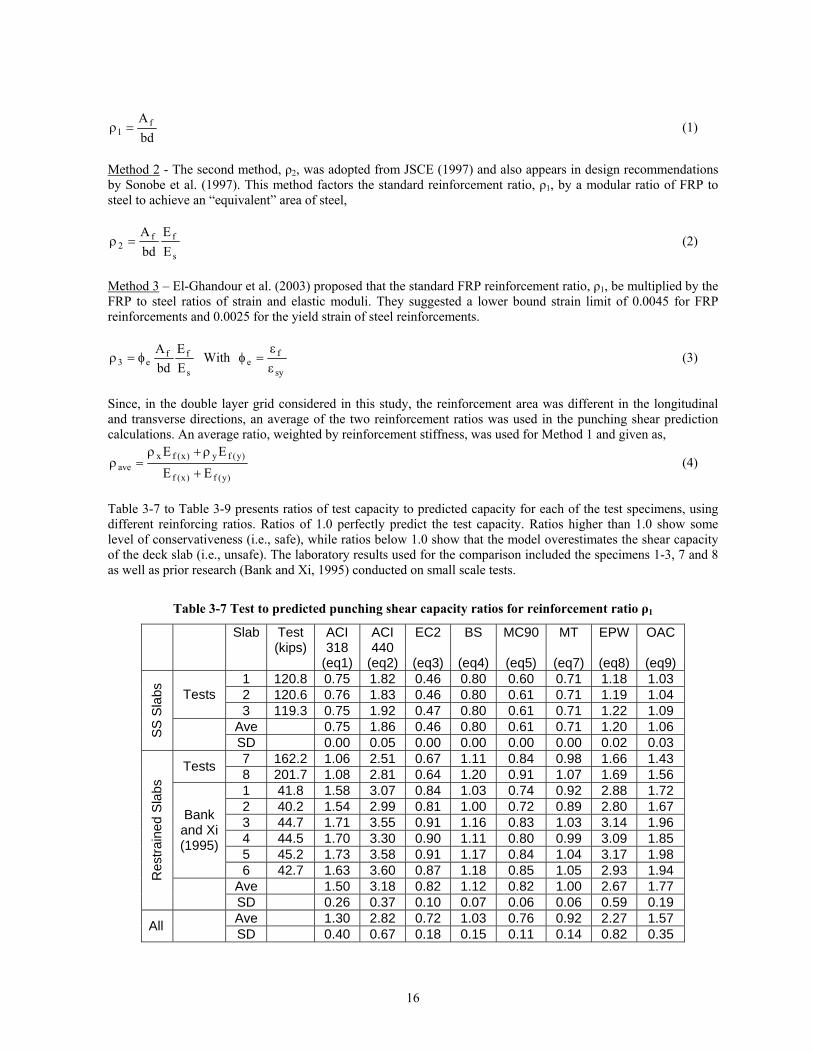
3.5.1 Slab Punching Shear Capacity A number of design standards provide punching shear design equations, typically for use with decks having steel reinforcement. Less is known about the punching shear behavior in concrete decks having FRP grid reinforcement systems. In order to obtain predicted punching shear capacities the relevant equation displayed in the following codes were used: ACI318-02; Eurocode 2; BS 8110; CEB-FIP Model Code 1990 (MC90); and the JSCE. In addition, the equation derived from the work performed by Banthia et al. (1995), Matthys and Taerwe (2000), El-Ghandour et al. (1997, 2003), and Ospina et al. (2003), which attempted to determine the best punching shear prediction model specifically for the FRP grid-reinforced concrete bridge deck system, used in the comparison (Jacobson et al. 2005). Reinforcement Ratio Adjustments - Since most of the punching shear capacity equations presented above were developed for conventional steel-reinforced decks, it was reasonable to modify the equations to better represent the capacity of an FRP-reinforced slab. Previous research has shown that as the elastic stiffness of the flexural reinforcement decreases, the punching shear capacity of the slab also decreases (Matthys and Taerwe, 2000, and Ospina et al., 2003). Three different methods of determining the reinforcement ratio were employed for each of the punching shear capacity equations presented earlier. Method 1 - The first method of determining the FRP reinforcement ratio, ρ1, was the standard ratio of reinforcement area to deck concrete cross-sectional area defined by width, b, and effective section depth, d.
16
bdA f
1 =ρ (1)
Method 2 - The second method, ρ2, was adopted from JSCE (1997) and also appears in design recommendations by Sonobe et al. (1997). This method factors the standard reinforcement ratio, ρ1, by a modular ratio of FRP to steel to achieve an “equivalent” area of steel,
s
ff2 E
EbdA
=ρ (2)
Method 3 – El-Ghandour et al. (2003) proposed that the standard FRP reinforcement ratio, ρ1, be multiplied by the FRP to steel ratios of strain and elastic moduli. They suggested a lower bound strain limit of 0.0045 for FRP reinforcements and 0.0025 for the yield strain of steel reinforcements.
s
ffe3 E
EbdA
φ=ρ With sy
fe ε
ε=φ (3)
Since, in the double layer grid considered in this study, the reinforcement area was different in the longitudinal and transverse directions, an average of the two reinforcement ratios was used in the punching shear prediction calculations. An average ratio, weighted by reinforcement stiffness, was used for Method 1 and given as,
)y(f)x(f
)y(fy)x(fxave EE
EE+
ρ+ρ=ρ (4)
Table 3-7 to Table 3-9 presents ratios of test capacity to predicted capacity for each of the test specimens, using different reinforcing ratios. Ratios of 1.0 perfectly predict the test capacity. Ratios higher than 1.0 show some level of conservativeness (i.e., safe), while ratios below 1.0 show that the model overestimates the shear capacity of the deck slab (i.e., unsafe). The laboratory results used for the comparison included the specimens 1-3, 7 and 8 as well as prior research (Bank and Xi, 1995) conducted on small scale tests.
Table 3-7 Test to predicted punching shear capacity ratios for reinforcement ratio ρ1
Slab Test (kips)
ACI 318
(eq1)
ACI 440
(eq2)
EC2
(eq3)
BS
(eq4)
MC90
(eq5)
MT
(eq7)
EPW
(eq8)
OAC
(eq9) 1 120.8 0.75 1.82 0.46 0.80 0.60 0.71 1.18 1.03 2 120.6 0.76 1.83 0.46 0.80 0.61 0.71 1.19 1.04 Tests 3 119.3 0.75 1.92 0.47 0.80 0.61 0.71 1.22 1.09
Ave 0.75 1.86 0.46 0.80 0.61 0.71 1.20 1.06 SS
Sla
bs
SD 0.00 0.05 0.00 0.00 0.00 0.00 0.02 0.03 7 162.2 1.06 2.51 0.67 1.11 0.84 0.98 1.66 1.43 Tests 8 201.7 1.08 2.81 0.64 1.20 0.91 1.07 1.69 1.56 1 41.8 1.58 3.07 0.84 1.03 0.74 0.92 2.88 1.72 2 40.2 1.54 2.99 0.81 1.00 0.72 0.89 2.80 1.67 3 44.7 1.71 3.55 0.91 1.16 0.83 1.03 3.14 1.96 4 44.5 1.70 3.30 0.90 1.11 0.80 0.99 3.09 1.85 5 45.2 1.73 3.58 0.91 1.17 0.84 1.04 3.17 1.98
Bank and Xi (1995)
6 42.7 1.63 3.60 0.87 1.18 0.85 1.05 2.93 1.94 Ave 1.50 3.18 0.82 1.12 0.82 1.00 2.67 1.77
Res
train
ed S
labs
SD 0.26 0.37 0.10 0.07 0.06 0.06 0.59 0.19 Ave 1.30 2.82 0.72 1.03 0.76 0.92 2.27 1.57 All SD 0.40 0.67 0.18 0.15 0.11 0.14 0.82 0.35

17
Table 3-8 Test to predicted punching shear capacity ratios for reinforcement ratio ρ2
Slab Test (kips)
EC2 (eq3)
BS (eq4)
MC90(eq5)
JSCE(eq6)
MT (eq7)
1 120.8 0.58 1.36 1.03 1.04 1.21 2 120.6 0.59 1.37 1.04 1.04 1.22 Tests 3 119.3 0.58 1.40 1.07 1.07 1.22
ave 0.58 1.38 1.05 1.05 1.25 SS
Sla
bs
SD 0.01 0.02 0.01 0.02 0.02 7 162.2 0.83 1.89 1.43 1.43 1.68 Tests 8 201.7 0.79 2.06 1.56 1.74 1.83 1 41.8 1.12 1.86 1.33 1.82 1.65 2 40.2 1.09 1.81 1.29 1.77 1.60 3 44.7 1.24 2.13 1.53 2.09 1.89 4 44.5 1.21 2.00 1.43 1.96 1.77 5 45.2 1.25 2.15 1.54 2.11 1.91
Bank and Xi (1995)
6 42.7 1.20 2.15 1.54 2.11 1.91 ave 1.09 2.01 1.46 1.88 1.78
Res
train
ed S
labs
SD 0.17 0.13 0.10 0.22 0.12 ave 0.95 1.83 1.35 1.65 1.63 All SD 0.27 0.30 0.20 0.41 0.27
Table 3-9 Test to predicted punching shear capacity ratios for reinforcement ratio ρ3
Slab Test (kips)
EC2 (eq3)
BS (eq4)
MC90(eq5)
JSCE(eq6)
MT (eq7)
1 120.8 0.55 1.12 0.85 0.86 0.99 2 120.6 0.56 0.56 1.13 0.86 1.00 Tests 3 119.3 0.56 1.15 0.88 0.88 1.03
ave 0.56 1.13 0.86 0.86 1.01 SS
Sla
bs
SD 0.00 0.02 0.01 0.01 0.01 7 162.2 0.79 1.55 1.18 1.18 1.38 Tests 8 201.7 0.76 1.69 1.28 1.43 1.50 1 41.8 1.04 1.53 1.09 1.49 1.36 2 40.2 1.01 1.48 1.06 1.45 1.32 3 44.7 1.15 1.75 1.26 1.72 1.56 4 44.5 1.12 1.64 1.18 1.61 1.46 5 45.2 1.17 1.77 1.27 1.73 1.57
Bank and Xi (1995)
6 42.7 1.13 1.77 1.27 1.73 1.67 ave 1.02 1.65 1.20 1.54 1.48
Res
train
ed S
labs
SD 0.15 0.11 0.08 0.18 0.11 ave 0.89 1.51 1.11 1.36 1.35 All SD 0.24 0.25 0.17 0.34 0.23
New Punching shear model for double layer FRP grating reinforced slabs with overlap splice Each of the punching shear capacity models have been empirically derived for two-way slab action in which some level of edge restraint was present. However, no portion of any of the shear equations presented here directly incorporate the effect of varying levels of slab edge restraint, whether rotational or axial restraint. In general, ACI 318 offers a fair prediction of capacity for the flexurally-restrained slabs but overestimates the capacity for the simply-supported slabs. The punching shear equation proposed for the upcoming revised edition of the ACI 440 guidelines was shown to be overly conservative for all specimens, especially the flexurally-restrained slabs. The best models were shown to be the MC90 code equation used with the modular modified

18
(kips) Eq. 9.37 (Vu/Vpredict)1 120.8 121.7 0.992 120.6 120.5 1.003 119.3 119.5 1.00
1.000.00
7 162.2 117.6 1.38
8 201.7 134.3 1.501.440.06
BX 1 41.37 32.16 1.29BX 2 40.24 32.16 1.25BX 3 44.74 30.86 1.45BX 4 44.51 32.16 1.38BX 5 45.19 30.86 1.46BX 6 42.71 28.94 1.48
1.390.09
1.290.19
MeanStandard Deviation
MeanStandard Deviation
Bank
and
Xi
(1
995)
All
Slab
s
MeanStandard Deviation
MeanStandard Deviation
IBR
C
(200
4)IB
RC
(2
004)
Slab Test Capacity
Empirical Prediction
Test to Predicted Capacity Ratio
reinforcement ratio ρ2 and the approach proposed by Matthys and Taerwe (2000) used in conjunction with the reinforcement ratio modification ρ3 proposed by El-Ghandour et al. (2003). These models provided capacity predictions that offered a nearly identical mean value and standard deviation for the entire body of test results. However, the modified reinforcement ratio suggested by El-Ghandour et al. (2003) assumed an ultimate strain of 0.0045 in the flexural reinforcement. Testing on Specimens 2 and 3 have shown that the tensile axial strains experienced at ultimate capacity in the FRP reinforcements of the bottom layer grating (<0.0031) were less than this seemingly arbitrarily set strain limit, and the calculated yield or rupture strains based on the longitudinal strength and stiffness properties of the FRP are greater than 0.017 in/in. For this reason, the second modification of the FRP reinforcement ratio, ρ3, was not further considered, as the method appears to lack justification, for the FRP gratings used in this project. Based on a review of the results of the previously proposed models, a new model was been proposed by the University of Wisconsin (UW) for the punching shear resistance of glass/vinyletser, mechanically-connected, FRP double-layer, pultruded, grating-reinforced concrete slabs. The model was a modification of the empirical approach by Matthys and Taerwe (2000):
dud
f5.4V 5.14
3 'c
UWρ
= (d in mm, 'cf in MPa) (5)
with: bdA f=ρ
Variable ρ represents the actual reinforcement ratio ρ1, averaged and weighted for differing ratios in the main and distribution reinforcement directions according to Eq. (4). The critical perimeter, u1.5, is representative of the top and bottom surface averaged failure perimeter seen in testing of Specimens 1-3, and 7. The model nearly perfectly predicted the capacities of the simply-supported slabs. This implied that for typical deck applications, where some level of edge restraint is involved, the calculated capacity would be conservative, but not overly conservative as shown in Figure 3-12. In comparison to the empirical equations considered earlier, the proposed punching shear model provided the overall best fit to the entire body of test capacities considered.
0
25
50
75
100
125
150
175
200
0 25 50 75 100 125 150
Predicted Capacity (k)
Act
ual C
apac
ity (k
)
IBRC
Bank and Xi
Figure 3-12 The proposed empirical model for punching shear capacity provides a good fit for the IBRC and Bank/Xi test capacities.

19
3.5.2 Beam Shear Capacity While some design standards may not include special provisions for punching shear capacity in two-way slab systems, all reinforced concrete building design codes address the shear capacity of one-way flexural members. The FRP-reinforced deck specimens tested in the two-span flexural configuration act as one-way members and can be considered as wide beams with no supplemental shear reinforcement (stirrups). Most of the available shear design equations were empirically derived for use with flexural members having steel reinforcement. However, in recent years there have been guidelines developed specifically for the design of FRP-reinforced systems, such as the ACI 440 and JSCE guidelines.
Table 3-10 Test to predicted shear capacity ratios for select empirical models intended for FRP-reinforced concrete design.
Eq. 9.36(kips) ρ1
4 50.6 9.435 48.7 11.126 62.6 11.59
10.710.92
2.69
Test to Predicted Capacity Ratios (Vu/Vpredict)
ACI 440 JSCE
ρ2
2.602.69
ρ3
2.142.21
3.904.144.89 3.274.310.42
2.850.30
2.340.24
Eq. 9.40Beam Test Capacity,
Vu
ACI 440 revision (Turyen & Frosch)
Eq. 9.39ρ1
MeanStandard Deviation
As shown in Table 3-10, the current ACI 440 approach to shear design grossly underestimates the shear strength of the beams. The newly proposed revisions to the ACI 440 guidelines (based on model by Tureyen and Frosch, 2003) are still shown to be highly conservative but not nearly as conservative as the current ACI 440 approach. The JSCE shear resistance equations are also shown to be quite conservative for both versions of the modified reinforcement ratio. Of the models developed for FRP-reinforced concrete, the JSCE model is the least conservative (compared to the ultra-conservative ACI models) but still offers a safe prediction of capacity. For this reason, it was recommended that shear design for the FRP grating-reinforced concrete deck system without shear reinforcement be performed using the approach suggested by the JSCE for design of FRP-reinforced concrete without shear reinforcement (shown unfactored for safety).
3.6 Conclusions of Design Phase Activities Laboratory testing has shown that the FRP-reinforced deck has acceptable performance under service loads. The simply-supported slabs exhibited good live load (unfactored service load) span to deflection ratios ranging from L/1330 to L/1640, but showed marginally acceptable cracking loads (at just over the 16 kip service load). However, this rather unimpressive performance is not indicative of the expected deck performance of an actual bridge deck configuration. More appropriate representations of the actual deck in the flexurally-restrained specimens showed a much increased stiffness over the simply-supported specimens, with span to deflection ratios of less than L/7200 at the 16 kip HS-20 service load. Cracking loads in the actual bridge deck are expected to be much greater than the loads applied to the deck through normal truck traffic.
Accelerated fatigue cycling performed upon a slab specimen did not reveal any apparent adverse fatigue effects on the ultimate strength or overall performance of the FRP-reinforced deck system after 2,000,000 load cycles. This conclusion is substantiated by the close correlation in stiffness and ultimate capacity exhibited by the simply-supported specimens during the ultimate capacity tests. Residual deflections in the slab due to fatigue cycling were found to be minimal and, interestingly, no greater than the residual deflections recorded in the other simply-supported slab specimens that had not been subjected to fatigue loading (from initial conditioning cycles only). A

20
decrease in the incremental accruement of displacement was observed as the fatigue cycling on the slab specimen progressed. In addition, the long-term fatigue resistance of the FRP-reinforced deck system in a flexural configuration was investigated. One of the three beam specimens was subjected to 2,000,000 accelerated fatigue cycles. The effects of the fatigue cycling were reflected in the comparison of residual deflections accrued throughout initial conditioning cycles and/or fatigue cycling, where the average span deflections (relative to the original un-cracked condition) in the fatigued specimen were about twice that of the non-fatigued specimens. However, the fatigue cycling had no apparent ill effect on the ultimate capacity of the deck system. The fatigued specimen failed at an ultimate shear capacity about 25% higher than the non-fatigued beam specimens. Punching shear was recognized as the critical failure mode of bridge decks that are transversely reinforced and continuous over longitudinal girders. Punching shear was the mode of failure identified in all of the slab specimens for which failure was achieved. In each case, the shear punch failure plane acted through the non-mechanically connected overlap splice between adjacent reinforcement cages. This confirmed the notion that the simple overlap splice would be the most structurally vulnerable aspect of the FRP reinforcement system, due to a lack of physical reinforcement continuity.
Additional laboratory testing included a series of two-span continuous beam tests that considered the negative moment capacity of the FRP-reinforced deck system and an investigation into the shear strength of the deck system using shear models currently available for predicting that strength. Though the beam tests were called “flexural” or “negative moment” capacity tests, shear was identified as the mode of failure for all of the beam specimens. In each case, the shear failure occurred at a location of concentrated flexure-shear cracking between the central support and one of the load application bars. However, prior to shear failure the beam tests showed that the FRP-reinforced deck system has a negative moment capacity over 2.5 times greater than the ACI 440.1R based design nominal moment capacity. Also, as part of the flexural capacity tests, initial cracking in each of the specimens was investigated as a consideration of the performance of the deck system. The negative moments at which cracking first occurred corresponded well with predicted moments.
21
4 Construction Phase Monitoring
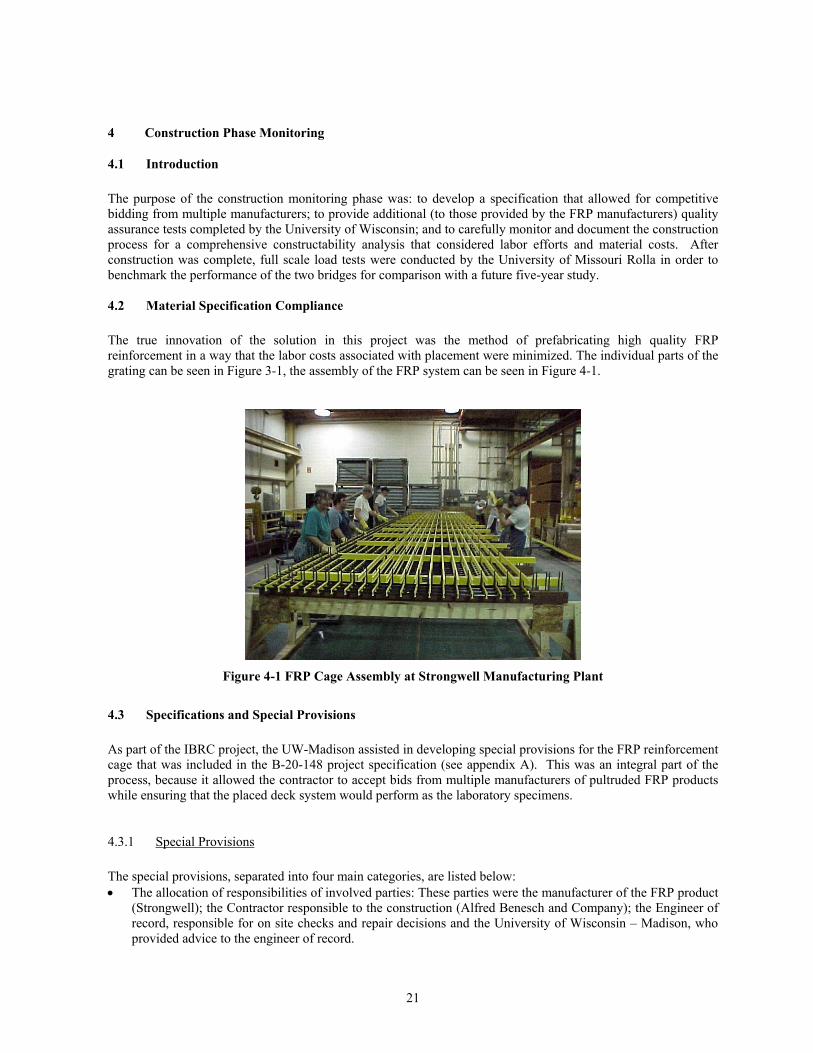
4.1 Introduction The purpose of the construction monitoring phase was: to develop a specification that allowed for competitive bidding from multiple manufacturers; to provide additional (to those provided by the FRP manufacturers) quality assurance tests completed by the University of Wisconsin; and to carefully monitor and document the construction process for a comprehensive constructability analysis that considered labor efforts and material costs. After construction was complete, full scale load tests were conducted by the University of Missouri Rolla in order to benchmark the performance of the two bridges for comparison with a future five-year study. 4.2 Material Specification Compliance The true innovation of the solution in this project was the method of prefabricating high quality FRP reinforcement in a way that the labor costs associated with placement were minimized. The individual parts of the grating can be seen in Figure 3-1, the assembly of the FRP system can be seen in Figure 4-1.
Figure 4-1 FRP Cage Assembly at Strongwell Manufacturing Plant
4.3 Specifications and Special Provisions As part of the IBRC project, the UW-Madison assisted in developing special provisions for the FRP reinforcement cage that was included in the B-20-148 project specification (see appendix A). This was an integral part of the process, because it allowed the contractor to accept bids from multiple manufacturers of pultruded FRP products while ensuring that the placed deck system would perform as the laboratory specimens.
4.3.1 Special Provisions The special provisions, separated into four main categories, are listed below: • The allocation of responsibilities of involved parties: These parties were the manufacturer of the FRP product
(Strongwell); the Contractor responsible to the construction (Alfred Benesch and Company); the Engineer of record, responsible for on site checks and repair decisions and the University of Wisconsin – Madison, who provided advice to the engineer of record.

22
• The requirements for the constituent materials of the FRP product. The special provisions applied constraints on the materials that were used in the fabrication of the FRP pultruded products. The provisions broke the constituents down into fibers, resins, and fillers.
• The manufacturing process of the individual pultruded products along with the material • Mechanical properties of the pultruded products; and the performance criteria of the FRP cage system.
4.3.2 Specifications FRP cage deflection criteria during construction were specified by performance tests that simulated the type of loading that the cages might be subjected to during transportation and placement. The anticipated worst case scenarios include vertical loads on the top reinforcing bars at either the splice joint or center span of shear connectors, opposing lateral loads on top and bottom grids, and a racking load. 4.4 Quality Assurance Tests The QA Tests covered 6 of the 16 properties reported in the certified Quality Control (QC) report submitted by the manufacturer. The manufacturer was not notified of which properties would be tested for in the QA test. The results UW-Madison obtained from tests conducted on coupons taken from actual components were reported first. The test results conducted on test laminates were subsequently reported. The intent of the UW-Madison testing was to assure that the values provided by Strongwell were an accurate assessment of the material properties of the reinforcement cage system. Figure 3-1 provides a visual index of the material labeling method used for the QA testing. The quality assurance test results were organized in the tables similar in format to the 90031G specification (refer to Appendix B). The following tests were carried out at the UW Madison.
• Longitudinal tension test (in accordance with ASTM D3039) • Transverse tension test (ASTM D3039) • Longitudinal short beam shear (ASTM D2344) • Fiber volume fraction (ASTM 2584-02) • Water Absorption (ASTM 570 -98) • Barcol Hardness (ASTM D 2583)
4.5 Quality Assurance Testing Report The quality assurance testing preformed by the UW-Madison did not give any reasonable doubt to the accuracy of the material properties of the reinforcing cage system as presented by the Strongwell manufacturing group. Based on the results obtained, it was recommended that the Strongwell values be considered an accurate representation of the material properties of the fiber reinforced polymers used as reinforcing in bridge B-20-148. 4.6 Constructability Analysis The constructability analysis of this project consisted of construction observations / descriptions and a cost analysis.
4.6.1 Construction Observations / Description The excavation of the site began in November 2003, and in April 2004 both the prototype bridge and its conventional twin were completed. The planned bridges had a simple span of 130 feet; the plans for these bridges can be found in Appendix C. The north-bound prototype bridge, B-20-148, utilized a 13.71 m (45-foot) wide, 39.62 m long, single span deck that contained two lanes of traffic. An approximately 26 degree skew was required to accommodate the angle of intersection between the highway and creek. The cross section consists of seven 16459-mm (54-inch) deep by 14630-mm (48-inch) wide flange bulb tee Prestressed Concrete (PC) girders spaced at 6-feet 5 inches on center,

23
supporting an 8-inch thick deck, reinforced with 19 FRP cages cast into a concrete deck (see Figure 4-2 and Figure 4-3). This left a 2-feet-5-inches space that was required to be formed up. A haunch varying between 1 and 3 inches was formed. The overhang and parapet walls were constructed from conventional epoxy-coated rebar because at the time of design there were no FRP guardrail systems approved in Wisconsin (see Figure 1-2). The conventional south bound twin bridge, B-20-149, was similar in every aspect except that the deck reinforcing was standard epoxy coated steel and two extra girders were added to provide space for the recreational trail. This increased the width of the bridge deck to 56-feet. The parapet wall on the trail side of the bridge was doweled into the deck and a pedestrian railing was placed on the exterior of the trail foot path.
Figure 4-2 Placement of Bulb Tee Girders
Figure 4-3 Remaining work on FRP Cage Placement after First Day of Placement
4.6.2 Cost Analysis – FRP Components In order to give an accurate cost comparison of the two construction methods it was necessary to provide cost data in three categories; material cost, labor cost, and life-time cost. The breakdown of the material costs can be seen in Table 4-1.
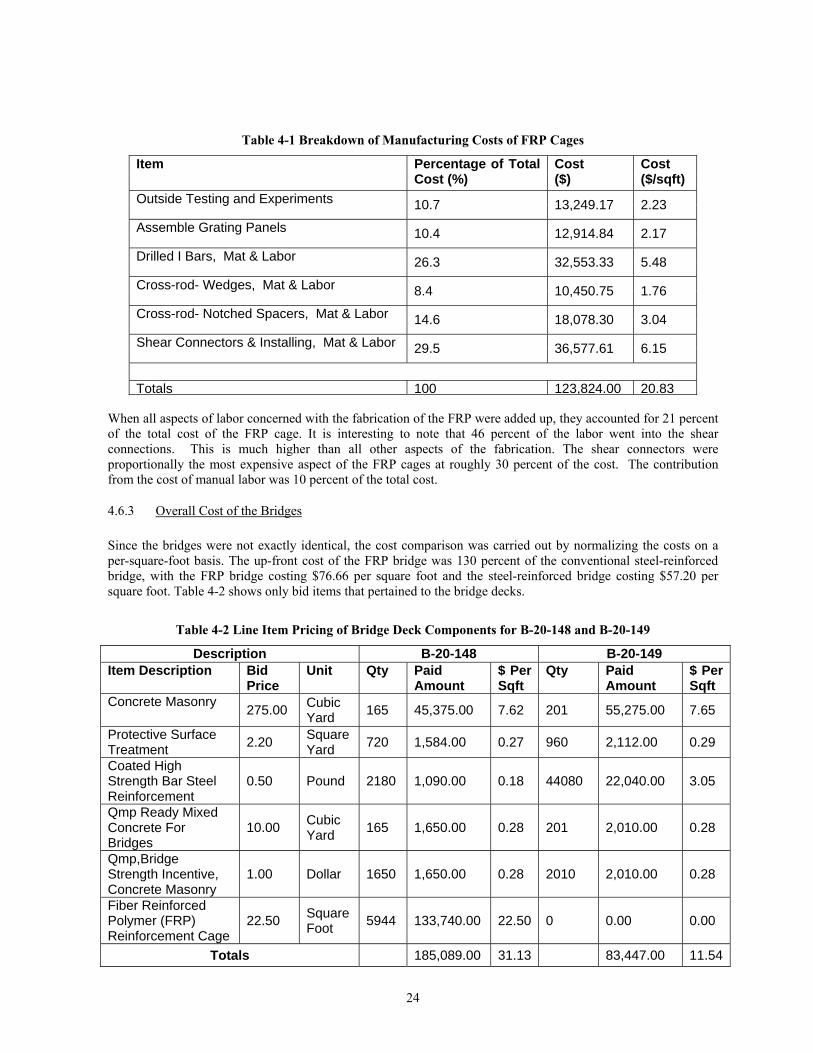
24
Table 4-1 Breakdown of Manufacturing Costs of FRP Cages
Item Percentage of Total Cost (%)
Cost ($)
Cost ($/sqft)
Outside Testing and Experiments 10.7 13,249.17 2.23
Assemble Grating Panels 10.4 12,914.84 2.17
Drilled I Bars, Mat & Labor 26.3 32,553.33 5.48
Cross-rod- Wedges, Mat & Labor 8.4 10,450.75 1.76
Cross-rod- Notched Spacers, Mat & Labor 14.6 18,078.30 3.04
Shear Connectors & Installing, Mat & Labor 29.5 36,577.61 6.15
Totals 100 123,824.00 20.83
When all aspects of labor concerned with the fabrication of the FRP were added up, they accounted for 21 percent of the total cost of the FRP cage. It is interesting to note that 46 percent of the labor went into the shear connections. This is much higher than all other aspects of the fabrication. The shear connectors were proportionally the most expensive aspect of the FRP cages at roughly 30 percent of the cost. The contribution from the cost of manual labor was 10 percent of the total cost.
4.6.3 Overall Cost of the Bridges Since the bridges were not exactly identical, the cost comparison was carried out by normalizing the costs on a per-square-foot basis. The up-front cost of the FRP bridge was 130 percent of the conventional steel-reinforced bridge, with the FRP bridge costing $76.66 per square foot and the steel-reinforced bridge costing $57.20 per square foot. Table 4-2 shows only bid items that pertained to the bridge decks.
Table 4-2 Line Item Pricing of Bridge Deck Components for B-20-148 and B-20-149
Description B-20-148 B-20-149 Item Description Bid
Price Unit Qty Paid
Amount $ Per Sqft
Qty Paid Amount
$ Per Sqft
Concrete Masonry 275.00 Cubic Yard 165 45,375.00 7.62 201 55,275.00 7.65
Protective Surface Treatment 2.20 Square
Yard 720 1,584.00 0.27 960 2,112.00 0.29
Coated High Strength Bar Steel Reinforcement
0.50 Pound 2180 1,090.00 0.18 44080 22,040.00 3.05
Qmp Ready Mixed Concrete For Bridges
10.00 Cubic Yard 165 1,650.00 0.28 201 2,010.00 0.28
Qmp,Bridge Strength Incentive, Concrete Masonry
1.00 Dollar 1650 1,650.00 0.28 2010 2,010.00 0.28
Fiber Reinforced Polymer (FRP) Reinforcement Cage
22.50 Square Foot 5944 133,740.00 22.50 0 0.00 0.00
Totals 185,089.00 31.13 83,447.00 11.54

25
A comparison of the total labor hours and equipment hours spent on the construction site can be seen in Table 4-3. The total hours for B-20-149 Steel were 170 percent of B-20-148 FRP. The equipment hours for B-20-149 Steel were 120 percent of B-20-148 FRP. The greatest contribution to this difference was the time spent placing the reinforcing. Utilizing current values for the expense of the labor and the crane, the total labor and equipment costs were $14,300 (or $2.46 /ft2) for the 148 FRP decks and $28,400 (or $3.93 /ft2) for the 149 Steel decks.
Table 4-3 Comparison of Total Labor and Equipment Hours
B-20-148 FRP B-20-149 Steel
hours hours/ft2 hours hours/ft2 Labor hours 111 0.019 239 0.033 Equipment 21.5 0.004 32 0.004
It is important to note that the labor preformed at the Strongwell plant was less expensive per hour due to the lack of public liability costs. There was also considerable room for streamlining the efforts at the plant which could potentially reduce the cost of the FRP placement. Since the construction site was a hybrid of steel construction and FRP methods and condition on site did not purely follow the conventional decking construction or the proposed FRP system. This is important because it eliminated the possibility of gauging the potential difference in total time spent on the construction site. Overall the installers for the FRP system were pleased with the ease of placement of the FRP cages. The problems that were encountered during the placement of the cages were primarily due to the implementation of a novel system. 4.7 Load Testing As stated in the IBRC project objectives in the introduction, the load tests were to provide a benchmark of the performance of the prototype bridge and its twin for comparison with long-term monitoring. The goal of these tests was to verify that the deck acts compositely with the girders and to determine the load distribution to individual girders. The University of Missouri Rolla (UM-Rolla) was contracted to conduct the load test utilizing a combination of deflection and strain measurements.
The University of Missouri Rolla utilized a total station system for measuring deflections during the load test. These prisms were magnetically attached to metal plates that had been bolted into place on the bottom of the bridge (see Figure 4-4). The total station was manually programmed to robotically cycle through all of the prisms during a given load test (Figure 1-3).
Figure 4-4 Targets Mounted on Bridge Girders
The deflection measurements from the total station provided information concerning the load distribution carried by each girder. The longitudinal composite action between the deck and girders were back calculated from the
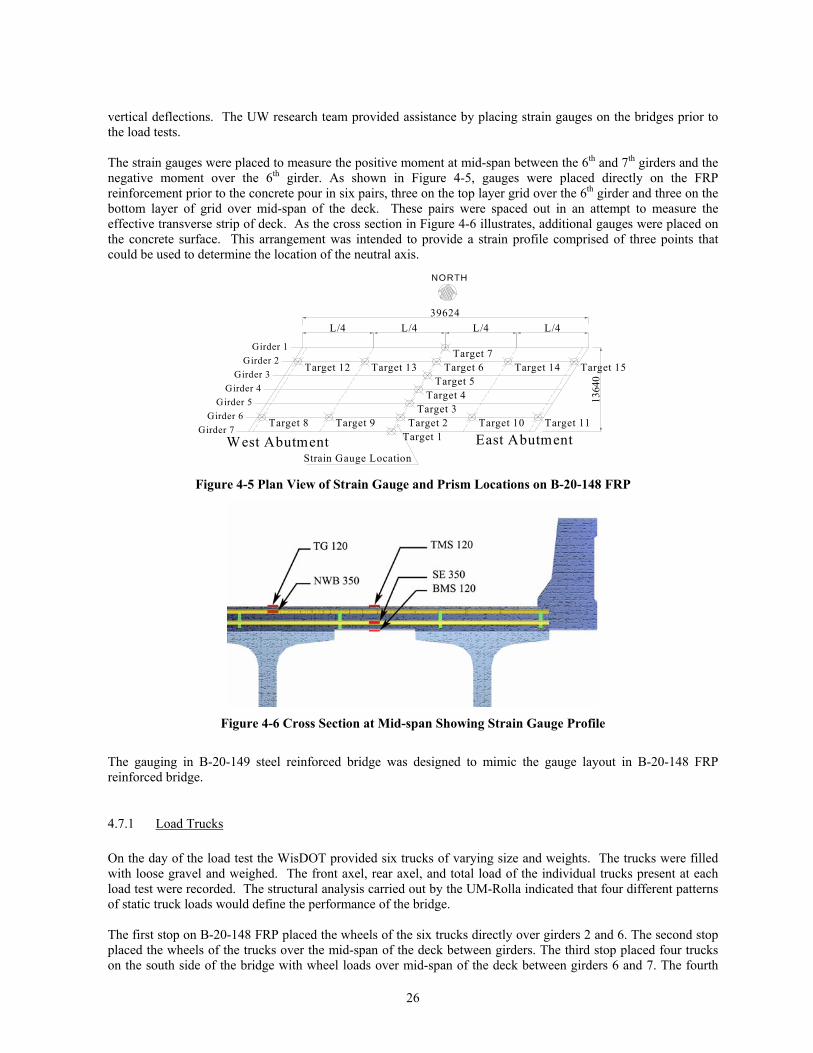
26
vertical deflections. The UW research team provided assistance by placing strain gauges on the bridges prior to the load tests. The strain gauges were placed to measure the positive moment at mid-span between the 6th and 7th girders and the negative moment over the 6th girder. As shown in Figure 4-5, gauges were placed directly on the FRP reinforcement prior to the concrete pour in six pairs, three on the top layer grid over the 6th girder and three on the bottom layer of grid over mid-span of the deck. These pairs were spaced out in an attempt to measure the effective transverse strip of deck. As the cross section in Figure 4-6 illustrates, additional gauges were placed on the concrete surface. This arrangement was intended to provide a strain profile comprised of three points that could be used to determine the location of the neutral axis.
1364
0
39624L/4 L/4 L/4
Girder 1Girder 2
Girder 3Girder 4
Girder 5Girder 6
Girder 7West Abutment East Abutment
Target 12
NORTH
L/4
Target 8
Target 13
Target 9
Target 14
Target 10
Target 15
Target 11Target 2Target 3
Target 4Target 5
Target 6Target 7
Target 1
Strain Gauge Location Figure 4-5 Plan View of Strain Gauge and Prism Locations on B-20-148 FRP
Figure 4-6 Cross Section at Mid-span Showing Strain Gauge Profile
The gauging in B-20-149 steel reinforced bridge was designed to mimic the gauge layout in B-20-148 FRP reinforced bridge.
4.7.1 Load Trucks On the day of the load test the WisDOT provided six trucks of varying size and weights. The trucks were filled with loose gravel and weighed. The front axel, rear axel, and total load of the individual trucks present at each load test were recorded. The structural analysis carried out by the UM-Rolla indicated that four different patterns of static truck loads would define the performance of the bridge. The first stop on B-20-148 FRP placed the wheels of the six trucks directly over girders 2 and 6. The second stop placed the wheels of the trucks over the mid-span of the deck between girders. The third stop placed four trucks on the south side of the bridge with wheel loads over mid-span of the deck between girders 6 and 7. The fourth

27
stop consisted of four trucks placed on the north side of the bridge with wheels placed over mid-span of girders 1 and 2. Figure 4-7 overlaps data from the four stops for the transverse vertical displacements at mid-span of the bridge.
-20.00
-18.00
-16.00
-14.00
-12.00
-10.00
-8.00
-6.00
-4.00
-2.00
0.00
2.00
4.00
0.00 1.69 3.96 6.15 8.23 10.33 12.46
y (m)
Dis
plac
emen
t (m
m)
Stop 1 Stop 2 Stop 3 Stop 4
Girder 7Girder 6Girder 5Girder 4Girder 3Girder 2Girder 1
Figure 4-7 B-20-148 FRP, Transverse Deflections at Mid-span, Stops 1-4
Similar load test were carried out on the steel bridge. Neither bridge experienced deflections near that of a span-divided-by-800 serviceability criterion. For detailed load test procedures and results refer to the University of Missouri test results (Hernandez en al, 2005) 4.8 Finite Element Method Simulations FEM simulations, as seen in Figure 4-8 were created based upon the data obtained from the diagnostic test. These numerical models may be used to approximate the bridges' behavior to limiting loads.
Figure 4-8 Finite Element Model of Bridge B-20-148
Figure 4-9 compares the FEM Model results to those directly measured in the field during Tests 1 through 4 of bridge B-20-148. The results correspond to the measurements of Girder 6. The numerical model was found to be adequately accurate to describe the longitudinal deflections measured in the field.

28
a) Test 1 b) Test 2
c) Test 3 d) Test 4
Figure 4-9 Comparison between FEM Model and Experimental Results (Test 1 to 4)
The vertical deflections at mid-span for all the girders are compared in Figure 4-10. For this bridge, the model showed its effectiveness in predicting transversal experimental distribution of deflections.
a) Test 1 b) Test 2

29
c) Test 3 d) Test 4
Figure 4-10 Comparison between FEM Model and Experimental Results (Vertical Deflections at Midspan, Test 1 to 4)
The FE model was able to represent the actual behavior of the bridge and can be used to determine the actual load rating of the bridges and therefore their safety over time. The results of the FEM analysis confirmed that the assumption of composite action between deck and girders was adequate when describing the response of the bridge during the load test. 4.9 Conclusions of Construction Phase Activities The side by side nature of the twin bridges allowed for direct comparisons between the proposed FRP-reinforced system and the conventional steel-reinforced system. The efforts related to the construction of the bridge deck have been quantified in terms of task-specific labor hours. The use of labor hours to quantify the labor efforts provided a more universal figure for comparison than dollar costs of labor. The constructability analysis showed that the FRP cages could be placed faster than the epoxy-coated rebar. The labor effort for the optimized placement of the FRP cages was 93 labor hours and 13 hours of crane operation were used. The epoxy-coated steel required 275 labor hours and 34 hours of crane operation. Despite the savings found in the field labor efforts, according to the line item bid prices the overall cost of the FRP grid is a little more than six times the cost of the epoxy-coated steel. The up-front cost of the FRP system was $76.66 per square foot, compared to $57.20 per square foot for the steel reinforced bridge. The material specification produced provided a means of communication between the engineer of record and the manufacturer, ensuring the materials used in the project satisfy the design requirements. This was accomplished by tabulating requirements for material and physical properties for each component along side the ASTM tests to be used to determine the tabulated properties. The quality assurance tests performed at UW Madison verified that the material properties reported by the manufacturer were considered an accurate representation of the material properties used for the bridge deck.
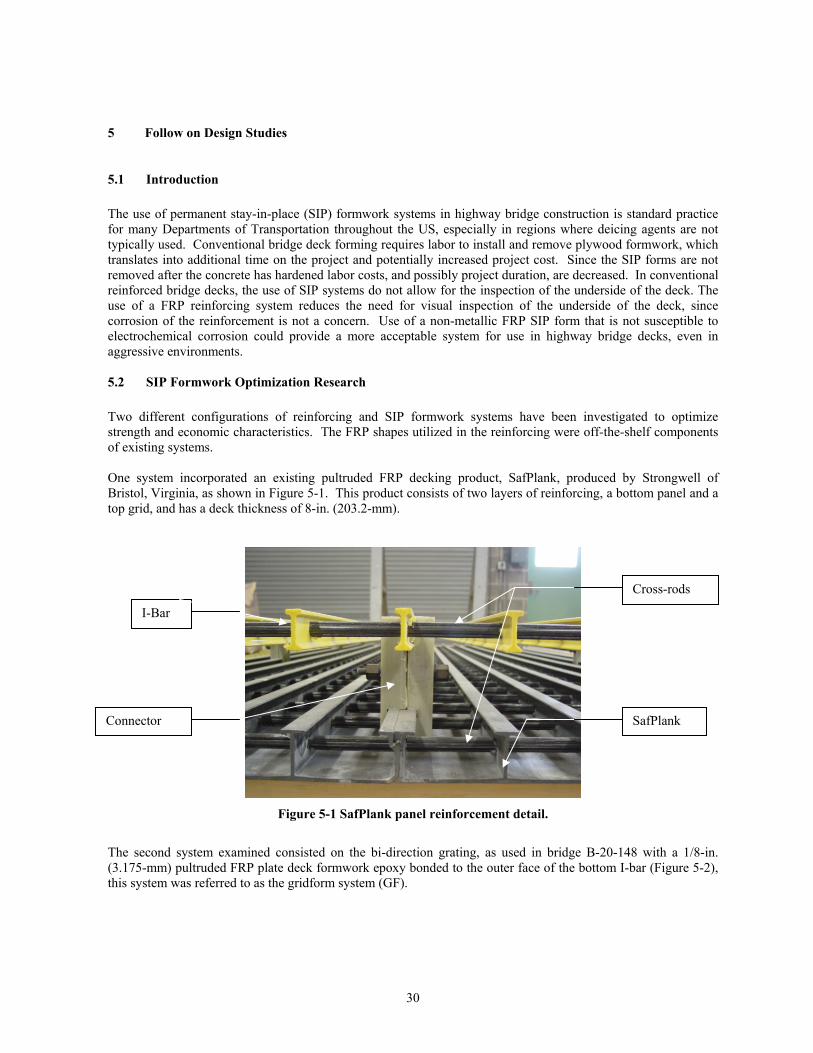
30
5 Follow on Design Studies
5.1 Introduction The use of permanent stay-in-place (SIP) formwork systems in highway bridge construction is standard practice for many Departments of Transportation throughout the US, especially in regions where deicing agents are not typically used. Conventional bridge deck forming requires labor to install and remove plywood formwork, which translates into additional time on the project and potentially increased project cost. Since the SIP forms are not removed after the concrete has hardened labor costs, and possibly project duration, are decreased. In conventional reinforced bridge decks, the use of SIP systems do not allow for the inspection of the underside of the deck. The use of a FRP reinforcing system reduces the need for visual inspection of the underside of the deck, since corrosion of the reinforcement is not a concern. Use of a non-metallic FRP SIP form that is not susceptible to electrochemical corrosion could provide a more acceptable system for use in highway bridge decks, even in aggressive environments. 5.2 SIP Formwork Optimization Research Two different configurations of reinforcing and SIP formwork systems have been investigated to optimize strength and economic characteristics. The FRP shapes utilized in the reinforcing were off-the-shelf components of existing systems. One system incorporated an existing pultruded FRP decking product, SafPlank, produced by Strongwell of Bristol, Virginia, as shown in Figure 5-1. This product consists of two layers of reinforcing, a bottom panel and a top grid, and has a deck thickness of 8-in. (203.2-mm).
Figure 5-1 SafPlank panel reinforcement detail.
The second system examined consisted on the bi-direction grating, as used in bridge B-20-148 with a 1/8-in. (3.175-mm) pultruded FRP plate deck formwork epoxy bonded to the outer face of the bottom I-bar (Figure 5-2), this system was referred to as the gridform system (GF).
Cross-rods
I-Bar
Connector SafPlank

31
Figure 5-2 Gridform reinforcement detail (a) I-bar, (b) Cross-rods, (c) Shear connector, (d) FRP Plate.
5.3 Field Implementation of Gridform System – Greene County, MO The gridform solution was implemented in a superstructure replacement project of a slab-on-girder bridge in Greene County, Missouri. The underside of the replaced bridge deck can be seen in Figure 5-3. Note the deicing salts penetrating through the bridge deck.
Figure 5-3 Existing underside of Greene County Bridge (Matta, 2005)
The superstructure replacement consisted of removing the existing deck and girders and replacing with new girders and cast-in-place grid form system, as seen in Figure 5-4.

32
Figure 5-4 Installation of Gridform panels (Matta, 2005)
The finished bridge can be seen in Figure 5-5, the Gridform System was constructed in approximately 20% to 30% of the time required to construct similar, conventionally built bridge superstructures (Ringelsteller, 2006).
Figure 5-5 Greene County Bridge - completed structure
5.4 Conclusions The use of permanent stay-in-place (SIP) formwork systems in FRP reinforced highway bridges has potential to decrease the bridge deck construction time. In bridge deck replacement this is particularly crucial as it reduces the overall road closure and hence associated delays. For further information on SIP formwork system refer to Ringelsteller (2006).

33
6 Conclusions and Recommendations
6.1 Conclusions The use of an innovative, non-metallic, and modular FRP double-layer bi-directional grating reinforcement system as a structurally safe method of reinforcing the concrete De Neveu Creek Bridge was successfully demonstrated through a series of laboratory tests and subsequence analysis. The performance of the FRP deck system was assessed to determine deck failure mechanisms, identify limit states, and consider the overall performance and behavior under loading for the FRP reinforcement system. All laboratory tests were configured, with various degrees of conservativeness, to represent actual bridge deck and support conditions of the De Neveu Creek Bridge. The laboratory tests demonstrated that the use of a prefabricated modular three-dimensional FRP grid system with integrated chairs as a viable, cost-effective, and rapidly installed reinforcement system. The series of ultimate capacity tests performed on deck slab specimens illustrated that punching shear was the critical failure mode. In comparing the test capacities of the slab specimens to service loads associated with the AASHTO HS-20 design truck (16 kips), factors of safety for the FRP-reinforced deck system were calculated to be approximately 7.5 for the simply-supported slab specimens. In each case, the shear punch failure plane acted through the non-mechanically connected overlap splice between adjacent reinforcement cages. Accelerated fatigue cycling performed upon a slab specimen did not reveal any apparent adverse fatigue effects on the ultimate strength or overall performance of the FRP-reinforced deck system after 2,000,000 load cycles. The constructability analysis illustrated that the FRP cages were placed faster than the epoxy-coated rebar. The labor effort for the optimized placement of the FRP cages was 93 labor hours and 13 hours of crane operation. The epoxy-coated steel required 275 labor hours and 34 hours of crane operation. Despite the savings found in the field labor efforts, according to the line item bid prices the overall cost of the FRP grid was approximately six times the cost of the epoxy-coated steel. However, it is important to note that the reason alternative strategies for dealing with corrosion are being explored is due to the high cost of either replacing or constantly inspected and maintained the bridge deck through-out the life-span of the bridge. The development of the material specification was a critical step in the success of the project. The material specification produced for this project accomplished this by tabulating requirements for material and physical properties for each component along side the ASTM tests to be used to determine the tabulated properties. The in-situ load testing confirmed a good response of the bridges at serviceability loads, since the experimental deflections were found to be smaller than the theoretical values determined according to the design provisions (AASHTO, 1996). The successful completion of this phase of the IBRC project demonstrates that a team consisting of State DOT engineers, private bridge design consulting engineers, vendors of proprietary FRP products, and university researchers can work together in a synergistic manner to develop innovative analytical methods, experimental procedures, designs, specifications, and construction practices using FRP materials for highway bridge engineering. 6.2 Recommendations Consider more progressive deck designs. This is especially worthwhile in bridge designs having wide flange girders spaced very closely together (such as De Neveu Creek Bridge) where the current design is highly conservative. This optimizing could reduce the up-front costs of the FRP system. Perform additional experiments to test alternate splice methods between the FRP reinforcement cages and alternate shear connectors.

34
Establish methods to create a realistic FRP reinforced bridge life-time cost analysis. The analysis could be used to directly compare FRP reinforced bridge decks to conventional steel reinforced bridge decks. Heightened competition in the bid process would lower the cost of the overall product. The specification written in this report allowed for a competitive bid, however due to the novel nature of the system, the contractor selected to use the manufacturer that produced the specimens used in the laboratory testing at the UW-Madison. Also, the economy of size would bring the cost of the system down. The manufacturer suggested that loosening the quality control on properties such as glass transition temperature could reduce the costs of outside testing. The manufacturer did not check the strain in the individual components as intended by the specification, claiming that the deflection criteria would control. In other words, if the deflection criteria are met, then the strain criteria is automatically satisfied. It is recommended that further testing explore this claim. It would be advantageous to set the deflection criteria to a value that would remove the necessity to check the strain in the components. The deflection tests are much easier to carry out and require little technical expertise, where checking strains requires knowledge of specialized equipment such as structural analysis, strain gauging, and data acquisition. Work with the contractor to develop a lifting plan such that the crane usage can be optimized, while ensuring that the FRP grids are not damaged during the lifting. Conduct additional research into the use of stay-in-place formwork systems to decrease the bridge deck construction time. Continue long-term monitoring of the prototype bridge and its twin for comparison to determine the long-term performance of the FRP reinforced bridge deck.

35
References AASHTO. (1996). “Standard Specifications for Highway Bridges,” American Association of State Highway and Transportation Officials. 16th Ed., 1996, Washington, D.C. American Concrete Institute, Committee 318 (2002). “Building Code Requirements for Structural Concrete and Commentary,” ACI 318-02 and ACI 318R-02, Farmington Hills, Michigan. American Concrete Institute, Committee 440 (2003). “Guide for the Design and Construction of Concrete Reinforced with FRP Bars,” ACI 440.1R-03, Farmington Hills, Michigan. Bank, L.C., Oliva, M., Russell, J., Dieter, D.A., Dietsche, J.S., Berg, A.C., Ehmke, F.G., Carter, J., Hill, R., Henke, R., Gallagher, B. (2005), “Bridge B-20-133 on US-151 with Fiber Reinforced Polymer Reinforced Concrete Deck,” Innovative Bridge Research and Construction Program (IBRC), FHWA, Washington, D.C. http://ibrc.fhwa.dot.gov/ Bank, L.C., Oliva, M., Russell, J., Jacobson, D., Conachen, M., Nelson, B., McMonigal, D. (2004). “Super-Sized Double-Layer Pultruded Gratings,” submitted to the American Composites Manufacturers Association, for publication/presentation at the COMPOSITES 2004 Convention and Trade Show, October 6-8, 2004 in Tampa, Florida. Bank, L.C., Oliva, M.G., Russell, J.S., Jacobson, D.A., Conachen, M., Nelson, B. and McMonigal, D. (2006), “Double Layer Prefabricated FRP Grids for Rapid Bridge Deck Construction: Case Study,” ASCE Journal of Composites for Construction, Vol. 10, No. 3, pp. 204-212. Bank, L.C. and Xi, Z. (1995). “Punching Shear Behavior of Pultruded FRP Grating Reinforced Concrete Slabs,” Proceedings of the Second International RILEM Symposium on Non-Metallic (FRP) Reinforcement for Concrete Structures (FRPRCS-2), August 23-25, Ghent, Belgium; Ed. by L. Taerwe; E & FN Spon, London, pp. 360-367. Banthia, N., Al-Asaly, M., and Ma, S. (1995). “Behavior of Concrete Slabs Reinforced with Fiber-Reinforced Plastic Grid,” Journal of Materials in Civil Engineering, Vol. 7, No. 4, pp. 252-257. Berg, A.C. (2004). “Analysis of a Bridge Deck Built on U.S. Highway 151 with FRP Stay-In-Place Forms, FRP Grids, and FRP Rebars,” MS Thesis, Department of Civil Engineering, University of Wisconsin-Madison. http://www.engr.wisc.edu/cee/faculty/bank_lawrence/AdamBergMS2004.pdf Berg, A.C., Bank, L.C., Oliva, M.G., and Russell, J.S. (2004). “Construction of a FRP Reinforced Bridge Deck on U.S. Highway 151 in Wisconsin,” Compendium of Papers (CD-ROM) from the 83rd Annual Transportation Research Board Meeting, January 11-15, Washington, D.C., National Academy of Science, Washington, D.C. Charleson, K., Abdelrahman, A., Rizkalla, S., Saltzberg, W. (1997). “Behavior of a Model Concrete Bridge Deck Reinforced by CFRP,” Proceedings of the Third International RILEM Symposium on Non-Metallic (FRP) Reinforcement for Concrete Structures (FRPRCS-3), October 14-16, Sapporo, Japan, Vol. 2, pp. 575-582. Conachen, M.J. (2005), “Modular 3-D FRP Reinforcing System for a Bridge Deck in Fond du Lac, Wisconsin,” MS Thesis, University of Wisconsin-Madison. http://www.engr.wisc.edu/cee/faculty/bank_lawrence/MackConachenMS2005.pdf Conachen, M. and Bank, L. (2004). “Quality Assurance Testing of FRP Materials for IBRC 2 Project,” QA Report submitted to Wisconsin Department of Transportation (WisDOT). Dietsche, J.S. (2002). “Development of Material Specifications for FRP Structural Elements for the Reinforcing of a Concrete Bridge Deck,” MS Thesis, Department of Civil Engineering, University of Wisconsin-Madison. http://www.engr.wisc.edu/cee/faculty/bank_lawrence/JoshuaDietscheMS2002.pdf
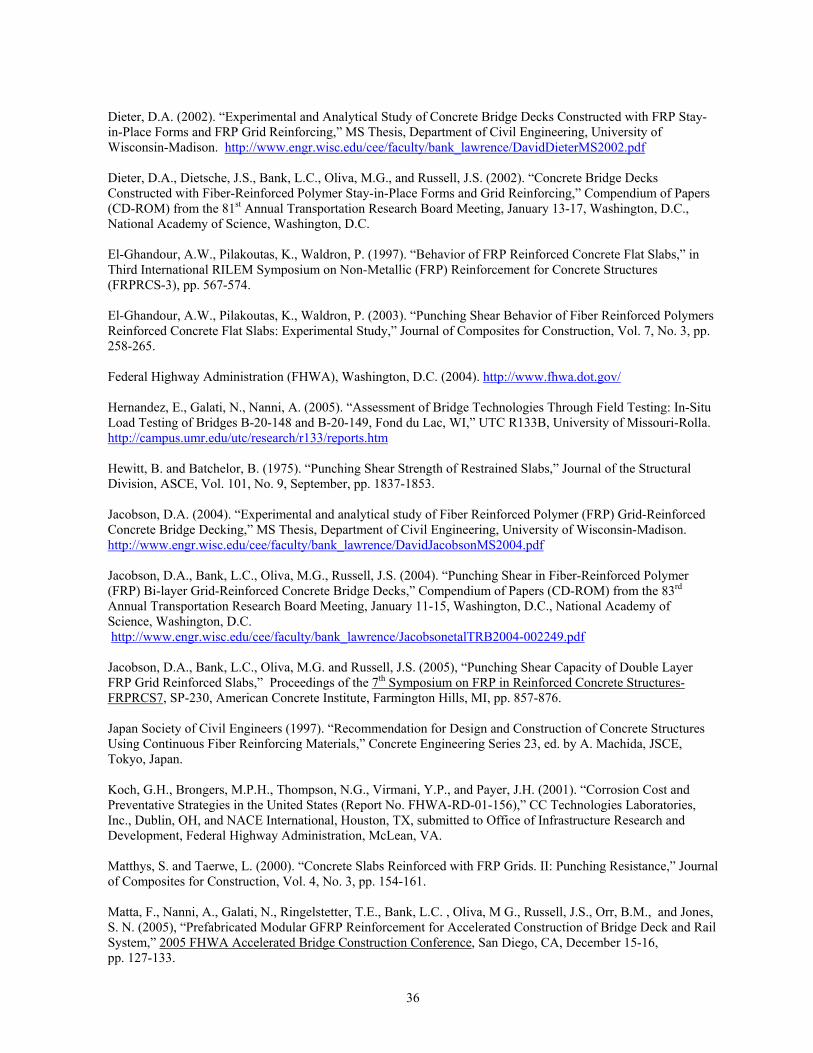
36
Dieter, D.A. (2002). “Experimental and Analytical Study of Concrete Bridge Decks Constructed with FRP Stay-in-Place Forms and FRP Grid Reinforcing,” MS Thesis, Department of Civil Engineering, University of Wisconsin-Madison. http://www.engr.wisc.edu/cee/faculty/bank_lawrence/DavidDieterMS2002.pdf Dieter, D.A., Dietsche, J.S., Bank, L.C., Oliva, M.G., and Russell, J.S. (2002). “Concrete Bridge Decks Constructed with Fiber-Reinforced Polymer Stay-in-Place Forms and Grid Reinforcing,” Compendium of Papers (CD-ROM) from the 81st Annual Transportation Research Board Meeting, January 13-17, Washington, D.C., National Academy of Science, Washington, D.C. El-Ghandour, A.W., Pilakoutas, K., Waldron, P. (1997). “Behavior of FRP Reinforced Concrete Flat Slabs,” in Third International RILEM Symposium on Non-Metallic (FRP) Reinforcement for Concrete Structures (FRPRCS-3), pp. 567-574. El-Ghandour, A.W., Pilakoutas, K., Waldron, P. (2003). “Punching Shear Behavior of Fiber Reinforced Polymers Reinforced Concrete Flat Slabs: Experimental Study,” Journal of Composites for Construction, Vol. 7, No. 3, pp. 258-265. Federal Highway Administration (FHWA), Washington, D.C. (2004). http://www.fhwa.dot.gov/ Hernandez, E., Galati, N., Nanni, A. (2005). “Assessment of Bridge Technologies Through Field Testing: In-Situ Load Testing of Bridges B-20-148 and B-20-149, Fond du Lac, WI,” UTC R133B, University of Missouri-Rolla. http://campus.umr.edu/utc/research/r133/reports.htm Hewitt, B. and Batchelor, B. (1975). “Punching Shear Strength of Restrained Slabs,” Journal of the Structural Division, ASCE, Vol. 101, No. 9, September, pp. 1837-1853. Jacobson, D.A. (2004). “Experimental and analytical study of Fiber Reinforced Polymer (FRP) Grid-Reinforced Concrete Bridge Decking,” MS Thesis, Department of Civil Engineering, University of Wisconsin-Madison. http://www.engr.wisc.edu/cee/faculty/bank_lawrence/DavidJacobsonMS2004.pdf Jacobson, D.A., Bank, L.C., Oliva, M.G., Russell, J.S. (2004). “Punching Shear in Fiber-Reinforced Polymer (FRP) Bi-layer Grid-Reinforced Concrete Bridge Decks,” Compendium of Papers (CD-ROM) from the 83rd Annual Transportation Research Board Meeting, January 11-15, Washington, D.C., National Academy of Science, Washington, D.C. http://www.engr.wisc.edu/cee/faculty/bank_lawrence/JacobsonetalTRB2004-002249.pdf Jacobson, D.A., Bank, L.C., Oliva, M.G. and Russell, J.S. (2005), “Punching Shear Capacity of Double Layer FRP Grid Reinforced Slabs,” Proceedings of the 7th Symposium on FRP in Reinforced Concrete Structures- FRPRCS7, SP-230, American Concrete Institute, Farmington Hills, MI, pp. 857-876. Japan Society of Civil Engineers (1997). “Recommendation for Design and Construction of Concrete Structures Using Continuous Fiber Reinforcing Materials,” Concrete Engineering Series 23, ed. by A. Machida, JSCE, Tokyo, Japan. Koch, G.H., Brongers, M.P.H., Thompson, N.G., Virmani, Y.P., and Payer, J.H. (2001). “Corrosion Cost and Preventative Strategies in the United States (Report No. FHWA-RD-01-156),” CC Technologies Laboratories, Inc., Dublin, OH, and NACE International, Houston, TX, submitted to Office of Infrastructure Research and Development, Federal Highway Administration, McLean, VA. Matthys, S. and Taerwe, L. (2000). “Concrete Slabs Reinforced with FRP Grids. II: Punching Resistance,” Journal of Composites for Construction, Vol. 4, No. 3, pp. 154-161. Matta, F., Nanni, A., Galati, N., Ringelstetter, T.E., Bank, L.C. , Oliva, M G., Russell, J.S., Orr, B.M., and Jones, S. N. (2005), “Prefabricated Modular GFRP Reinforcement for Accelerated Construction of Bridge Deck and Rail System,” 2005 FHWA Accelerated Bridge Construction Conference, San Diego, CA, December 15-16, pp. 127-133.

37
Matta, F., Galati, N., Nanni, A., Ringelstetter, T.E., Bank, L.C., and Oliva, M.G. (2005), “Pultruded Grid and Stay-in-Place Form Panels for the Rapid Construction of Bridge Decks,” COMPOSITES 2005 Convention and Trade Show, American Composites Manufacturers Association, September 28-30, Columbus, OH. CD-ROM. Oliva, M.J., Bank, L.C., Russell, J.S., Conachen, M., Ehmke, F. (2005), “Reinforcing Concrete Bridge Decks with Prefabricated FRP Grids and Stay-in-Place Formwork,” Proceedings of the International Workshop on Innovative Bridge Deck Technologies, ISIS, Winnipeg, CA, April 14-15, 2005, CD-ROM. Ospina, C.E. (2005). “Alternative Model for Concentric Punching in Capacity Evaluation of Reinforced Concrete Two-Way Slabs,” Concrete International, Vol. 27, Issue 9. Ospina, C.E., Alexander, S.D.B., and Cheng, J.J.R. (2003). “Punching of Two-Way Slabs with Fiber-Reinforced Polymer Reinforcing Bars or Grids,” ACI Structural Journal, Vol. 100, No. 5, pp. 589-598. Ospina, C.E., Alexander, S.D.B., Cheng, J.J.R., Matthys, S., and Taerwe, L. (2001). “Concrete Slabs Reinforced with FRP Grids. II: Punching Resistance (Discussion and Closure),” Journal of Composites for Construction, ASCE, Vol. 5 (No. 4), November, p. 277. Ozel, M. (2002). “Behavior of Concrete Beams Reinforced with 3-D Fiber Reinforced Plastic Grids,” PhD Thesis, Department of Civil Engineering, University of Wisconsin-Madison. http://www.engr.wisc.edu/cee/faculty/bank_lawrence/MeldaOzelPhD2002.pdf Perdikaris, P., Beim, S., and Bousias, S. (1989). “Slab Continuity Effect on Ultimate and Fatigue Strength of Reinforced Concrete Bridge Deck Models,” ACI Structural Journal, American Concrete Institute, Vol. 86 (No. 4), July-August, pp. 483-491. Ringelstetter, T.E., Bank, L.C., Oliva, M.G., Russell, J.S., Matta, F., and Nanni A. (2006), “Development of a Cost-Effective Structural FRP Stay-In-Place Formwork System for Accelerated and Durable Bridge Deck Construction,” to appear in the Transportation Research Record. Ringelstetter, T.E., Bank, L.C., Oliva, M.G., Russell, J.S., Matta, F., and Nanni, A. (2006), “Development of a Cost-Effective Structural FRP Stay-In-Place Formwork System for Accelerated and Durable Bridge Deck Construction,” Proceedings of the 85rd Annual Transportation Research Board Meeting, CD-ROM, Washington, DC, January 21-24. Ringelstetter, T.E. (2006), “Investigation of Modular FRP Grid Reinforcing Systems with Integral Stay-In-Place Form for Concrete Bridge Decks” MS Thesis, University of Wisconsin-Madison. Sonobe, Y., et al. (1997). “Design Guidelines of FRP Reinforced Concrete Building Structures,” Journal of Composites for Construction, Vol. 1, No. 3, pp. 90-115. Strongwell, Inc., Bristol, Virginia, (2004). http://www.strongwell.com/ Tureyen, A.K. and Frosch, R.J. (2003). “Concrete Shear Strength: Another Perspective,” ACI Structural Journal, Vol. 100, No. 5, pp. 609-615. U.S. Department of Transportation, Bureau of Transportation Statistics (BTS) (2004). Transportation Statistics Annual Report (BTS03-06), October, Washington, D.C. Wang, C. and Salmon, C. (1998). Reinforced Concrete Design, 6th Edition. Elsevier Addison Wesley Educational Publishers, Inc., New York, New York. Wisconsin Department of Transportation (WisDOT), Madison, WI. (2004). http://www.dot.wisconsin.gov Xi, Z. (1992). “A Study of Full-Size Pultruded FRP Grating Reinforced Concrete Bridge Deck Slabs,” MS Thesis, Department of Civil Engineering, Catholic University of America, Washington, D.C.

38
Appendix A: Special Provisions for Modular 3-D FRP Reinforcement Cage
Fiber Reinforced Polymer (FRP) Reinforcement Cage, Item 90031G.
CONTENTS A. General Description.
A.1. Geometric Requirements. A.2. Potential Suppliers. A.3. Special Coarse Aggregate for FRP Reinforced
Bridge Deck. A.4. Submittals.
A.4.1. Shop Drawings. A.4.2. Lifting and Placement Plan. A.4.3. Mock-Up Section of the FRP
Cage. A.4.4. Number of Copies. A.4.5. Timing of Submittals. A.4.6. Approval of Submittals.
B. Materials and Manufacturing. B.1. Fibers. B.2. Resins. B.3. Fillers. B.4. Manufacturing Process. B.5. Fiber Architecture. B.6. Classification Nomenclature. B.7. Physical and Mechanical Properties. B.8. Classification of Parts of FRP Cages. B.9. Special Requirements.
B.9.1. Production and Assembly. B.9.2. Product Marking. B.9.3. Dimensional Tolerance. B.9.4. Sealing of Cut Ends.
B.10. Performance Requirements. B.10.1. Scope. B.10.2. Lifting Requirements.
B.10.3. Construction Loads: Vertical. B.10.3.1. Test Sub-Assembly. B.10.3.2. Loading Criteria. B.10.3.3. Acceptance Criteria.
B.10.4. Construction Loads: Lateral. B.10.4.1. Test Sub-Assembly. B.10.4.2. Loading Criteria. B.10.4.3. Acceptance Criteria.
B.10.5. Construction Loads: In Plane Racking. B.10.5.1. Test Sub-Assembly. B.10.5.2. Loading Criteria. B.10.5.3. Acceptance Criteria.
B.10.6. Construction Loads: Vertical Load on
Splice Overlap. B.10.6.1. Test Sub-Assembly. B.10.6.2. Loading Criteria. B.10.6.3. Acceptance Criteria.
B.11. Reporting and Certification Requirements. B.12. Referenced ASTM Methods.
C. Quality Assurance. D. Construction Methods.
D.1. Handling. D.2. Storage. D.3. Installation. D.4. Repair.
E. Method of Measurement. F. Basis of Payment.

39
A. General Description. A Fiber Reinforced Polymer (FRP) reinforcement cage (herein referred to as the “FRP cage”) shall be used in lieu of steel reinforcing bars in the concrete bridge deck. The FRP cage shall not be used in the overhang or the concrete parapet (bridge railing). A fiber reinforced polymer is a composite material consisting of fibers embedded in a polymer matrix (also referred to as a binder). Provisions for the FRP composite materials to be used in the FRP cage are presented in Section B. The FRP cage shall be a three-dimensional (3-D) lattice of FRP pultruded members arranged in a rigid form that provides reinforcement to the concrete bridge deck in two directions near the top and bottom surfaces of the deck slab. (Perpendicular to the traffic flow shall be called the “primary” reinforcement direction for the FRP cage, and parallel to the traffic flow shall be called the “secondary” reinforcement direction of the FRP cage.) The FRP cage consists of two planar pultruded grids (called top and bottom grids) of FRP pultruded members arranged in an open lattice form (similar to a COTS pultruded grating) and connected together to form an integral 3-D structure. The individual pultruded members in the primary direction, called “main” bars, of the FRP cage shall be “I” shaped pultruded bars. The individual pultruded members in the secondary direction, called “cross-rods,” of the FRP cage shall be multi-part pultruded elements. The individual pultruded bars in the top and bottom planar grids shall be connected together with interlocking cross-rods so as to provide for in-plane force transfer at their intersections to ensure anchorage in the surrounding concrete. Continuous force transfer along the bars is not required. A portion of the longitudinal fiber reinforcement (rovings) in the individual bars shall be continuous through the intersections. Only the net area of the main bar that contains the fiber reinforcement that is continuous through the intersections shall be used to determine the bar area. The planar grids of the FRP cage may be connected using a proprietary cross-rod connecting system. The separate parts of the cross-rods shall be adhesively bonded to each other, and to the main bars to seal the main bars where holes are drilled for the cross-rods. No metallic parts may be used for connecting the individual parts.
The two planar grids shall be separated and connected by pultruded “shear connectors” normal to the plane of the two planar grids that serve to hold the two planar grids together in a rigid form and also serve to transfer shear forces between the two planar grids. The shear connectors may be vertical and/or inclined members. In addition, the FRP cage shall have members normal to the planar grids that extend downwards from the underside of the bottom planar grid and serve as “integral chairs” for the entire FRP cage. The two planar grids may be connected to form the 3-D cage using a proprietary connection system. The integral chairs of the FRP cage may be provided using a proprietary system. The shear connectors shall be adhesively bonded to the planar grids. No metallic parts may be used for connecting the individual parts. The FRP cage thus described is a single unit that is lifted and placed directly on the bridge deck formwork. Concrete shall be placed over the FRP cage and finished at the top surface. The FRP cage is required to be sufficiently rigid both in its plane and out of its plane to be lifted at specified pick-points and also to be able to withstand construction loads prior to placement of the concrete. The individual members of the FRP cage must be spaced in such a manner as to permit the concrete to “flow” around all elements during placement so as to completely encase the FRP cage and create a void-free bridge deck. Performance requirements for the FRP cage are described in Section B.10. The FRP cage must be produced and delivered to the job-site as a single unit that extends from one edge to the other edge of the bridge deck in its primary direction without requiring any in-field connections or splices. The length and width of the FRP cages shall be as shown in the plans. In the secondary direction of the FRP cage, splices shall be provided between individual FRP cages as shown in the plans. The length of the overlap shall be at least 12 inches. Bars in the top and bottom planar grids in the splice region must be anchored by no less than three perpendicular bars (i.e. main bars) and must be supported by shear connectors and chairs as shown in the plans.

40
A.1. Geometric Requirements. The FRP cage described above shall conform to the following: A.1.1. The primary FRP cage pultruded “main” bars in the top and bottom planar grids shall be commercially produced 1.5 inch high “I” bars and have a net cross-sectional area of no less than 0.32 in2 of GV2 material type. Main bars shall be spaced at 4 in on-center. Main bars may be of any color. A.1.2. The secondary FRP cage pultruded bars in the top and bottom planar grids shall be commercially produced multipart bars (cross-rods) and have a total cross-sectional area of no less than 0.21 in2 of GV1 material. Cross-rods shall be spaced at 4 in on-center. Cross-rods may be of any color. A.1.3. The shear connectors between the top and bottom planar grids shall be spaced at a regular uniform spacing in both the primary and the secondary directions. The spacing of the shear connectors in the primary and the secondary directions does not have to be the same. The shear connectors may be vertical bars, inclined bars or a combination of the two. The shear connectors may be of any color. A.1.4. The integral chairs that protrude from the bottom planar grid shall be spaced at a regular uniform spacing in both the primary and the secondary directions. The spacing of the integral chairs in the primary and the secondary directions does not have to be the same. The integral chairs may be extensions of the shear connectors. The footprint of an individual chair shall no be greater than 1.75 in2. The integral chairs shall be of a grey color. A.1.5. The location of the FRP cage main bars in the top planar grid shall allow for a clear concrete cover of 1.5 inches. A.1.6. The location of the FRP cage main bars in the bottom planar grid shall allow for a clear concrete cover of 1.0 inches.
A.2. Potential Suppliers. Potential suppliers for the FRP cages specified within this provision are limited to the following:
Strongwell, Chatfield Division, 1610 Highway 52 South,
Chatfield, MN 55923, ph: 507-867-3479, fax: 507-867-4254. Creative Pultrusions, Inc., 214 Industrial Lane, Alum
Bank, PA 15521, ph: 888-274-7855, fax: 814-839-4276. Seasafe Inc., 209 Glaser Dr., Lafayette, LA 70508, ph:
800-326-8842, fax: 318-406-8880. Fibergrate Composite Structures Incorporated, 4285
Kellway Circle Suite #224, Addison, TX 75001, ph: 800-527-4043, fax: 972-250-1530.
IKG Industries, Harsco, One Mack Centre Drive,
Paramus, NJ 07652, ph: 201-261-5600, fax: 201-267-0067. A.3. Special Coarse Aggregate for FRP Reinforced
Bridge Deck. The maximum coarse aggregate size in the bridge deck shall be 3/4” or as directed by the engineer. A.4. Submittals. A.4.1. Shop Drawings. Shop drawings of the entire FRP cage and drawings of the individual components shall be submitted for approval prior to fabrication of the FRP cages. The drawings shall indicate the type of composite material for each part of the cage. The method of connection between the parts must be clearly described on the shop drawings. The cross-sectional areas and centroidal axes of all parts shall be shown on cross-sectional drawings of the parts. A.4.2. Lifting and Placement Plan. The methodology for lifting the FRP cage from a truck bed shall be submitted for approval. If cranes, specialized devices and/or equipment (strong backs, spreader bars, lifting straps, etc) are required for the lifting and placement process, these devices must be specified. Shop drawings of the devices must be provided for approval. Locations of special pick-points, if necessary, must be shown on a sketch of the FRP cage and marked on the FRP cage before shipping. It is the general contractor’s responsibility to ensure that the contractor

41
can readily place the FRP cage on the formwork with existing equipment. A.4.3 Mock-Up Section of the FRP Cage. Upon receipt of approval of the shop drawings, and the lifting and placement plan, the manufacturer shall supply a full-scale “mock-up” section of the FRP cage for approval. The full-scale mock up section shall measure 8 ft in the primary direction and shall be full-width in the secondary direction. The mock up section shall have appropriate shear connectors and integral chairs. In the secondary direction of the mock-up details shall be provided on either end that clearly demonstrate how the FRP cage will be spliced in the secondary direction to adjoining cages. The cost of the mock-up shall be incidental to the unit cost. A.4.4. Number of Copies. The general contractor shall anticipate a minimum of 8 copies of blue or black-line prints for shop drawing submittals. A.4.5. Timing of Submittals. Deliver each shop drawing, lifting and placement plan, and mock-up section submittals requiring approval in time to allow for a minimum of 10 working days for review and processing, not including resubmittals if necessary. Submit all material test reports (see Section B.11) upon delivery of FRP materials to the jobsite. Deliver all quality assurance items (see Section C.1-C.4) at least seven weeks prior to delivery of the FRP cages to the job site. Failure of the general contractor in these respects will not be considered as grounds for an extension of the contract time. If a submittal must be delayed for coordination with other submittals not yet submitted, the engineer may at his option either return the submittal with no action or notify the general contractor of the other submittals which must be received before the submittal can be reviewed. A.4.6. Approval of Submittals. Contractor shall not commence work which requires review of any submittals until receipt of returned submittals with an acceptable action. B. Materials and Manufacturing. B.1. Fibers. Any commercial grade E-glass is permitted. The fiber may be in the form of unidirectional rovings or tows of
any size or weight, or can be in the form of stitched, woven, braided or non-woven fabrics, or mats of any size or weight. Fiber sizings and coupling agents shall be appropriate for the resin system used. The manufacturer of the fiber and the manufacturer of any fabrics or mats must be reported. B.2 Resins. Any commercial grade vinylester thermosetting polymer resin is permitted. A vinylester resin is defined as a thermosetting reaction product of an epoxy resin with an unsaturated acid, usually methacrylic acid, which is then diluted with a reactive monomer, usually styrene (ASTM C904). The base polymer in the resin system shall not contain any polyester. Blending of vinylester resins is permitted. The manufacturer of the polymer resin must be reported. Styrene may be added to the polymer resin during processing. The amount of styrene, as a weight percentage of the polymer resin, added during processing shall be reported. Added styrene shall be less than 10% by weight of resin (pph resin). B.3. Fillers. Commercial grade inorganic fillers such as kaolin clay, calcium carbonate, and alumina trihydrate are permitted and shall not exceed 20% by weight of the polymer resin constituent. The type and manufacturer of the inorganic filler must be reported. Commercial grade additives and process-aids, such as, release agents, low-profile shrink additives, initiators, promoters, hardeners, catalysts, pigments, fire-retardants, and ultra-violet inhibitors are permitted as appropriate for the processing method. Shrink additives shall be less than 10% by weight of the polymer resin. Commercial grade inorganic or organic non-woven surfacing mats or veils are permitted. B.4. Manufacturing Process. FRP materials must be produced using the pultrusion manufacturing process. All FRP material parts provided to the job site must be produced using the same pultrusion die and in the same production lot. The manufacturer shall report maximum internal pultrusion die temperature measured by thermocouple. The manufacturer shall report the date of production and the lot size. B.5. Fiber Architecture. Three classes of fiber architecture are permitted for the FRP material. The division into

42
the three classes depends on the total fiber volume fraction (expressed as a percent of the total material volume) and the total volume of continuous longitudinal fiber (expressed as a percent of the total fiber volume) along the longitudinal axis of the pultruded part (also called the 0 degree axis.) Non-woven Continuous Filament Mats (CFM) (also known as Continuous Strand Mats (CSM)) are included in the total fiber volume fraction count. Only continuous fibers in the longitudinal direction are included in the total longitudinal fiber volume. The fiber architecture classes are defined as the following: B.5.1. TYPE 1 FRP MATERIAL shall have a total fiber volume fraction of 55% or greater and shall have a total longitudinal fiber volume of (relative to the total fiber volume) 90% or greater. B.5.2. TYPE 2 FRP MATERIAL shall have a total fiber volume fraction of 45% or greater and shall have a total longitudinal fiber volume of (relative to the total fiber volume) 75% or greater. B.5.3. TYPE 3 FRP MATERIAL shall have a total fiber volume fraction of 40% or greater and shall have a total longitudinal fiber volume of (relative to the total fiber volume) 50% or greater. B.6. Classification Nomenclature. The material shall be classified according to its fiber type, resin type and fiber architecture. Parts having at least three-dimensional transversely isotropic symmetry or two-dimensional (in-plane) orthotropic symmetry are permitted. For in-plane orthotropy, laminates shall be balanced and symmetric. The classification is applied to every distinct laminate thickness and fiber architecture within the FRP part. The classification nomenclature is as follows: fiber type, polymer resin type, architecture type (e.g., GV2 designates a glass/ vinylester type 2 FRP material). Manufacturer shall report items detailed above in a tabular form as shown in Table B.6-1 for the FRP materials produced. Information shall be provided separately for each distinct pultruded part in the FRP cage.
Table A-0-1 Reporting Requirements for Constituent Materials of FRP cage
ITEM TYPE MANUFACTURER
SPECIAL REQUIREMENTS
Fiber E-glass roving type E-glass roving manufacturer
NA
E-glass fabric type(s) E-glass fabric manufacturer
NA
E-glass mat type E-glass mat manufacturer type
NA
Veil Surface veil type Surface veil manufacturer
NA
Resin Vinylester type(s) Vinylester manufacturer
NA
Styrene type Styrene manufacturer
pph (less than 10 pph resin)
Filler Filler type Filler manufacturer pph (less than 20 pph resin)
Additives Shrink additive type Shrink additive manufacturer
pph (less than 10 pph resin)
Process Pultusion die temperature
NA NA
Date of production NA NA Lot size NA NA
B.7. Classification of Parts for FRP Cages. The FRP
materials to be used in the FRP Cage are classified as Glass/Vinylester material type GV1, GV2 or GV3. Since the FRP cage is assembled from distinct parts, different fiber architecture types are permitted as follows: B.7.1. Primary load-bearing bars (I-bars) of the FRP cage shall be of GV2 material and shall consist of unidirectional roving, continuous strand mat and surfacing veil.

43
B.7.2. Secondary connecting cross-rods of the FRP cage shall be of GV1 material and shall consist of unidirectional glass roving and surfacing veil only. B.7.3. Shear connectors and integral chairs may be of material type GV1, GV2 or GV3 material. B.8. Physical and Mechanical Properties. Physical and mechanical tests shall be conducted on coupons extracted from the as-produced FRP materials according to the ASTM tests listed below. Tests shall be conducted on material produced specifically for this project. In cases where the required sized coupon can not be extracted from the cured part, a “test property laminate” shall be used. The test property laminate shall have the same fiber architecture to the laminate within the part and shall be manufactured using the same processing method and under the same conditions as the part. For mechanical property measurements, specimens should be conditioned prior to testing (pre-conditioned) according to Procedure A of ASTM D618. For all mechanical measurements, no fewer than five (5) specimens shall be tested. For physical measurements the number of tests shall be as per the applicable ASTM specification. Individual test data values, mean and coefficient of variation shall be reported for all tests. Deviations from standard test methods shall be reported. As-produced short-term properties for GV1, GV2 and GV3 materials shall meet or exceed the values shown in Table B.8-1. The FRP cage manufacturer shall conduct tests and provide a certified report with data shown in Table B.8-1. Test coupons for GV2 material must be cut from the I-bar web for longitudinal property tests and physical tests, and from an equivalent test property laminate for transverse property tests. Test coupons for mechanical tests for GV1 material may be cut from equivalent test property laminates (e.g., unidirectional rods.) Test coupons for mechanical tests for GV3 materials may be machined from parts to achieve required ASTM test specimen dimensions or may be cut from test property laminates.
Table A-0-2 Limiting Physical and Mechanical Properties for FRP Cage Materials
MATERIAL PROPERTY ASTM TEST
GV1 MATERIAL
GV2 MATERIAL
GV3 MATERIAL
Mechanical Property Strength Property Longitudinal Tensile Strength (min)
D3039, D5083, D638, D3916
95.0 ksi 80.0 ksi 40.0 ksi
Transverse Tensile Strength (min)
D3039, D5083, D638
NA 4.0 ksi 4.0 ksi
Longitudinal Compressive Strength (min)
D3410, D695
75.0 ksi 60.0 ksi 30.0 ksi
Transverse Compressive Strength (min)
D3410, D695
NA 10.0 ksi 10.0 ksi
Long. Short Beam Shear Strength (min)
D2344, D4475
6.0 ksi 5.0 ksi 5.0 ksi
Stiffness Property Longitudinal Tensile Modulus (min)
D3039, D5083, D638
5.5 Msi 4.5 Msi 2.5 ksi
Longitudinal Compressive Modulus (min)
D3410, D695
NA 4.0 Msi 2.0 ksi
In-Plane Shear Stiffness (min)
D5379 NA 0.40 Msi 0.30 Msi
Major (longitudinal) Poisson Ratio (min)
D3039, D5083, D638
NA 0.25 0.25
Physical Property Fiber Volume Fraction (min)
D3171, D2584
55% 45% 40%
Barcol Hardness (min) D2583 50 50 50 Glass Transition Temperature (min)
E1356, D3418,
203°F (95°C)
203°F (95°C)
203°F (95°C)

44
MATERIAL PROPERTY ASTM TEST
GV1 MATERIAL
GV2 MATERIAL
GV3 MATERIAL
E1640 Water absorption (immerse at 50°C for 48 hours)
D570 0.50% 0.75% 1.00%
Long. Coeff. of Thermal Expansion (max)
D696, E831
6 x 10⁻⁶/°F 6 x 10⁻⁶/°F 6 x 10⁻⁶/°F
Trans. Coeff. of Thermal Expansion (max)
D696, E831
NA 30 x 10-
6/°F 30 x 10-
6/°F
B.9. Special Requirements. B.9.1. Production and Assembly. All distinct FRP cage parts must be produced using the same pultrusion operation, using identical shaped dies, and in the same production lot. The manufacturer shall report the date and time of production of the FRP cage elements. B.9.2. Product Marking. Each FRP cage shall be marked with the designation of this provision, manufacturer’s name, date of production, and manufacturer’s part identification number. Markings shall occur at least every 8.0 ft in linear measurement or at least every 100 ft.2 of surface area. B.9.3. Dimensional Tolerance. Pultruded FRP cage elements shall conform to ASTM 3917. B.9.4. Sealing of Cut Ends. Manufacturer shall seal all cut ends of the pultruded FRP cage elements with an epoxy or vinylester resin prior to shipment. B.10. Performance Requirements. B.10.1. Scope. The 3-D FRP reinforcing cage shall meet the following performance requirements to ensure its ability to maintain integrity during the bridge construction process. The requirements are specifically defined to achieve a cage system that can withstand forces occurring during lifting and handling at the construction site and during casting of the concrete deck. Test specimens used to prove performance criteria shall be constructed of materials and in a fashion that represents an actual bridge FRP
cage. The assembly shall be representative of normal workmanship. It shall be constructed using full-scale materials. B.10.2. Lifting Requirements. The FRP cage may be lifted by crane in moving from the truck and placing on the bridge deck. The FRP cage must have sufficient strength to resist picking loads, the locations of which shall be coordinated with the general contractor. B.10.3. Construction Loads: Vertical. Under vertical construction loading, before and during placement of the wet concrete, the FRP cage must be able to resist vertical construction loads. In this condition the FRP cage system will be supported on its integral chair above the formwork. To ensure satisfactory performance, a sub-assembly of the FRP cage must meet the following strength and deflection criteria when loaded as specified.

45
Figure A-0-1 Schematic of test assembly for measuring performance
B.10.3.1. Test Sub-Assembly. This performance criterion refers to the behavior of a portion of the full-size FRP cage which is referred to as the “test assembly”. The spacing of support chairs in the primary direction of the cage is denoted as SP. The spacing of the support chairs are denoted as SS in the secondary direction of the FRP cage. The test sub-assembly shall consist of a portion of the full size FRP cage that has a length of 1.5 times SS and a width of 1.5 times SP. The support chairs shall be placed at 0.25 times SS or SP from each edge of the sub-assembly (see Figure B.10.3-1). B.10.3.2. Loading Criteria. The sub-assembly must resist a load of 500 lbs. applied over a 1-foot square area on the top surface of the 3-D cage. The load shall be applied at the center of the sub-assembly, mid-way between the support chairs as illustrated in Figure B.10.3-1. B.10.3.3. Acceptance Criteria. The 3-D reinforcing cage must have sufficient strength to resist the 500 lb. vertical load on the top surface without exceeding 50% of the FRP ultimate stress capacity in any portion of the cage. The reinforcing cage must have sufficient stiffness to resist the 500 lb. vertical load without developing a downward deflection of the top surface, relative to the support below the feet, exceeding 0.4 inches directly under the load as illustrated in Figure B.10.3-2. Upon removal of
the 500 lb. load the top surface must return to its original position +/- 0.05 inches.
Figure A-0-2 A deflection limit is provided for the top surface of the FRP cage under vertical loading.
B.10.4. Construction loads: Lateral. The FRP cage shall resist lateral loads applied to the top surface without excessive deformation or collapse during construction. To ensure satisfactory performance, a sub-assembly of the cage system must meet the following strength and deflection criteria when loaded as specified. B.10.4.1. Test Sub-Assembly. This performance criterion refers to the behavior of a portion of the full-size FRP cage which is referred to as the “test assembly”. The spacing of support chairs in the primary direction of the cage is denoted as SP. The spacing of the support chairs are denoted as SS in the secondary direction of the FRP cage. The test sub-assembly shall consist of a portion of the full size FRP cage that has a length of 1.5 times SS and a width of 1.5 times SP. The support chairs shall be placed at 0.25 times SS or SP from each edge of the sub-assembly (see Figure B.10.3-1). The test shall be conducted in the primary and the secondary direction of the FRP cage. B.10.4.2. Loading Criteria. The sub-assembly must resist a combination of two loads of 200 lbs., one applied in the plane of the top surface and the other applied in the plane of the bottom surface as shown in Figure B.10.4-1. The loads are to be applied at the middle of the top and bottom edges using a 2 inch

46
wide nylon strap wrapped around a member of the top grid or an equivalent load application method.
Figure A-0-3 Load application locations for lateral load test assembly.
B.10.4.3 Acceptance Criteria. The slope of the lateral displacement of the top surface, relative to the bottom surface, must not exceed 1 inch under the 200 lb. load as illustrated in Figure B.10.4-2. The top and bottom grids must return to their original undeflected position, +/- 0.1 inches, upon removal of the 200 lb. load.
Figure A-0-4 Acceptance criteria for lateral load test.
B.10.5. Construction Loads: In Plane Racking. The FRP cage shall resist lateral loads applied to the top surface without excessive deformation or collapse during construction. To ensure satisfactory performance, a sub-assembly of the cage system must meet the following strength and deflection criteria when loaded as specified. B.10.5.1. Test Sub-Assembly. This performance criteria refers to the behavior of a portion of the full-size FRP cage which is here referred to as the “test assembly”. The sub-assembly consists of a portion of the full-size FRP cage which has a length of 6 feet and width of 6 feet, and has appropriately spaced shear connectors. B.10.5.2. Loading Criteria. The sub-assembly must resist two loads of 100 lbs., one applied at one corner of the surface and the other applied at a diagonally opposite corner as illustrated in the plan view of Figure B.10.5-1. The loads are to be applied using a 2-inch wide nylon strap wrapped around the corners of the top grid, or an equivalent application method.

47
Figure A-0-5 Loading on a sub-assembly for the in-plane racking test.
B.10.5.3. Acceptance Criteria. The change in length of either diagonal between corners of the surface after loading with 100 lb. loads must not exceed 1 inch or 1% of the original length before loading. Upon removal of the load the surface must return to its original undeformed shape, +/- 0.05 inches. B.10.6. Construction Loads: Vertical Load on Splice Overlap. The top grid layer at the lap along the edges of the FRP cage shall withstand vertical loads, remain stable, and not show excessive deformation or damage. To ensure satisfactory performance, a sub-assembly of the cage shall meet the following strength, stability and deflection criteria when loaded in the specified fashion. B.10.6.1. Test Sub-Assembly. This performance criterion refers to the behavior of a portion of the full-size FRP cage which is here referred to as the “test assembly”. The sub-assembly consists of a portion of the FRP cage that has a width perpendicular to the lapped edge equal to that of the full scale FRP
cage, and a length parallel to the primary reinforcing direction of 1.5 Sp. Sp is the spacing of the support chairs in the primary direction of the cage. An adjacent piece of FRP cage that is relied upon to support the overhang of the lap on the top grid, must be placed adjoining the test assembly with that support feature in place. B.10.6.2. Loading Criteria. The test assembly must resist a vertical load of 200 lbs applied over a 1-foot square on the top surface of the FRP cage. The square foot loaded area is placed adjacent to the edge of the top grid where the top grid extends beyond the lower grid. B.10.6.3. Acceptance Criteria. The FRP cage shall have sufficient strength to resist the 200 lb. vertical load without exceeding 50% of the FRP ultimate stress capacity in any portion of the cage. The FRP cage must have sufficient stiffness to resist the 200 lb. load without developing a downward deflection of the top surface, relative to the support surface below the support chairs, exceeding 0.4 inches in the direction of the load. Upon removal of the load the top surface shall return to its original position +/- 0.1 inches. B.11. Reporting and Certification Requirements. The manufacturer of FRP materials shall report items detailed in Section B and provide tabulated values as in Tables B.6-1 and B.8-1. Test data shall be supplied separately as per Section B.7. The manufacturer of the FRP cages shall certify that the FRP cages meet the performance requirements of Section B.10. An authorized company representative shall sign, date and certify all test reports. Two copies of the certified test reports shall be provided at the time of material delivery. Reports and certifications shall be provided by the manufacturer to the engineer for approval. B.12. Referenced ASTM Methods. Standards of the American Society of Testing and Materials referred to in this provision are listed below. All standards appear in the current annual edition of ASTM standards published by the American Society of Testing and Materials, West Conshohocken, PA.
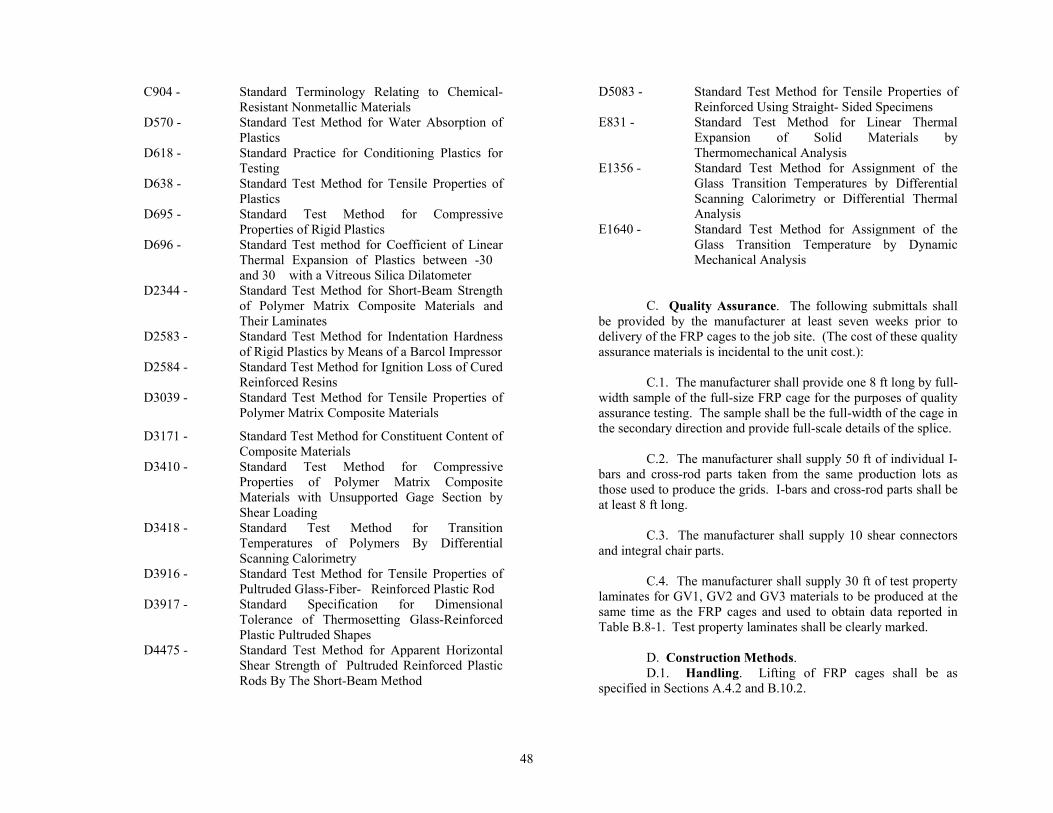
48
C904 - Standard Terminology Relating to Chemical-Resistant Nonmetallic Materials
D570 - Standard Test Method for Water Absorption of Plastics
D618 - Standard Practice for Conditioning Plastics for Testing
D638 - Standard Test Method for Tensile Properties of Plastics
D695 - Standard Test Method for Compressive Properties of Rigid Plastics
D696 - Standard Test method for Coefficient of Linear Thermal Expansion of Plastics between -30� and 30� with a Vitreous Silica Dilatometer
D2344 - Standard Test Method for Short-Beam Strength of Polymer Matrix Composite Materials and Their Laminates
D2583 - Standard Test Method for Indentation Hardness of Rigid Plastics by Means of a Barcol Impressor
D2584 - Standard Test Method for Ignition Loss of Cured Reinforced Resins
D3039 - Standard Test Method for Tensile Properties of Polymer Matrix Composite Materials
D3171 - Standard Test Method for Constituent Content of Composite Materials
D3410 - Standard Test Method for Compressive Properties of Polymer Matrix Composite Materials with Unsupported Gage Section by Shear Loading
D3418 - Standard Test Method for Transition Temperatures of Polymers By Differential Scanning Calorimetry
D3916 - Standard Test Method for Tensile Properties of Pultruded Glass-Fiber- Reinforced Plastic Rod
D3917 - Standard Specification for Dimensional Tolerance of Thermosetting Glass-Reinforced Plastic Pultruded Shapes
D4475 - Standard Test Method for Apparent Horizontal Shear Strength of Pultruded Reinforced Plastic Rods By The Short-Beam Method
D5083 - Standard Test Method for Tensile Properties of Reinforced Using Straight- Sided Specimens
E831 - Standard Test Method for Linear Thermal Expansion of Solid Materials by Thermomechanical Analysis
E1356 - Standard Test Method for Assignment of the Glass Transition Temperatures by Differential Scanning Calorimetry or Differential Thermal Analysis
E1640 - Standard Test Method for Assignment of the Glass Transition Temperature by Dynamic Mechanical Analysis
C. Quality Assurance. The following submittals shall be provided by the manufacturer at least seven weeks prior to delivery of the FRP cages to the job site. (The cost of these quality assurance materials is incidental to the unit cost.): C.1. The manufacturer shall provide one 8 ft long by full-width sample of the full-size FRP cage for the purposes of quality assurance testing. The sample shall be the full-width of the cage in the secondary direction and provide full-scale details of the splice. C.2. The manufacturer shall supply 50 ft of individual I-bars and cross-rod parts taken from the same production lots as those used to produce the grids. I-bars and cross-rod parts shall be at least 8 ft long. C.3. The manufacturer shall supply 10 shear connectors and integral chair parts. C.4. The manufacturer shall supply 30 ft of test property laminates for GV1, GV2 and GV3 materials to be produced at the same time as the FRP cages and used to obtain data reported in Table B.8-1. Test property laminates shall be clearly marked. D. Construction Methods. D.1. Handling. Lifting of FRP cages shall be as specified in Sections A.4.2 and B.10.2.

49
D.2. Storage. The FRP cages shall be stored off the ground until placement on the formwork and in a manner to prevent foreign materials such as soil, grease, or dust, from coating the grid members. The grid surface shall be clean and dry prior to placement of concrete. D.3. Installation. The FRP cages shall be placed in position over the forms with a lateral dimensional tolerance of +/- 1 inch of the plan specified location. If integral chairs of grids are not in contact with the tops of the concrete girders, masonry spacers, may be placed under the feet to provide support. Miscellaneous reinforcing may be tied directly to the FRP cage members but should be kept within the interior of the FRP cage. All ties used to connect portions of the FRP cage or other FRP reinforcing materials must be of plastic material. Any ties used to tie materials other than FRP members shall be of the same material and coating as the item to be tied. D.4. Repair. Damage to any part of the FRP cage must be reported to the engineer. The decision to repair and the type of repair must be approved by the engineer before commencing. E. Method of Measurement. The quantity of FRP cage reinforcement to be paid for will be measured by the square foot of bridge deck, as measured from out-to-out of parapets and between the paving notches. F. Basis of Payment. The quantity, measured as provided above, will be paid for at the contract unit price per square foot for FIBER REINFORCED POLYMER (FRP) REINFORCEMENT CAGE, as shown on the plans and in accordance with this provision, which price shall be full compensation for fabricating, furnishing, testing, storing, handling, and erecting the grid reinforcement, and for furnishing all equipment, tools, labor, and incidentals necessary to complete the work in accordance with the contract. FRP cage materials required for reporting and certification, mock-ups, and quality assurance shall be incidental to the unit cost.
(032503) D.3. Installation. The FRP cages shall be placed in position over the forms with a lateral dimensional tolerance of +/- 1 inch of the plan specified location. If integral chairs of grids are not in contact with the tops of the concrete girders, masonry spacers, may be placed under the feet to provide support. Miscellaneous reinforcing may be tied directly to the FRP cage members but should be kept within the interior of the FRP cage. All ties used to connect portions of the FRP cage or other FRP reinforcing materials must be of plastic material. Any ties used to tie materials other than FRP members shall be of the same material and coating as the item to be tied. D.4. Repair. Damage to any part of the FRP cage must be reported to the engineer. The decision to repair and the type of repair must be approved by the engineer before commencing. E. Method of Measurement. The quantity of FRP cage reinforcement to be paid for will be measured by the square foot of bridge deck, as measured from out-to-out of parapets and between the paving notches. F. Basis of Payment. The quantity, measured as provided above, will be paid for at the contract unit price per square foot for FIBER REINFORCED POLYMER (FRP) REINFORCEMENT CAGE, as shown on the plans and in accordance with this provision, which price shall be full compensation for fabricating, furnishing, testing, storing, handling, and erecting the grid reinforcement, and for furnishing all equipment, tools, labor, and incidentals necessary to complete the work in accordance with the contract. FRP cage materials required for reporting and certification, mock-ups, and quality assurance shall be incidental to the unit cost. (032503)

50
Appendix B: Material Specification for FRP Materials
Table B-0-1 Comparison of QA Results for GV-1 with Specified Requirements and Strongwell Results
Material Property ASTM Test
Specification Strongwell QA
Strength Property Longitudinal Tensile Strength (min)
D3039, D5083
95 ksi 160.4 ksi 81.6 ksi
Transverse Tensile Strength (min)
D3039, D5083
NA NA NA
Longitudinal Compressive Strength (min)
D3410, D695
75 ksi 77.9 ksi -
Transverse Compressive Strength (min)
D3410, D695
NA NA NA
Longitudinal Short Beam Shear Strength (min)
D2344 6.0 ksi 8.5 ksi 6.2 ksi
Stiffness Property Longitudinal Tensile Modulus (min)
D3039, D5083
5.5 Msi 6.9 Msi 7.0 Msi
Longitudinal Compressive Modulus (min)
D3410, D695
NA NA NA
In-Plane Shear Stiffness (min)
D5379 NA NA NA
Major Longitudinal Poisson Ratio (min)
D3039, D5083
NA NA NA
Physical Property Fiber Volume Fraction (min)
D3171, D2584
55% 60% 56%
Barcol Hardness (min)
D2583 50 64 58
Glass Transition Temp. (min)
E1356, D3418
203 °F 332 °F -
Water Absorption (max)
D570 0.50% 0.12% 0.23%
Longitudinal Coeff. of Thermal Expansion (max)
D696 6 x 10⁻⁶
/°F 3.4 x 10⁻⁶ /°F -
Transverse Coeff. of Thermal Expansion (max)
D696 NA NA NA

51
Table B-0-2 Comparison of QA Results for GV-2 with Specified Requirements and Strongwell Results
Material Property ASTM Test
Specification Strongwell QA
Strength Property Longitudinal Tensile Strength (min)
D3039, D5083
80 ksi 89.1 ksi 94.3 ksi / 103.8 ksi
Transverse Tensile Strength (min)
D3039, D5083
4 ksi 7.06 ksi 6.8 ksi
Longitudinal Compressive Strength (min)
D3410, D695
60 ksi 86.62 ksi 30 ksi
Transverse Compressive Strength (min)
D3410, D695
10 ksi 21.28 ksi 10 ksi
Longitudinal Short Beam Shear Strength (min)
D2344 5 ksi 5.95 ksi 4.5 ksi
Stiffness Property Longitudinal Tensile Modulus (min)
D3039, D5083
4.5 Msi 5.29 Msi 4.75 Msi /4.43 Msi
Longitudinal Compressive Modulus (min)
D3410, D695
4.0 Msi 5.33 Msi -
In-Plane Shear Stiffness (min)
D5379 0.4 Msi 0.609 Msi -
Major Longitudinal Poisson Ratio (min)
D3039, D5083
0.25 0.35 -
Physical Property Fiber Volume Fraction (min)
D3171, D2584
45% 51.58% 48.6% /44.6%
Barcol Hardness (min)
D2583 50 64.4 56
Glass Transition Temp. (min)
E1356, D3418
203 °F 316 °F -
Water Absorption (max)
D570 0.75% 0.20% 0.29%
Longitudinal Coeff. of Thermal Expansion (max)
D696 6 x 10⁻⁶ /°F 4.1 x 10⁻⁶ /°F -
Transverse Coeff. of Thermal Expansion (max)
D696 30 x 10-6 /°F 14.3 x 10⁻⁶
/°F -

52
Table B-0-3 Comparison of QA Results for GV-3 with Specified Requirements and Strongwell Results
Material Property ASTM Test
Specification Strongwell QA
Strength Property Longitudinal Tensile Strength (min)
D3039, D5083
40 ksi 73 ksi 55 ksi /65 ksi
Transverse Tensile Strength (min)
D3039, D5083
4 ksi 4.3 ksi 4.9 ksi
Longitudinal Compressive Strength (min)
D3410, D695
30 ksi 77.41 ksi -
Transverse Compressive Strength (min)
D3410, D695
10 ksi 16.58 ksi -
Longitudinal Short Beam Shear Strength (min)
D2344 5 ksi 5.61 ksi 6.2 ksi /5.5 ksi
Stiffness Property Longitudinal Tensile Modulus (min)
D3039, D5083
2.5 Msi 6.3 Msi 5.5 Msi /5.7 Msi
Longitudinal Compressive Modulus (min)
D3410, D695
2.0 Msi 5.74 Msi -
In-Plane Shear Stiffness (min)
D5379 0.3 Msi 0.58 Msi -
Major Longitudinal Poisson Ratio (min)
D3039, D5083
0.25 0.25 -
Physical Property Fiber Volume Fraction (min)
D3171, D2584
40% 60% 59% / 57%
Barcol Hardness (min)
D2583 50 55 50
Glass Transition Temp. (min)
E1356, D3418
203 °F 313 °F -
Water Absorption (max)
D570 1.00% 0.27% 0.31%
Longitudinal Coeff. of Thermal Expansion (max)
D696 6 x 10⁻⁶
/°F 4.1 x 10⁻⁶ /°F -
Transverse Coeff. of Thermal Expansion (max)
D696 30 x 10-6
/°F 14.3 x 10⁻⁶
/°F

53
Appendix C: Selected Bridge
Figure C-0-1 Plan view of bridge B-20-148 (FRP)

54
Figure C-0-2 Plan view of bridge B-20-149 (steel)


![Index [rd.springer.com]978-3-7091-7496-8/1.pdf · 556 disk, 147, 149, 151, 152, 153, 154, 155, 158 eminence, 148, 150, 151, 156, 157, 158 artificial modifications, 387, 388, 399,](https://static.fdocuments.us/doc/165x107/5e1bbc049884755165583ef8/index-rd-978-3-7091-7496-81pdf-556-disk-147-149-151-152-153-154-155.jpg)


