ibm debug tool - nwrdc
133
Steve Menard Northwest Regional Data Center
Transcript of ibm debug tool - nwrdc
Steve Menard Northwest Regional Data Center

Some of the following slides and screen shots were prepared by FSU students Ryan Huff and Kris Suchdeve, working as interns to the Northwest Regional Data Center.
Awesome IBM Web Based Training: ◦ http://publib.boulder.ibm.com/infocenter/ieduasst/stgv1r0/index.jsp
COBOL applications are compiled with a new compiler option and DD card in the compile step.
As the compiler runs, three things are generated: ◦ Compile listing.
◦ Source Information File (SIF), normally a PDSE with the program name as the member name.
◦ Load module for execution. The load module contains the DSN of the Source Information File.
When any LE load module is invoked, a check is made to see if a debugging session has been designated. If not, the application runs unaffected.
If debugging has been designated, the SIF’s DSN is picked up from the load module and is dynamically allocated and read.
If the date and time match, then the data from the SIF is used to set breakpoints etc.
The Source Information File can have a production counterpart. ◦ Copy the appropriate member into a “production”
SIS file as part of your promotion process. This will greatly improve the Fault Analyzer process.
◦ It will also allow you to set breakpoints into a production batch job to see why that version is running as coded instead of as intended.

Batch intercepts are accomplished by adding to the JCL of the program that is the target of debugging.
DB2 Stored Procedure intercepts are accomplished by altering the DB2 definition of the SP.
CICS intercepts are accomplished by the DTCN transaction that is used to define the session attributes (terminal, transaction, program name) of the debugging target.

CICS Debugging is done by connection directly to CICS via a 3270 terminal and controlling the debugging process from there.
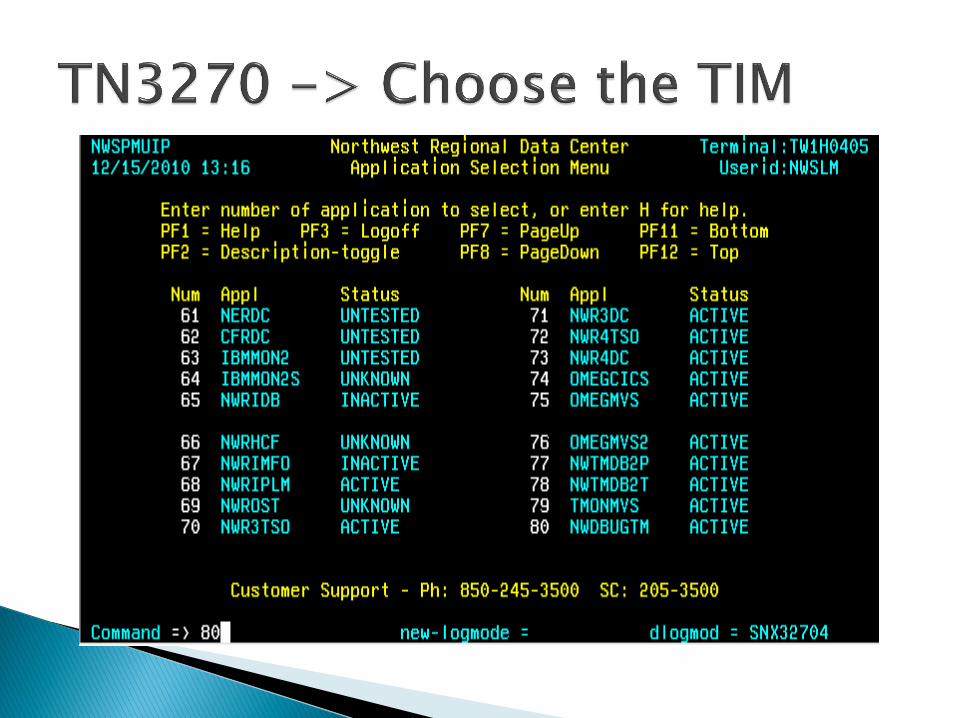
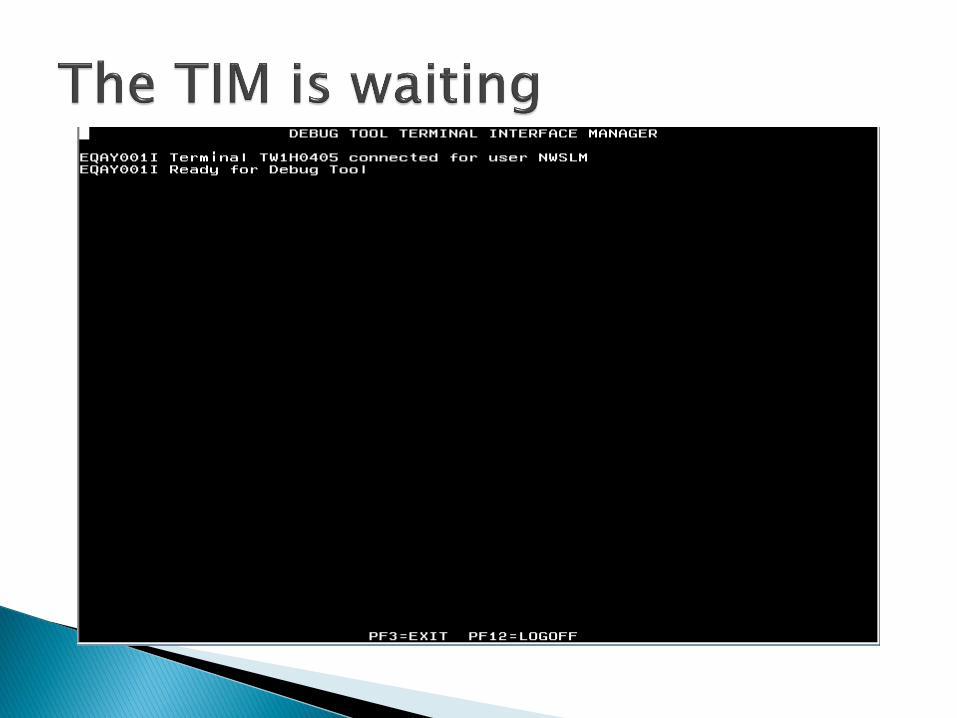
Batch jobs, TSO applications and DB2 stored procedures are debugged using a special 3270 task called the Terminal Information Manager (TIM).
There is also a PC based GUI for debugging for both CICS and Batch.

Compile your program with the debugging options added to your JCL.
Change your batch execution JCL to invoke the Debugging process.
Logon to the TIM through a dedicated TN3270 session.
Submit your batch job.
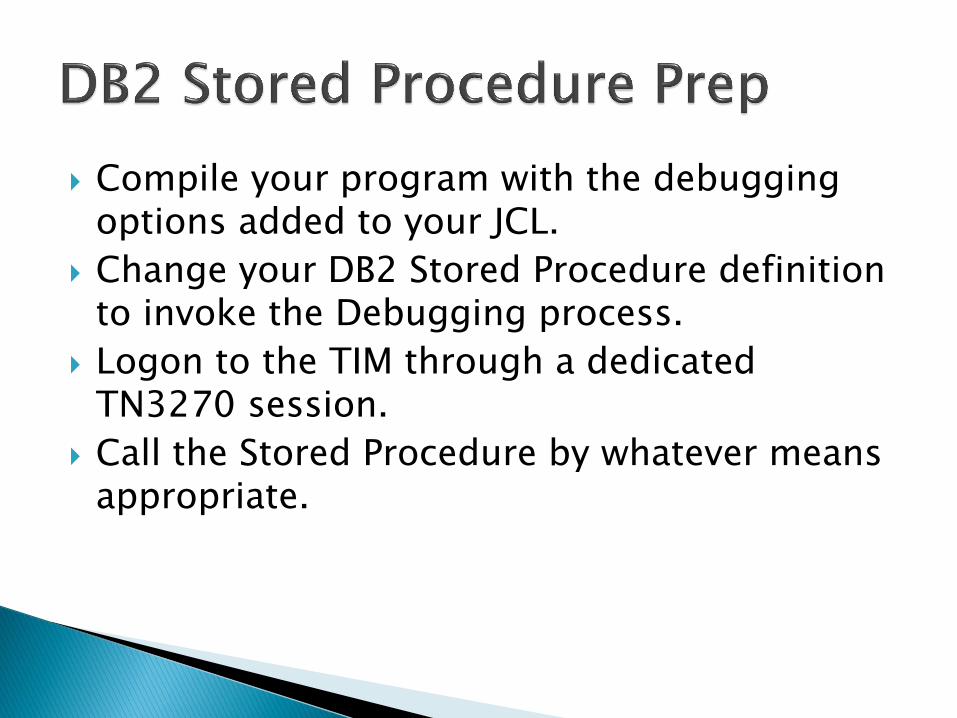
Compile your program with the debugging options added to your JCL.
Change your DB2 Stored Procedure definition to invoke the Debugging process.
Logon to the TIM through a dedicated TN3270 session.
Call the Stored Procedure by whatever means appropriate.
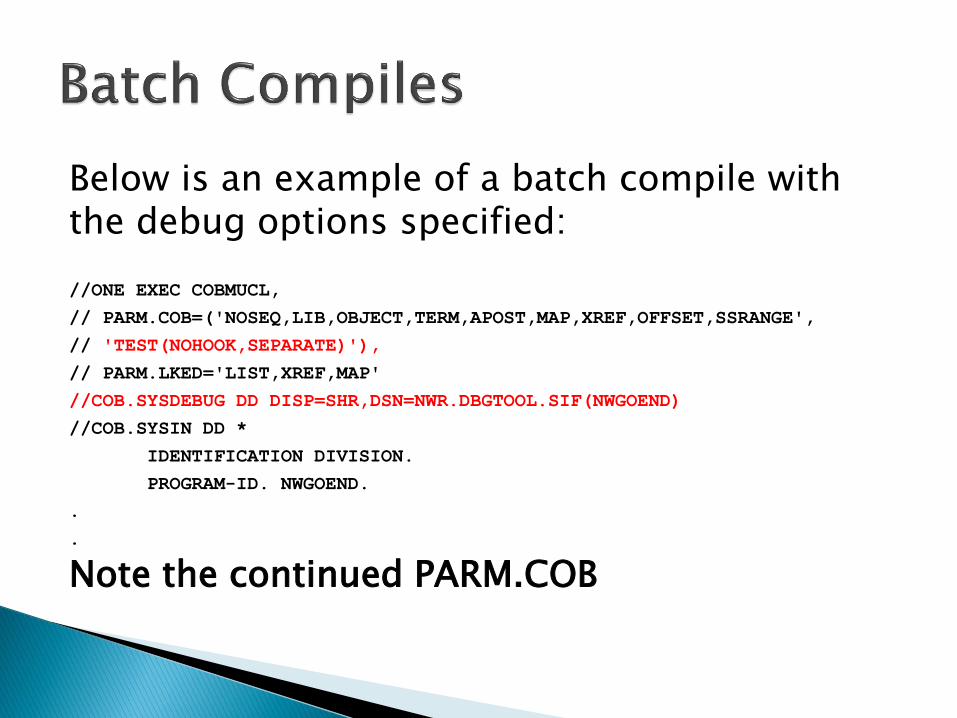
Below is an example of a batch compile with the debug options specified:
//ONE EXEC COBMUCL,
// PARM.COB=('NOSEQ,LIB,OBJECT,TERM,APOST,MAP,XREF,OFFSET,SSRANGE',
// 'TEST(NOHOOK,SEPARATE)'),
// PARM.LKED='LIST,XREF,MAP'
//COB.SYSDEBUG DD DISP=SHR,DSN=NWR.DBGTOOL.SIF(NWGOEND)
//COB.SYSIN DD *
IDENTIFICATION DIVISION.
PROGRAM-ID. NWGOEND.
.
.
Note the continued PARM.COB

Below is an example of a SP compile with the debug options specified:
//DB2COB2 EXEC DB2COBM,MEMBER=NWNEWCB1,
// DBRMLIB='NW.SLM.DBRM.PROD',
// LINKLIB='KICS.USER.PRIVLOAD',
// SRCLIB1='KICS.APPL.NEWC.LIB',
// COPYLIB='NW.SLM.DB2DATA',
// LITERAL='APOST,SOURCE',
// COBOPT='LIB,OBJECT,TRUNC(BIN),XREF,MAP,OFFSET'
//ONE EXEC COBMUCL,
// PARM.COB=('NOSEQ,LIB,OBJECT,TERM,APOST,MAP,XREF,OFFSET,SSRANGE',
// 'TEST(NOHOOK,SEPARATE)'),
// PARM.LKED='LIST,XREF,MAP'
//COB.SYSDEBUG DD DISP=SHR,DSN=NWR.DBGTOOL.SIF(NWGOEND)
//COB.SYSIN DD *
IDENTIFICATION DIVISION.
PROGRAM-ID. NWGOEND.
.
.
Note the continued PARM.COB

//TEST EXEC PGM=NWGOEND,PARM=‘YOUR PARM’
//STEPLIB DD DISP=SHR,DSN=NWR.LINKLIB
//CEEOPTS DD *
//CEEOPTS DD DISP=SHR,DSN=PDSE(NWSLM)
TEST(,,,VTAM%NWSLM:)
//TEST EXEC PGM=NWGOEND,PARM=‘YOUR PARM/TEST(,,,VTAM%NWSLM:)’
//STEPLIB DD DISP=SHR,DSN=NWR.LINKLIB
//TEST EXEC PGM=IKJEFT01
//SYSTSPRT DD SYSOUT=A
//SYSPRINT DD SYSOUT=A
//SYSTSIN DD *
DSN SYSTEM(DSN)
RUN PROGRAM(NWPROG) PLAN(NWPROG) -
PARMS(‘/TEST(,,,VTAM%NWSLM:)’) -
LIB(‘NWR.LINKLIB’)
END

Alter the DB2 definition of the Stored Procedure: alter procedure xxx run options ‘TEST(,,,VTAM%userid:*)’;
Where xxx is the name of the SP and userid is the ACF2 logon ID that will be connected to the TIM when the debugging session is going to start.
If you are defining a new SP just include the ‘run options’ parameter as described above.
Remember to inform you co-workers that they should NOT invoke your SP until the ‘run options’ parameter has been removed.


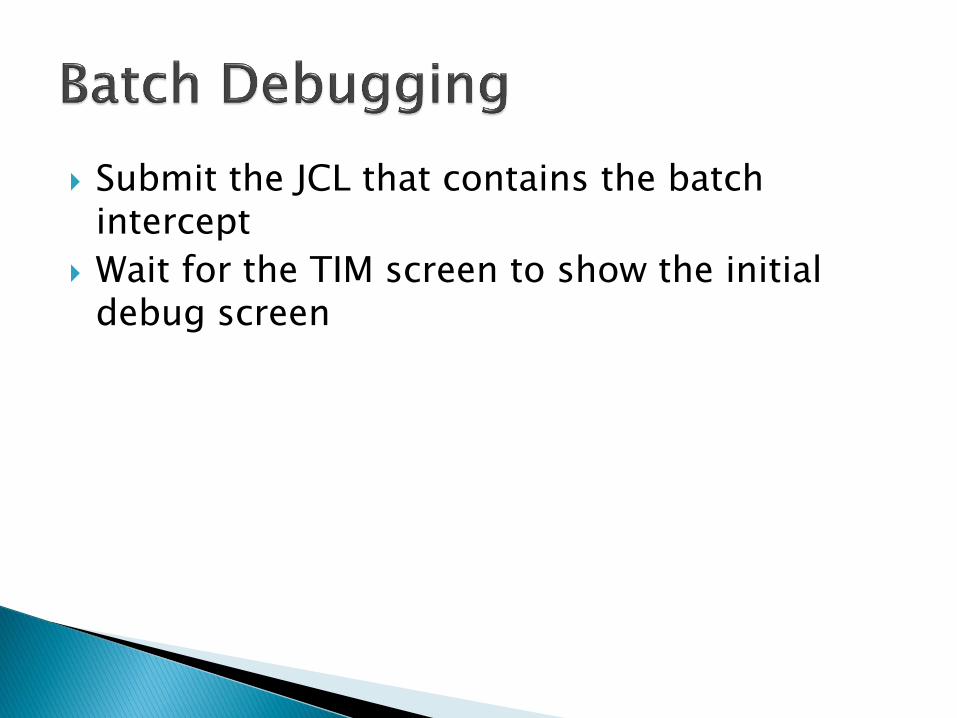
Submit the JCL that contains the batch intercept
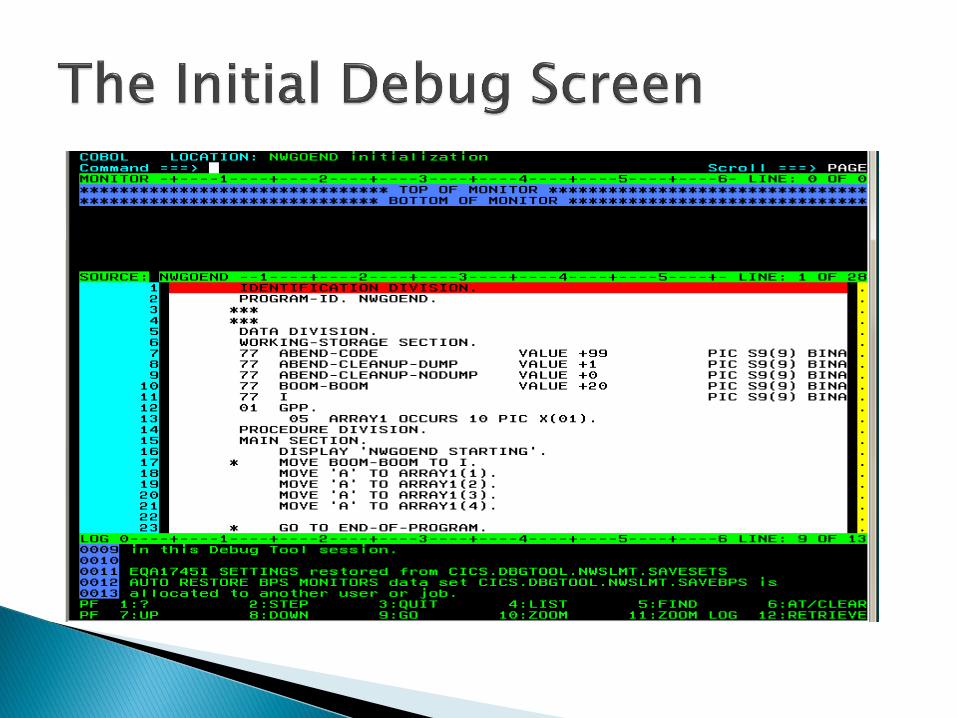
Wait for the TIM screen to show the initial debug screen
Compile your program with the debugging compile PROCS (CICOBMSL, etc).
Use the DTCN transaction to Set, Activate and Save your intercepts.
Exit DTCN.
Invoke what ever CICS process is needed to trip the intercept.
The Initial Debug Screen will appear.
CICS compile procedures are maintained in a private proclib for each programming enclave.
Each of your CICOBMPL, CICOBMSL, CIDBCMSL procedures have been converted to generate source data usable by the Debug Tool and Fault Analyzer.
No customer JCL changes should be needed. The exception would be anyone who overrides the
complete PARM value of the Cobol Compiler.
If you have your own compile procedures they will need to be adjusted. Please contact us ASAP.
One of CA INTERTEST’S unique features was its CICS internal damage prevention.
Debug Tool does not have this feature.
To gain a measure of protection back, we have implemented the ‘SSRANGE’ COBOL compile option.
That option makes COBOL verify array occurrence ranges and indirect addressing bounds as part of the generated code.
Set the Symbolic Parameter SSRANGE=NOSSRANGE to turn this off.
Logon to your CICS test region.
Invoke the DTCN transaction and hit enter.

DTCN is the transaction used to get started.
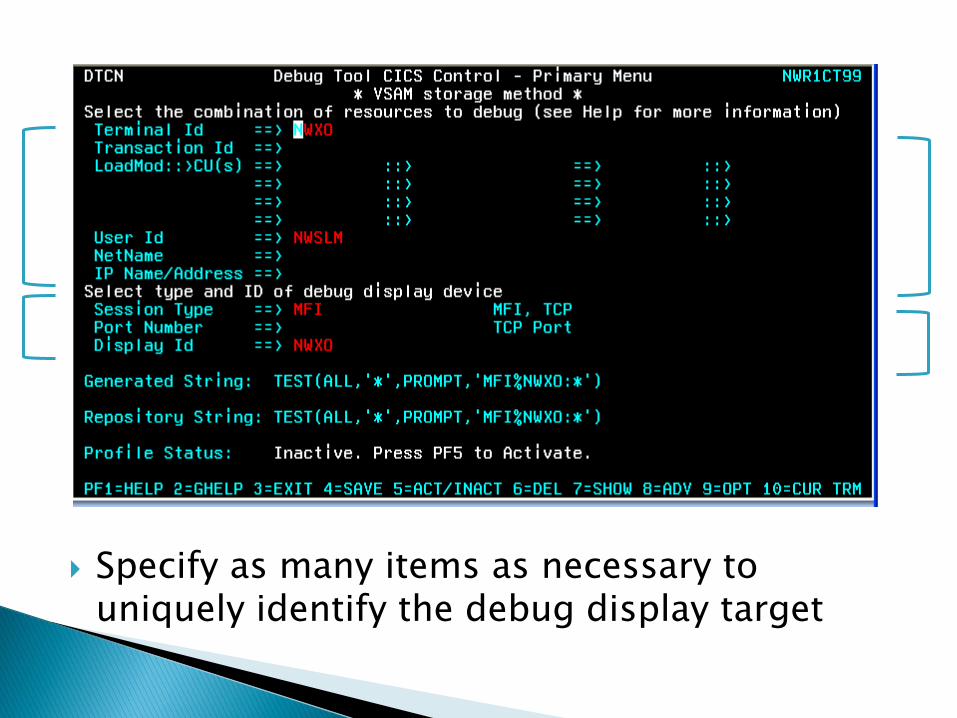
Specify as many items as necessary to uniquely identify the debug display target
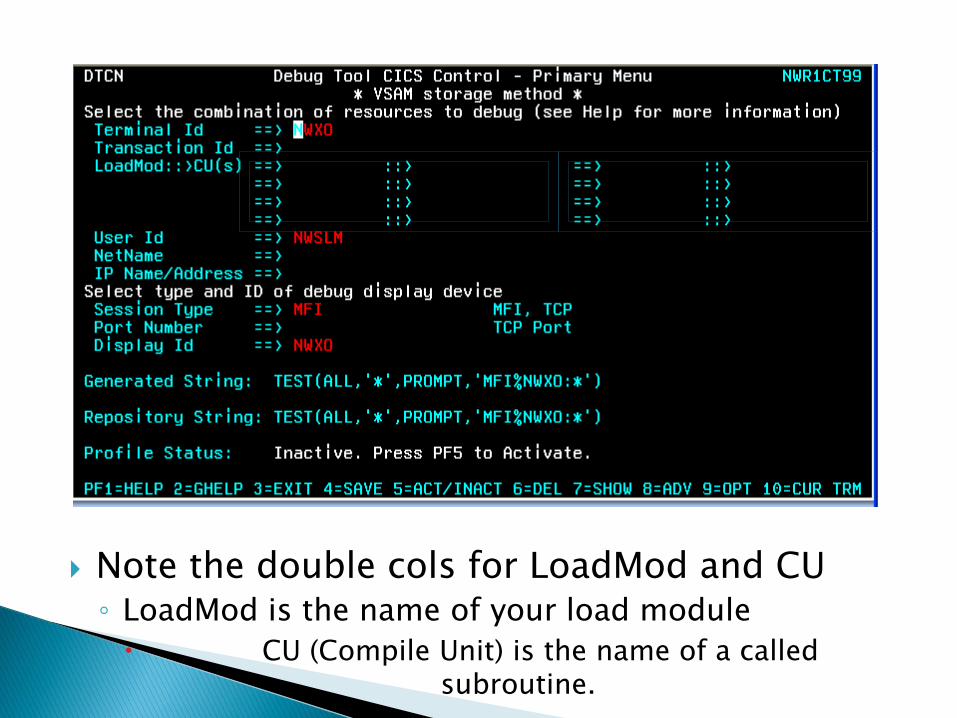
Note the double cols for LoadMod and CU ◦ LoadMod is the name of your load module
CU (Compile Unit) is the name of a called subroutine.
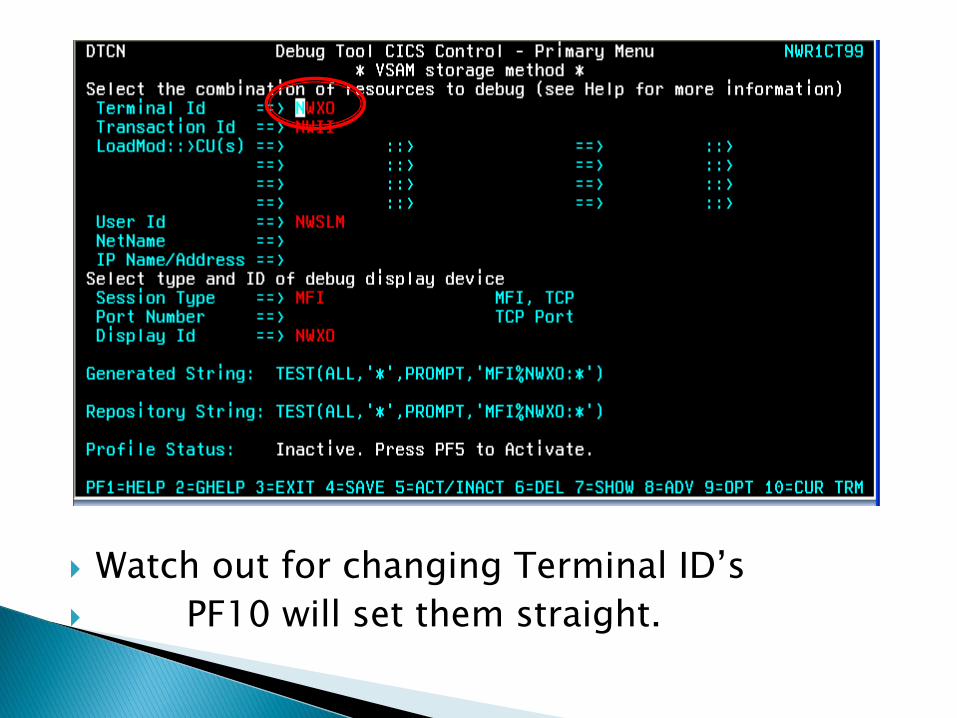
Watch out for changing Terminal ID’s
PF10 will set them straight.
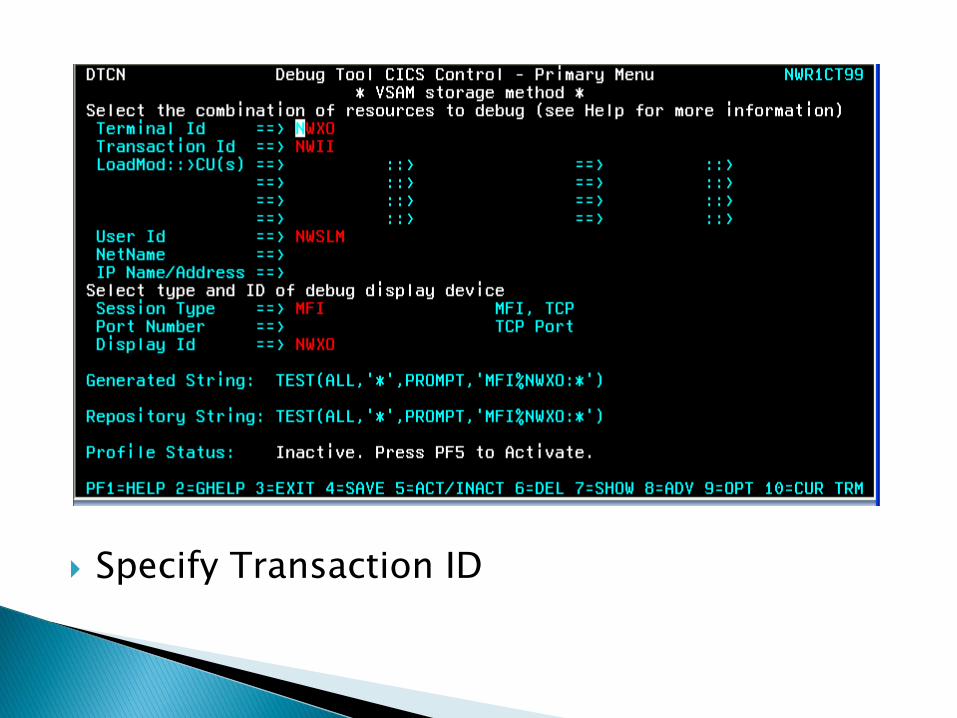
Specify Transaction ID

Or program name, be careful not to accidentally put something inappropriate in the CU column.
Note:PF8
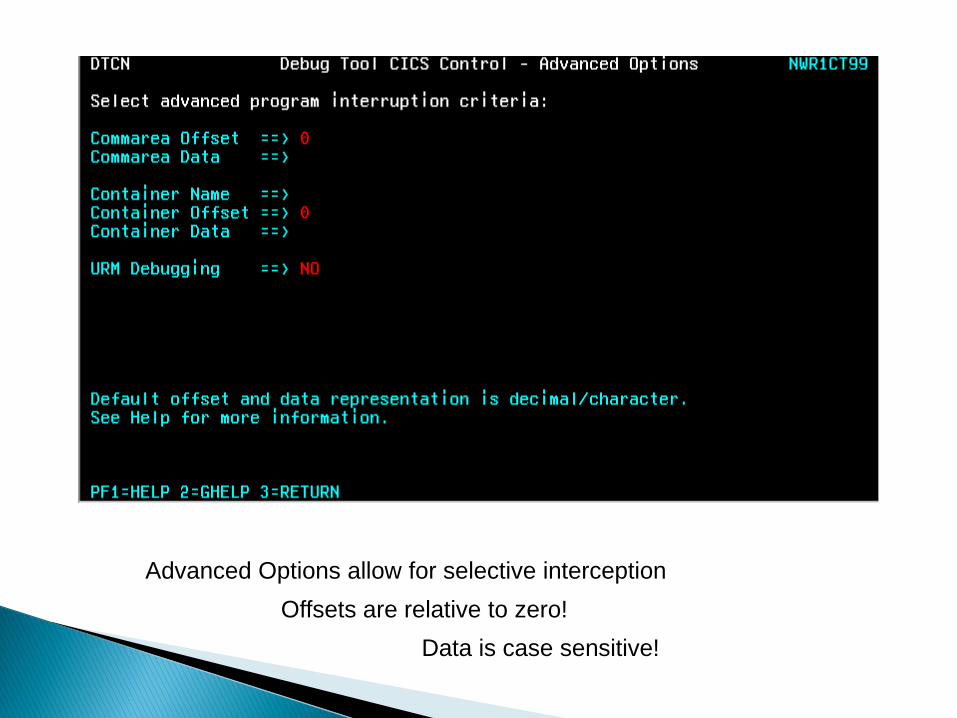
Advanced Options allow for selective interception
Offsets are relative to zero!
Data is case sensitive!

Offset and Data can be entered in Hex format
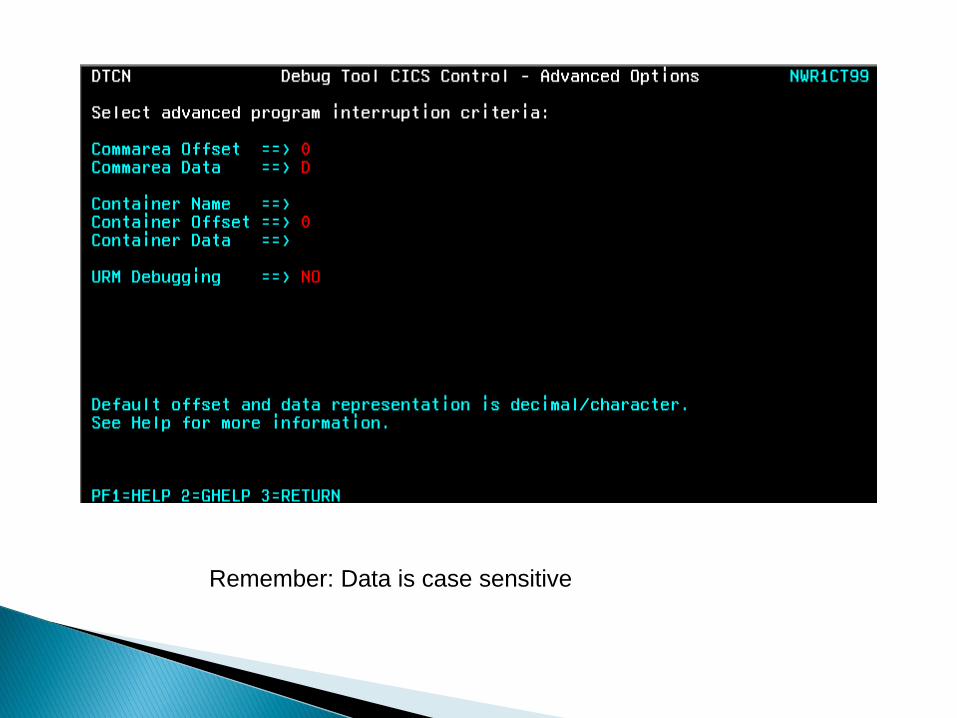
Remember: Data is case sensitive

Profile is not active, hit PF5 to activate

Then hit PF4 to save

Intercept is set, hit PF3 to exit and invoke the application


This example uses CICS, but batch debugging looks and feels exactly the same.

Do what it takes to get the indicated program going - NWII gets our test session started.

The Initial Screen. Note the Command Line and three windows..

The ? Command is used to get help.
The actual help text is shown in the log window.
Command Meaning
? list all commands
AT ? show what can be typed after AT
AT CHANGE ? show what can be typed after AT CHANGE
Commands can be abbreviated to the least number of characters that maintain uniqueness. ◦ Difficult to predict how few characters you can use.
MONITOR LIST is the same as MON LIS
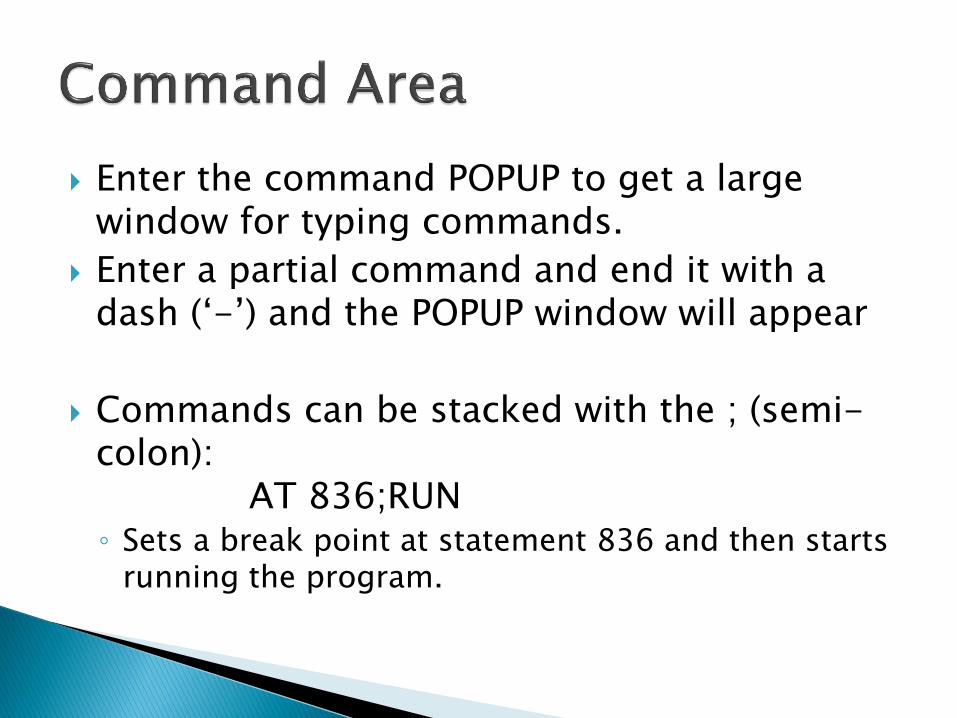
Enter the command POPUP to get a large window for typing commands.
Enter a partial command and end it with a dash (‘-’) and the POPUP window will appear
Commands can be stacked with the ; (semi-colon): AT 836;RUN ◦ Sets a break point at statement 836 and then starts
running the program.
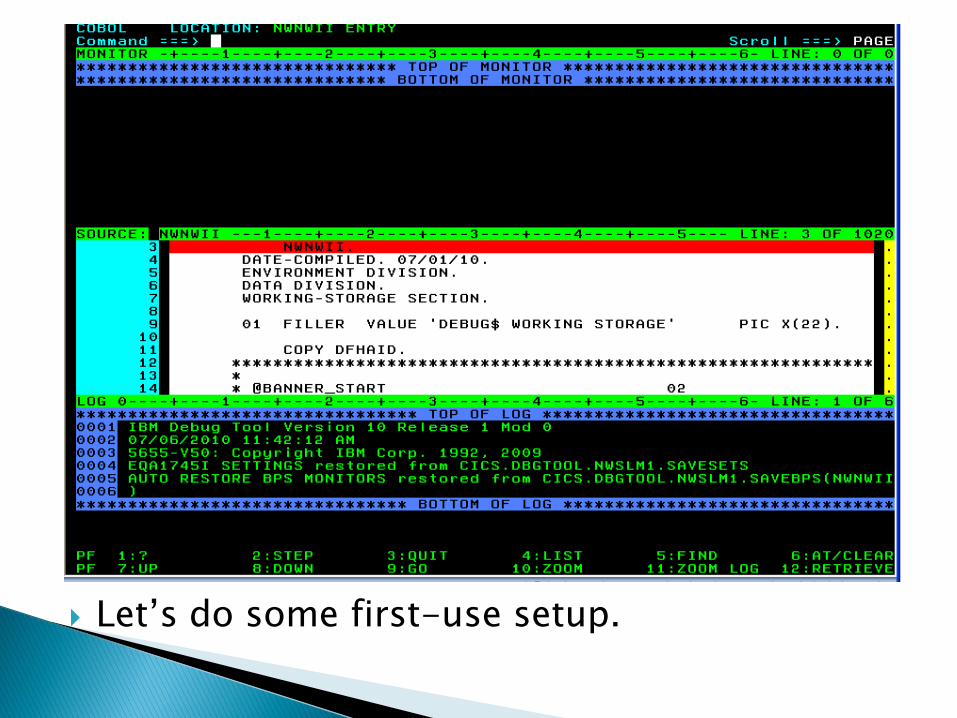
Let’s do some first-use setup.

SET AUTO ON
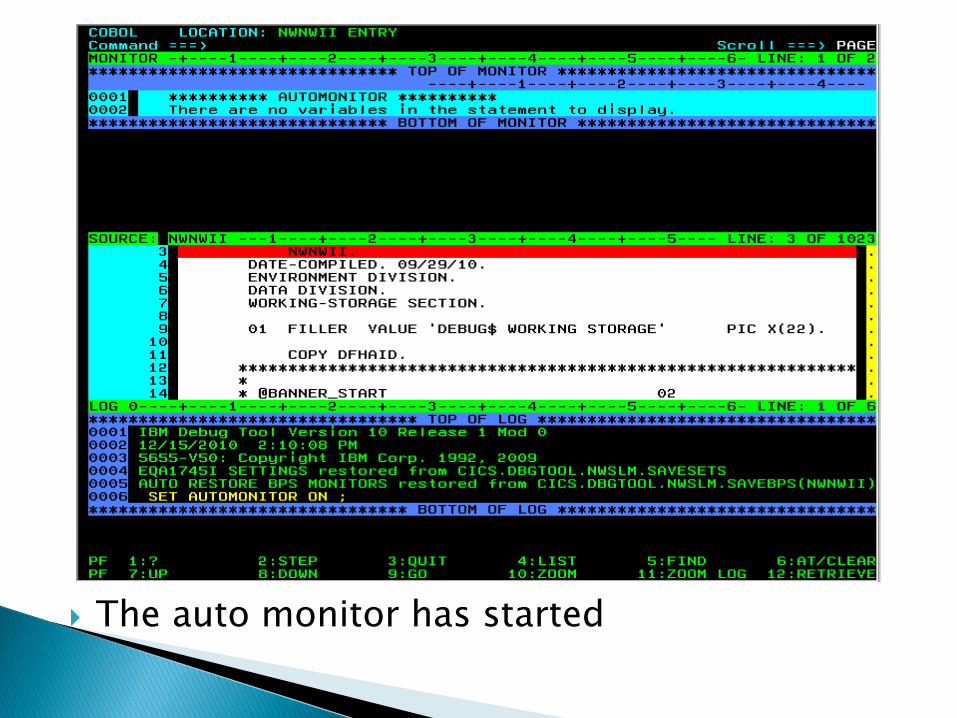
The auto monitor has started

Changing to Cursor based paging

Log window confirms changes
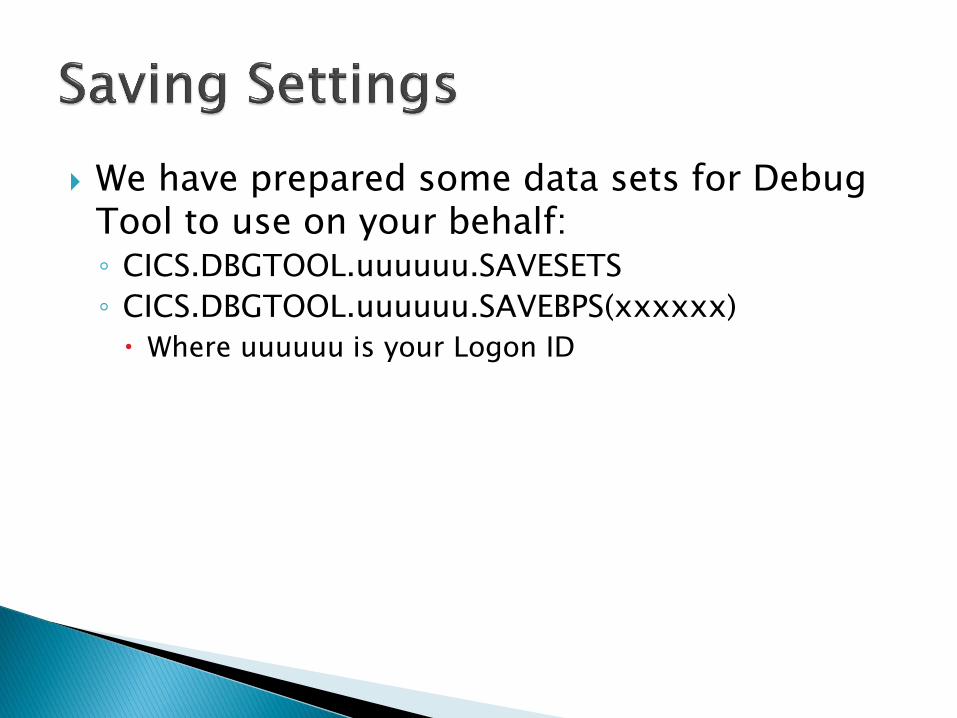
We have prepared some data sets for Debug Tool to use on your behalf: ◦ CICS.DBGTOOL.uuuuuu.SAVESETS
◦ CICS.DBGTOOL.uuuuuu.SAVEBPS(xxxxxx)
Where uuuuuu is your Logon ID
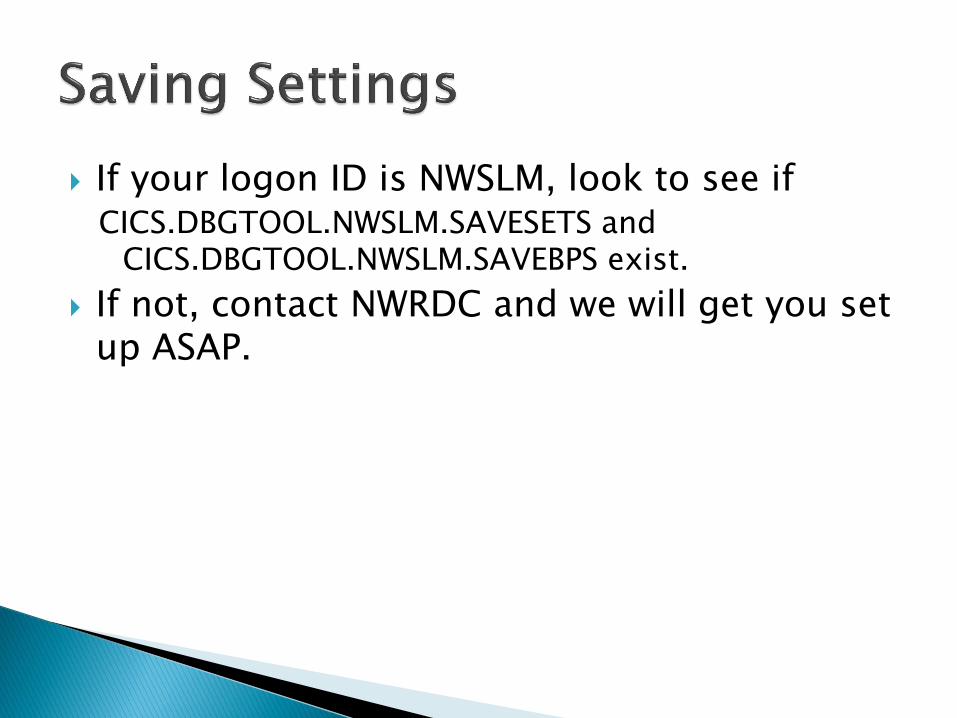
If your logon ID is NWSLM, look to see if CICS.DBGTOOL.NWSLM.SAVESETS and
CICS.DBGTOOL.NWSLM.SAVEBPS exist.
If not, contact NWRDC and we will get you set up ASAP.
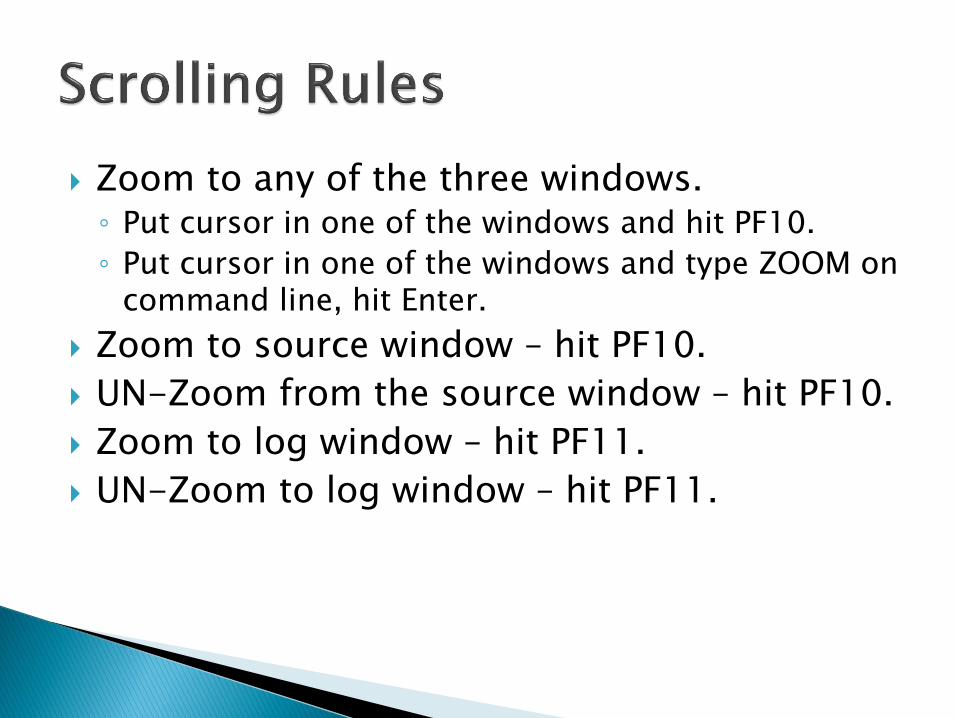
Zoom to any of the three windows. ◦ Put cursor in one of the windows and hit PF10.
◦ Put cursor in one of the windows and type ZOOM on command line, hit Enter.
Zoom to source window – hit PF10.
UN-Zoom from the source window – hit PF10.
Zoom to log window – hit PF11.
UN-Zoom to log window – hit PF11.
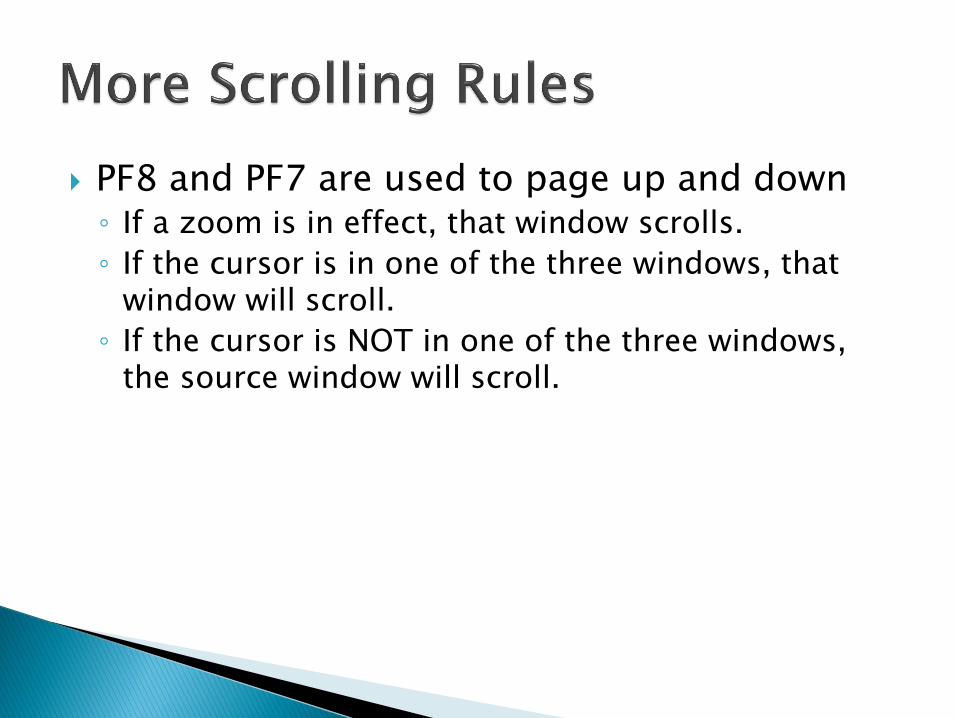
PF8 and PF7 are used to page up and down ◦ If a zoom is in effect, that window scrolls.
◦ If the cursor is in one of the three windows, that window will scroll.
◦ If the cursor is NOT in one of the three windows, the source window will scroll.
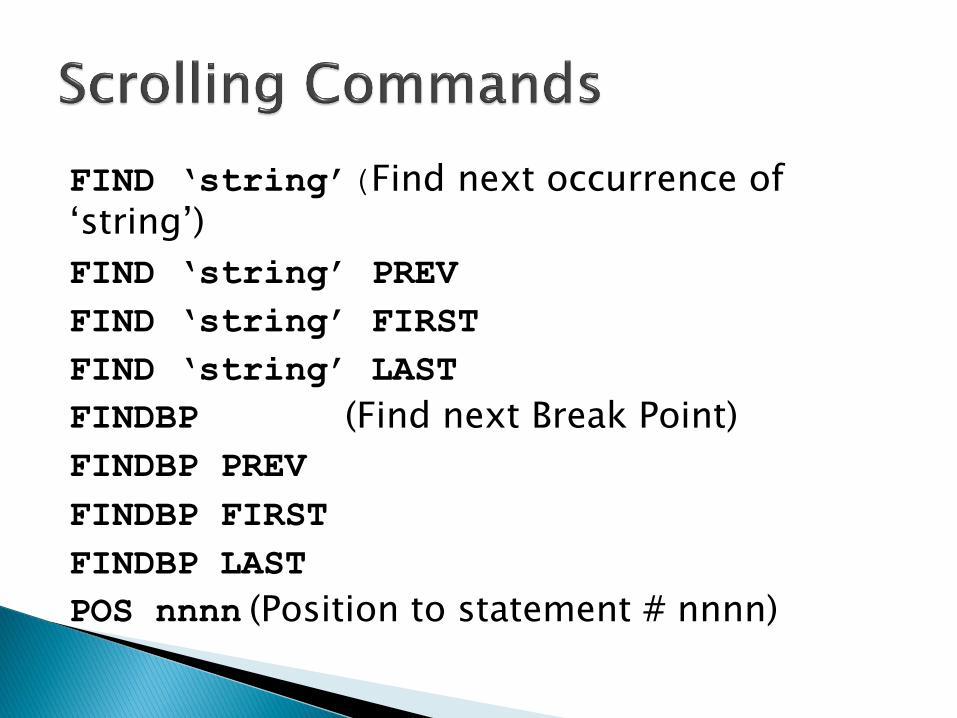
FIND ‘string’(Find next occurrence of ‘string’)
FIND ‘string’ PREV
FIND ‘string’ FIRST
FIND ‘string’ LAST
FINDBP (Find next Break Point)
FINDBP PREV
FINDBP FIRST
FINDBP LAST
POS nnnn (Position to statement # nnnn)
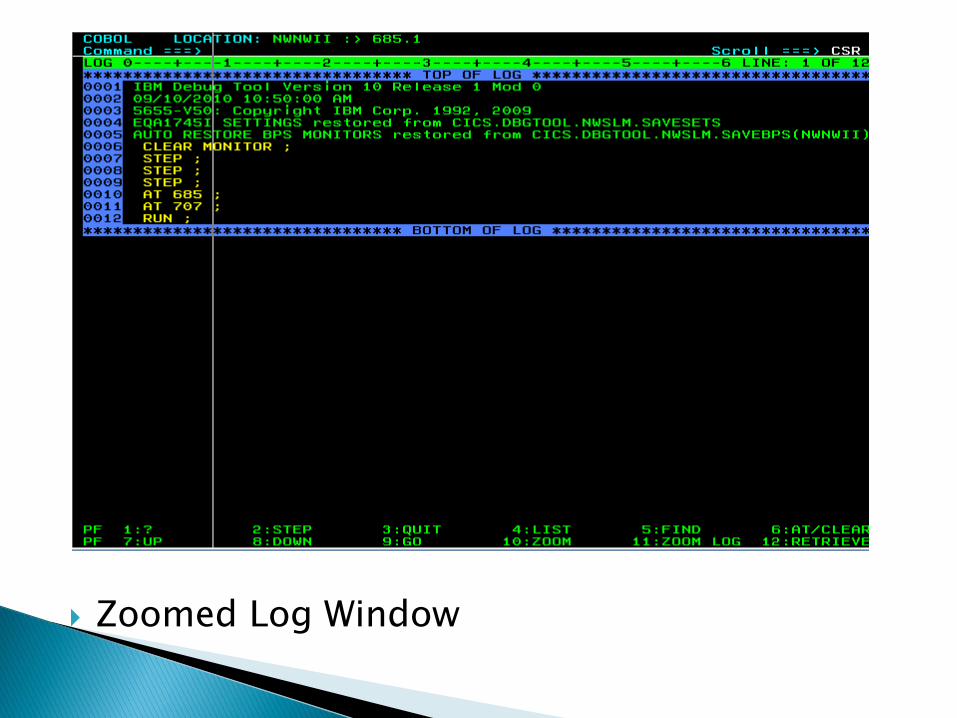
Zoomed Log Window

Zoomed Source Window

Find Command to skip across Working Storage

Procedure Division found
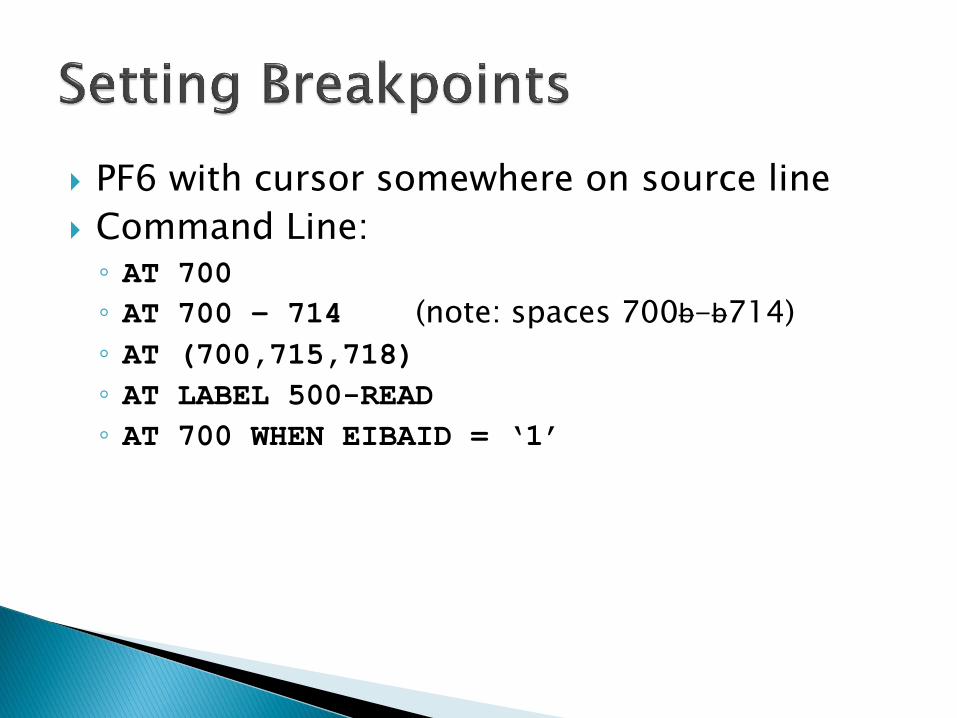
PF6 with cursor somewhere on source line
Command Line: ◦ AT 700
◦ AT 700 – 714 (note: spaces 700b-b714)
◦ AT (700,715,718)
◦ AT LABEL 500-READ
◦ AT 700 WHEN EIBAID = ‘1’
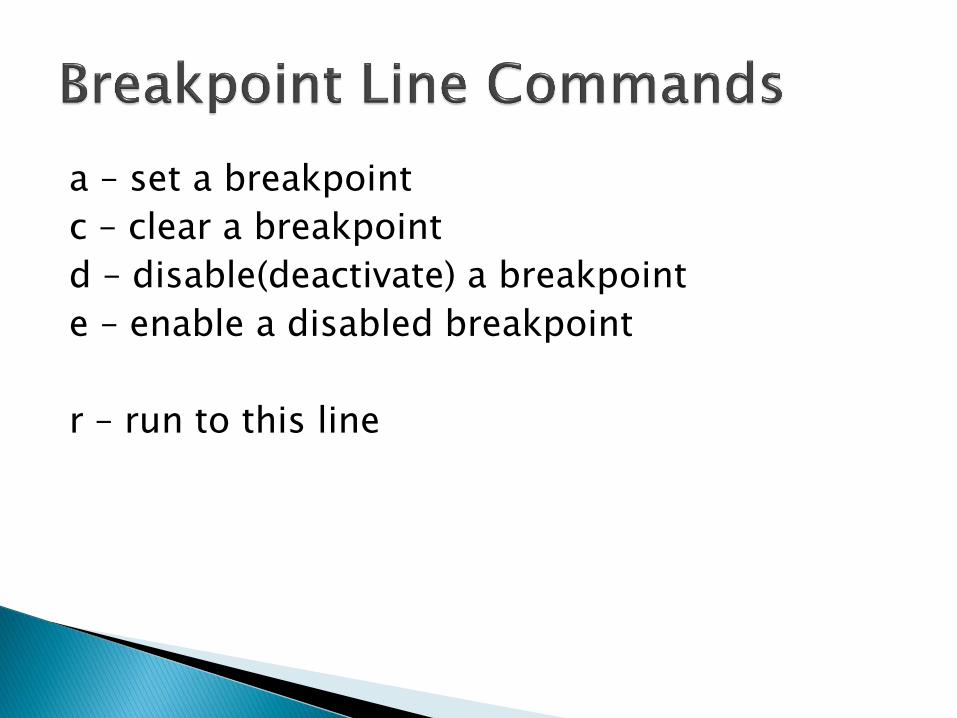
a – set a breakpoint
c – clear a breakpoint
d – disable(deactivate) a breakpoint
e – enable a disabled breakpoint
r – run to this line
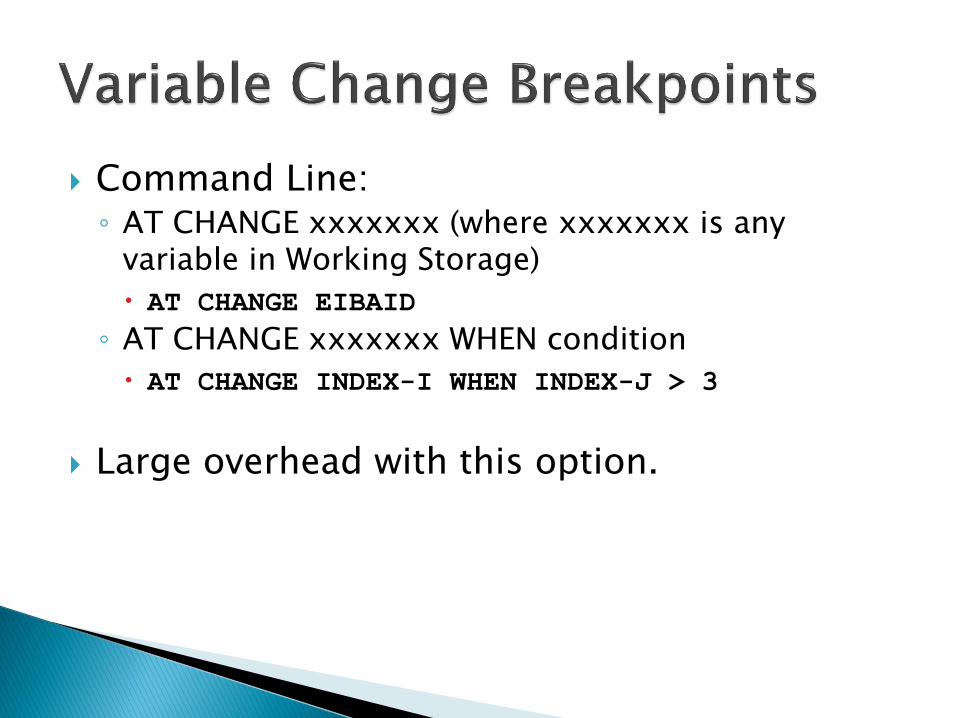
Command Line: ◦ AT CHANGE xxxxxxx (where xxxxxxx is any
variable in Working Storage)
AT CHANGE EIBAID
◦ AT CHANGE xxxxxxx WHEN condition
AT CHANGE INDEX-I WHEN INDEX-J > 3
Large overhead with this option.
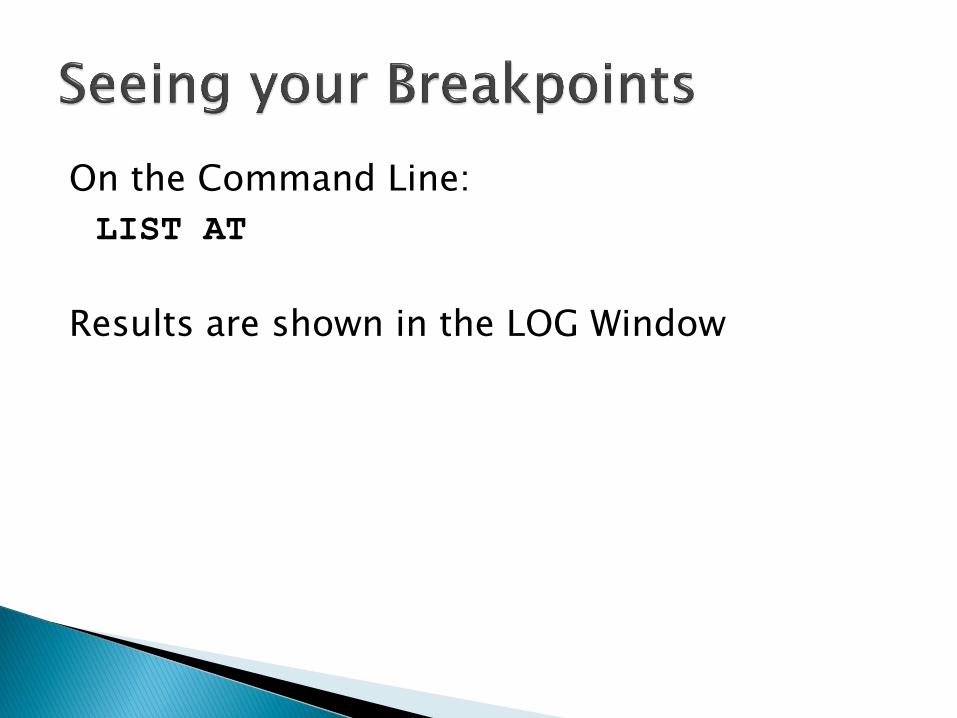
On the Command Line:
LIST AT
Results are shown in the LOG Window
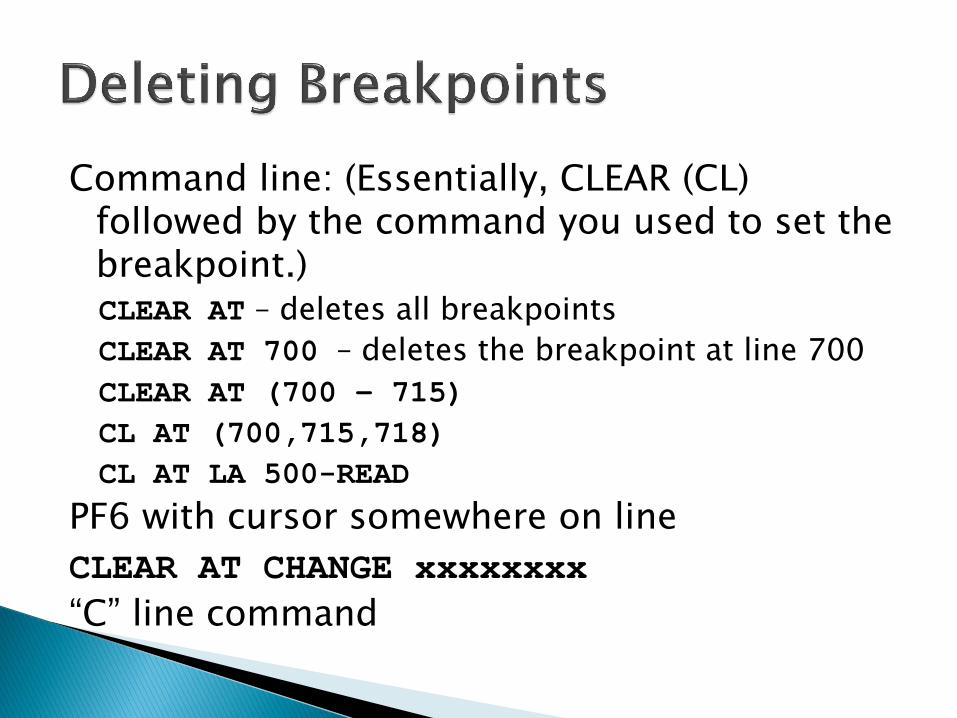
Command line: (Essentially, CLEAR (CL) followed by the command you used to set the breakpoint.) CLEAR AT – deletes all breakpoints
CLEAR AT 700 – deletes the breakpoint at line 700
CLEAR AT (700 – 715)
CL AT (700,715,718)
CL AT LA 500-READ
PF6 with cursor somewhere on line
CLEAR AT CHANGE xxxxxxxx
“C” line command
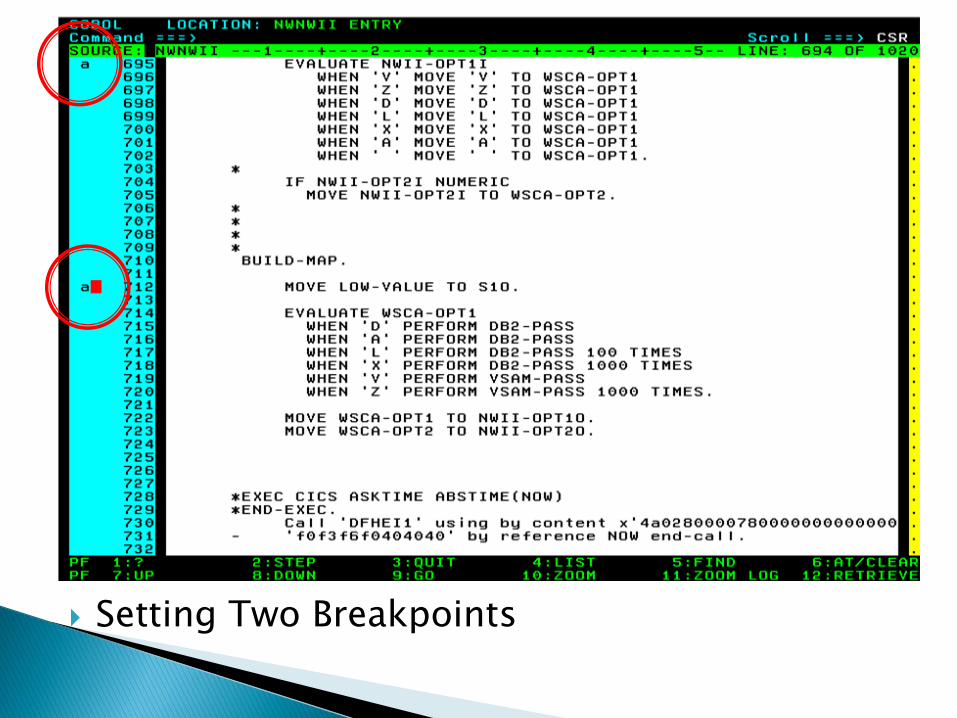
Setting Two Breakpoints

Two Breakpoints Are Set
STEP on the Command Line or PF2 ◦ Executes one statement at a time.
STEP 10 ◦ Executes the next 10 statements.
RUN (or Go) on the Command Line or PF9 ◦ Executes until the next break point, error or
end-of-task.
RUNTO nnnn (or “r” line command) ◦ Run until line nnnn is encountered.

If you have scrolled away from the break point screen (for any reason) and you want to return to that screen:
Command Meaning
QUALIFY RESET (QUA RES)
Return to the most recent break point screen

Command Line: ◦ SET AUTOMONITOR ON
Will document the variables in the current source line.
◦ SET AUT ON BOTH
Will document the variables in the previous and current source lines.
To add items to the Monitor Window:
Command Line: ◦ MONITOR LIST xxxxxxx (where xxxxxxx is a
variable in working storage.
◦ MON LIST and put cursor on the variable in either working storage or procedure division.
M line command will add all variables in that Procedure Division source line.
Mn line command will add the nth (1st, 2nd …) variable in that source line.
To add even more items
Command Line: ◦ MONITOR LIST TITLE WS
Will show all of WORKING STORAGE in the Monitor Window.
◦ MONITOR LIST TITLE FS
Will show all of FILE SECTION Storage in the Monitor Window.
◦ MONITOR LIST TITLE LS
Will show all of LINKAGE SECTION Storage in the Monitor Window.
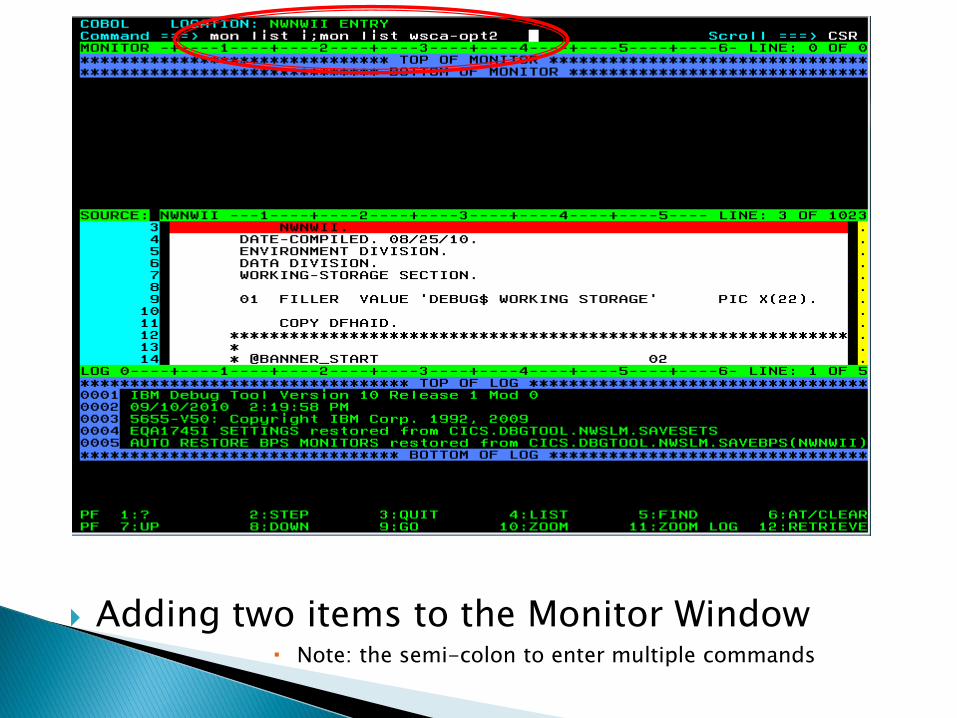
Adding two items to the Monitor Window Note: the semi-colon to enter multiple commands
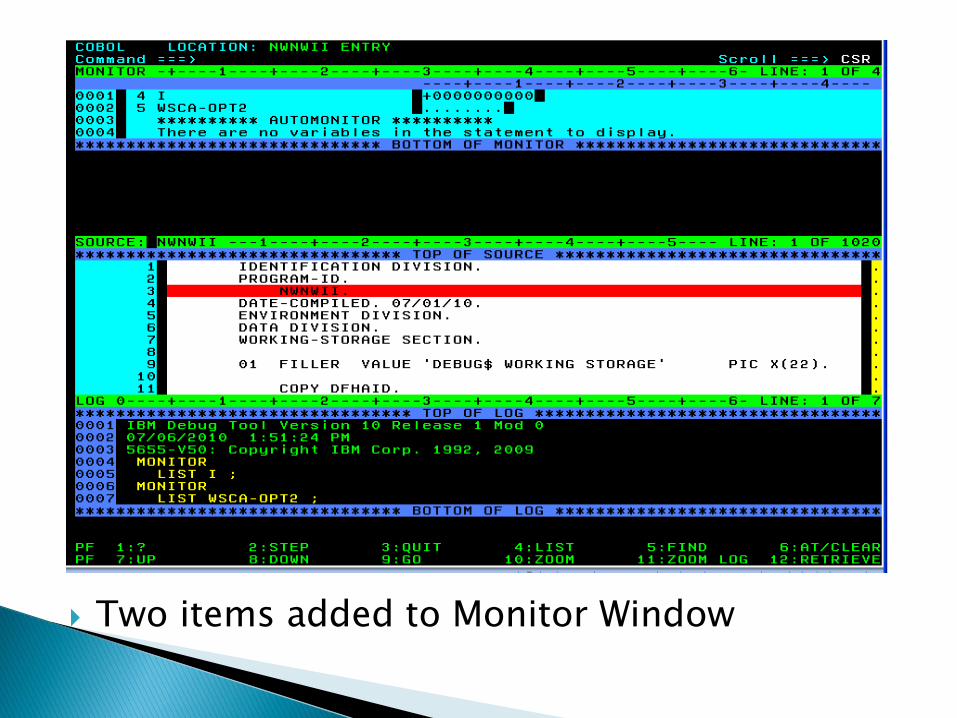
Two items added to Monitor Window

Line Commands ◦ “h” – show the hexadecimal representation.
◦ “d” – show the default representation, used after the “h” line command.
◦ “c” – remove item from Monitor Window.
Command Line: ◦ CLEAR MONITOR will clear ALL items from the
Monitor Window (CLE MO)
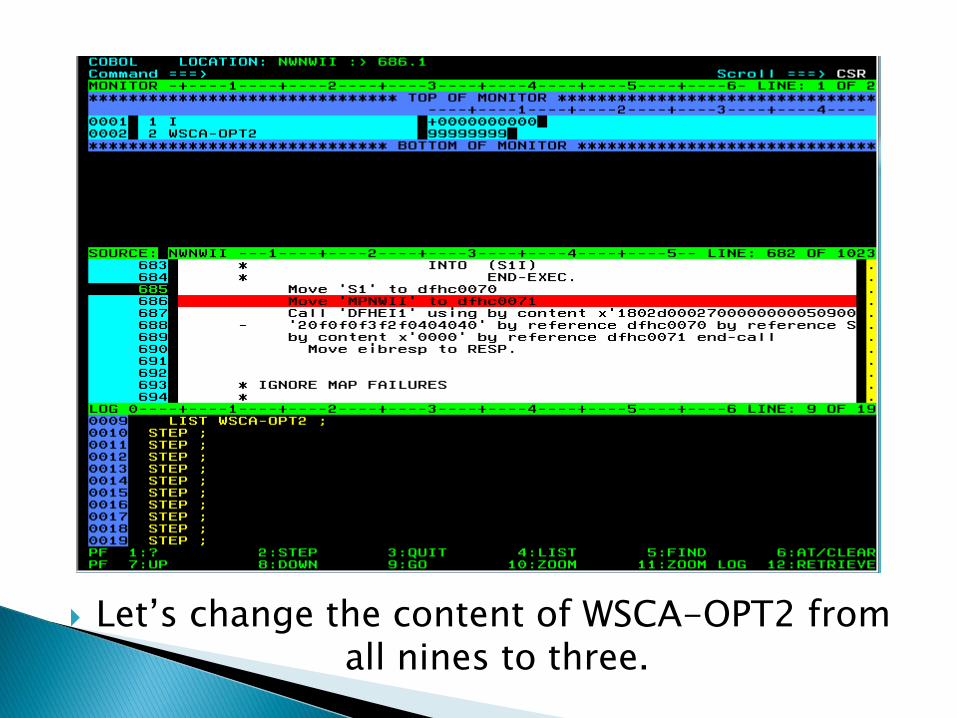
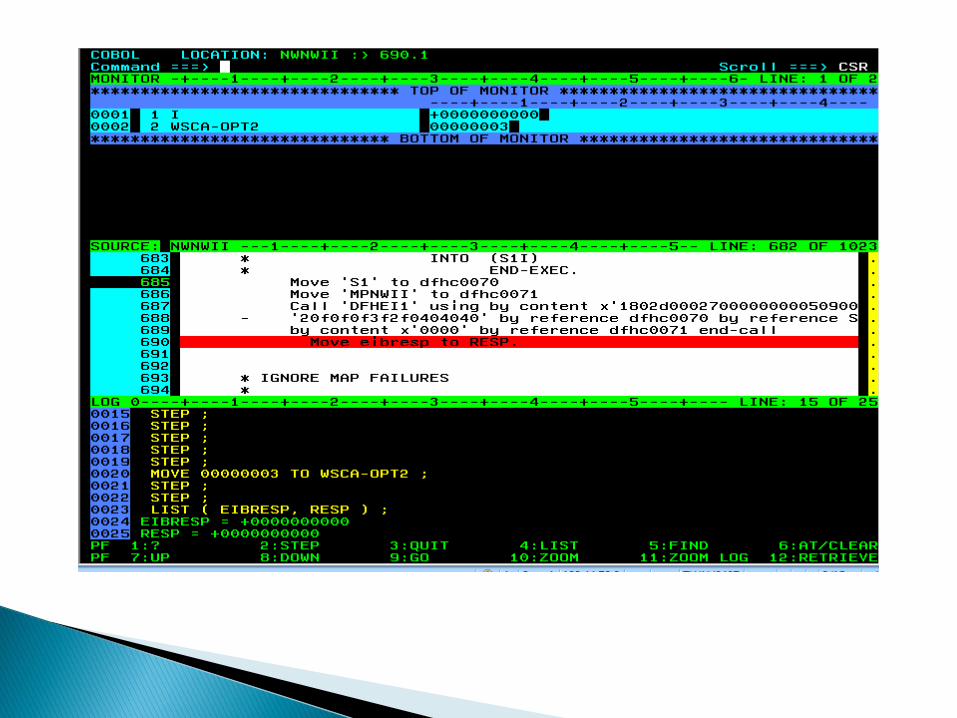
Let’s change the content of WSCA-OPT2 from all nines to three.
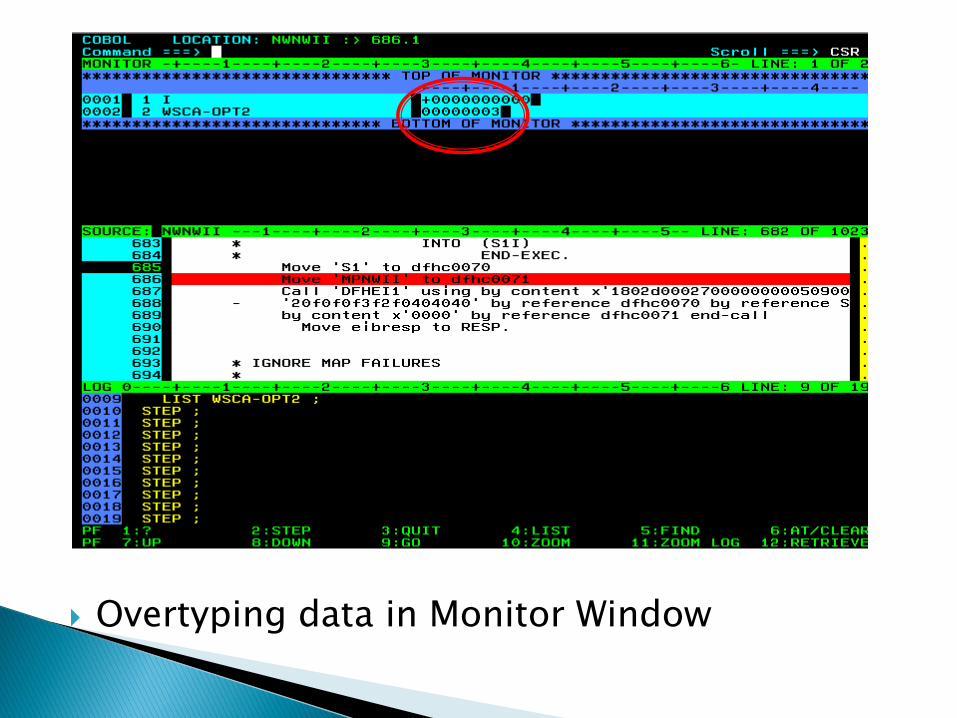
Overtyping data in Monitor Window
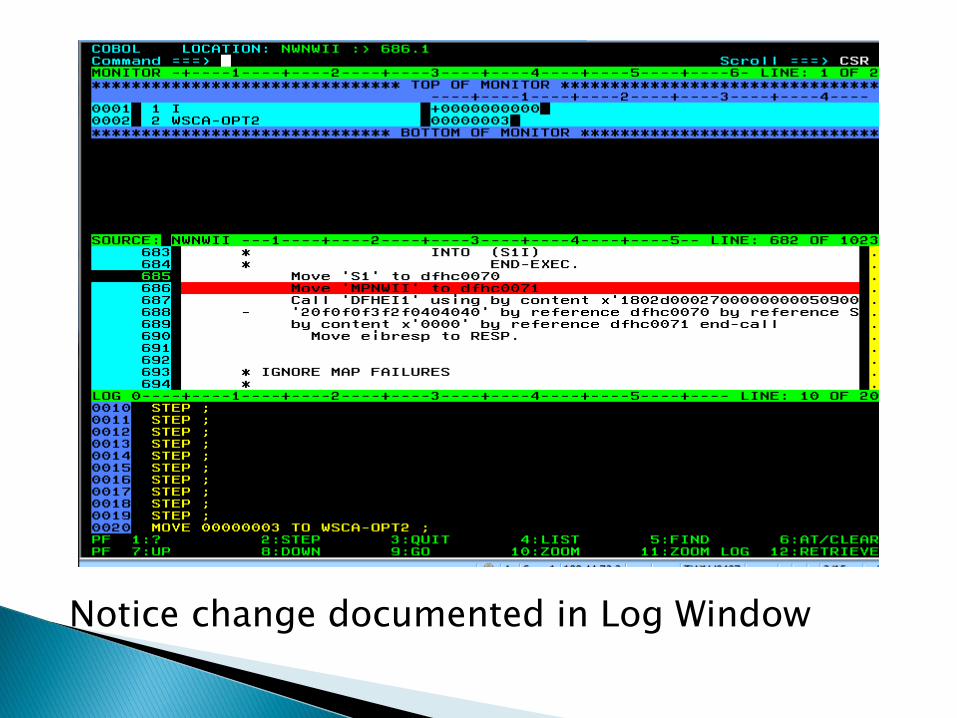
Notice change documented in Log Window

On the Command Line you can type Move commands:
MOVE +1 TO NUM-ITEM
MOVE ‘ABC’ TO TEXT-ITEM
COMPUTE NUM-ITEM = NUM-ITEM2 + 22

As an alternative to the Monitor Window, you can “LIST” data values to the LOG Window.
These log entries are “static” as they show the value of the item at the time of the list command.
Remember the LOG Window can be scrolled and zoomed.

The ‘L’ line command will document the current values of all variables in that Procedure Division line statement.
The ‘Ln’ line command will document the 1st, 2nd … variable in that statement.
LIST xxxxxx in the command area will document the current value of the xxxxxx variable in the Log Window.
PF4 with the cursor on a variable name will do the same thing.
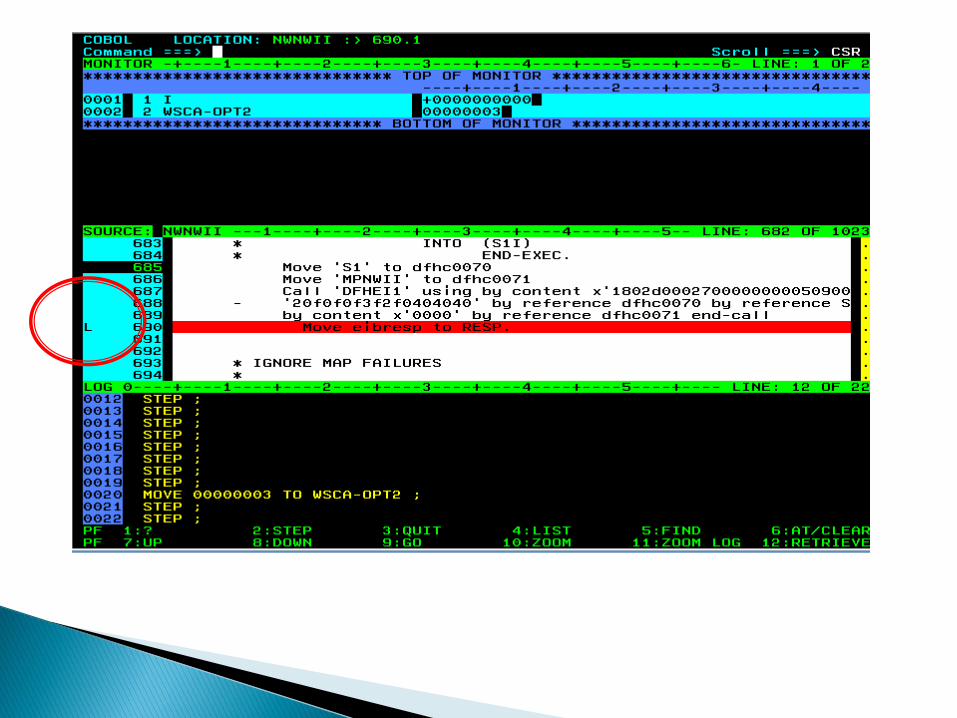

NWNWII causes an intentional data exception when the “choice” is set to “A”.


At the initial screen, we hit PF9 so the program will run

The ABEND has been detected at statement 843
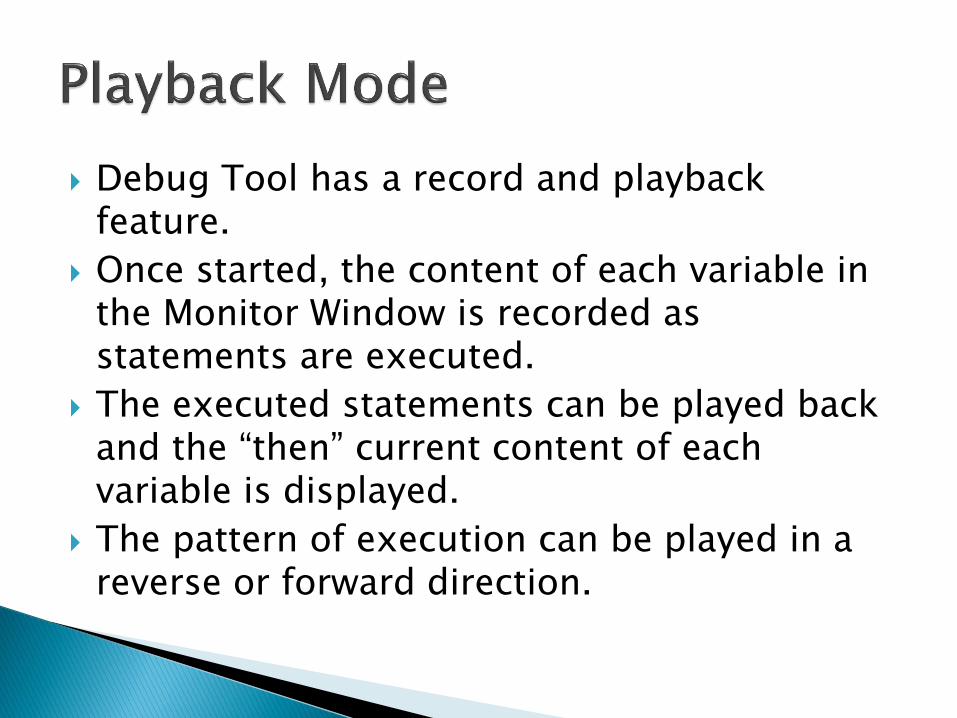
Debug Tool has a record and playback feature.
Once started, the content of each variable in the Monitor Window is recorded as statements are executed.
The executed statements can be played back and the “then” current content of each variable is displayed.
The pattern of execution can be played in a reverse or forward direction.
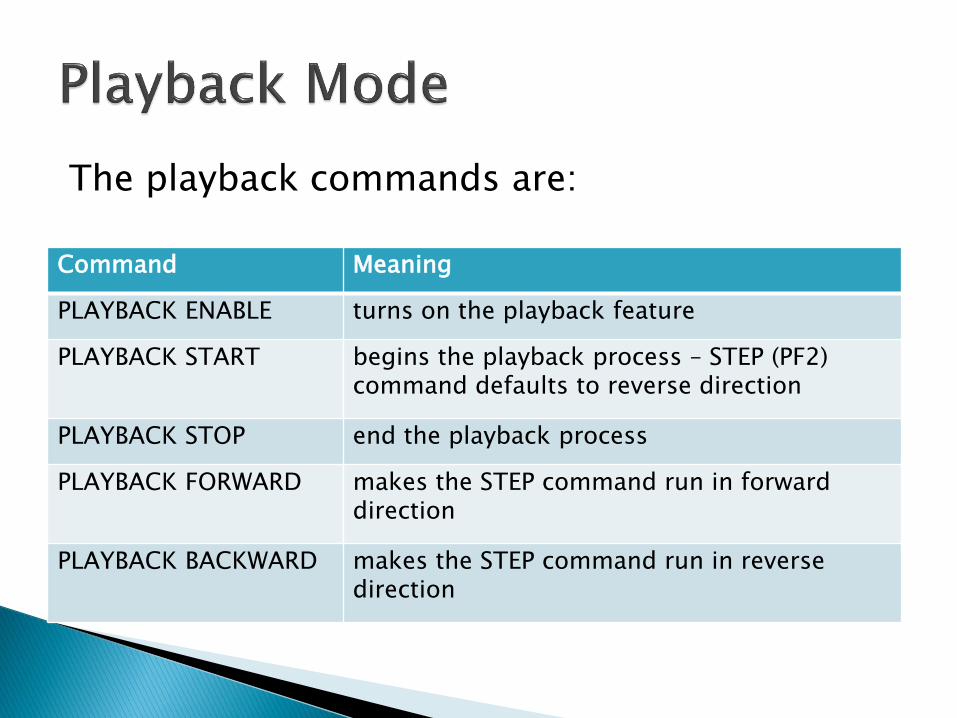
The playback commands are:
Command Meaning
PLAYBACK ENABLE turns on the playback feature
PLAYBACK START begins the playback process – STEP (PF2) command defaults to reverse direction
PLAYBACK STOP end the playback process
PLAYBACK FORWARD makes the STEP command run in forward direction
PLAYBACK BACKWARD makes the STEP command run in reverse direction

Normally the header of a Debug Tool breakpoint screen looks something like: ◦ COBOL LOCATION: NWNWII :> 852.1
With Playback active and in reverse direction it will change to: ◦ COBOL PBK<LOC: NWNWII :> 852.1
With Playback active and in forward direction it will change to: ◦ COBOL PBK>LOC: NWNWII :> 852.1
The command SET FREQUENCY will make the debug tool count how many times each instruction has been executed.
The counting starts as soon as the SET FRE command is issued.
The numbers are shown down the right hand side of the source window.
The command SET FREQUENCY OFF terminates the feature.
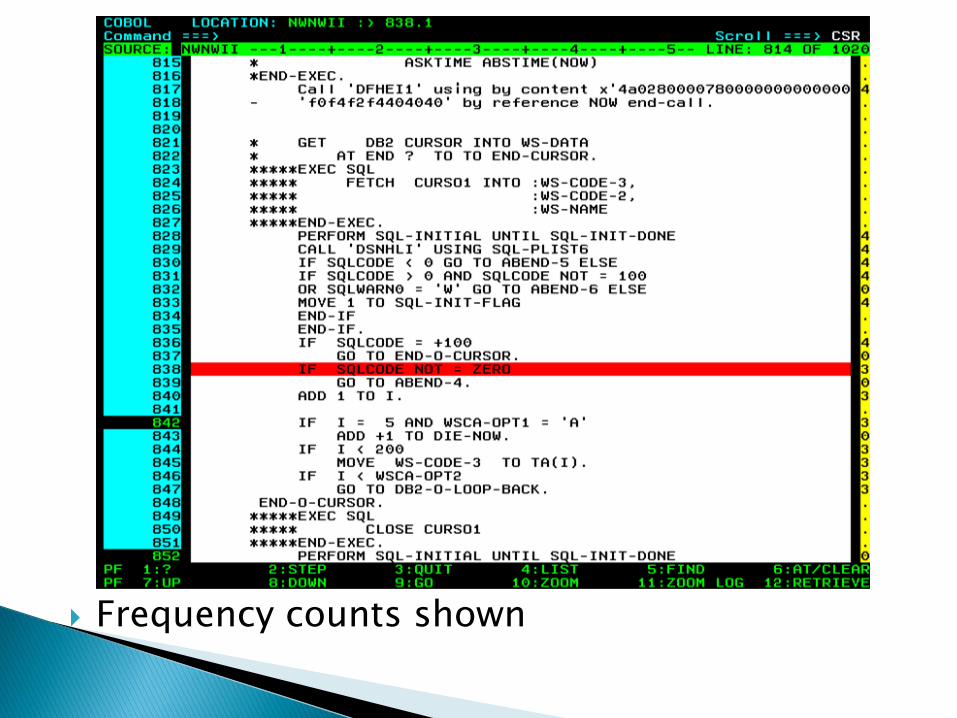
Frequency counts shown

PF3 (or the command QUIT) will start the termination process. You will be asked if you are sure you want to end the session.
The command QQUIT will terminate the session immediately.
QUIT ABEND will terminate the program with an ABEND ◦ All of the above commands will also terminate your
application.
QUIT DEBUG will terminate the debugging function but let the program continue to run.
Compile your program with the debugging compile PROCS.
Use the DTCN transaction to Set, Activate and Save your intercepts.
Exit DTCN.
Invoke what ever CICS process needed to trip the intercept.
The Initial Debug Screen will appear.
Set Break Points etc.
Enter Run Command. ◦ Application will run to the first encountered Break
Point, Abend Condition or end of the program.

At a Break Point you can: ◦ View the content of COBOL variables.
◦ Alter the content of COBOL variables.
◦ Add to or delete variables from the monitor window.
◦ Add or change Break Points.
◦ Snapshot current variable content to the Log Window.
Eventually, you will enter another RUN command.
The program will end at some point and your application will display its screen.
You will type some more data and Hit Enter.
The Initial Debug Screen will re-appear. ◦ This will happen EVERY time.
You may change Break Points and Monitor settings.
Enter Run Command ◦ Application will again run to the first encountered
Break Point, Abend Condition or end of the program.
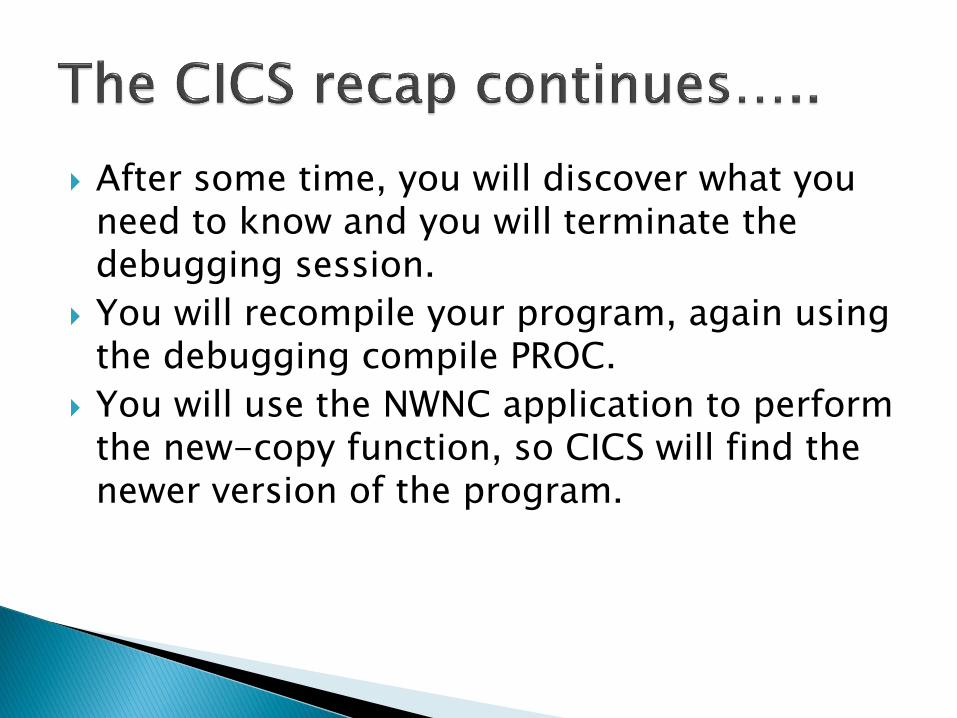
After some time, you will discover what you need to know and you will terminate the debugging session.
You will recompile your program, again using the debugging compile PROC.
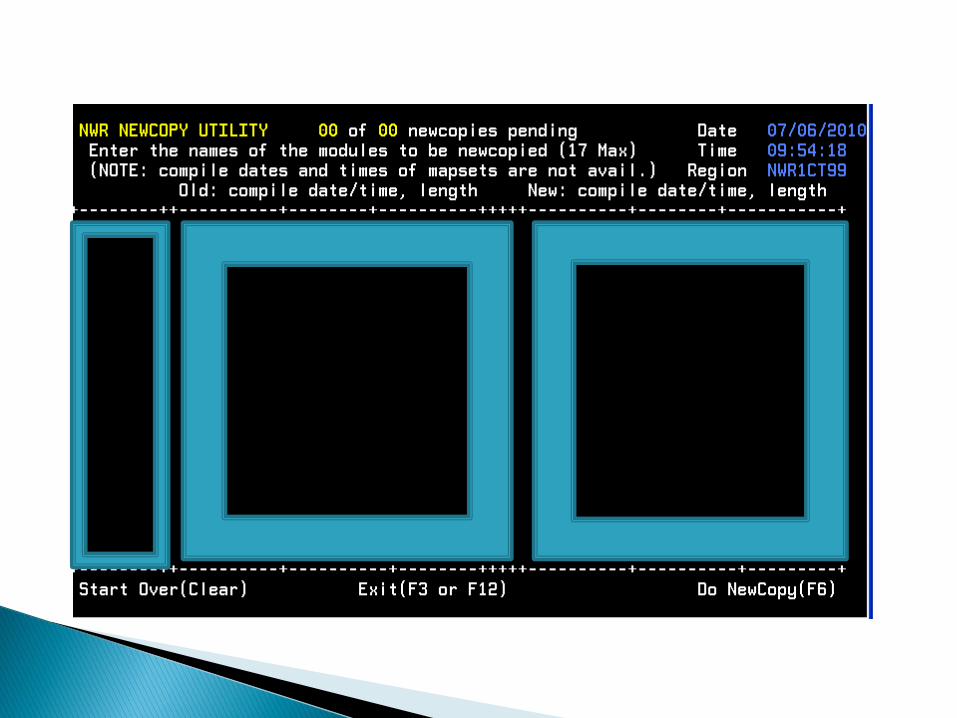
You will use the NWNC application to perform the new-copy function, so CICS will find the newer version of the program.
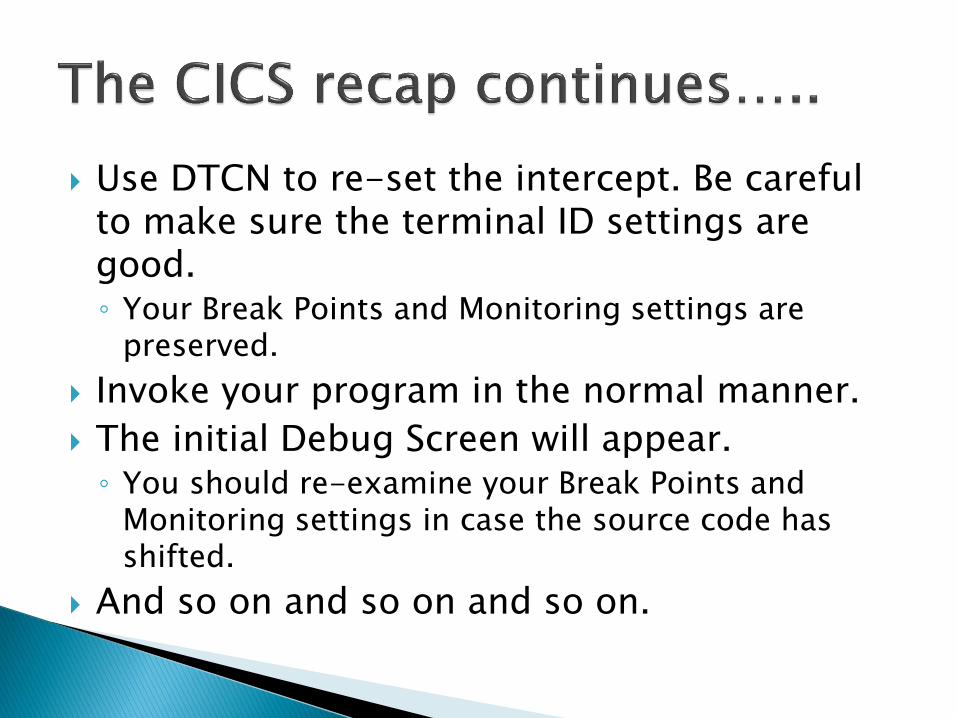
Use DTCN to re-set the intercept. Be careful to make sure the terminal ID settings are good. ◦ Your Break Points and Monitoring settings are
preserved.
Invoke your program in the normal manner.
The initial Debug Screen will appear. ◦ You should re-examine your Break Points and
Monitoring settings in case the source code has shifted.
And so on and so on and so on.
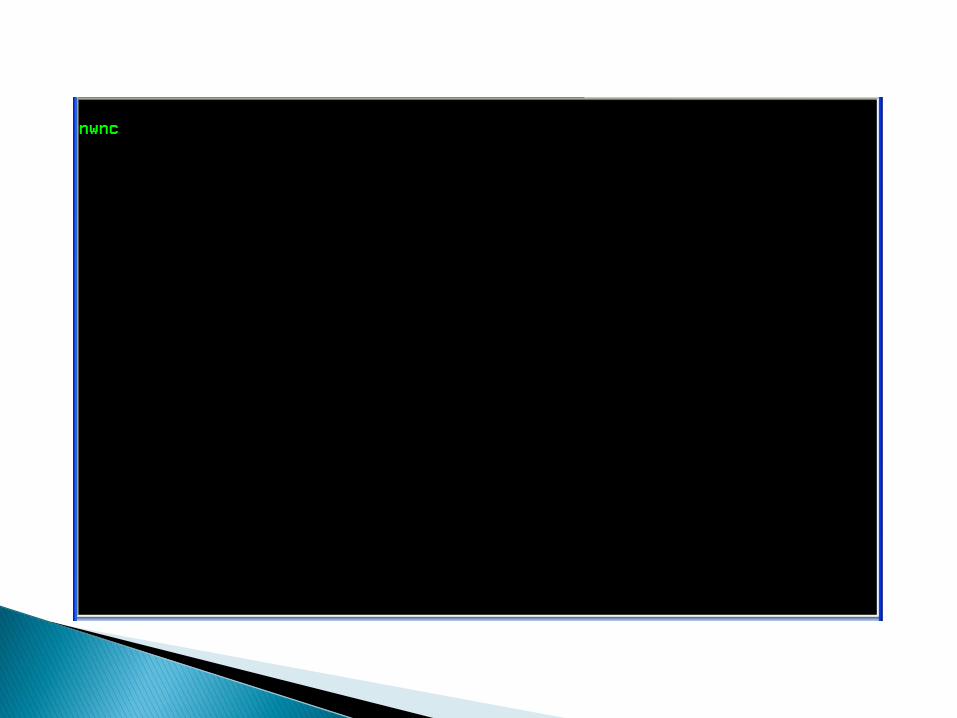
Since we no longer have CA INTERTEST, we will have to depend on our own home grown NWNC application.
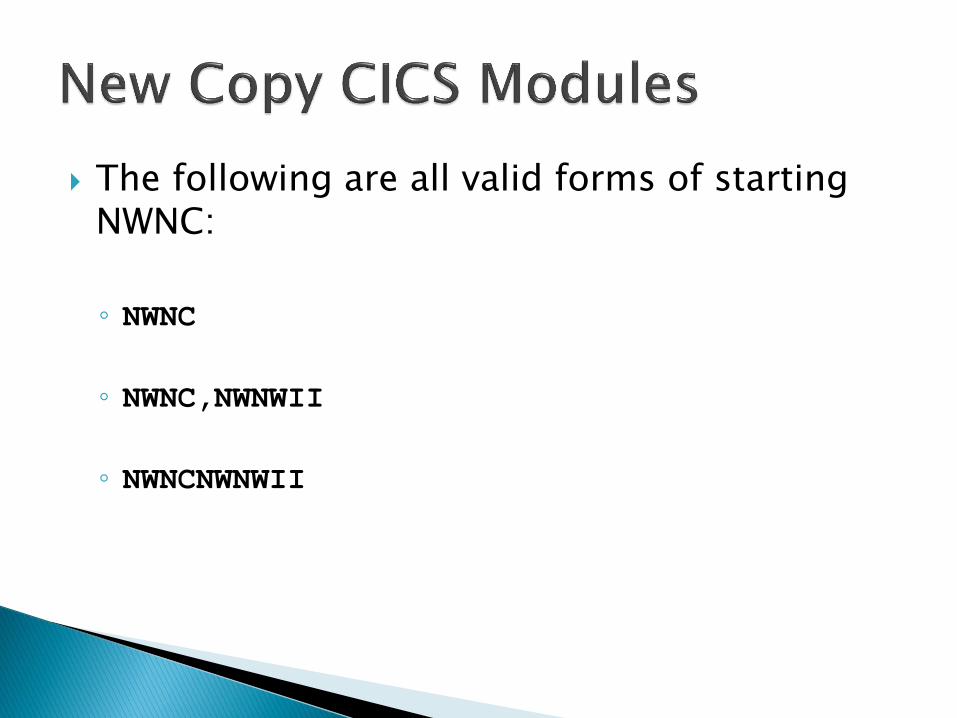
The following are all valid forms of starting NWNC:
◦ NWNC
◦ NWNC,NWNWII
◦ NWNCNWNWII


FUNCTION DEBUG TOOL COMMAND
Compilation of user programs For CICS – no change For Batch add to the COBOL PARM value and identify SIF
Start a debugging task DTCN transaction or change batch job JCL
Set a breakpoint A line command AT xxxxx COMMAND
Clear a breakpoint C line command CLEAR AT xxxx (clears only the breakpoint on line xxxx) CLEAR AT (clear all breakpoints)
Run one statement and stop PF2
run to next breakpoint PF9 or Command: RUN or GO
Set a variable change breakpoint Command Line: AT CHANGE xxxxxxx, where xxxxxxx is a variable name. Or from working storage, type AT CHANGE on command line, put the cursor on a working storage item and hit enter.
Jump to PROCEDURE DIVISION Command Line: F ‘PROCEDURE DIVISION’ FIRST
Jump to WORKING-STORAGE Command Line: F ‘WORKING-STORAGE’ FIRST
See the current variables as the program runs Command Line: SET AUTOMON or SET AUTOMON BOTH
Add variables to top part of screen Command Line: MON LIST xxxxxx or MON LIST on command line, put the cursor on a working storage item and hit enter Line Command M will add all variable in that procedure division source line. Line Command M1 will at the first variable in that procedure division source line.
Clear variables from top part of screen CLEAR MONITOR (CL MON) C line command
New copy a program or mapset NWNC transaction Type names and hit PF6

FUNCTION DEBUG TOOL
Extend Command Area Command line: POPUP (PO)
Return to breakpoint Command line: QUALIFY RESET (QUA RES)
Start the playback recording feature PLAYBACK ENABLE (PLA ENA)
Pause the execution and begin viewing the Playback data
PLAYBACK START (PLA STA)
End the viewing of Playback data PLAYBACK STOP (PLA STO)
Make the Playback STEP go forward PLAYBACK FORWARD (PLA FOR)
Make the Playback STEP go backward
PLAYBACK BACKWARD (PLA BAC)
Turn on Frequency counting SET FREQUENCY (SET FRE)
End the debugging process QUIT (QUI)
End the debugging process immediately QQUIT (QQU)
End the debugging process with an ABEND QUIT ABEND (QUI ABE)
End the debugging process but let the program continue
QUIT DEBUG (QUI DEB)
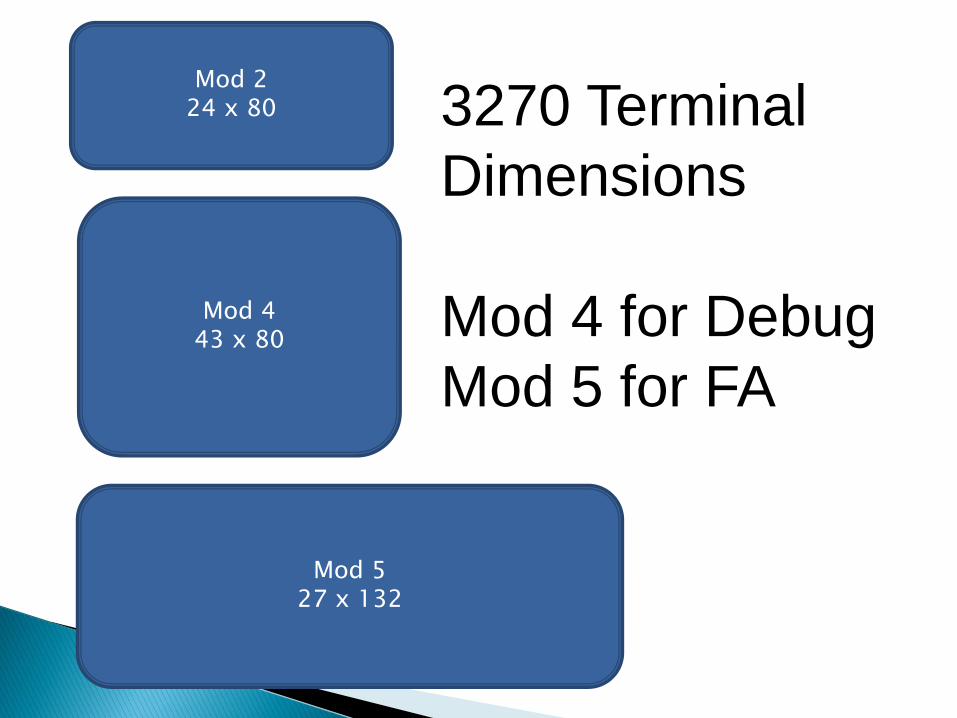
Mod 2 24 x 80
Mod 4 43 x 80
Mod 5 27 x 132
3270 Terminal
Dimensions
Mod 4 for Debug
Mod 5 for FA

The Debug Tool’s GUI presentation can live in several work station environments. Most notably:
◦ RDZ (Rational Developer for z)
◦ CICS Explorer
◦ The subject of this presentation is using the Debug Tool inside the CICS Explorer.

The CICS Explorer is an “Eclipse” based application that externalizes many of the traditional 3270 CICS management processes performed by CICS Systems Programmers.
It is a free application available for download from IBM.
The IBM Debug Tool is installed as a “perspective” to CICS Explorer.
Eclipse supports any number of perspectives.
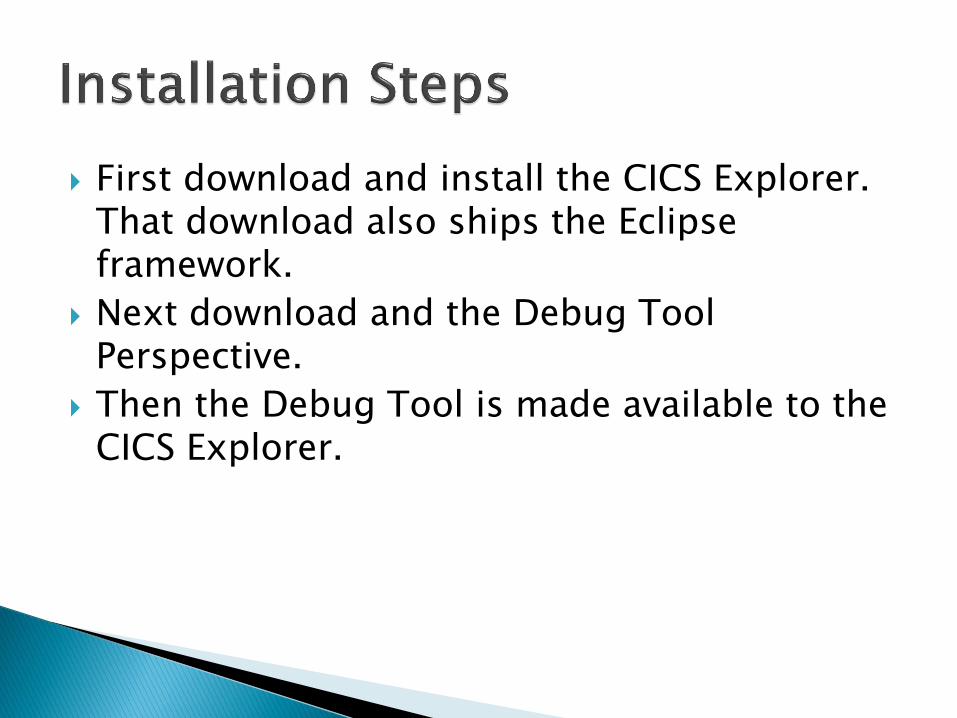
First download and install the CICS Explorer. That download also ships the Eclipse framework.
Next download and the Debug Tool Perspective.
Then the Debug Tool is made available to the CICS Explorer.
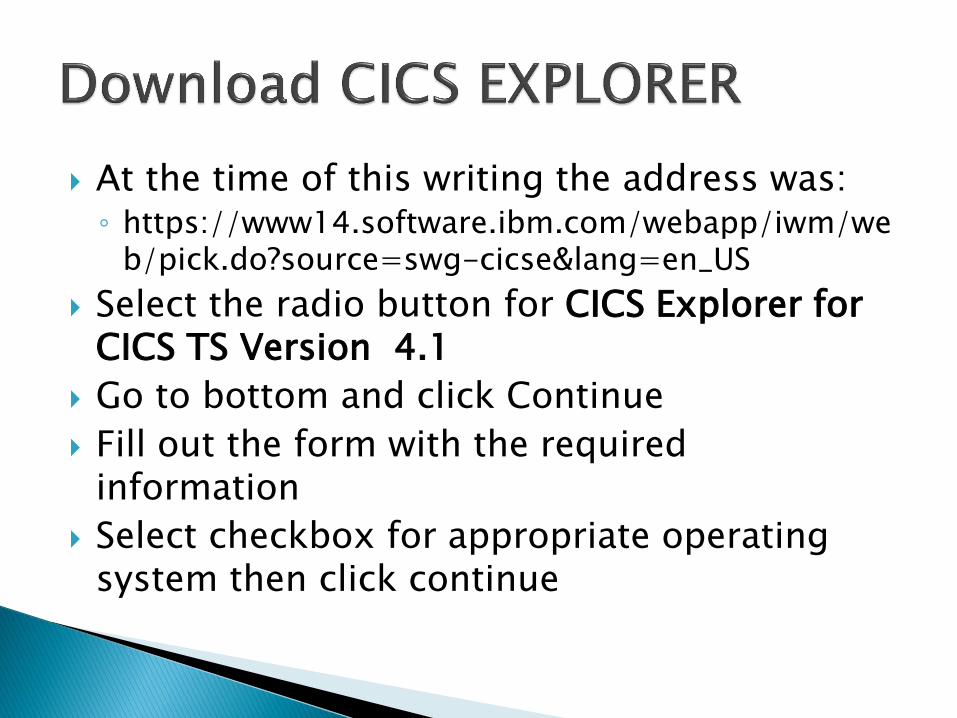
At the time of this writing the address was: ◦ https://www14.software.ibm.com/webapp/iwm/we
b/pick.do?source=swg-cicse&lang=en_US
Select the radio button for CICS Explorer for CICS TS Version 4.1
Go to bottom and click Continue
Fill out the form with the required information
Select checkbox for appropriate operating system then click continue

Go to IBM’s Problem Determination Tools Plug-in website.
At the time of this writing, the address was: http://www14.software.ibm.com/cgi-bin/weblap/lap.pl?popup=Y&li_formnum=L-JDEE-84GNEK&accepted_url=ftp://public.dhe.ibm.com/software/htp/cics/support/supportpacs/individual/cn0d.zip

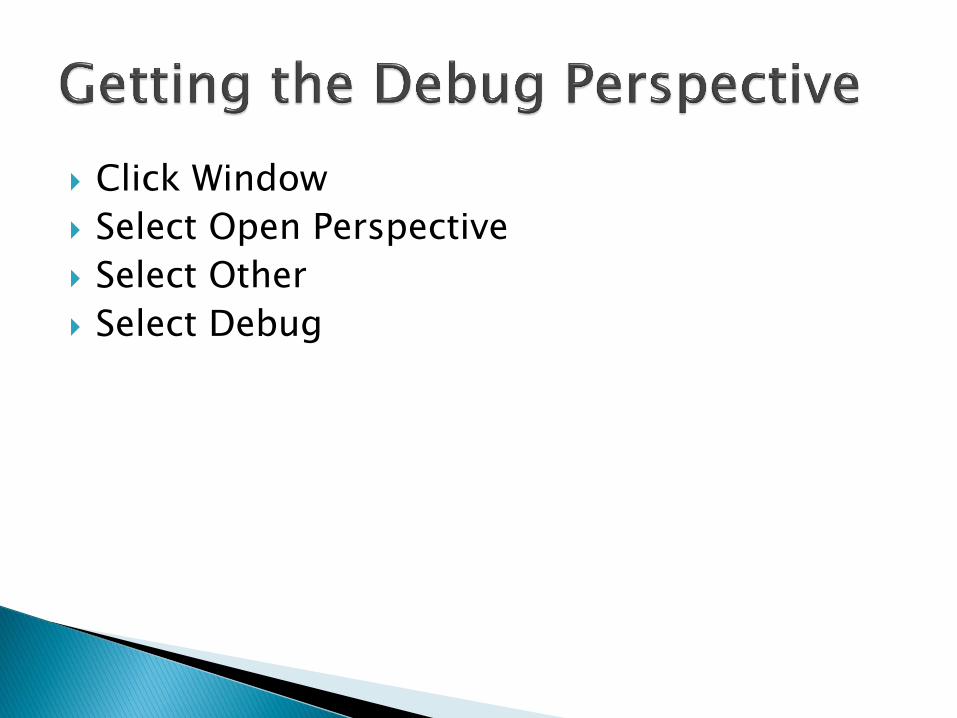
Click Window
Select Open Perspective
Select Other
Select Debug

//TEST EXEC PGM=NWGOEND,PARM=‘YOUR PARM’
//STEPLIB DD DISP=SHR,DSN=NWR.LINKLIB
//CEEOPTS DD *
TEST(,,,TCPIP&10.200.2.99%8001:)
//TEST EXEC PGM=NWGOEND,
// PARM=‘YOUR PARM/TEST(,,, TCPIP&10.200.2.99%8001:)’
//STEPLIB DD DISP=SHR,DSN=NWR.LINKLIB
//TEST EXEC PGM=IKJEFT01
//SYSTSPRT DD SYSOUT=A
//SYSPRINT DD SYSOUT=A
//SYSTSIN DD *
DSN SYSTEM(DSN)
RUN PROGRAM(NWPROG) PLAN(NWPROG) -
PARMS(‘/TEST(,,, TCPIP&10.200.2.99%8001:)’ -
LIB(‘NWR.LINKLIB’)
END

Note: “Session Type” is now TCP and we have a “Port Number”
And the “Display Id” is the IP address of my PC
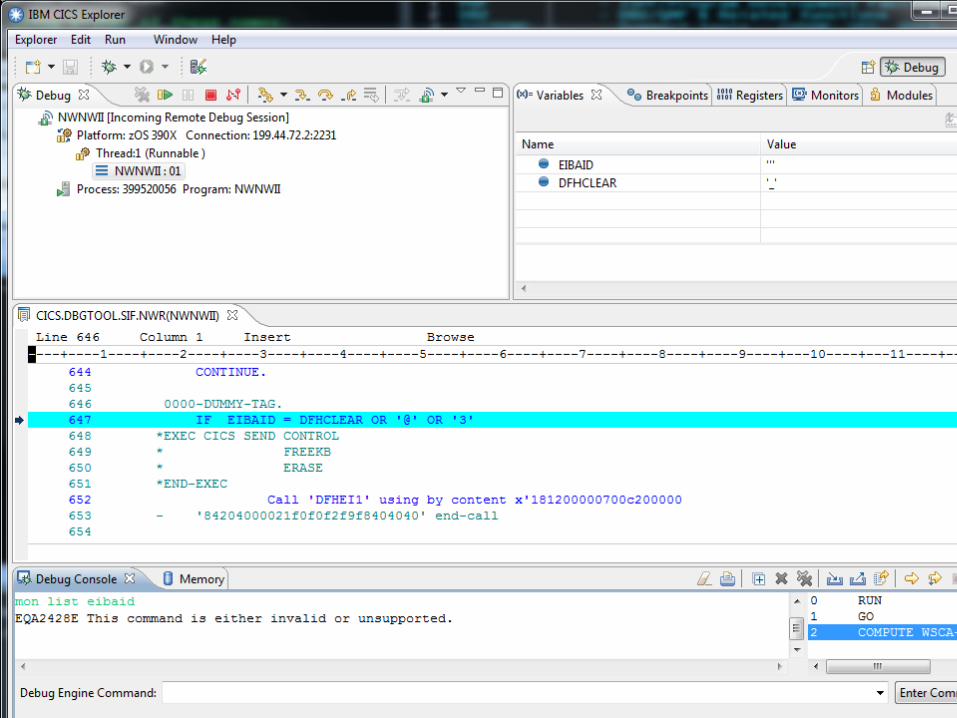

Right Click on any variable name.
Choose “Monitor Expression”.

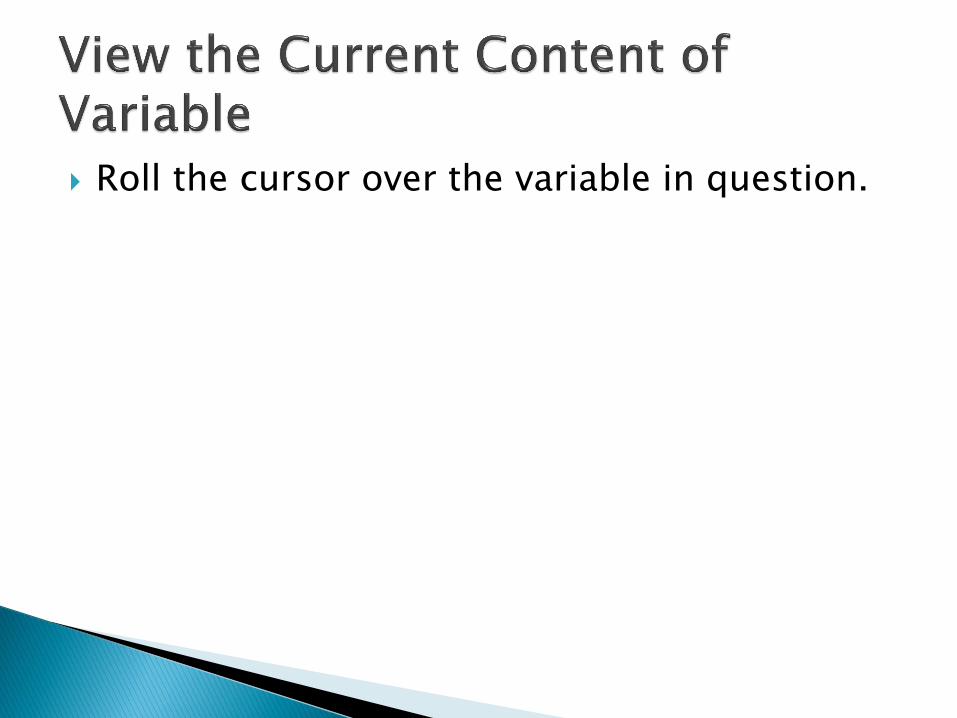
Roll the cursor over the variable in question.

Basic Debug Controls
Remove All Terminated Launches
Resume
Suspend
Terminate
Disconnect
Animated Step Into
Step Into
Step Over
Step Return
Drop To Frame

Basic Debug Controls

Basic Debug Controls
To go back to default view
Window -> Reset Perspective

Entering Commands
To Enter Commands
• Go to the Debug Engine Command input field at the bottom of the screen.
You can enter most normal commands as you would at the top of the
traditional 3270 screen.
Notes
• Click the arrow on the far right of the input field to select previously entered
commands

Entering Commands
Type in commands here
View previous commands
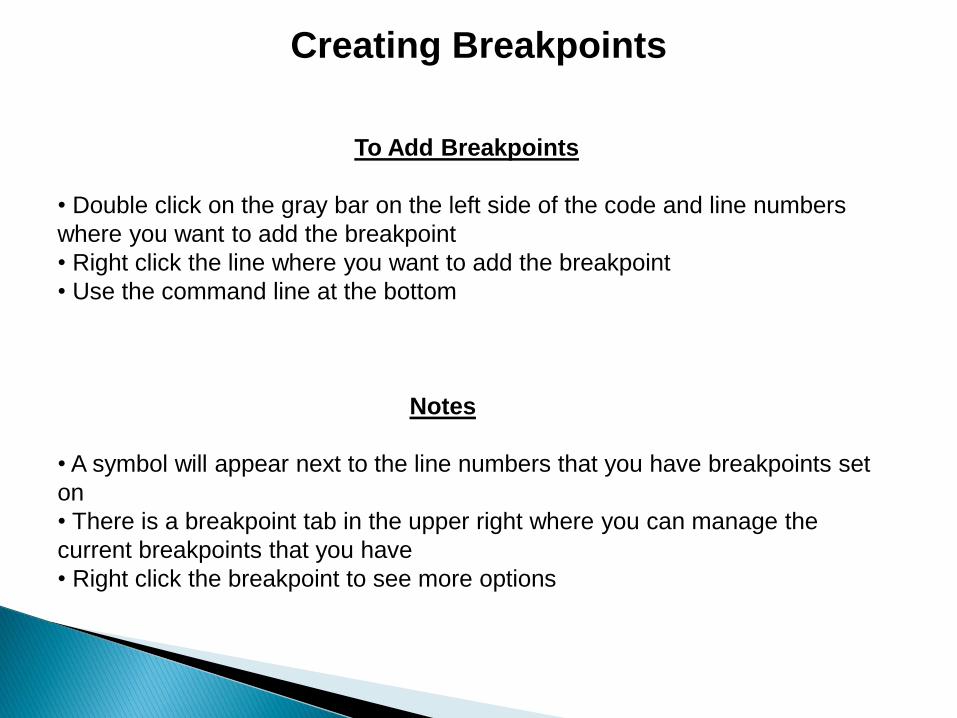
Creating Breakpoints
To Add Breakpoints
• Double click on the gray bar on the left side of the code and line numbers
where you want to add the breakpoint
• Right click the line where you want to add the breakpoint
• Use the command line at the bottom
Notes
• A symbol will appear next to the line numbers that you have breakpoints set
on
• There is a breakpoint tab in the upper right where you can manage the
current breakpoints that you have
• Right click the breakpoint to see more options

Creating Breakpoints
Breakpoint Tab
Breakpoint Indicators

Creating Breakpoints (Breakpoints Tab)
Remove Breakpoint
Remove All Breakpoints Skip All Breakpoints

Scrolling Rules
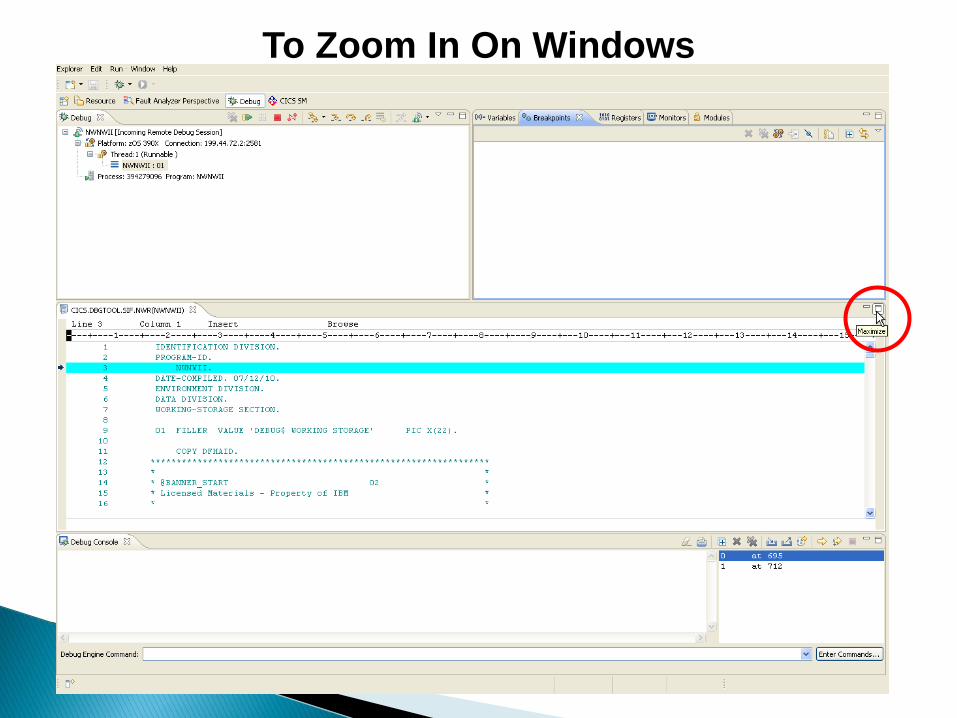
To Zoom In On Windows
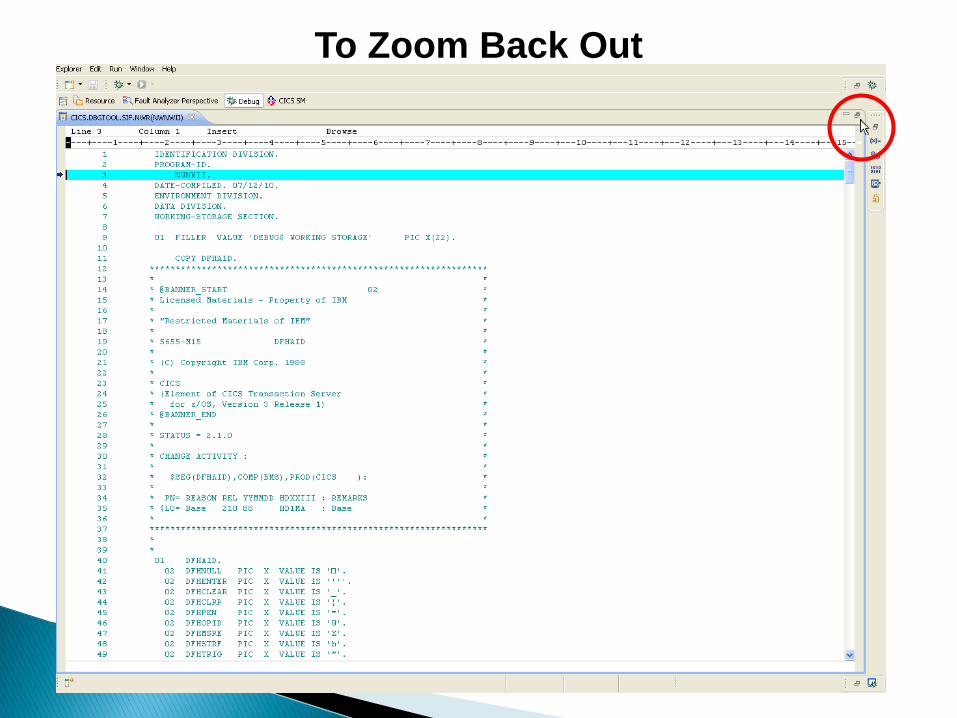
To Zoom Back Out

To Set Watch Breakpoints
CICS Systems Programmer COBOL and Assembler Application Programmer Mainframe Web Enablement Enthusiast Over 40 years in the DP (IS…IT...??) trenches
NorthWest Regional Data Center
www.nwrdc.fsu.edu (850) 245 3500