IBEC Annual Report 4 - World Edibec.worlded.org/publications/IBEC_Annual_Report 4.pdf · ·...
78
Improved Basic Education in Cambodia Project (IBEC): Annual Report for Year 2 31 October 2013 Annual Report for Year 4 IMPROVED BASIC EDUCATION IN CAMBODIA (IBEC) Prepared by: WORLD EDUCATION, INC. In Partnership with: KAMPUCHEAN ACTION FOR PRIMARY EDUCATION U.S. Agency for International Development Cooperative Agreement No. 442A0900003 WORLD EDUCATION, INC, 44 FARNSWORTH STREET, BOSTON MA 02210 USA TEL: (1) 6174829485, WWW.WORLDED.ORG
-
Upload
duongxuyen -
Category
Documents
-
view
215 -
download
0
Transcript of IBEC Annual Report 4 - World Edibec.worlded.org/publications/IBEC_Annual_Report 4.pdf · ·...

Improved Basic Education in Cambodia Project (IBEC): Annual Report for Year 2
08 Fall
31 October 2013
Annual Report for Year 4 IMPROVED BASIC EDUCATION IN CAMBODIA (IBEC)
Prepared by:
WORLD EDUCATION, INC.
In Partnership with:
KAMPUCHEAN ACTION FOR PRIMARY EDUCATION
U.S. Agency for International Development Cooperative Agreement No. 442-‐A-‐09-‐00003
W O R L D E D U C A T I O N , I N C , 4 4 F A R N S W O R T H S T R E E T , B O S T O N M A 0 2 2 1 0 U S A T E L : ( 1 ) 6 1 7 -‐ 4 8 2 -‐ 9 4 8 5 , W W W . W O R L D E D . O R G
IBEC Annual Report – Year 4
ii
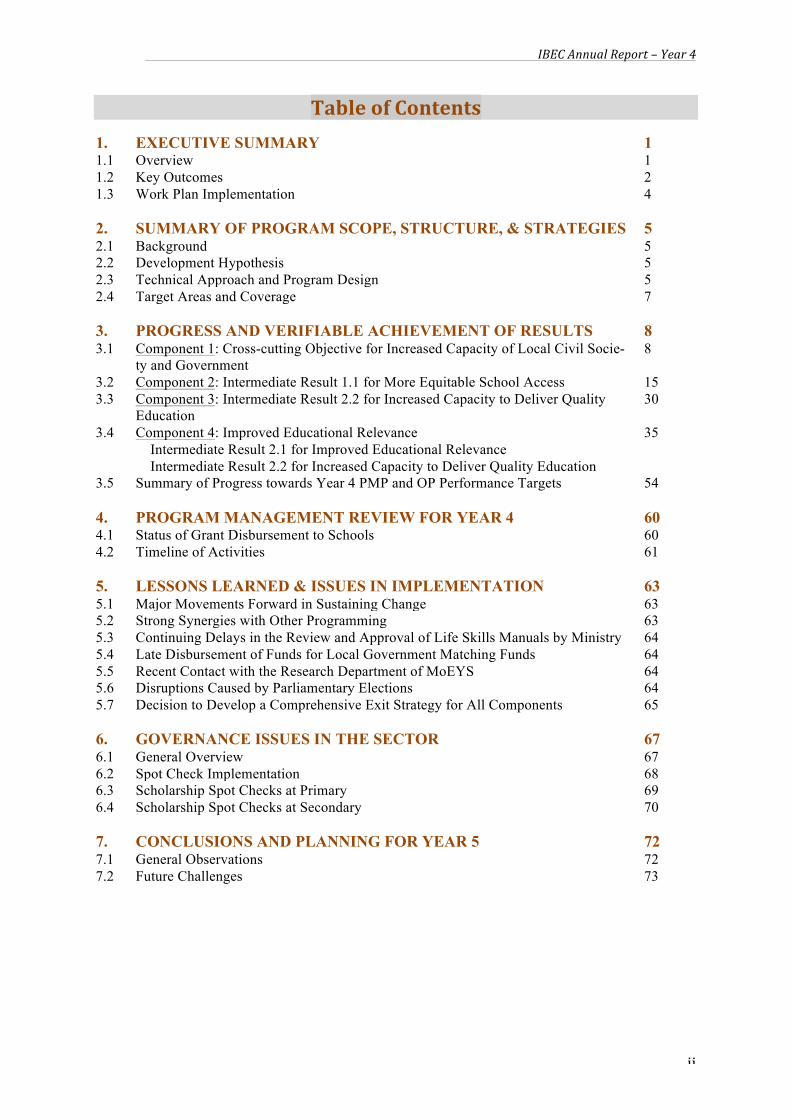
Table of Contents 1. EXECUTIVE SUMMARY 1 1.1 Overview 1 1.2 Key Outcomes 2 1.3 Work Plan Implementation 4 2. SUMMARY OF PROGRAM SCOPE, STRUCTURE, & STRATEGIES 5 2.1 Background 5 2.2 Development Hypothesis 5 2.3 Technical Approach and Program Design 5 2.4 Target Areas and Coverage 7 3. PROGRESS AND VERIFIABLE ACHIEVEMENT OF RESULTS 8 3.1 Component 1: Cross-cutting Objective for Increased Capacity of Local Civil Socie-
ty and Government 8
3.2 Component 2: Intermediate Result 1.1 for More Equitable School Access 15 3.3 Component 3: Intermediate Result 2.2 for Increased Capacity to Deliver Quality
Education 30
3.4 Component 4: Improved Educational Relevance 35 Intermediate Result 2.1 for Improved Educational Relevance Intermediate Result 2.2 for Increased Capacity to Deliver Quality Education 3.5 Summary of Progress towards Year 4 PMP and OP Performance Targets 54 4. PROGRAM MANAGEMENT REVIEW FOR YEAR 4 60 4.1 Status of Grant Disbursement to Schools 60 4.2 Timeline of Activities 61 5. LESSONS LEARNED & ISSUES IN IMPLEMENTATION 63 5.1 Major Movements Forward in Sustaining Change 63 5.2 Strong Synergies with Other Programming 63 5.3 Continuing Delays in the Review and Approval of Life Skills Manuals by Ministry 64 5.4 Late Disbursement of Funds for Local Government Matching Funds 64 5.5 Recent Contact with the Research Department of MoEYS 64 5.6 Disruptions Caused by Parliamentary Elections 64 5.7 Decision to Develop a Comprehensive Exit Strategy for All Components 65 6. GOVERNANCE ISSUES IN THE SECTOR 67 6.1 General Overview 67 6.2 Spot Check Implementation 68 6.3 Scholarship Spot Checks at Primary 69 6.4 Scholarship Spot Checks at Secondary 70 7. CONCLUSIONS AND PLANNING FOR YEAR 5 72 7.1 General Observations 72 7.2 Future Challenges 73
IBEC Annual Report – Year 4
iii
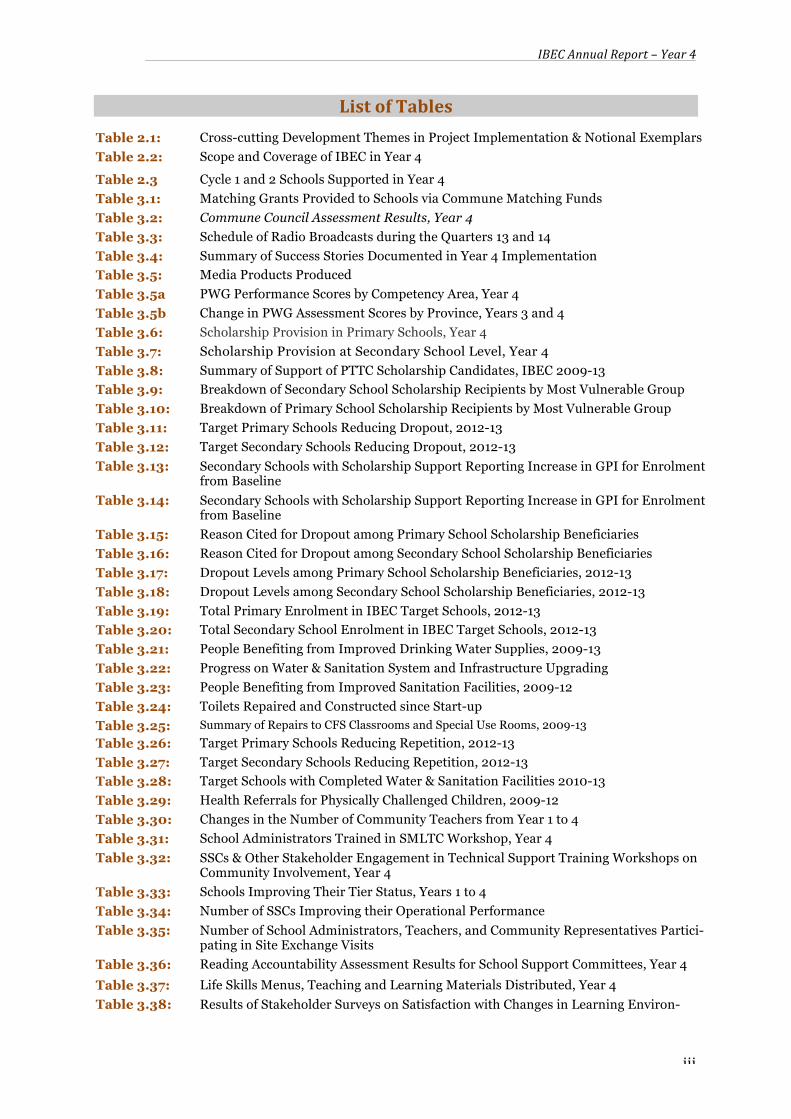
List of Tables Table 2.1: Cross-cutting Development Themes in Project Implementation & Notional Exemplars
Table 2.2: Scope and Coverage of IBEC in Year 4
Table 2.3 Cycle 1 and 2 Schools Supported in Year 4
Table 3.1: Matching Grants Provided to Schools via Commune Matching Funds
Table 3.2: Commune Council Assessment Results, Year 4 Table 3.3: Schedule of Radio Broadcasts during the Quarters 13 and 14
Table 3.4: Summary of Success Stories Documented in Year 4 Implementation
Table 3.5: Media Products Produced
Table 3.5a PWG Performance Scores by Competency Area, Year 4
Table 3.5b Change in PWG Assessment Scores by Province, Years 3 and 4
Table 3.6: Scholarship Provision in Primary Schools, Year 4
Table 3.7: Scholarship Provision at Secondary School Level, Year 4
Table 3.8: Summary of Support of PTTC Scholarship Candidates, IBEC 2009-13
Table 3.9: Breakdown of Secondary School Scholarship Recipients by Most Vulnerable Group
Table 3.10: Breakdown of Primary School Scholarship Recipients by Most Vulnerable Group
Table 3.11: Target Primary Schools Reducing Dropout, 2012-13
Table 3.12: Target Secondary Schools Reducing Dropout, 2012-13
Table 3.13: Secondary Schools with Scholarship Support Reporting Increase in GPI for Enrolment from Baseline
Table 3.14: Secondary Schools with Scholarship Support Reporting Increase in GPI for Enrolment from Baseline
Table 3.15: Reason Cited for Dropout among Primary School Scholarship Beneficiaries
Table 3.16: Reason Cited for Dropout among Secondary School Scholarship Beneficiaries
Table 3.17: Dropout Levels among Primary School Scholarship Beneficiaries, 2012-13
Table 3.18: Dropout Levels among Secondary School Scholarship Beneficiaries, 2012-13
Table 3.19: Total Primary Enrolment in IBEC Target Schools, 2012-13
Table 3.20: Total Secondary School Enrolment in IBEC Target Schools, 2012-13
Table 3.21: People Benefiting from Improved Drinking Water Supplies, 2009-13
Table 3.22: Progress on Water & Sanitation System and Infrastructure Upgrading
Table 3.23: People Benefiting from Improved Sanitation Facilities, 2009-12
Table 3.24: Toilets Repaired and Constructed since Start-up
Table 3.25: Summary of Repairs to CFS Classrooms and Special Use Rooms, 2009-13
Table 3.26: Target Primary Schools Reducing Repetition, 2012-13
Table 3.27: Target Secondary Schools Reducing Repetition, 2012-13
Table 3.28: Target Schools with Completed Water & Sanitation Facilities 2010-13
Table 3.29: Health Referrals for Physically Challenged Children, 2009-12
Table 3.30: Changes in the Number of Community Teachers from Year 1 to 4
Table 3.31: School Administrators Trained in SMLTC Workshop, Year 4
Table 3.32: SSCs & Other Stakeholder Engagement in Technical Support Training Workshops on Community Involvement, Year 4
Table 3.33: Schools Improving Their Tier Status, Years 1 to 4
Table 3.34: Number of SSCs Improving their Operational Performance
Table 3.35: Number of School Administrators, Teachers, and Community Representatives Partici-pating in Site Exchange Visits
Table 3.36: Reading Accountability Assessment Results for School Support Committees, Year 4
Table 3.37: Life Skills Menus, Teaching and Learning Materials Distributed, Year 4 Table 3.38: Results of Stakeholder Surveys on Satisfaction with Changes in Learning Environ-

IBEC Annual Report – Year 4
iv
ments at Their School, Year 4 (N=64)
Table 3.39: Primary Schools Implementing Interventions Enhancing Educational Relevance
Table 3.40: Secondary Schools Implementing Interventions Enhancing Educational Relevance
Table 3.41: School Performance on Educational Relevance by Province
Table 3.42: Schools Implementing Career Counseling In Terms of Designated Activity Channel
Table 3.43: Lab Establishment in IBEC, Year 4
Table 3.44: Cumulative Lab Establishment in Target Areas (2008-2013)
Table 3.45: Schools with ICT Facilities Scoring Satisfactory or Better on a Standardized Assess-ment Instrument
Table 3.46: Average Scores for IBEC-supported Labs on a Standardized Assessment Tool, Year 4
Table 3.47: Results of Student Attitudinal survey on IT Access, Impact, & Efficiency (Year 4)
Table 3.48: Summary of Assessment Results for Science Lab Usage among Teachers, Year 4
Table 3.49: Summary of Assessment Results for Science Lab Usage (Students
Table 3.50: Schools with IT Facilities Demonstrate IT integration in the Teaching-Learning Process Table 3.51: Number of Teachers Trained in Life Skills Education in Year 4
Table 3.52: Assessment Results of Life Skills Teachers in Secondary Schools, Year 4
Table 3.53: Life Skills Student Evaluation in Random Schools 2012/13
Table 3.54: Primary Level Teachers Trained in Child Friendly Teaching Techniques, Year 4
Table 3.55: Assessment Results for Classroom Physical Environments Meeting CFS Criteria, Year 4
Table 3.56: Assessment Results for Community Teachers, Year 4
Table 3.57: Child Friendly School Practice & Standards for Child-centeredness by Province (Pri-mary Level)
Table 3.58: Child Friendly Secondary School Practice & Standards for Child-centeredness by Prov-ince
Table 3.59: Assessment of the Effectiveness of Measures Put in Place to Enhance Reading and Writing
Table 3.60: Number of Schools Implementing One or More Reading Activity Channels, Year 4
Table 3.61: Assessment Results of Reading and Writing in Selected Schools
Table 3.62: Results of Student Remediation (Primary & Secondary School)
Table 3.63: Secondary schools with TSG in Year 4
Table 3.64: Overall Outcomes Regarding Performance Standards, Year 4
Table 3.65: Individual Status of MEP & OP Indicators for Year 4 Implementation
Table 4.1: Approved Budgets and Expenditure for All Target Clusters by Province in Academic Year 2012/13
Table 4.2: Approved Budgets and Expenditure for All Target Lower Secondary Schools by Prov-ince in Academic Year 2012/13
Table 4.3: Summary of Progress on Work Plan Implementation for Year 4
Table 4.4: Explanation of Activities Not Completed during Year 3 by Component
Table 6.1: Movement between Development Tiers, Primary School Level, 2011/12 to 2012/13
Table 6.2: Movement between Development Tiers, Secondary School Level, 2011/12 to 2012/13
Table 6.3: IBEC School Spot Check Results for Primary Level, Year 4
Table 6.4: IBEC School Spot Check Results for Secondary Level, Year 4
Table 6.5: IBEC School Spot Check Results for All Levels, Year 4
Table 6.6: Results of Scholarship Spot Checks at Primary Level
IBEC Annual Report – Year 4
v
Table 6.7: Results of Scholarship Spot Checks at Lower Secondary School Level
Figure 3.1: Change in Commune Performance Scores from Year 3 to Year 4
IBEC Annual Report – Year 4
1
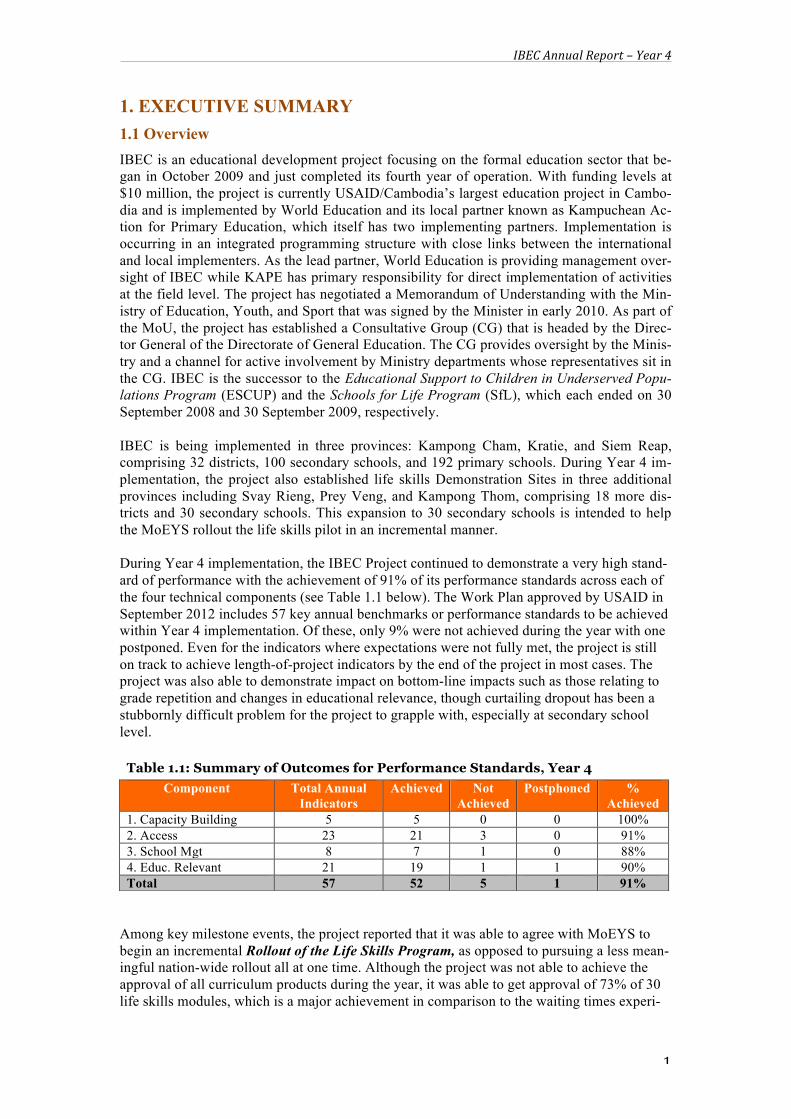
1. EXECUTIVE SUMMARY 1.1 Overview IBEC is an educational development project focusing on the formal education sector that be-gan in October 2009 and just completed its fourth year of operation. With funding levels at $10 million, the project is currently USAID/Cambodia’s largest education project in Cambo-dia and is implemented by World Education and its local partner known as Kampuchean Ac-tion for Primary Education, which itself has two implementing partners. Implementation is occurring in an integrated programming structure with close links between the international and local implementers. As the lead partner, World Education is providing management over-sight of IBEC while KAPE has primary responsibility for direct implementation of activities at the field level. The project has negotiated a Memorandum of Understanding with the Min-istry of Education, Youth, and Sport that was signed by the Minister in early 2010. As part of the MoU, the project has established a Consultative Group (CG) that is headed by the Direc-tor General of the Directorate of General Education. The CG provides oversight by the Minis-try and a channel for active involvement by Ministry departments whose representatives sit in the CG. IBEC is the successor to the Educational Support to Children in Underserved Popu-lations Program (ESCUP) and the Schools for Life Program (SfL), which each ended on 30 September 2008 and 30 September 2009, respectively. IBEC is being implemented in three provinces: Kampong Cham, Kratie, and Siem Reap, comprising 32 districts, 100 secondary schools, and 192 primary schools. During Year 4 im-plementation, the project also established life skills Demonstration Sites in three additional provinces including Svay Rieng, Prey Veng, and Kampong Thom, comprising 18 more dis-tricts and 30 secondary schools. This expansion to 30 secondary schools is intended to help the MoEYS rollout the life skills pilot in an incremental manner. During Year 4 implementation, the IBEC Project continued to demonstrate a very high stand-ard of performance with the achievement of 91% of its performance standards across each of the four technical components (see Table 1.1 below). The Work Plan approved by USAID in September 2012 includes 57 key annual benchmarks or performance standards to be achieved within Year 4 implementation. Of these, only 9% were not achieved during the year with one postponed. Even for the indicators where expectations were not fully met, the project is still on track to achieve length-of-project indicators by the end of the project in most cases. The project was also able to demonstrate impact on bottom-line impacts such as those relating to grade repetition and changes in educational relevance, though curtailing dropout has been a stubbornly difficult problem for the project to grapple with, especially at secondary school level.
Among key milestone events, the project reported that it was able to agree with MoEYS to begin an incremental Rollout of the Life Skills Program, as opposed to pursuing a less mean-ingful nation-wide rollout all at one time. Although the project was not able to achieve the approval of all curriculum products during the year, it was able to get approval of 73% of 30 life skills modules, which is a major achievement in comparison to the waiting times experi-
Table 1.1: Summary of Outcomes for Performance Standards, Year 4 Component Total Annual
Indicators Achieved Not
Achieved Postphoned %
Achieved 1. Capacity Building 5 5 0 0 100% 2. Access 23 21 3 0 91% 3. School Mgt 8 7 1 0 88% 4. Educ. Relevant 21 19 1 1 90% Total 57 52 5 1 91%

IBEC Annual Report – Year 4
2
enced by other agencies and projects. Another key event during the year was the successful integration of school support programming into commune investment plans as a key exit strategy. In this regard, 16 communes complied with project advocacy to provide investment funds for the support of educational activities in target areas. The project also succeeded in helping another local partner, Buddhist Social Development Association (BSDA) to achieve its accreditation with the Committee for Cooperation in Cambodia, the national ac-crediting agent for NGOs in Cambodia. This achievement along with the accreditation of Kampuchean Action for Primary Education will be a lasting legacy for the project that will help build institutional staying power in the Education Sector for the continuation of many of the interventions piloted under IBEC, much as USAID has done previously in the Health Sec-tor. Although the implementation of the School Management and Leadership Training Course was completed in Year 3, IBEC organized a culminating certification event presided over by the MoEYS as another milestone event during the year. Finally, it should it should be noted that the social enterprise ensuring a continuous flow of teaching aids to schools was also made completely independent of the project in Year 4.
1.2 Key Outcomes Component 1: Cross-cutting Objective for Increased Capacity of Local Civil Society: Com-ponent personnel were able to achieve all of its performance standards during the year. Key achievements included the accreditation of a second local partner called Buddhist Social De-velopment Association by the Committee for Cooperation in Cambodia. BSDA joins Kampu-chean Action for Primary Education, which achieved its accreditation last year through inten-sive project support. The Component also convinced 16 commune councils to start supporting local schools with commune investment funds, as part of a matching fund approach. This was a major step forward in terms of creating institutional habits of support for local schools by local governments.
Component 2: Intermediate Result for More Equitable School Access: Component 2 is re-sponsible for overseeing the implementation of scholarship programming at several levels (primary, secondary, and PTTC) as well as overseeing the implementation of discretionary school grants to promote access. The Component provided assistance to 5,542 vulnerable children in primary and secondary school (3,251 girls) as well as 120 locally recruited teach-ers at PTTC level who will return to their home communes to help address teacher shortages there. The Component noted several impressive results including an 85% completion rate at Grade 9 among vulnerable children receiving scholarship support as well as improvements in Gender Parity Index (GPI) for Enrolment in 74% of the secondary schools receiving scholar-ship support. This compares favorably with national rates in which the completion rate at Grade 9 is only 47%. Although dropout levels at secondary school level remained stubbornly resistant to change, the project was able to report that dropout had dropped from baseline lev-els among 65% of supported primary schools. Similarly, schools reported that grade repetition had decreased from baseline in 59% of primary schools and 70% of secondary schools. These vey positive bottom line changes in school efficiency are among the project’s most important achievements. The Component also oversaw significant investments in school infrastructure, especially for water and sanitation. This included the construction of 237 new toilets and the repair of 474 (711 since start-up), the repair of 85 classrooms (832 since start-up), and new construction of 108 wash stations (240 since start-up). Overall, the Component reported achieving 91% of its performance indicators during the year.
Component 3: Intermediate Result 2.2 for Increased Capacity to Deliver Quality Educa-tion: Component 3 organized a certification ceremony during the year signifying the success-ful completion of its two-year School Management & Leadership Training Course during Year 3. A total of 553 individuals were certified during this ceremony by H.E. Nath Bun-roeun. The Component also completed a catch-up course for 57 administrators who had been transferred to their schools after the SMLT course had begun. The Component organized ex-posure visits to Beacon Schools for 110 stakeholders and continued to organize capacity

IBEC Annual Report – Year 4
3
building workshops and follow-up for School Support Committees; recent surveys indicated that 90% of sampled SSCs had achieved a minimum standard of performance in general while 92% demonstrated measures that promote reading accountability. Overall, the Component achieved 88% of its performance standards during the year.
Component 4: Intermediate Result 2.1 for Improved Educational Relevance
Subcomponent 1 – Work Force Development through Life Skills Education: Following the successful piloting of the life skills framework and manuals in Year 3, the Component has focused on assisting the Ministry to rollout the framework in more schools on an incremental basis in Year 4. A key element of this strategy has been the identification of Demonstration Sites in new provinces (Kampong Thom, Svay Rieng, and Prey Veng), which can act as a cat-alyst for incremental expansion to surrounding schools in the future, using the Beacon School approach. A total of 30 Demonstration Sites were identified in these provinces at the begin-ning of Year 4 and have been implementing life skills curricula based on the pilot completed in Year 3, with modifications based on the lessons learned. At the same time, the Component has been working with the Ministry to approve all 30 manuals to facilitate national adoption. This approval process has taken longer than anticipated, delaying the printing of these manu-als with project funds. Nevertheless, the project is hopeful that this process can be completed quickly at the beginning of Year 5. Important outcomes achieved by the Component during the year include the approval of 22 (out of 30) life skills manuals by the Ministry as well as positive attitudinal survey results among students in which 83% of those sampled indicated increased satisfaction with the learning environments since the introduction of life skills pro-gramming. At the same time, 65% of schools demonstrated more relevant education as meas-ured by a standardized instrument designed for the purpose. Overall, the Component achieved all of its performance indicators except one which has been postponed to Year 5 implementa-tion. Component 4: Intermediate Result 2.2 for Increased Capacity to Deliver Quality Education
Subcomponent 2 – Educational Innovation for Science and Technology: Due to a last mi-nute change requiring a diversion of funds from IT Grant funds to a grant to VSO for English-language instruction, the project was only able to complete two out of the three planned labs during the year. Nevertheless, the subcomponent is still on track to achieve the end-of-project goal of 25 or 26 constructed labs within a margin of 10%. These labs provide services to over 37,000 students, helping them to acquire basic computer literacy skills as well as understand-ing of how to use computers in their regular subjects. Lab surveys have indicated high levels of administration and management as well as excellent access by enrolled students. In this regard, surveys during the year indicate that 59% of students are using the labs at least one hour per week while 39% reported using the labs two hours or more per week. Similarly, ac-cess to 20 science labs built by the project has also been reported to be very high with 86% of students expressing satisfaction with lab access while 62% of those surveyed reported actual-ly doing experiments themselves. This is a major transformation from the usual ‘talk and chalk’ method of science instruction seen in Cambodia before the implementation of the pro-ject. Finally, project work fairs organized by the subcomponent were well attended during the year and have become an event that generates great excitement and expectation among partic-ipating schools.
Subcomponent 3: Teacher Education: With a focus on teacher education issues, Subcompo-nent 3 carried out various activities to support teachers and build their capacity to deliver quality instruction and interventions during Year 4. A total of 940 teachers (357 women) at secondary level received training in Life Skills education while another 645 primary school teachers received training in Child Friendly School concepts. Furthermore, the Component put significant emphasis on assessing the impact of these trainings by observing teachers con-ducting lessons and assessing student performance. In this respect, 80% of observed second-ary school teachers demonstrated satisfactory performance in the instruction of life skills while 75% of students demonstrated adequate mastery of life skills concepts. In terms of
IBEC Annual Report – Year 4
4
competence in using Child Friendly School learning principles, 89% of observed primary school teachers demonstrated satisfactory performance or better while 86% of secondary school teachers observed did so. The Component has also made excellent progress in terms of promoting improved reading environments in target schools through its close cooperation with the Total Reading Approach for Children Project (TRAC). Recent surveys reported that all sampled schools are implementing at least one activity channel to promote enhanced read-ing environments and that 87% are implementing three activity channels or more, leading to enhanced reading scores in over two-thirds of sampled schools.
1.3 Project Management and Work Plan Implementation
As IBEC began a consolidation phase in Year 4 and started ramping down it grants to schools, total grant support to school dropped from $889,742 in Year 3 to $549,647 in Year 4. This represents a decline in support of 38% year on year. Nevertheless, grants to schools were still significant by any other measure and spanned a wide number of different kinds of sup-port from scholarships to Community Teachers, and general school grants. Discretionary school grants to primary and secondary schools still represented the largest single source of grant support at $176,951 (32%) followed by WASH grants at $174,091 (31%) and secondary school scholarships at $49,917 (9%). Fund utilization rates among schools continued to be very high. In this respect, primary schools reported utilizing 93% of the allocated funds while secondary schools reported utilizing 94%. Fund utilization rates tended to be highest in Kam-pong Cham Province where a large number of schools are located. The work plan approved by USAID for Year 4 implementation included 315 activities across the four component to be undertaken during the year (October 2012 to September 2013). All components reported a very high rate of activity completion with none falling below 92% activity completion. In all, components reported completing 95% of the activities identified during the year. Most of the uncompleted activities occurred in Component 4 (92% comple-tion) and reflect the challenges encountered by the Component in expediting the review and approval of Life Skills manuals submitted to the MoEYS Textbook Review Council.
IBEC Annual Report – Year 4
5
2. OVERVIEW OF PROGRAM SCOPE, STRUCTURE, & STRATEGIES 2.1 Background IBEC is an educational development project focusing on the formal education sector that be-gan in October 2009 and just completed its fourth year of operation. With funding levels at $10 million, the project is currently USAID/Cambodia’s largest education project in Cambo-dia and is implemented by World Education and its local partner known as Kampuchean Ac-tion for Primary Education, which itself has two implementing partners.1 IBEC is a five-year project with funding of $10 million in USG support as noted above and another $1.01 million in cost share from implementing partners. The project’s projected completion date is Septem-ber 2014. Implementation is occurring in an integrated programming structure with close links between the international and local implementers. As the lead partner, World Education is providing management oversight of IBEC while KAPE has primary responsibility for direct implementation of activities at the field level. The project has established itself in three prov-inces including Kampong Cham, Siem Reap, and Kratie (the selected provinces were required by USAID). The project has negotiated a Memorandum of Understanding with the Ministry of Education, Youth, and Sport that was signed by the Minister in early 2010. As part of the MoU, the project has established a Consultative Group (CG) that is headed by the Director General of the Directorate of General Education. The CG provides oversight by the Ministry and a channel for active involvement by Ministry departments whose representatives sit in the CG. IBEC is the successor to the Educational Support to Children in Underserved Popula-tions Program (ESCUP) and the Schools for Life Program (SfL), which each ended on 30 September 2008 and 30 September 2009, respectively. 2.2 Development Hypothesis The development hypothesis underlying IBEC’s technical approach is that in order to achieve access to a relevant basic education of quality, as stated in USAID’s strategic plan-ning framework, one has to simultaneously address a myriad of demand and supply side con-straints in a way that both empowers local stakeholders and builds ownership. These con-straints are often inter-linked and vary according to the local context. Therefore program-ming must take a holistic approach that is flexible enough to respond to evolving needs identified by stakeholders at the local level as well as the national policy context. 2.3 Technical Approach and Program Design IBEC carries forward much of the work started under previous USAID-supported program-ming (i.e., ESCUP and SfL) including a stakeholder-driven development approach, the use of activity menus, school grants, holistic programming based on the Ministry’s six Child Friend-ly School (CFS) Dimensions,2 and the use of local committees for direct implementation of activities. The program also continues to place a strong emphasis on solving pervasive teacher shortages as an essential prerequisite to effective educational development. The project modu-lates development assistance to fit local contexts and potentials by classifying schools into different tiers based on their level of developmental readiness to utilize external assistance. This practice operationalizes a provision in the Ministry’s Child Friendly School (CFS) policy often overlooked by other programs. In designing IBEC, World Education has developed a program structure with four tech-
1 NGO Education Partnership (NEP); Women and Children’s Rights Development (WCRD)
2 CFS Dimensions include: (1) Inclusive Education, (2) Effective Learning Environments, (3) 2 CFS Dimensions include: (1) Inclusive Education, (2) Effective Learning Environments, (3) Health and Sanitation, (4) Gender Sensitivity, (5) Child, Parental, and Community Engage-ment, and (6) Enabling Environments (i.e., School Management).
IBEC Annual Report – Year 4
6
nical components and a number of subcomponents. This includes components for: (i) Lo-cal NGO/Government Capacity Building & Advocacy for Sustainability; (ii) More Equi-table School Access; (iii) Improved School Management and Community Engagement; and (iv) Educational Relevance. With the completion of the School Leadership & Man-agement Course in Year 4, IBEC plans to consolidate Components 1 and 3 into one more streamlined component, as the project begins phase-out in Year 5. Component 2 has two subcomponents: Scholarships and School Grants. Similarly, Component 4 has three sub-components: Workforce Development through Life Skills Education, Educational Innova-tion for Science & Technology, and Teacher Education. The former Component has sup-ported activities at both the local and national level through the development of a Life Skills Curriculum Menu that was field tested in schools in Year 3. Year 4 began the pro-cess of revising manuals based on field-testing followed by review by the Ministry’s Textbook Approval Council. The Life Skills Implementation pilot has so far had tremen-dous buy-in from MoEYS with permission from the Ministry to use its logo on all ap-proved manuals.
IBEC brings new elements to the educational development model started under earlier pro-gramming including a major focus on life skills education at the secondary school level, cre-ating the institutional context to support life skills education (through a two-year School Management and Leadership Training Course), and major investments in water and sanitation systems in both primary and secondary schools. Another major new element in IBEC relates to its focus on the development of local institutional structures, especially local NGO partners and local government to continue activity implementation after project closure. A special component dedicated specifically to this goal has been created as part of IBEC’s overall de-sign. LNGOs do self-assessments, set benchmarks for improvement, and review progress to-wards stated goals, as part of the capacity-building process. An accreditation process for two of these partners (Kampuchean Action for Primary Education and Buddhist Social Develop-ment Association) was initiated in Year 2 and completed during Year 4 with official accredi-tation conferred by the NGO Good Practices Program (GPP) operated by the Committee for Cooperation in Cambodia (CCC).3
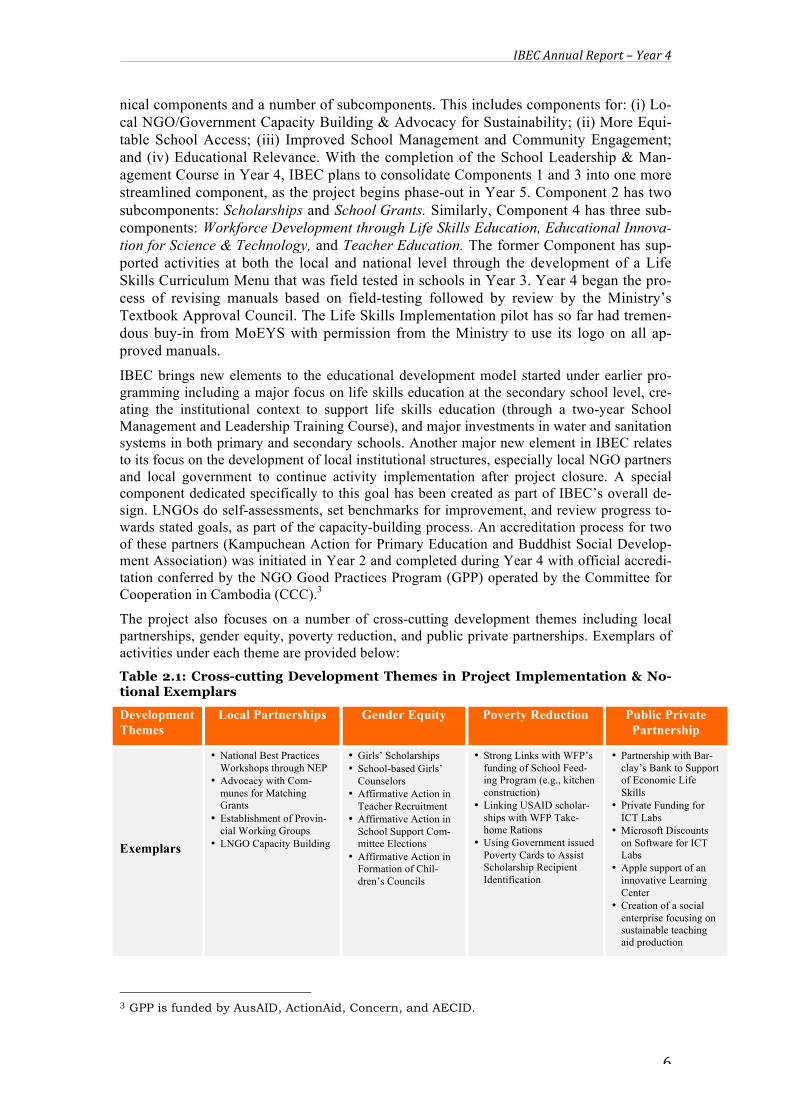
The project also focuses on a number of cross-cutting development themes including local partnerships, gender equity, poverty reduction, and public private partnerships. Exemplars of activities under each theme are provided below: Table 2.1: Cross-cutting Development Themes in Project Implementation & No-tional Exemplars
Development Themes
Local Partnerships Gender Equity Poverty Reduction Public Private Partnership
Exemplars
• National Best Practices Workshops through NEP
• Advocacy with Com-munes for Matching Grants
• Establishment of Provin-cial Working Groups
• LNGO Capacity Building
• Girls’ Scholarships • School-based Girls’
Counselors • Affirmative Action in
Teacher Recruitment • Affirmative Action in
School Support Com-mittee Elections
• Affirmative Action in Formation of Chil-dren’s Councils
• Strong Links with WFP’s funding of School Feed-ing Program (e.g., kitchen construction)
• Linking USAID scholar-ships with WFP Take-home Rations
• Using Government issued Poverty Cards to Assist Scholarship Recipient Identification
• Partnership with Bar-clay’s Bank to Support of Economic Life Skills
• Private Funding for ICT Labs
• Microsoft Discounts on Software for ICT Labs
• Apple support of an innovative Learning Center
• Creation of a social enterprise focusing on sustainable teaching aid production
3 GPP is funded by AusAID, ActionAid, Concern, and AECID.
IBEC Annual Report – Year 4
7
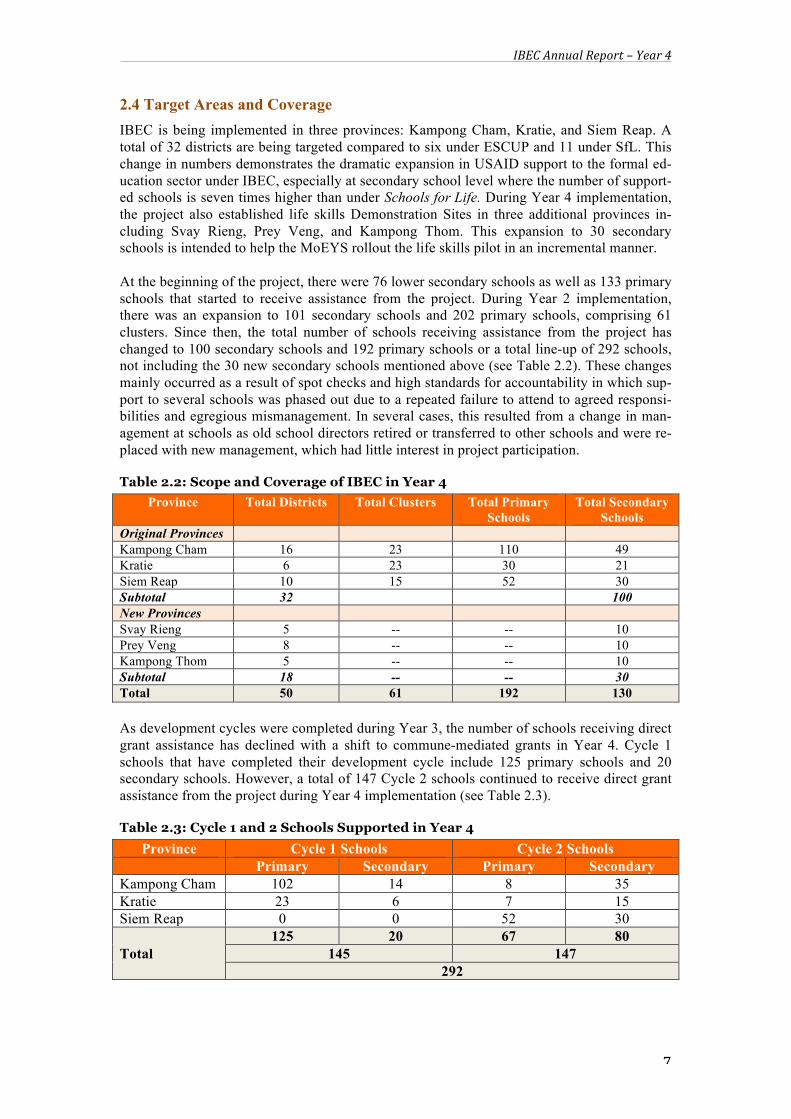
2.4 Target Areas and Coverage IBEC is being implemented in three provinces: Kampong Cham, Kratie, and Siem Reap. A total of 32 districts are being targeted compared to six under ESCUP and 11 under SfL. This change in numbers demonstrates the dramatic expansion in USAID support to the formal ed-ucation sector under IBEC, especially at secondary school level where the number of support-ed schools is seven times higher than under Schools for Life. During Year 4 implementation, the project also established life skills Demonstration Sites in three additional provinces in-cluding Svay Rieng, Prey Veng, and Kampong Thom. This expansion to 30 secondary schools is intended to help the MoEYS rollout the life skills pilot in an incremental manner. At the beginning of the project, there were 76 lower secondary schools as well as 133 primary schools that started to receive assistance from the project. During Year 2 implementation, there was an expansion to 101 secondary schools and 202 primary schools, comprising 61 clusters. Since then, the total number of schools receiving assistance from the project has changed to 100 secondary schools and 192 primary schools or a total line-up of 292 schools, not including the 30 new secondary schools mentioned above (see Table 2.2). These changes mainly occurred as a result of spot checks and high standards for accountability in which sup-port to several schools was phased out due to a repeated failure to attend to agreed responsi-bilities and egregious mismanagement. In several cases, this resulted from a change in man-agement at schools as old school directors retired or transferred to other schools and were re-placed with new management, which had little interest in project participation. Table 2.2: Scope and Coverage of IBEC in Year 4
Province Total Districts Total Clusters Total Primary Schools
Total Secondary Schools
Original Provinces Kampong Cham 16 23 110 49 Kratie 6 23 30 21 Siem Reap 10 15 52 30 Subtotal 32 100 New Provinces Svay Rieng 5 -- -- 10 Prey Veng 8 -- -- 10 Kampong Thom 5 -- -- 10 Subtotal 18 -- -- 30 Total 50 61 192 130 As development cycles were completed during Year 3, the number of schools receiving direct grant assistance has declined with a shift to commune-mediated grants in Year 4. Cycle 1 schools that have completed their development cycle include 125 primary schools and 20 secondary schools. However, a total of 147 Cycle 2 schools continued to receive direct grant assistance from the project during Year 4 implementation (see Table 2.3). Table 2.3: Cycle 1 and 2 Schools Supported in Year 4
Province Cycle 1 Schools Cycle 2 Schools Primary Secondary Primary Secondary
Kampong Cham 102 14 8 35 Kratie 23 6 7 15 Siem Reap 0 0 52 30
Total 125 20 67 80
145 147 292

IBEC Annual Report – Year 4
8
3. PROGRESS & VERIFIABLE ACHIEVEMENT OF RESULTS 3.1 Component 1: Cross-cutting Objective for Increased Capacity of Local Civil So-ciety Cross-Cutting Objective: Increased Capacity of Local Civil Society, including Education NGOs and Government Component Overview
The establishment of a component dedicated exclusively to building the capacity of civil society organizations involved in education and local government is a new innovation in USAID pro-gramming in the sector that seeks to replicate the successes achieved by the USG in the health sec-tor. During Years 1 to 4, the component has focused on a number of local organizations including Kampuchean Action for Primary Education (KAPE), Women and Children’s Rights Development (WCRD), Economic Development Association (EDA), Buddhist Social Development Association (BSDA), and NGO Education Partnership (NEP). KAPE is the largest of these organizations and has the most potential for receiving funds directly from USAID in the future. As a result of project inputs, both KAPE and BSDA were accredited by CCC.
The component also works closely with local government including Provincial Working Groups (PWGs) who help project personnel oversee the project and Commune EFA Committees (CEFACs), which are responsible for working with schools to promote access to education. Final-ly, the component works closely with counterparts at the national level who sit on the Consultative Group, which is an interdepartmental body charged with overseeing the project from a national perspective and ensuring liaison with senior management in the Ministry. The Component has a mandate to promote sustainability of project inputs through building institutional capacity as well as the dissemination of best practices through such means as radio programming (implemented by Media One), production of project literature (e.g., brochures, newsletters, websites), and the publi-cation of research articles in relevant areas. The Component has five Annual Performance Targets for Year 4 implementation including LNGO accreditation, shifting grant support to commune councils, performance standards for CEFACs and PWGs, and dissemination of best practices.
Performance Indicator 1: One LNGO (Buddhist Social Development Association) receives CCC accreditation by the end of Year 4.4 Among its end-of-project per-formance standards, IBEC sought to achieve the accredita-tion of at least two Local NGOs using the Discussion-oriented Self Assessment (DOSA). The project had sought to achieve this outcome by the end of Year 3. However, given the rigor of the process overseen by the NGO Good Practices Pro-ject (GPP) of the Cambodia Committee for Cooperation, it was only possible to achieve the accreditation of one agency in Year 3 (i.e., Kampuchean Action for Primary Education) with the accreditation of a second agency (Buddhist Social Devel-
4 Pending from Year 3 and completed in Year 4.
Another Milestone Achieved: The Certificate of Accredita-‐tion awarded to BSDA by GPP.

IBEC Annual Report – Year 4
9
opment Association) deferred to Year 4 implementation. After working hard during the year to fulfill the points deemed lacking by the CCC evaluation team during earlier governance reviews in Year 3, BSDA finally achieved certification of compliance against the Code of Ethical Principles and Minimum Standards for NGOs in Cambodia. This official certification by the NGO Code Compliance Committee is valid for a 3- year period from 25/01/2013 to 24/01/2016. BSDA is now the second Local NGO to receive such certification with USAID technical assistance, thereby giving local procurement themes echoed in USAID Forward a very big push forward. Thus, this indicator was fully achieved during the year. Performance Indicator 2: 15 communes/district councils provide matching funds to schools
IBEC has provided all of its schools with three years of direct grants as part of the school im-provement development cycle. Those schools starting their cycle in Year 1 (i.e., Cycle 1 schools) completed their direct grant support in Year 3. A key sustainability strategy for the project is to shift this school support in Year 4 to commune councils, which are expected to provide matching funds to local schools as part of their capacity building process. This strategy is intended to create institutional habits of support for schools by the councils, thereby providing long-term funding for the school improvement process. It was originally planned that only 15 communes would provide such funds in Year 4 but this was increased to 16, based on discussions with local governments that were interested in participating in the program. During the year, a total 14 out 16 communes provided matching funds to Cycle 1 schools formerly supported entirely by IBEC, thereby achieving the performance indicator within a margin of 10% (based on a target of 15 com-munes). Promised matching funds amounted to $3,227 from communes, which comprises about 25% of the agreed grant funds for the year ($12,879) (see Table 3.1). Field offices reported that 88% of allocated funds were actually spent. This will undoubtedly increase when promised funds are received from Tmor Pich and Ampil Tapok Communes. In the actual event, communes provid-ed $2,622 to local schools in their area. Two communes did not include matching funds in the CIP when it was submitted, resulting in a problem for the release of funds from MOI for this purpose. The project is still negotiating with these communes to make sure that they provide the promised matching funds for the academic year just ending as well as the new one just starting. Table 3.1: Matching Grants Provided to Schools via Commune Matching Funds Promised Budget Actually Liquidated
N Commune IBEC CC Total IBEC % CC % Total All Sources %
1 Kor 599.00 180.00 779.00 583.00 97% 180.00 100% 763.00 98% 2 Lvea 600.00 180.00 780.00 568.00 95% 160.00 89% 728.00 93% 3 Kor 635.00 200.00 835.00 595.00 94% 200.00 100% 795.00 95% 4 Thmer Pich 600.00 383.00 983.00 600.00 100% 0.00 0% 600.00 61% 5 RokaPouBram 513.00 180.00 693.00 460.00 90% 170.00 94% 630.00 91%
6 Sralap 600.00 180.00 780.00 570.00 95% 180.00 100% 750.00 96% 7 Ampil Tapok 600.00 180.00 780.00 520.00 87% 0.00 0% 520.00 67% 8 Krek 600.00 180.00 780.00 481.24 80% 180.00 100% 661.24 85% 9 K. Chrum 600.00 180.00 780.00 145.50 24% 180.00 100% 325.50 42%
10 Kork 600.00 180.00 780.00 600.00 100% 180.00 100% 780.00 100% 11 Peus Pi 594.00 180.00 774.00 523.50 88% 168.00 93% 691.50 89% 12 Sandan 670.00 251.50 921.50 670.00 100% 251.50 100% 921.50 100% 13 Pi Thnou 592.00 188.00 780.00 592.00 100% 188.00 100% 780.00 100% 14 Svay Chres 649.00 205.00 854.00 649.00 100% 205.00 100% 854.00 100% 15 Han Chey 600.00 180.00 780.00 600.00 100% 180.00 100% 780.00 100% 16 Brasat 600.00 200.00 800.00 600.00 100% 200.00 100% 800.00 100% Total 9,652.00 3,227.50 12,879.50 8,757.24 91% 2,622.50 81% 11,379.74 88%

IBEC Annual Report – Year 4
10
During the year, Component personnel continued to provide capacity building support to those commune staff responsible for administering funds to ensure proper liquidation of matching funds received from IBEC. The Component also worked with schools receiving their commune grants to make sure that there was proper communication with the commune and that principles of transpar-ency and good governance are observed. The schools and communes visited provided progress reports and recounted any problems that are needed for resolution. In general, the feedback from field staff was satisfactory with re-ports that communes had had con-siderable contact with the schools that they are supporting and are generally more involved in the pro-vision of educational services there. There are now also stronger links between the local communities affil-iated with the schools and the com-munes as well. Thus, the matching fund activity has not only strength-ened sustained institutional support for schools but has improved the overall governance of commune councils in the way that they fulfill their role as a public service provid-er. Performance Indicator 3: At least 75% of selected CEFACs meet min-imum performance standards.
Duiring Year 4, CEFACs participated in several training workshops provided by component 1 to strengthen capacity building for 37communes, focusing on members of the Commune Education for All Commission (CEFAC). In particular, capacity building activities focused on Participatory Rural Appraisal (PRA) and Commune Annual Planning to foster the ability to better manage edu-cation issues such as preparation for Year 5 when more project schools will be moved to com-mune-mediated assistance. These measures are intended to ensure a sustainable exit strategy that will enable CEFACs to continue support to target schools after project closure. As a result of these efforts, there are now 37 communes in target sites that have already developed their own Com-mune Education Plan. IBEC will be supporting 27 of these communes with matching funds in Year 5 while the other ten communes will try to find support from other NGOs during the District Integration Workshops (DIWs). The main purpose of Commune Education Planning supported by IBEC is to prepare commune councils to have in hand a precise education plan so that they can insert it into the Commune Investment Plan (CIP) to get MOI funding for local schools. These planning sessions involved about 577 local stakeholders in selected communes. Participants in-cluded commune council members (288), school directors and teachers (184), School Support Committee representatives, and community representatives (115). During the commune education planning exercise, participants learned how to use tools such as problem trees during meetings with community and while reviewing interventions, In order to identify current needs from local stakeholders.
In September 2013, project staff conducted the annual CEFAC assessment on a sample of 15 Communes (47% of the total target) of which five were located in Kampong Cham, five in Kratie, and another five in Siem Reap. The assessment covered 3 main areas: (i) Knowledge of Education Policies, (ii) Understanding of IBEC Goals, and (iii) Understanding of CEFAC roles and duties, as in previous years. The assessment shows a general increase in understanding across all parameters as follows:
Knowledge of Education Policies 99%
Building New Institutional Patterns of School Sup-‐port: Commune Leaders in Han Chey Commune (Kratie) sign a support contract with the local school

IBEC Annual Report – Year 4
11
Understanding of IBEC Goals: 76% Understanding of CEFAC roles & duties: 79%
Due to this year’s July national elections, Commune Council composition slightly changed in sev-eral locations. Consequently, not all the people who attended project training sessions in previous years were still in their position and available to be randomly chosen for interview, thereby delay-ing the identification of all the interviewees. In all, a total of 32 people were interviewed (4 fe-males) of whom 50% were aged less than 50 years old, which indicates an important change in the demographic make-up of local leadership. Overall, CEFACs scored an average score of 83% while 14 out of 16 or 94% met a minimum performance standard of 65%, thereby achieving the performance standard (see Table 3.2). Table 3.2: Commune Council Assessment Results, Year 4
No District Commune Result SIEM REAP PROVINCE 1 Puork Prey Chruk 90% 2 Svay Ler Svay Ler 87% 3 Banteay Srey Khna Sanday 73% 4 Chikraeng Anlong Samnor 77% 5 Varin Prasath 90% Average 83% KRATIE PROVINCE
6 Snoul Svay Chras 75% 7 Chhlong Hanchey 88% 8 Prek Brasab Prek Brasob 82% 9 Sambo Sorndan 98% 10 Krong O-Roesey 88% Average 86% KAMPONG CHAM PROVINCE
11 O Rang Euv Ampil Tapork 80% 12 Cherng Prey Soteb 68% 13 Prey Chhor Lvea 95% 14 Prey Chhor Kor 62% 16 Ponhea Krek Kandol Chrum 95% Average 80% Overall Average 83%
It is also important to note that there was an improvement of about 13% from previous CEFAC assessments in Year 3 (2012). This improvement was true of all three parameters where assess-ments occurred indicating a positive trend for capacity levels in target areas (see Figure 3.1).
Figure 3.1: Change in Commune Performance Scores from Year 3 to Year 4

IBEC Annual Report – Year 4
12
Performance Indicator 4: Multiple channels for dissemination of programming active and in place including: (i) 4 CG meetings; (ii) 3 radio programs; (iii) 2 NEP workshops; (iv) 10 success sto-ries; (v) 1 updated website; (vi) 4 Newslet-ters; (vii) 1 Research article. The project met all of its requirements for information dissemination and coor-dination during the year. In this respect, the project held four meetings with the Consultative Group to discuss various matters such as appointments to fill va-cancies, organizing informative field visits for Ministry personnel, and lobbying for accelerated approval of the Life Skills modules during the year. The project ex-ceeded its target of radio programs with six episodes on life skills messaging pro-duced and aired during the first six months of the school year. MEDIA One, the part-ner responsible for this programming, broadcast the We Can Do It life skills ra-dio program on a nationwide radio station Bayon, FM 95 MHz and also distributed each program to IBEC Program target schools on CDs. Each radio program aired twice per month and reached a national audience, unlike previous programming that was more local in focus. During the imple-mentation year, MEDIA One broadcast its radio programming 12 times on the partner stations as can be seen in Table 3.3 below. Table 3.3: Schedule of Radio Broadcasts during the Quarters 13 and 14
Episode Station Month, Day Number of Broadcasts
Number of Meetings in
Schools 1. The World of Jobs FM 95 December 16, 23 2
22
2. Why Do We Need to Consult the Career Counselor?
FM 95 December 30 January 06
2
3. Learning about Other Cultures FM 95 January 13, 20 2 4. Say ‘No’ to Drugs FM 95 January 27
February 09 2
5. Self-Awareness FM 95 February 10, 17 2 6. Saving and Spending FM 95 February 24
March 03 2
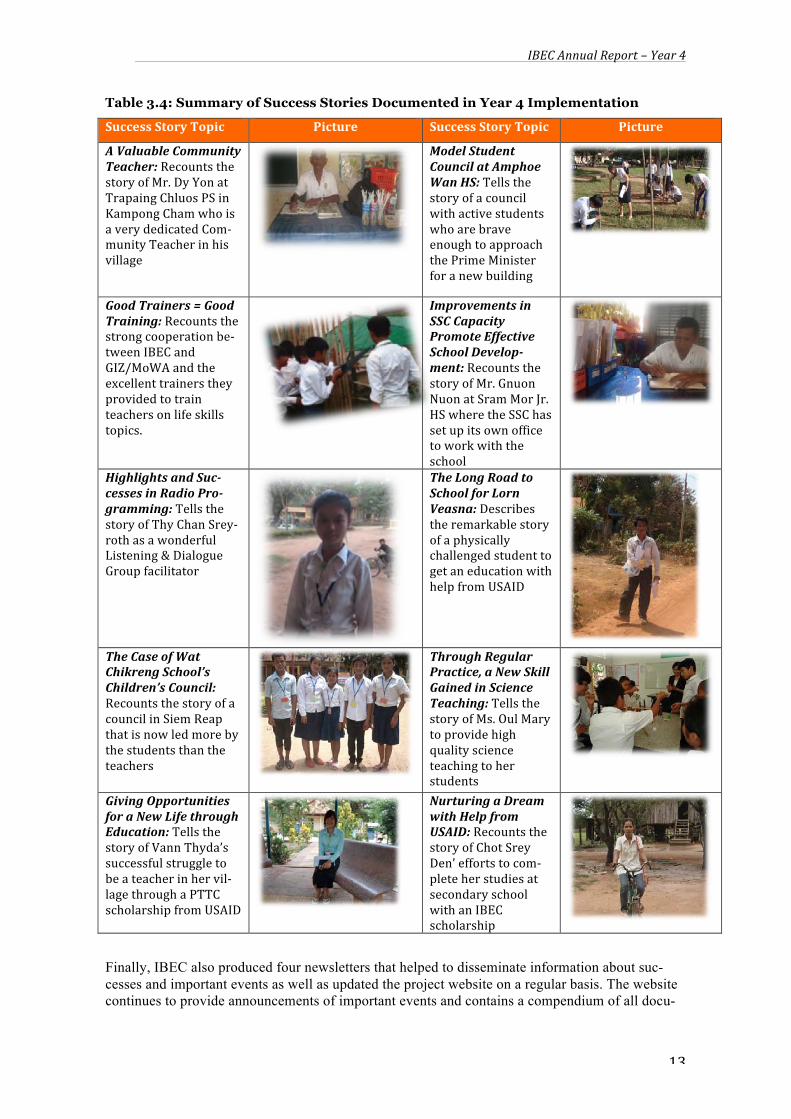
6 Episodes 12 The project also organized two national workshops/events to disseminate program content alt-hough in a change of plan, only one of these was organized by the NGO Education Partnership, which is funded through KAPE. One important event included the dissemination of certificates in Kampong Cham marking the completion of the School Management & Leadership Training Course (SMLTC) on 25 June 2013 and the other was the Annual Best Practices Workshop orga-nized in Phnom Penh on 26 August 2013. Both events were marked by hundreds of participants and received considerable media attention. The Certificate Dissemination Ceremony was a very high profile event that was chaired by H.E. Nath Bunroeun, Secretary of State at MoEYS. IBEC also continued documenting individual success stories with ten such stories reported through quar-terly reports provided to USAID during the year (Quarters 13, 14, and 15. These stories give an idea of the impact of project activities on the individual lives of children, teachers, and community members (see Table 3.4).
Leveraging Life Skills Messaging through Radio: A listening dialogue group tunes into a We Can Do It episode
IBEC Annual Report – Year 4
13
Table 3.4: Summary of Success Stories Documented in Year 4 Implementation
Success Story Topic Picture Success Story Topic Picture
A Valuable Community Teacher: Recounts the story of Mr. Dy Yon at Trapaing Chluos PS in Kampong Cham who is a very dedicated Com-‐munity Teacher in his village
Model Student Council at Amphoe Wan HS: Tells the story of a council with active students who are brave enough to approach the Prime Minister for a new building
Good Trainers = Good Training: Recounts the strong cooperation be-‐tween IBEC and GIZ/MoWA and the excellent trainers they provided to train teachers on life skills topics.
Improvements in SSC Capacity Promote Effective School Develop-‐ment: Recounts the story of Mr. Gnuon Nuon at Sram Mor Jr. HS where the SSC has set up its own office to work with the school
Highlights and Suc-‐cesses in Radio Pro-‐gramming: Tells the story of Thy Chan Srey-‐roth as a wonderful Listening & Dialogue Group facilitator
The Long Road to School for Lorn Veasna: Describes the remarkable story of a physically challenged student to get an education with help from USAID
The Case of Wat Chikreng School’s Children’s Council: Recounts the story of a council in Siem Reap that is now led more by the students than the teachers
Through Regular Practice, a New Skill Gained in Science Teaching: Tells the story of Ms. Oul Mary to provide high quality science teaching to her students
Giving Opportunities for a New Life through Education: Tells the story of Vann Thyda’s successful struggle to be a teacher in her vil-‐lage through a PTTC scholarship from USAID
Nurturing a Dream with Help from USAID: Recounts the story of Chot Srey Den’ efforts to com-‐plete her studies at secondary school with an IBEC scholarship
Finally, IBEC also produced four newsletters that helped to disseminate information about suc-cesses and important events as well as updated the project website on a regular basis. The website continues to provide announcements of important events and contains a compendium of all docu-
IBEC Annual Report – Year 4
14
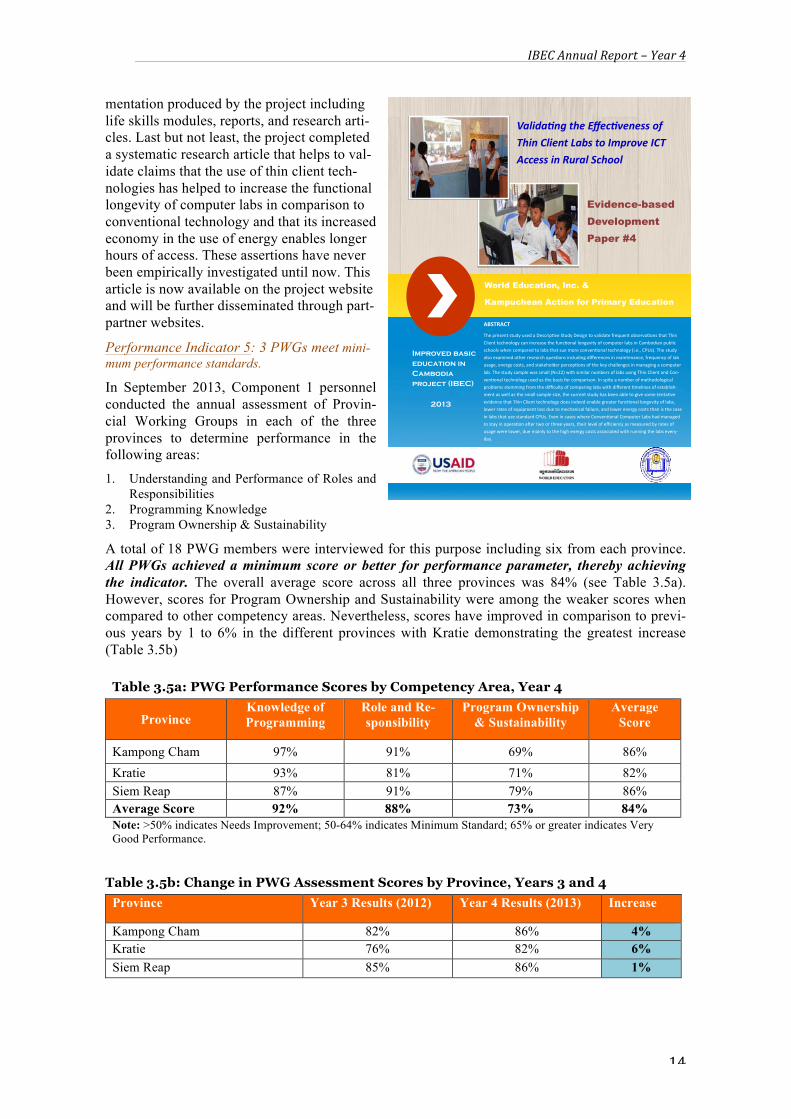
mentation produced by the project including life skills modules, reports, and research arti-cles. Last but not least, the project completed a systematic research article that helps to val-idate claims that the use of thin client tech-nologies has helped to increase the functional longevity of computer labs in comparison to conventional technology and that its increased economy in the use of energy enables longer hours of access. These assertions have never been empirically investigated until now. This article is now available on the project website and will be further disseminated through part-partner websites.
Performance Indicator 5: 3 PWGs meet mini-mum performance standards.
In September 2013, Component 1 personnel conducted the annual assessment of Provin-cial Working Groups in each of the three provinces to determine performance in the following areas:
1. Understanding and Performance of Roles and Responsibilities
2. Programming Knowledge 3. Program Ownership & Sustainability
A total of 18 PWG members were interviewed for this purpose including six from each province. All PWGs achieved a minimum score or better for performance parameter, thereby achieving the indicator. The overall average score across all three provinces was 84% (see Table 3.5a). However, scores for Program Ownership and Sustainability were among the weaker scores when compared to other competency areas. Nevertheless, scores have improved in comparison to previ-ous years by 1 to 6% in the different provinces with Kratie demonstrating the greatest increase (Table 3.5b)
Table 3.5a: PWG Performance Scores by Competency Area, Year 4
Province Knowledge of Programming
Role and Re-sponsibility
Program Ownership & Sustainability
Average Score
Kampong Cham 97% 91% 69% 86% Kratie 93% 81% 71% 82% Siem Reap 87% 91% 79% 86% Average Score 92% 88% 73% 84% Note: >50% indicates Needs Improvement; 50-64% indicates Minimum Standard; 65% or greater indicates Very Good Performance.
Table 3.5b: Change in PWG Assessment Scores by Province, Years 3 and 4 Province Year 3 Results (2012) Year 4 Results (2013) Increase
Kampong Cham 82% 86% 4% Kratie 76% 82% 6% Siem Reap 85% 86% 1%
Valida ng the Effec veness of
Thin Client Labs to Improve ICT
Access in Rural School
Evidence-based
Development
Paper #4
World Education, Inc. &
Kampuchean Action for Primary Education
ABSTRACT
The present study used a Descrip ve Study Design to validate frequent observa ons that Thin
Client technology can increase the func onal longevity of computer labs in Cambodian public
schools when compared to labs that sue more conven onal technology (i.e., CPUs). The study
also examined other research ques ons including differences in maintenance, frequency of lab
usage, energy costs, and stakeholder percep ons of the key challenges in managing a computer
lab. The study sample was small (N=22) with similar numbers of labs using Thin Client and Con-‐
ven onal technology used as the basis for comparison. In spite a number of methodological
problems stemming from the difficulty of comparing labs with different melines of establish-‐
ment as well as the small sample size, the current study has been able to give some tenta ve
evidence that Thin Client technology does indeed enable greater func onal longevity of labs,
lower rates of equipment loss due to mechanical failure, and lower energy costs than is the case
in labs that use standard CPUs. Even in cases where Conven onal Computer Labs had managed
to stay in opera on a er two or three years, their level of efficiency as measured by rates of
usage were lower, due mainly to the high energy costs associated with running the labs every-‐
day.
Improved basic education in Cambodia project (IBEC)
2013
IBEC Annual Report – Year 4
15
3.2 Component 2: Intermediate Result 1.1 for More Equitable School Access Intermediate Result 1.1: Increased Enrolment, retention, promotion, and completion rates of youth from underserved populations (including marginalized girls/boys, poor, ethnic and religious minori-ties, and handicapped children.
Component Overview: This component focuses on a wide range of activities to promote sustained enrolment by all children as well as transition from primary to secondary school. These activities include scholarships at all lev-els, children’s councils through which to mobilize children, infrastructure upgrading to enhance edu-cational supply, water and sanitation facilities in schools, outreach to vulnerable groups such as mi-norities and the disabled through child-to-child help networks, and others. The Component is broken into two subcomponents. One of these focuses on scholarships for children in primary and secondary school as well as candidates studying at Provincial Teacher Training Colleges who return to their communes of origin to address teacher shortages there. The other subcomponent focuses on discre-tionary stakeholder-driven grants that are largely programmed by stakeholders themselves. Schools program their grants through school improvement plans based on local needs assessments and then choose activities that best address these needs, thereby promoting increased ownership of the inter-vention. Because schools that completed a three-year development cycle in Year 3 no longer receive direct grants from the project, these grants were limited to Cycle 2 schools during Year 4 implementa-tion. Cycle 1 schools, however, focused on sustainability planning and a shift in support from Com-mune Councils, as part of the project’s exit strategy. There are over 24 performance indicators associ-ated with this component, giving broad scope to the goal of promoting access to target schools.
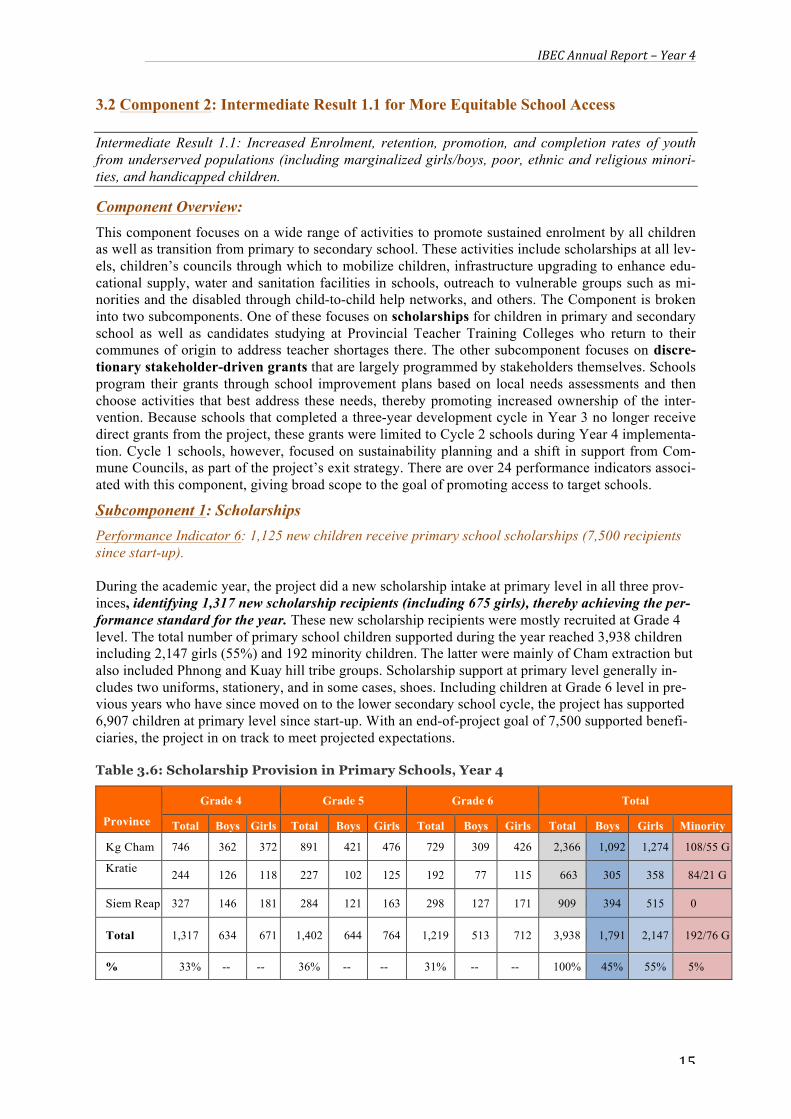
Subcomponent 1: Scholarships Performance Indicator 6: 1,125 new children receive primary school scholarships (7,500 recipients since start-up). During the academic year, the project did a new scholarship intake at primary level in all three prov-inces, identifying 1,317 new scholarship recipients (including 675 girls), thereby achieving the per-formance standard for the year. These new scholarship recipients were mostly recruited at Grade 4 level. The total number of primary school children supported during the year reached 3,938 children including 2,147 girls (55%) and 192 minority children. The latter were mainly of Cham extraction but also included Phnong and Kuay hill tribe groups. Scholarship support at primary level generally in-cludes two uniforms, stationery, and in some cases, shoes. Including children at Grade 6 level in pre-vious years who have since moved on to the lower secondary school cycle, the project has supported 6,907 children at primary level since start-up. With an end-of-project goal of 7,500 supported benefi-ciaries, the project in on track to meet projected expectations. Table 3.6: Scholarship Provision in Primary Schools, Year 4
Province
Grade 4 Grade 5 Grade 6 Total
Total Boys Girls Total Boys Girls Total Boys Girls Total Boys Girls Minority
Kg Cham 746 362 372 891 421 476 729 309 426 2,366 1,092 1,274 108/55 G
Kratie
244 126 118 227 102 125 192 77 115 663 305 358 84/21 G
Siem Reap 327 146 181 284 121 163 298 127 171 909 394 515 0
Total 1,317 634 671 1,402 644 764 1,219 513 712 3,938 1,791 2,147 192/76 G
% 33% -- -- 36% -- -- 31% -- -- 100% 45% 55% 5%
IBEC Annual Report – Year 4
16
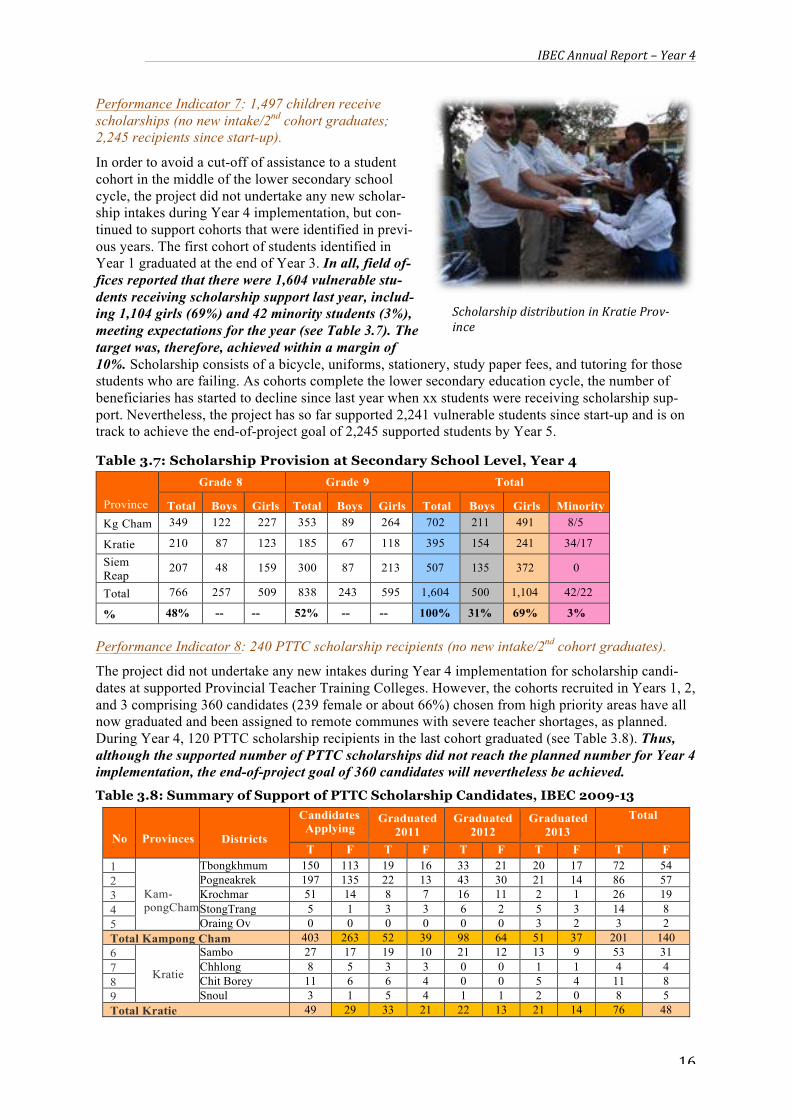
Performance Indicator 7: 1,497 children receive scholarships (no new intake/2nd cohort graduates; 2,245 recipients since start-up). In order to avoid a cut-off of assistance to a student cohort in the middle of the lower secondary school cycle, the project did not undertake any new scholar-ship intakes during Year 4 implementation, but con-tinued to support cohorts that were identified in previ-ous years. The first cohort of students identified in Year 1 graduated at the end of Year 3. In all, field of-fices reported that there were 1,604 vulnerable stu-dents receiving scholarship support last year, includ-ing 1,104 girls (69%) and 42 minority students (3%), meeting expectations for the year (see Table 3.7). The target was, therefore, achieved within a margin of 10%. Scholarship consists of a bicycle, uniforms, stationery, study paper fees, and tutoring for those students who are failing. As cohorts complete the lower secondary education cycle, the number of beneficiaries has started to decline since last year when xx students were receiving scholarship sup-port. Nevertheless, the project has so far supported 2,241 vulnerable students since start-up and is on track to achieve the end-of-project goal of 2,245 supported students by Year 5.
Table 3.7: Scholarship Provision at Secondary School Level, Year 4
Province
Grade 8 Grade 9 Total
Total Boys Girls Total Boys Girls Total Boys Girls Minority Kg Cham 349 122 227 353 89 264 702 211 491 8/5
Kratie 210 87 123 185 67 118 395 154 241 34/17 Siem Reap
Reap
207 48 159 300 87 213 507 135 372 0
Total 766 257 509 838 243 595 1,604 500 1,104 42/22
% 48% -- -- 52% -- -- 100% 31% 69% 3%
Performance Indicator 8: 240 PTTC scholarship recipients (no new intake/2nd cohort graduates).
The project did not undertake any new intakes during Year 4 implementation for scholarship candi-dates at supported Provincial Teacher Training Colleges. However, the cohorts recruited in Years 1, 2, and 3 comprising 360 candidates (239 female or about 66%) chosen from high priority areas have all now graduated and been assigned to remote communes with severe teacher shortages, as planned. During Year 4, 120 PTTC scholarship recipients in the last cohort graduated (see Table 3.8). Thus, although the supported number of PTTC scholarships did not reach the planned number for Year 4 implementation, the end-of-project goal of 360 candidates will nevertheless be achieved. Table 3.8: Summary of Support of PTTC Scholarship Candidates, IBEC 2009-13
No
Provinces
Districts
Candidates Applying
Applying
Graduated 2011
Graduated 2012
Graduated 2013
Total
Female T F T F T F T F T F 1
Kam-pongCham
Tbongkhmum 150 113 19 16 33 21 20 17 72 54 2 Pogneakrek 197 135 22 13 43 30 21 14 86 57 3 Krochmar 51 14 8 7 16 11 2 1 26 19 4 StongTrang 5 1 3 3 6 2 5 3 14 8 5 Oraing Ov 0 0 0 0 0 0 3 2 3 2 Total Kampong Cham 403 263 52 39 98 64 51 37 201 140 6
Kratie
Sambo 27 17 19 10 21 12 13 9 53 31 7 Chhlong 8 5 3 3 0 0 1 1 4 4 8 Chit Borey 11 6 6 4 0 0 5 4 11 8 9 Snoul 3 1 5 4 1 1 2 0 8 5 Total Kratie 49 29 33 21 22 13 21 14 76 48
Scholarship distribution in Kratie Prov-‐ince

IBEC Annual Report – Year 4
17
No
Provinces
Districts
Candidates Applying
Applying
Graduated 2011
Graduated 2012
Graduated 2013
Total
Female T F T F T F T F T F 10
Siem Reap
Varin 230 64 16 12 0 0 27 14 43 26 11 Svay Lear 51 19 6 4 0 0 6 4 12 8 12 Pouk 0 0 4 2 0 0 4 4 8 6 13 Angkor Thom 0 0 8 4 0 0 10 6 18 10 14 Bantay Srie 0 0 1 0 0 0 1 1 2 1 Total Siem Reap 281 83 35 22 0 0 48 29 83 51
Total 733 375 120 82 120 77 120 80 360 239
Performance Indicator 9: At least 70% of scholarship recipients at secondary level are girls, minori-ty, and/or physically challenged. In its efforts to ensure that the most vulnerable groups are targeted as part of its scholarship program-ming, special provisions are put in place to advocate for the selection of girls, minority groups, and/or
Success Story: Srey Ra’s Successful Struggle to Get an Education and Learn Useful Skills
Last year, the family was able to supplement their by receiving a pig from the Schools Helping Families pro-‐gram, that is a part of IBEC’s life skills program. The assistance is part of the project’s scholarship support activity for poor students. Srey Ra learned about raising pigs at school as part of her life skills courses and uses these skills to help her family raise the piglet that they received from the program. They did not get the pig to sell but to raise other pigs. Since last year, the family now owns 11 young pigs, which represents a con-‐siderable asset for the poor family. Srey Ra’s Mother said, “I take care this pig very much, before I used to feed her three times a day, but now I have to do it four times, as she needs to breast-‐feed her babies.”
Although Srey Ra comes from a very poor family, she spends a lot of time to participate in many school activi-‐ties such as being a member of the Student Association, tutoring, and studying English with the monks in the pagoda in her village in the evening. Srey Ra always gets praise from her teachers, as she tries to study hard; recently, she got a commendation letter from her school because of her diligent study, “I received a com-‐mendation for studying Khmer Literature as I am good at it, but for Math and Chemistry I need some extra help,” Srey Ra said. “I wish to finish Grade 12 and I want to continue to study at university. One of my teach-‐ers told me that if I finish university, I will be able to find a good job at a company or bank.” Both her parents also want her to keep studying because she has determination, moreso than her other sisters. They believe that Srey Ra can succeed. Srey Ra’s father thanked USAID for supporting his family because they have no land to farm since selling it to buy medication to treat their HIV but he hopes that if Srey Ra can finish school, the family can depend on her in the future.
Chet Srey Ra is a Grade 8 student studying at Sangkep Lower Secondary School in Batheay District with a scholarship from IBEC. She comes from a family of five including her parents and two sisters. She is the second child in her family and lives with her parents who are suffering from HIV. Both of them are dependent on medicine provided by Cheung Prey District Hospital. Srey Ra’s father earns a living by buying and selling rats and snails that are collected by other villagers from the local rice fields. He keeps them until they are old enough and then sells them on the Vietnamese border. Srey Ra’s mother’s name is Dou Chandy. She earns a living by braiding hammocks from pieces of thick string. She can make one hammock in about two or three days and can sell each one for about $5. She said that, “I take them to the market by myself but sometimes I can ask my neighbors to help sell them for me and some cus-‐tomers also come to buy them at my house.”
Srey Ra and her mother in front of her house in Batheay District, Kam-‐pong Cham

IBEC Annual Report – Year 4
18
the physically challenged. Based on a review of the demographic characteristics of scholarship re-cipients at secondary school level, exactly 70% of the 1,604 vulnerable students receiving scholar-ships fall within one or more of the high priority groupings established, thereby achieving the per-formance indicator (see Table 3.9). This includes two physically challenged boys and 20 minority males as well. Note that the categories overlap so that physically challenged and minority figures only include males only. The number of physically challenged students assisted including girls is four plus 42 minority students including both boys and girls. Table 3.9: Breakdown of Secondary School Scholarship Recipients by Most Vulnerable Group
Province Total Physically
Challenged (Male Only)
Girls Minorities (Male Only)
Total Vulner-able Groups
% of All
Beneficiaries
Kg Cham 702 2 491 3 496 71%
Kratie 395 0 241 17 258 65%
Siem Reap 507 0 372 0 372 73%
Total 1,604 2 1,104 20 1,126 70% Performance Indicator 10: At least 60% of scholarship recipients at primary level are girls, minority, or physically challenged.
Although field offices reported that none of those receiving scholarships at primary level were physi-cally challenged, there were total of 2,263 children falling into one of the three priority groupings, comprising 57% of those receiving scholarship assistance. Thus, the performance target of 60% was achieved within a margin of 10% (see Table 3.10). Once again, priority groupings overlap so that mi-nority children include males only as reported in Table 3.10. In all there were 192 minority children including both boys and girls receiving scholarship assistance across the three provinces or about 5% of the total. These were concentrated mainly in Kampong Cham and Kratie Provinces.
Performance Indicator 11: 65% of Cycle 1 primary schools report a decrease in dropout/ 65% of Cy-cle 2 schools report decrease in dropout. Tracking changes in dropout is one of the key measures of the project’s success. This year, the pro-ject once again achieved this indicator with 65% of all schools reporting dropout levels below base-line. To be sure, Cycle 1 schools outperformed Cycle 2 schools with 70% of the former reporting dropout lower than baseline levels while only 56% of Cycle 2 schools did, mainly due to a drag effect from schools in Siem Reap Province (see Table 3.11). Nevertheless, most schools in Kampong Cham
Table 3.10: Breakdown of Primary School Scholarship Recipients by Most Vulnerable Group
Province Total Physically
Challenged (Male Only)
Girls Minorities (Male Only)
Total Vulnera-ble Groups
% of All
Beneficiaries
Kg Cham 2,366 0 1,274 53 1,327 56% Kratie 663 0 358 63 421 63% Siem Reap 909 0 515 0 515 57% Total 3,938 0 2,147 116 2,263 57%

IBEC Annual Report – Year 4
19
and Kratie reported very good rates of retention with respect to dropout, even though many of them are no longer receiving direct grant support from the project. Table 3.11: Target Primary Schools Reducing Dropout, 2012-13
Province Number of Primary Schools Schools Reporting Decrease % Cycle 1 Cycle 2 Total Cycle 1 Cycle 2 Total Cycle 1 Cycle 2 Total
Kg.Cham 102 8 110 71 6 77 70% 75% 70% Kratie 24 6 30 17 4 21 71% 67% 70% S. Reap -- 52 52 -- 27 27 -- 52% 52% Total 126 66 192 88 37 125 70% 56% 65%
Performance Indicator 12: 60% of Cycle 1 secondary schools report a decrease in dropout/ 60% of Cycle 2 schools report decrease in dropout. The project’s ability to bring dropout levels at target secondary schools to be-low baseline among a majority of schools continued to show disappointing results this year. Only 44% of all schools reported dropout levels below baseline with Cycle 2 schools outper-forming Cycle 1 by a margin of 56% to 42%, thereby missing the stated per-formance standard (see Tale 3.12). It is not clear why dropout levels continued to be so high in many target secondary schools in spite of the significant in-vestments being made there other than that there are major social transfor-mations occurring in Cambodian society relating to migration and factory pene-tration of the countryside. These eco-nomic developments heighten the opportunity costs for students to remain in school because many of them are of working age. The older students are, the higher the opportunity costs. While improve-ments in educational quality certainly increase the attractions of attending school, they cannot out-weigh the economic benefits of entering the workforce prematurely. For example, one large school in Kampong Cham Province (Skon High School) reported that it was hit very hard by the opening of a huge shoe factory employing over 4,000 people about three kilometers away. Table 3.12: Target Secondary Schools Reducing Dropout, 2012-13
Province Number of Secondary Schools Schools Reporting Decrease % Cycle 1 Cycle 2 Total Cycle 1 Cycle 2 Total Cycle 1 Cycle 2 Total Kg.Cham 14 35 49 8 15 23 57% 75% 47% Kratie 5 16 21 0 9 9 0% 67% 43% S. Reap -- 30 30 -- 12 12 --- 52% 40% Total 19 81 100 8 36 44 42% 56% 44%
Performance Indicator 13: 55% of Cohort 2 Scholarship recipients complete Grade 9.
Completion rates among Cohort 2, which enrolled in 2010/11 at Grade 7, exceeded the rates reported for Cohort 1 last year by a significant margin. The completion rate for Cohort 2 was reported to be 85%, greatly exceeding the target of 55% (see Table 3.13). This compares with the completion rate of Cohort 1 last year, which was reported to be 78%. In comparison, the national completion rate for the cohort enrolling at Grade 7 in 2010/11 was only 46.8%, a considerable difference and an indication that students in IBEC-supported schools are performing above the national average. The project based its estimates for this target on national rates plus 10%, which has proven to be a very conservative estimate of improvement based on actual performance.
Competing for Youth: The gate of a massive shoe facto-‐ry in Skon (Kampong Cham) employing 4,000 workers that recently opened
IBEC Annual Report – Year 4
20
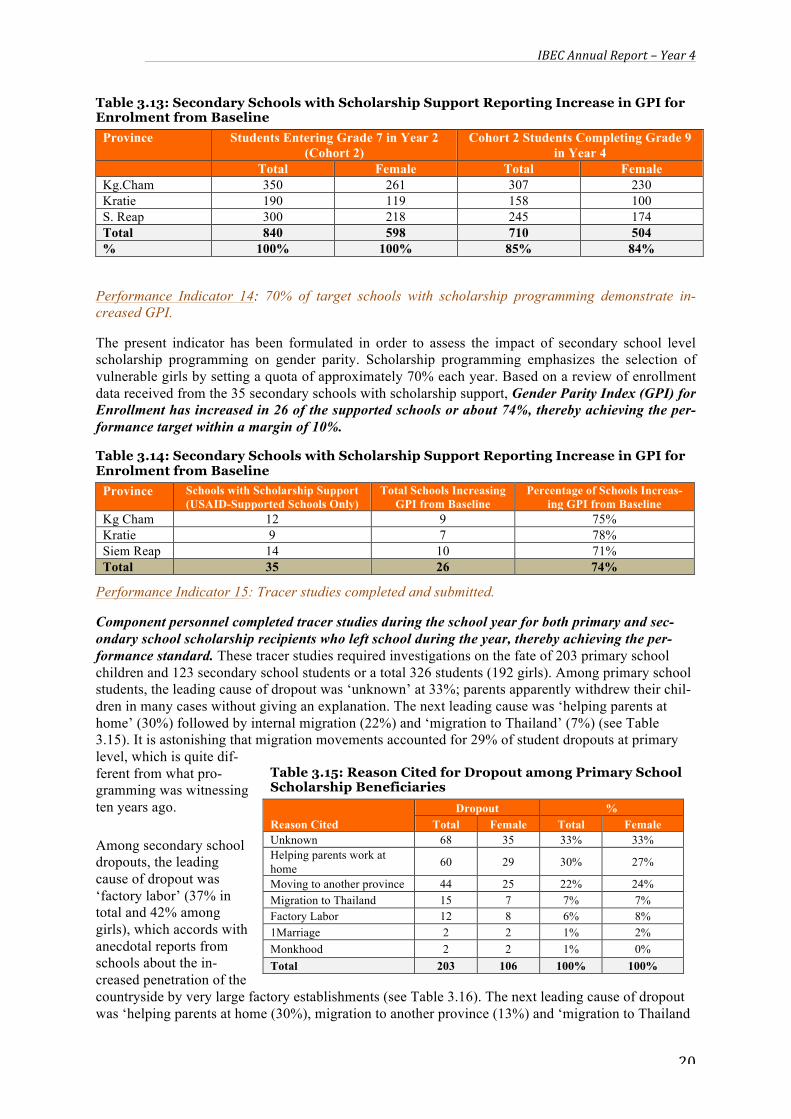
Table 3.13: Secondary Schools with Scholarship Support Reporting Increase in GPI for Enrolment from Baseline
Province Students Entering Grade 7 in Year 2 (Cohort 2)
Cohort 2 Students Completing Grade 9 in Year 4
Total Female Total Female Kg.Cham 350 261 307 230 Kratie 190 119 158 100 S. Reap 300 218 245 174 Total 840 598 710 504 % 100% 100% 85% 84%
Performance Indicator 14: 70% of target schools with scholarship programming demonstrate in-creased GPI.
The present indicator has been formulated in order to assess the impact of secondary school level scholarship programming on gender parity. Scholarship programming emphasizes the selection of vulnerable girls by setting a quota of approximately 70% each year. Based on a review of enrollment data received from the 35 secondary schools with scholarship support, Gender Parity Index (GPI) for Enrollment has increased in 26 of the supported schools or about 74%, thereby achieving the per-formance target within a margin of 10%.
Table 3.14: Secondary Schools with Scholarship Support Reporting Increase in GPI for Enrolment from Baseline
Province Schools with Scholarship Support (USAID-Supported Schools Only)
Total Schools Increasing GPI from Baseline
Percentage of Schools Increas-ing GPI from Baseline
Kg Cham 12 9 75% Kratie 9 7 78% Siem Reap 14 10 71% Total 35 26 74%
Performance Indicator 15: Tracer studies completed and submitted.
Component personnel completed tracer studies during the school year for both primary and sec-ondary school scholarship recipients who left school during the year, thereby achieving the per-formance standard. These tracer studies required investigations on the fate of 203 primary school children and 123 secondary school students or a total 326 students (192 girls). Among primary school students, the leading cause of dropout was ‘unknown’ at 33%; parents apparently withdrew their chil-dren in many cases without giving an explanation. The next leading cause was ‘helping parents at home’ (30%) followed by internal migration (22%) and ‘migration to Thailand’ (7%) (see Table 3.15). It is astonishing that migration movements accounted for 29% of student dropouts at primary level, which is quite dif-ferent from what pro-gramming was witnessing ten years ago.
Among secondary school dropouts, the leading cause of dropout was ‘factory labor’ (37% in total and 42% among girls), which accords with anecdotal reports from schools about the in-creased penetration of the countryside by very large factory establishments (see Table 3.16). The next leading cause of dropout was ‘helping parents at home (30%), migration to another province (13%) and ‘migration to Thailand
Table 3.15: Reason Cited for Dropout among Primary School Scholarship Beneficiaries
Reason Cited Dropout %
Total Female Total Female Unknown 68 35 33% 33% Helping parents work at home 60 29 30% 27%
Moving to another province 44 25 22% 24% Migration to Thailand 15 7 7% 7% Factory Labor 12 8 6% 8% 1Marriage 2 2 1% 2% Monkhood 2 2 1% 0% Total 203 106 100% 100%
IBEC Annual Report – Year 4
21
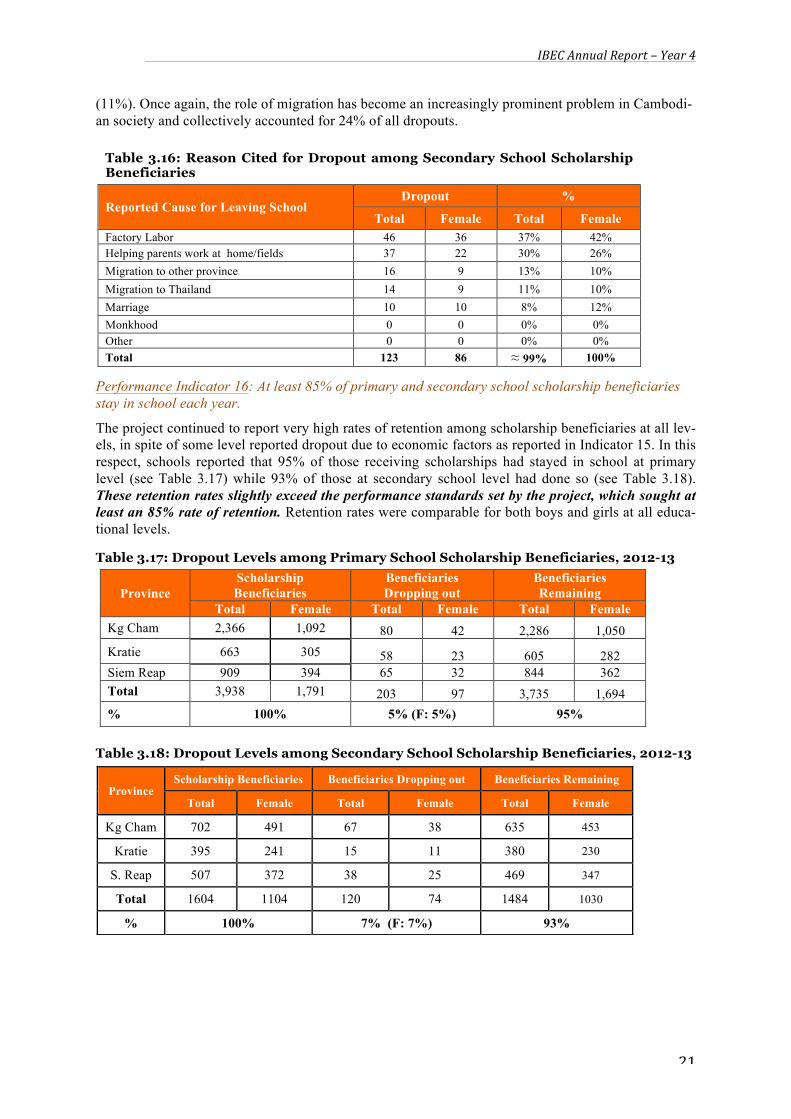
(11%). Once again, the role of migration has become an increasingly prominent problem in Cambodi-an society and collectively accounted for 24% of all dropouts.
Performance Indicator 16: At least 85% of primary and secondary school scholarship beneficiaries stay in school each year.
The project continued to report very high rates of retention among scholarship beneficiaries at all lev-els, in spite of some level reported dropout due to economic factors as reported in Indicator 15. In this respect, schools reported that 95% of those receiving scholarships had stayed in school at primary level (see Table 3.17) while 93% of those at secondary school level had done so (see Table 3.18). These retention rates slightly exceed the performance standards set by the project, which sought at least an 85% rate of retention. Retention rates were comparable for both boys and girls at all educa-tional levels.
Table 3.17: Dropout Levels among Primary School Scholarship Beneficiaries, 2012-13
Province Scholarship Beneficiaries
Beneficiaries Dropping out
Beneficiaries Remaining
Total Female Total Female Total Female Kg Cham 2,366 1,092 80 42 2,286 1,050 Kratie 663 305 58 23 605 282 Siem Reap 909 394 65 32 844 362 Total 3,938 1,791 203 97 3,735 1,694 % 100% 5% (F: 5%) 95%
Table 3.18: Dropout Levels among Secondary School Scholarship Beneficiaries, 2012-13
Table 3.16: Reason Cited for Dropout among Secondary School Scholarship Beneficiaries
Reported Cause for Leaving School Dropout %
Total Female Total Female Factory Labor 46 36 37% 42% Helping parents work at home/fields 37 22 30% 26% Migration to other province 16 9 13% 10% Migration to Thailand 14 9 11% 10% Marriage 10 10 8% 12% Monkhood 0 0 0% 0% Other 0 0 0% 0% Total 123 86 ≈ 99% 100%
Province Scholarship Beneficiaries Beneficiaries Dropping out Beneficiaries Remaining
Total Female Total Female Total Female
Kg Cham 702 491 67 38 635 453
Kratie 395 241 15 11 380 230
S. Reap 507 372 38 25 469 347
Total 1604 1104 120 74 1484 1030
% 100% 7% (F: 7%) 93%

IBEC Annual Report – Year 4
22
Subcomponent 2: Stakeholder-driven Discretionary Grants Performance Indicator 17: 90,879 learners enrolled in primary schools or equivalent non-school based settings (OP Indicator)
This is an Operational Plan indicator. The total number of learners enrolled in primary schools or equivalent was reported to be 81,647 for the year, which is slightly below the lev-els reported in Years 2 and 3 (83,943) but within a margin of 10% of the original target, though just barely (see Table 3.19). Approximately 48% of those enrolled were girls or about the same as last year. Enrollment at primary school level has dropped since Year 1, primarily because of the decision to phase out nine primary schools due to issues of non-performance. Enrolment continues to decline at primary level in urban areas nationwide due to the emer-gence of private schools and the unwillingness of many middle class parents to continue to enroll their children in the state schools, and this is no less true of primary schools in IBEC supported areas. In this respect, it is startling to note that urban NER has declined from 92.2% in 2009 to 83.2% nationally in the most recent year for which data is available.
Table 3.19: Total Primary Enrolment in IBEC Target Schools, 2012-13 Province Boys % Girls % Total
Kg Cham 24,894 52% 22,952 48% 47,846
Kratie 4,929 49% 5,036 51% 9,965
Siem Reap 12,547 53% 11,289 47% 23,836
Total 42,370 52% 39,277 48% 81,647
Performance Indicator 18: 50,478 learners enrolled in secondary school or equivalent non-school settings (OP Indicator)(45,430 students currently enrolled, (23,276 girls)
Enrolment in Year 4 at secondary school level has jumped considerably since Year 3 due to the decision to add 30 additional schools in Prey Veng, Svay Rieng, and Kampong Thom Provinces, which are not part of the project’s original target provinces. This expansion was agreed with USAID as part of assistance being provided to MoEYS to use an incremental process of rolling out the life skills pilot completed in the previous year. Overall, enrolment for the year at secondary school level came in at 56,405 students in comparison to 46,274 stu-dents last year (see Table 3.20). The indicator target was exceeded by a margin of more than 10% due to the explanation provided above.
Table 3.20: Total Secondary School Enrolment in IBEC Target Schools, 2012-13 Province Boys % Girls % Total
Kg. Cham 11,953 50% 12,122 50% 24,075 Kratie 2,985 48% 3,233 52% 6,218 Siem Reap 6,308 47% 6,983 53% 13,291 Subtotal 21,246 49% 22,338 51% 43,584
New Demonstration Areas in New Provinces Svay Rieng 2,622 54% 2,219 46% 4,841 Prey Veng 2,322 52% 2,115 48% 4,437 Kg.Thom 1,745 49% 1,798 51% 3,543 Subtotal 6,689 54% 6,132 46% 12,821
Total 27,935 50% 28,470 50% 56,405 Performance Indicator 19: 30,879 people in new target areas plus 95,579 in earlier target areas (=126,458) people with access to improved drinking water supplies.
Investments in WASH facilities have been a key area of support for IBEC since Year 1. The project completed its investments in Water & Sanitation facilities during Year 4 implementa-tion, adding another 36,937 students to those with improved access to improved drinking wa-ter supplies. The target was exceeded this year by a margin of greater than 10% due to the large size of some of the high schools receiving this support. However, the project has
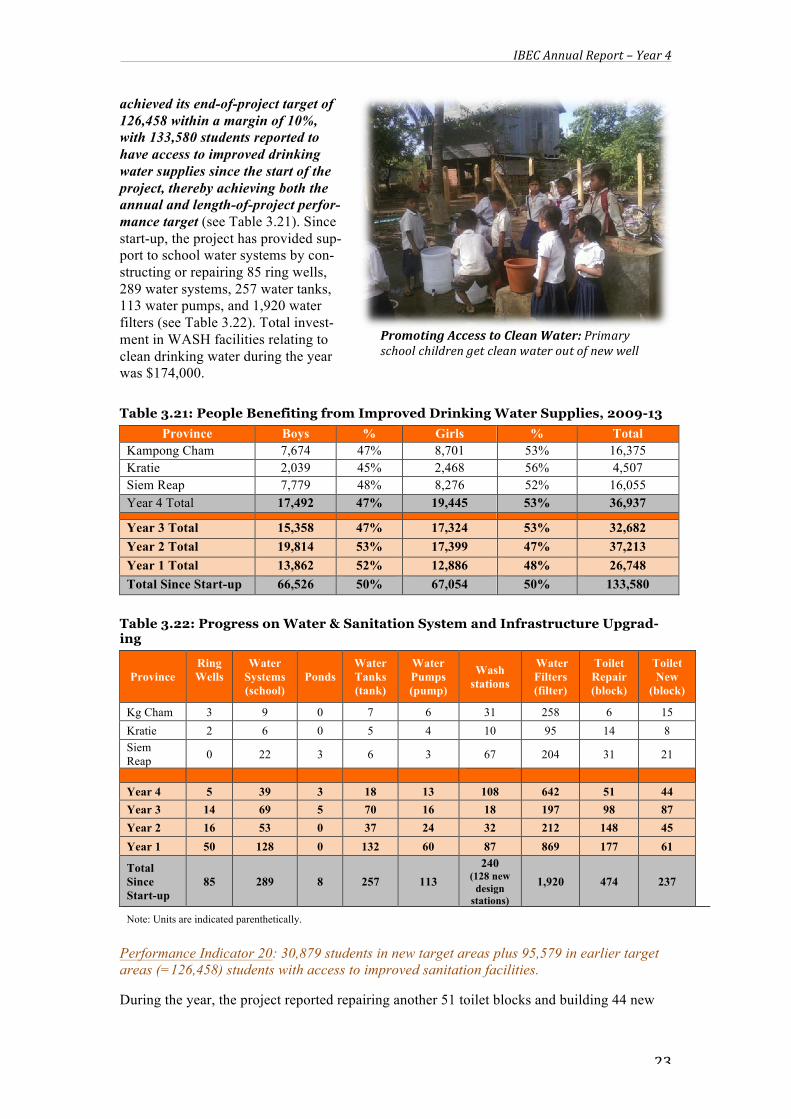
IBEC Annual Report – Year 4
23
achieved its end-of-project target of 126,458 within a margin of 10%, with 133,580 students reported to have access to improved drinking water supplies since the start of the project, thereby achieving both the annual and length-of-project perfor-mance target (see Table 3.21). Since start-up, the project has provided sup-port to school water systems by con-structing or repairing 85 ring wells, 289 water systems, 257 water tanks, 113 water pumps, and 1,920 water filters (see Table 3.22). Total invest-ment in WASH facilities relating to clean drinking water during the year was $174,000. Table 3.21: People Benefiting from Improved Drinking Water Supplies, 2009-13
Province Boys % Girls % Total Kampong Cham 7,674 47% 8,701 53% 16,375 Kratie 2,039 45% 2,468 56% 4,507 Siem Reap 7,779 48% 8,276 52% 16,055 Year 4 Total 17,492 47% 19,445 53% 36,937
Year 3 Total 15,358 47% 17,324 53% 32,682 Year 2 Total 19,814 53% 17,399 47% 37,213 Year 1 Total 13,862 52% 12,886 48% 26,748 Total Since Start-up 66,526 50% 67,054 50% 133,580
Table 3.22: Progress on Water & Sanitation System and Infrastructure Upgrad-ing
Province Ring Wells
Water Systems (school)
Ponds Water Tanks (tank)
Water Pumps (pump)
Wash stations
Water Filters (filter)
Toilet Repair (block)
Toilet New
(block)
Kg Cham 3 9 0 7 6 31 258 6 15 Kratie 2 6 0 5 4 10 95 14 8 Siem Reap 0 22 3 6 3 67 204 31 21
Year 4 5 39 3 18 13 108 642 51 44 Year 3 14 69 5 70 16 18 197 98 87 Year 2 16 53 0 37 24 32 212 148 45 Year 1 50 128 0 132 60 87 869 177 61 Total Since Start-up
85 289 8 257 113 240
(128 new design
stations)
1,920 474 237
Note: Units are indicated parenthetically.
Performance Indicator 20: 30,879 students in new target areas plus 95,579 in earlier target areas (=126,458) students with access to improved sanitation facilities.
During the year, the project reported repairing another 51 toilet blocks and building 44 new
Promoting Access to Clean Water: Primary school children get clean water out of new well
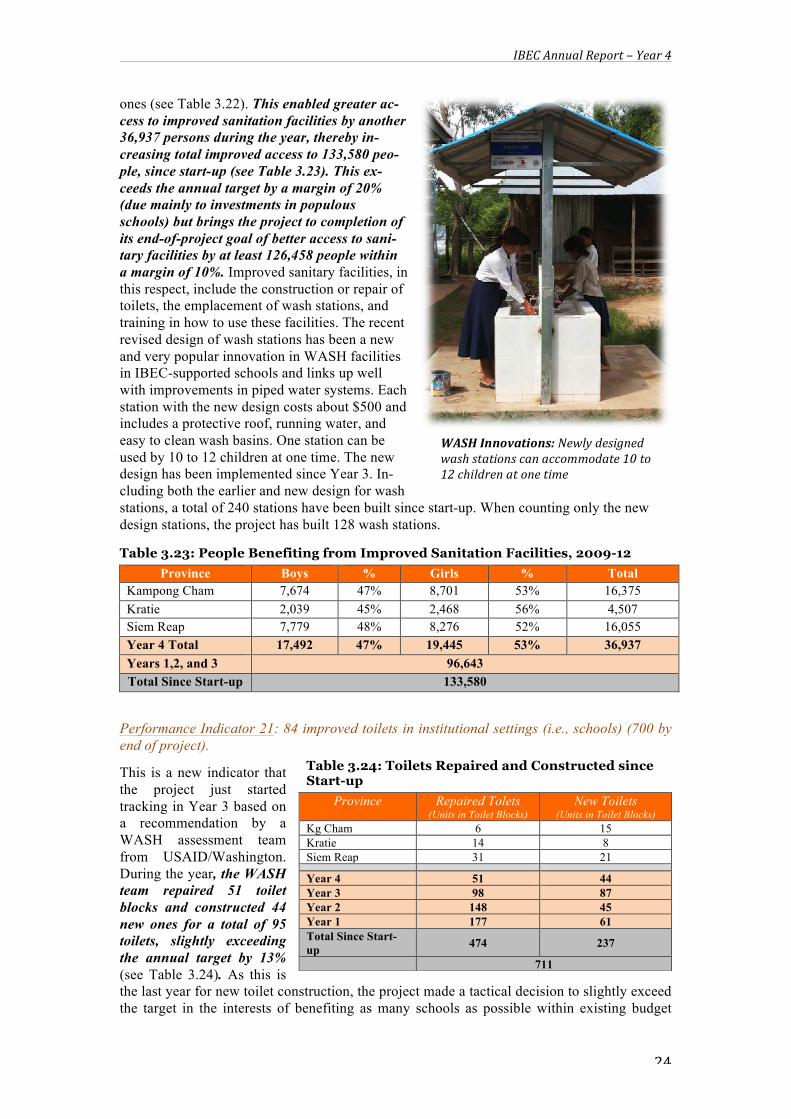
IBEC Annual Report – Year 4
24
ones (see Table 3.22). This enabled greater ac-cess to improved sanitation facilities by another 36,937 persons during the year, thereby in-creasing total improved access to 133,580 peo-ple, since start-up (see Table 3.23). This ex-ceeds the annual target by a margin of 20% (due mainly to investments in populous schools) but brings the project to completion of its end-of-project goal of better access to sani-tary facilities by at least 126,458 people within a margin of 10%. Improved sanitary facilities, in this respect, include the construction or repair of toilets, the emplacement of wash stations, and training in how to use these facilities. The recent revised design of wash stations has been a new and very popular innovation in WASH facilities in IBEC-supported schools and links up well with improvements in piped water systems. Each station with the new design costs about $500 and includes a protective roof, running water, and easy to clean wash basins. One station can be used by 10 to 12 children at one time. The new design has been implemented since Year 3. In-cluding both the earlier and new design for wash stations, a total of 240 stations have been built since start-up. When counting only the new design stations, the project has built 128 wash stations.
Table 3.23: People Benefiting from Improved Sanitation Facilities, 2009-12 Province Boys % Girls % Total
Kampong Cham 7,674 47% 8,701 53% 16,375 Kratie 2,039 45% 2,468 56% 4,507 Siem Reap 7,779 48% 8,276 52% 16,055 Year 4 Total 17,492 47% 19,445 53% 36,937 Years 1,2, and 3 96,643 Total Since Start-up 133,580
Performance Indicator 21: 84 improved toilets in institutional settings (i.e., schools) (700 by end of project).
This is a new indicator that the project just started tracking in Year 3 based on a recommendation by a WASH assessment team from USAID/Washington. During the year, the WASH team repaired 51 toilet blocks and constructed 44 new ones for a total of 95 toilets, slightly exceeding the annual target by 13% (see Table 3.24). As this is the last year for new toilet construction, the project made a tactical decision to slightly exceed the target in the interests of benefiting as many schools as possible within existing budget
Table 3.24: Toilets Repaired and Constructed since Start-up
Province Repaired Tolets (Units in Toilet Blocks)
New Toilets (Units in Toilet Blocks)
Kg Cham 6 15 Kratie 14 8 Siem Reap 31 21
Year 4 51 44 Year 3 98 87 Year 2 148 45 Year 1 177 61 Total Since Start-up 474 237
711
WASH Innovations: Newly designed wash stations can accommodate 10 to 12 children at one time
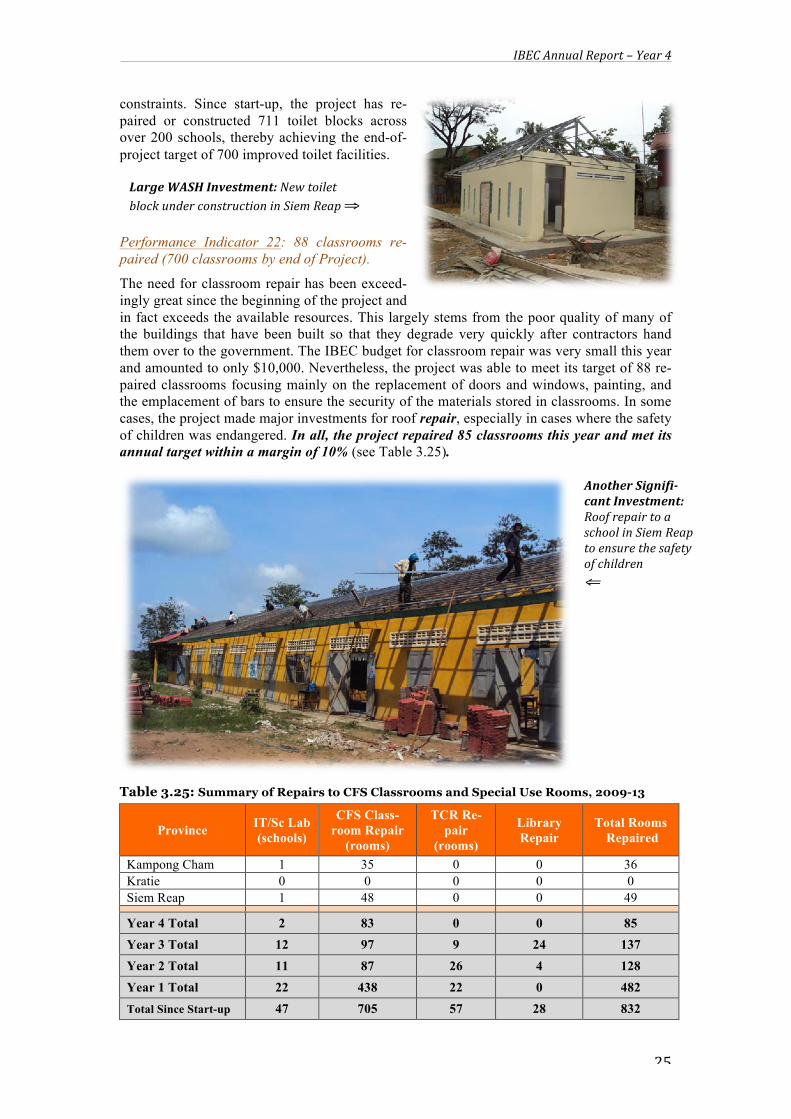
IBEC Annual Report – Year 4
25
constraints. Since start-up, the project has re-paired or constructed 711 toilet blocks across over 200 schools, thereby achieving the end-of-project target of 700 improved toilet facilities.
Performance Indicator 22: 88 classrooms re-paired (700 classrooms by end of Project).
The need for classroom repair has been exceed-ingly great since the beginning of the project and in fact exceeds the available resources. This largely stems from the poor quality of many of the buildings that have been built so that they degrade very quickly after contractors hand them over to the government. The IBEC budget for classroom repair was very small this year and amounted to only $10,000. Nevertheless, the project was able to meet its target of 88 re-paired classrooms focusing mainly on the replacement of doors and windows, painting, and the emplacement of bars to ensure the security of the materials stored in classrooms. In some cases, the project made major investments for roof repair, especially in cases where the safety of children was endangered. In all, the project repaired 85 classrooms this year and met its annual target within a margin of 10% (see Table 3.25).
Table 3.25: Summary of Repairs to CFS Classrooms and Special Use Rooms, 2009-13
Province IT/Sc Lab (schools)
CFS Class-room Repair
(rooms)
TCR Re-pair
(rooms)
Library Repair
Total Rooms Repaired
Kampong Cham 1 35 0 0 36 Kratie 0 0 0 0 0 Siem Reap 1 48 0 0 49
Year 4 Total 2 83 0 0 85 Year 3 Total 12 97 9 24 137 Year 2 Total 11 87 26 4 128 Year 1 Total 22 438 22 0 482 Total Since Start-up 47 705 57 28 832
Large WASH Investment: New toilet block under construction in Siem Reap ⇒
Another Signifi-‐cant Investment: Roof repair to a school in Siem Reap to ensure the safety of children ⇐

IBEC Annual Report – Year 4
26
Performance Indicator 23: 65% of Cycle 1 primary schools report a decrease in repetition/ 55% of Cycle 2 report a decrease in repetition.
The project continued to be suc-cessful in helping schools to keep their rates of grade repetition be-low baseline levels with 59% of all primary schools reporting that repetition rates were lower than before when the project started. In this respect, 63% of Cycle 1 schools or nearly two out of three schools reported that repetition rates were lower than baseline while 50% of Cycle 2 did so, thereby achieving the perfor-mance standard within a margin of 10% (see Table 3.26). Key in-terventions that helped the project to achieve this outcome included village-based remediation, provi-sion of new and innovative learn-ing games produced by the pro-ject’s social enterprise Thonthean Suksa, peer tutoring activities, and a strong focus on im-proved reading.
Table 3.26: Target Primary Schools Reducing Repetition, 2012-13 Province Number of Primary Schools Schools Reporting Decrease %
Cycle 1 Cycle 2 Total Cycle 1 Cycle 2 Total Cycle 1 Cycle 2 Total Kg.Cham 102 8 110 64 4 68 63% 50% 62 Kratie 24 6 30 16 4 20 67% 67% 67 S. Reap -- 52 52 -- 25 25 -- 48% 48 Total 126 66 192 80 33 113 63% 50% 59%
Performance Indicator 24: 65% of Cycle 1 secondary schools report a decrease in repetition/ 50% of Cycle 2 schools report a decrease in repetition.
Outcomes for grade repetition at secondary school level this year greatly exceeded last year’s performance as well as the performance target for Year 4. In this respect, 70% of all second-ary schools reported that repetition rate levels were below baseline (see Table 3.27). In this respect, 84% of Cycle 1 schools were below baseline while 67% of Cycle 2 schools reported being so. The performance standard was, therefore, achieved but by a margin of more than 10%. The project is not sure why repetition levels were so much lower this year but possible explanations may include impacts from ICT access, model libraries, and remedial classes for those with special learning needs.
Table 3.27: Target Secondary Schools Reducing Repetition, 2012-13 Province Number of Secondary Schools Schools Reporting Decrease %
Cycle 1 Cycle 2 Total Cycle 1 Cycle 2 Total Cycle 1 Cycle 2 Total Kg.Cham 14 35 49 11 20 31 79% 57% 63% Kratie 5 16 21 5 11 16 100% 69% 76% S. Reap -- 30 30 -- 23 23 -- 77% 77% Total 19 81 100 16 54 70 84% 67% 70%
Innovations in Reading: Children build a sentence with innovative learning games produced by Thonthe-‐an Suksa to improve promotion rates

IBEC Annual Report – Year 4
27
Performance Indicator 25: At least 73 schools with improved water and sanitation (266 schools by end of project).
The indicator provides an additional means of measurement of WASH investment focusing on the number of schools reached to complement measures of access that focus on the number of people with improved access to WASH facilities. During the year, the project succeeded in making WASH investments in 34 primary schools and 50 secondary schools for a total of 84 schools slightly exceeding the annual performance standard by 15%. Overall, the pro-ject has succeeded in providing WASH facilities to 300 over the life of the project exceeding the end-of-project goal by 13% (see Table 3.28). This number of schools includes several schools, which have been phased out of the project. Once again, the project made a tactical decision to reach as many schools as possible within the available budget.
Performance Indicator 26: All schools /clusters are able to request/liquidate grant funds properly each year.
All Cycle 2 schools and clusters received and liquidated discretionary school grants during the year as planned based on approved school improvement plans submitted. This includes 32 clusters comprising 75 primary schools and 80 secondary schools for a total of 155 schools. Cycle 1 schools received grants from commune governments this year and not from the project this year. In all, schools received $176,953 in grant funding and liquidated $174,702 or about 99% of the total. A small amount of funding ($2,251) was disbursed to schools but not spent and returned to field offices. For more details, see Section 3.
Performance Indicator 27: 75 physically challenged children assisted by the end of year (300 children by the end of the project).
The project achieved both an annual target of referring 75 physically challenged children during the year as well as the end-of-project goal of 300 referrals. In this regard, 75 children (25 girls) were referred to local health care providers and treated during the year. Along with 223 children referred in previous years, the project has now suc-cessfully and treated 298 children for a variety of
Table 3.28: Target Schools with Completed Water & Sanitation Facilities 2010-13
Province Primary Secondary Total Kg.Cham 5 23 28 Kratie 6 7 13 Siem Reap 23 20 43 Year 4 Total 34 50 84 Year 3 Total 45 32 77 Year 2 Total 46 37 83 Year 1 Total 31 25 56 Total Since Start-up 156 146 300
Using the School Network to Promote Health Outreach: A young girl from an IBEC-‐supported school is treated for an ear infection by a local health provider
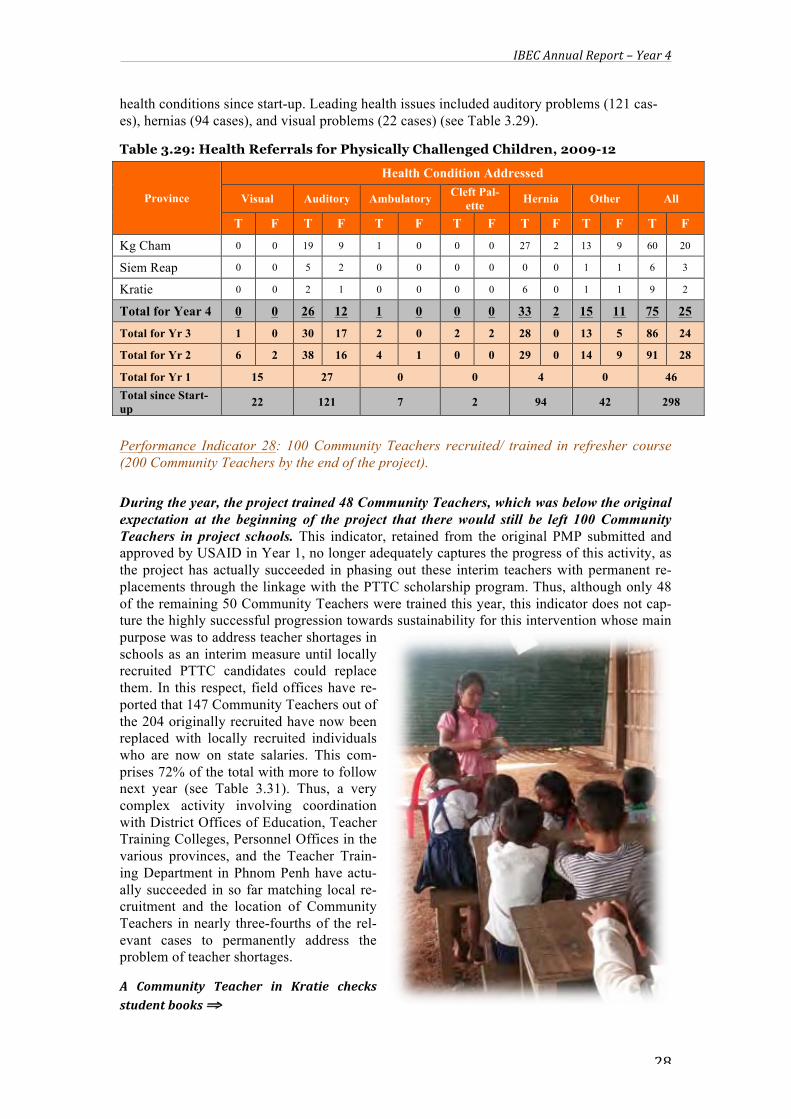
IBEC Annual Report – Year 4
28
health conditions since start-up. Leading health issues included auditory problems (121 cas-es), hernias (94 cases), and visual problems (22 cases) (see Table 3.29).
Table 3.29: Health Referrals for Physically Challenged Children, 2009-12
Province
Health Condition Addressed
Visual Auditory Ambulatory Cleft Pal-ette Hernia Other All
T F T F T F T F T F T F T F
Kg Cham 0 0 19 9 1 0 0 0 27 2 13 9 60 20
Siem Reap 0 0 5 2 0 0 0 0 0 0 1 1 6 3
Kratie 0 0 2 1 0 0 0 0 6 0 1 1 9 2
Total for Year 4 0 0 26 12 1 0 0 0 33 2 15 11 75 25
Total for Yr 3 1 0 30 17 2 0 2 2 28 0 13 5 86 24
Total for Yr 2 6 2 38 16 4 1 0 0 29 0 14 9 91 28
Total for Yr 1 15 27 0 0 4 0 46 Total since Start-up 22 121 7 2 94 42 298
Performance Indicator 28: 100 Community Teachers recruited/ trained in refresher course (200 Community Teachers by the end of the project). During the year, the project trained 48 Community Teachers, which was below the original expectation at the beginning of the project that there would still be left 100 Community Teachers in project schools. This indicator, retained from the original PMP submitted and approved by USAID in Year 1, no longer adequately captures the progress of this activity, as the project has actually succeeded in phasing out these interim teachers with permanent re-placements through the linkage with the PTTC scholarship program. Thus, although only 48 of the remaining 50 Community Teachers were trained this year, this indicator does not cap-ture the highly successful progression towards sustainability for this intervention whose main purpose was to address teacher shortages in schools as an interim measure until locally recruited PTTC candidates could replace them. In this respect, field offices have re-ported that 147 Community Teachers out of the 204 originally recruited have now been replaced with locally recruited individuals who are now on state salaries. This com-prises 72% of the total with more to follow next year (see Table 3.31). Thus, a very complex activity involving coordination with District Offices of Education, Teacher Training Colleges, Personnel Offices in the various provinces, and the Teacher Train-ing Department in Phnom Penh have actu-ally succeeded in so far matching local re-cruitment and the location of Community Teachers in nearly three-fourths of the rel-evant cases to permanently address the problem of teacher shortages.
A Community Teacher in Kratie checks student books ⇒

IBEC Annual Report – Year 4
29
Table 3.30: Changes in the Number of Community Teachers from Year 1 to 4
Province
Trained in refresher
cource (Year 4)
Total Com-munity
Teachers in 2009/10
Community Teach-ers Replaced by
PTTC Graduates to Date
Replacements by PTTC
Candidates as a %
Community Teachers Re-
maining in 2012/13
Kg Cham 23/11 147
Year 1: 33 Year 2: 49 Year 3: 45 Total: 127
86% 25
Kratie 18/12 57
Year 1: 7 Year 2: 4 Year 3: 5 Total: 16
28% 18
Siem Reap 7/6 10 (Started in 2011-12) Year 3: 4 40% 7
Total 48/29 204 147 72% 50
Success Story: An outstanding student at Poes II High School
Cheta at her school doing a project
Cheta is lucky to be studying at Peus II High School, which is also an IBEC-‐supported Beacon School. The school has received an IT lab from the project, a new library, a science lab, and sub-‐ject classrooms. Her school has also received technical assistance to make sure that the school managers can take care of these investments and that the Student Council functions properly. Cheta joins all the activities in her school that are programmed jointly by both faculty and stu-‐dents and supported by school grants from both the project and the government. When she was In Grade 7, Cheta became the manager of the science lab at her school and has since moved into another management role as the vice chairperson of the Student Council, as part of IBEC’s support to student leaders. She joins a lot of activities in her school such as the different subject clubs, project work activities, student council presentations, developing work plans for the council, life skills activities, and taking care of the school environment. She always joins her friends to make her school a creative and interesting place. She is so happy that her school has the resources that it does so that she can make the best of them and learn a lot. The School Director says that Cheta is a ‘model’ student who has really profited from all the investments made by USAID in the school. These inputs have not only helped Cheta but also her friends whom she helps through the peer support networks that the school has also set up teach students about compassion and helping behavior.
Sroeurn Cheta is an outstanding student in Peus II high school in Kampong Cham. She is currently studying in Grade 9 and is the vice chairperson of the Student Council also. She lives in Ampoel Village of Krauch Chmar District, which is located along the Mekong River. Although her parents are both farmers, they really want their daughter to complete school, unlike her other siblings who have all dropped out of school to work or get married. Cheta wants to achieve her vision in the future to be an English teacher. She said she tries to study hard and get the highest grades that she can.

IBEC Annual Report – Year 4
30
3.3 Component 3: Intermediate Result 2.2 for Increased Capacity to Deliver Quality Education Intermediate Result 2.2: Increased capacity of schools to deliver a quality education (USAID-supported)
Component Overview
Following the completion of the development of a course in School Management and Leader-ship Training (SMLTC) during Year 1, Component 3 personnel started implementation of the course through the delivery of four foundational workshops in Years 2 and 3. This was a key capacity building initiative that has been essential to the success of the implementation of IBEC interventions across all components, since effective implementation of interventions requires competent school managers. Between SMLTC workshops, there has been assigned task work that school managers participating in the workshops had to complete as part of the scoring and certification process. In this respect, the SMLTC confers certification to school directors upon satisfactory completion of course work, requiring thoughtful engagement from participants in addition to attendance of workshops. A transcript was developed for each workshop participant that was updated regularly. The completion of the SMLT Course in Year 3 was a milestone event for IBEC. Year 4 saw the implementation of a series of catch-up workshops for school directors who were transferred to target schools after the course had already begun. With the completion of this catch-up course, the Component worked with the Ministry to organize formal certification of school managers and local education administra-tors who had successfully completed the course based on transcript scores. The Component also works with schools to improve their management of information for indicator tracking purposes and provides exposure trips to other schools exemplifying best practices. In addition to the preparations and activities related to strengthening the capacity of school directors, the Component also focuses on strengthening School Support Committees through a process of standardized assessment and training based on perceived needs. These committees help to administer many access-focused interventions in schools, including an outreach program to vulnerable families to apply life skills in practical livelihoods that their children learn at school. Known as Schools Helping Families, this activity was also completed in Year 3.
Performance Indicator 29: 56 Administrators in a catch-up course continue training till end of Year 4 (=602) administrators (OP Indicator).
One of the key challenges for education development projects in Cambodia relates to the con-stant movement of school personnel from school to school. In any given year, the project es-timates that 10 to 15% of school personnel move to different postings, sometimes in different Ministries. This large amount of movement within the system undermines capacity-building activities because there is a continual need to retrain new personnel posted to schools. This was certainly the case for the School Management and Leadership Training Course (SMLTC) that was completed in Year 3 for 553 individuals. Unfortunately, 51 new school managers have been posted to target schools during the implementation of the SMLTC, requiring a
Table 3.31: School Administrators Trained in SMLTC Workshop, Year 4 Province Target Actual Female
School-based Administrators
Kampong Cham 29 27 5 Siem Reap 24 21 3 Kratie 3 3 2 Subtotal 56 51 10
Province & District based Administrators
PoE/DoE Level -- -- -- Grand Total 56 51 10

IBEC Annual Report – Year 4
31
catch-up course for these individuals (see Table 3.31). These 56 individuals suc-cessfully completed the SMLTC catch-up course during the year and were certified for course comple-tion, thereby achieving the annual indicator. It should be noted, however, that the original annual target for this indicator indicated in the MEP was 418 school administrators from Cycle 2 schools. Because the im-plementation of the SMLTC did not start until Year 2, it was decided that Cycle 1 and 2 school directors would be trained together to save time and money; thus, these 418 ad-ministrators were successfully trained in Year 3, requiring a modification in the annual indi-cator in the approved USAID work plan for Year 4 focusing on the catch-up course instead. Performance Indicator 30: 301 Parent Teacher Associations or similar governance structures supported (OP Indicator).
This indicator was based on the sup-port of 301 schools that were identi-fied during project start-up in Year 1. However, because of the early phase-out of nine schools due to non-performance, the project has been supporting the School Support Com-mittees (SSCs) in only 292 schools instead. School Support Committees are considered to be analogous to PTAs in Cambodia. This indicator was, therefore, achieved within a margin of 10% with significant train-ing activities provided to SSCs and other stakeholders during the year. This includes training of 522 individ-uals from various levels including school management, SSCs, and CEFACs on the mechanics of community involvement in education (see Table 3.32). Table 3.32: SSCs & Other Stakeholder Engagement in Technical Support Train-ing Workshops on Community Involvement, Year 4
Province School
Support Committees
Participants School
Directors and SSC
Reps
Fe-male
SSC Chiefs
Fe-male CEFAC Fe-
male Total Fe-male
% Fe-
male
Kg Cham 159 32 3 28 2 9 0 69 5 8% Siem Reap 82 197 17 189 29 35 9 421 55 13% Kratie 51 14 1 13 3 5 3 32 7 2% Total 292 243 21 230 34 49 12 522 67 13%
Milestone Event: The award of SMLTC Certificates by H.E. Nath Bunroeun at a ceremony in Kampong Cham in June 2013
Improving Parental Engagement: Parents attend a meeting at the beginning of the school year in a target school
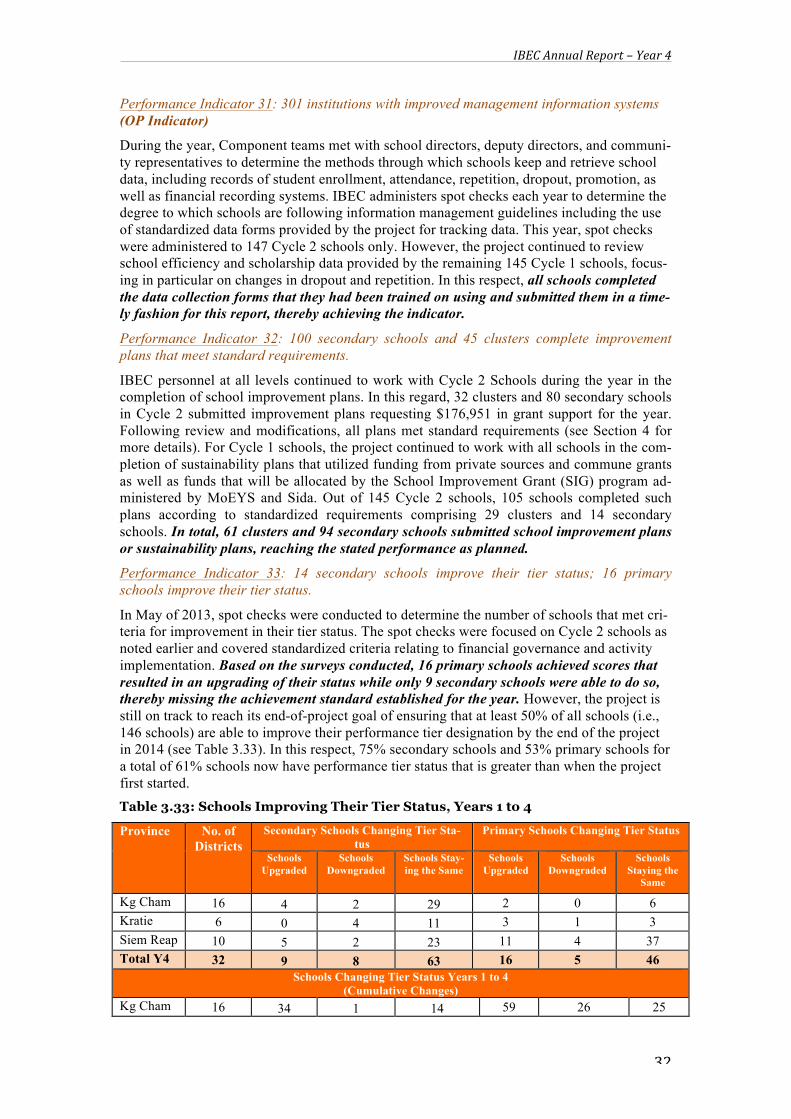
IBEC Annual Report – Year 4
32
Performance Indicator 31: 301 institutions with improved management information systems (OP Indicator)
During the year, Component teams met with school directors, deputy directors, and communi-ty representatives to determine the methods through which schools keep and retrieve school data, including records of student enrollment, attendance, repetition, dropout, promotion, as well as financial recording systems. IBEC administers spot checks each year to determine the degree to which schools are following information management guidelines including the use of standardized data forms provided by the project for tracking data. This year, spot checks were administered to 147 Cycle 2 schools only. However, the project continued to review school efficiency and scholarship data provided by the remaining 145 Cycle 1 schools, focus-ing in particular on changes in dropout and repetition. In this respect, all schools completed the data collection forms that they had been trained on using and submitted them in a time-ly fashion for this report, thereby achieving the indicator.
Performance Indicator 32: 100 secondary schools and 45 clusters complete improvement plans that meet standard requirements.
IBEC personnel at all levels continued to work with Cycle 2 Schools during the year in the completion of school improvement plans. In this regard, 32 clusters and 80 secondary schools in Cycle 2 submitted improvement plans requesting $176,951 in grant support for the year. Following review and modifications, all plans met standard requirements (see Section 4 for more details). For Cycle 1 schools, the project continued to work with all schools in the com-pletion of sustainability plans that utilized funding from private sources and commune grants as well as funds that will be allocated by the School Improvement Grant (SIG) program ad-ministered by MoEYS and Sida. Out of 145 Cycle 2 schools, 105 schools completed such plans according to standardized requirements comprising 29 clusters and 14 secondary schools. In total, 61 clusters and 94 secondary schools submitted school improvement plans or sustainability plans, reaching the stated performance as planned.
Performance Indicator 33: 14 secondary schools improve their tier status; 16 primary schools improve their tier status.
In May of 2013, spot checks were conducted to determine the number of schools that met cri-teria for improvement in their tier status. The spot checks were focused on Cycle 2 schools as noted earlier and covered standardized criteria relating to financial governance and activity implementation. Based on the surveys conducted, 16 primary schools achieved scores that resulted in an upgrading of their status while only 9 secondary schools were able to do so, thereby missing the achievement standard established for the year. However, the project is still on track to reach its end-of-project goal of ensuring that at least 50% of all schools (i.e., 146 schools) are able to improve their performance tier designation by the end of the project in 2014 (see Table 3.33). In this respect, 75% secondary schools and 53% primary schools for a total of 61% schools now have performance tier status that is greater than when the project first started. Table 3.33: Schools Improving Their Tier Status, Years 1 to 4
Province No. of Districts
Secondary Schools Changing Tier Sta-tus
Primary Schools Changing Tier Status
Schools Upgraded
Schools Downgraded
Schools Stay-ing the Same
Schools Upgraded
Schools Downgraded
Schools Staying the
Same
Kg Cham 16 4 2 29 2 0 6 Kratie 6 0 4 11 3 1 3 Siem Reap 10 5 2 23 11 4 37 Total Y4 32 9 8 63 16 5 46
Schools Changing Tier Status Years 1 to 4 (Cumulative Changes)
Kg Cham 16 34 1 14 59 26 25

IBEC Annual Report – Year 4
33
Kratie 6 16 1 4 16 10 4 Siem Reap 10 25 1 4 27 10 15 Total 32 75 3 22 102 46 44 % -- 75% 3% 22% 53% 24% 23% Total Schools Upgraded 61% Performance Indicator 34: At least 80% of assisted school support committees in Cycle 2 meet criteria for effectiveness based on a standard tool.
The Component has continued to provide technical assistance to communes help them achieve a minimum standard. These standards pertain to harmony between the actual struc-ture and organization of a committee and the guidelines provided by the Ministry; participa-tion in school development; and data management, including financial management. This year, Component personnel interviewed SSC Directors/Vice Directors in 145 committees and found that 131 or 90% met a minimum standard or better on a standardized instru-ment, thereby achieving the performance standard for the year (see Table 3.34). Commit-tees in Kampong Cham did best with 95% of sampled committees reporting compliance, fol-lowed by Kratie with 91% and Siem Reap with 88%.
Performance Indicator 35: At least 100 school directors, teachers, and community members visit a different school (600 school directors, teachers, and community members by project’s end).
The development of Beacon Schools plays a large role in organ-izing exposure visits for other schools. Thus, continuous capacity-building support for Beacon Schools continued to be a key activ-ity for the Component, particularly as this intervention assumes greater importance as a key exit strategy in Year 5. Capacity-building activities during the current year focused on how to host visiting schools to best leverage good practices that they have acquired as a result of IBEC inputs. At the same time, visiting schools are trained in how to identi-fy key issues of interest to them be-fore going as well as mapping out follow-up actions upon their return to their own school. During the year, the project organized expo-sure visits for school administra-tors, teachers, and community
Table 3.34: Number of SSCs Improving their Operational Performance
Province Committees
Assessed Committees at Minimum
Standard or Better Improvement as a
% of the Total
Kg. Cham 41 39 95% Siem Reap 82 72 88% Kratie 22 20 91% Total 145 131 90%
Leveraging Good Practice through Beacon Schools: Visitors from Mahaleap High School visit the Demonstration School in Kampong Cham to learn about the organization of science labs. While encountering the same problem as low utilization rates among science labs as other projects, IBEC has been very proactive in increasing usership effective-‐ly.

IBEC Annual Report – Year 4
34
members involving 110 individuals (34 women), thereby meeting the performance standard set for the year (see Table 3.35). Table 3.35: Number of School Administrators, Teachers, and Community Repre-sentatives Participating in Site Exchange Visits
Visit Location Visit Dates Partici-
pants
Sex Lessons Learned/Observations
M F Kg Cham 20-31 May 50 33 17
Child council, Library management, School environment, Latrines usage, Life-skills and classroom decoration.
Kratie 8-21 May 23 18 5
Siem Reap 23 May – 4 June 37 25 12
Total -- 110 76 34
Performance Indicator 36: At least 70% of assisted SSCs in Cycle 1 primary schools and 55% in Cycle 2 schools are exercising accountability for reading proficiency by the end of Year 4 (based on a standardized set of criteria).
This indicator the component team cooperated with DPOs and PCs in Kampong Cham, Kratie and Siem Reap provinces to evaluate the activities of SSCs that were exercising accountabil-ity for reading proficiency. The component team used a standardized assessment form with six parameters that investigated whether (1) the SSC had participated in conducting reading tests at school, (2) SSC had discussed the results of reading accountability with school director for dissemination to the com-munity, (3) the SSC had met parents to discuss progress in their children’s reading at least once a quarter; (4) the SSC had helped follow up the activity of remedial classes at village-level; (5) the SSC sought budget from gener-ous patrons both locally and abroad or other NGOs to buy books or other documents for library; and (6) the SSC had encouraged chil-dren to help their friends in reading at the li-brary or other places.
The Component organized an assessment of 127 primary schools (comprising 95 Cycle 1 schools and 17 Cycle 2 schools). Using the standardized instrument measuring the above cri-teria, it was reported that 117 schools were in compliance with minimum expectations or 92% of assessed schools, thereby meeting and exceeding the performance standard for the year (see Table 3.36).
Table 3.36: Reading Accountability Assessment Results for School Support Committees, Year 4
Province Cycle 1 Schools Results Cycle 2 schools Results All Assisted Schools
Total Schools Assessed
Satis-factory Poor Total Schools
Assessed Satis-
factory Poor Total Assessed Schools
Satis-factory Poor
KgCham 102 77 69 8 8 8 8 0 110 85 77 8
Kratie 23 18 17 1 7 7 7 0 30 25 24 1 S. Reap --- --- --- --- 52 17 16 1 52 17 16 1 Total 125 95 86 9 67 32 31 1 192 127 117 10 % -- 100% 90% 10% -- 100% 97% 3% -- 100% 92% 8%
A parent comes to school to read with her daughter.

IBEC Annual Report – Year 4
35
3.4 Component 4: Intermediate Result 2.1 for Improved Educational Relevance Sub Objective 2: Improved Quality of Basic Education Intermediate Result 2.1: More relevant Lower Secondary Life Skills Curriculum Subcomponent 1 Overview (Workforce Development through Life Skills Education)
The Workforce Development through Life Skills Education Subcomponent has been tasked with developing and implementing a new life skills curriculum that is both consistent with MoEYS policy and educationally relevant to target populations. It is understood that an im-portant reason why students leave school after completing primary school is that secondary education has little relevance for the rural or urban poor. Component personnel also work closely with colleagues in the More Equitable School Access Component to provide life skills education to children in upper primary school as a means to keep children in school and en-hance transition to lower secondary schools. Such interventions reinforce other interventions designed to inhibit dropout such as scholarships, school feeding, and girls’ counseling. A se-cond important task for the sub-component is to provide Teacher Education to those imple-menting the life skills curriculum, in addition to more generalized pedagogical support that fosters child friendly learning environments (Subcomponent 2). During the first year of the project, IBEC achieved several milestones regarding the prepara-tion of a comprehensive life skills framework for lower secondary schools. The technical team succeeded in completing the design of a conceptual Life Skills Framework, Implementa-tion Guidelines, and a Teacher Training Manual in preparation for the pilot in lower second-ary schools during the 2010-11 academic year. IBEC has conducted several consultation workshops with counterparts in the government and among NGOs to better understand life skills education issues. These sessions were very well-attended and resulted in an increased interest and involvement of the Ministry and its partners in life skills-based approaches. Once the proposed approach was endorsed by MoEYS, the project technical team, with support from MoEYS counterparts, developed a detailed plan to prepare for the implementation of the first phase of the pilot in Year 3.. From March through July 2011, the Life Skills team oversaw the development of 19 new Life Skills Manuals and the revision of 11 more that were developed in Year 1. Thus, 30 manuals were completed that provide teachers with step-by-step descriptive instructions on how to teach about any given topic. The manuals were developed to promote cooperative learning style practices and also to incorporate many activities that encourage active learning. Besides the manuals, the team also developed other teaching aids such as posters and student handouts. Finally, the Component developed full color learning slides that will be used by students in all schools to support life skills lessons. These slides include instruction on visual-izing more complex processes, identifying essential elements in lessons, and conducting in-quiry-based activities such as case studies and role plays. With all curriculum development finished, IBEC is looking forward to see how this material will be received by teachers in tar-get schools. Following the successful piloting of the life skills framework and manuals in Year 3, the Component has focused on assisting the Ministry to rollout the framework in more schools on an incremental basis in Year 4. A key element of this strategy has been the identification of Demonstration Sites in new provinces (Kampong Thom, Svay Rieng, and Prey Veng), which can act as a catalyst for incremental expansion to surrounding schools in the future, using the Beacon School approach. A total of 30 Demonstration Sites were identified in these provinces at the beginning of Year 4 and have been implementing life skills curricula based on the pilot completed in Year 3, with modifications based on the lessons learned. At the same time, the Component has been working with the Ministry to approve all 30 manuals to facilitate nation-al adoption. This approval process has taken longer than anticipated, delaying the printing of these manuals with project funds. Nevertheless, the project is hopeful that this process can be

IBEC Annual Report – Year 4
36
completed quickly at the beginning of Year 5. Performance Indicator 37: Number of textbooks and other teaching and learning materials provided (OP Indicator)
⇒ 500 LS curriculum menus printed and distributed ⇒ 12,800 Life Skills Manuals printed and distributed ⇒ 65,000 laminated study slides printed and distributed ⇒ 9,800 Life Skills posters printed and distributed. ⇒ Total: 88,100 items (OP Indicator)
Due to the extended period of time taken by the Textbook Review Council in the MoEYS to review, revise, and approve manuals, it has not been possible to print revised curriculum doc-uments along with posters and learning slides as originally expected. During the year, the Ministry approved 22 man-uals; two manuals were rejected because they relate to raising the political and cultural awareness of youth. Given the results of the re-cent election and the role of youth in its outcome, the MoEYS feels that it is too politically risky to approve such curriculum documents. Thus, there are still six manuals remaining that need to be approved. Given that many agencies have reported waiting for over a year for the Ministry to ap-prove just one manual, the approval of 22 manuals is astonishing; nevertheless, this is not adequate for the project to meet its publishing timetable. Thus, given these difficulties with the Ministry approval process, this performance standard has been postponed to Year 5. The project will continue to advocate with the Consultative Group to ensure that the remaining manuals are approved as quickly as possible. This delay in printing has not affected the rollout in three new provinces, as the project was able to use manuals left over from last year’s printing. In this respect, 7,227 curriculum items were dis-tributed to schools (see Table 3.37). Table 3.37: Life Skills Menus, Teaching and Learning Materials Distributed, Year 4 Province Life
Skills Module
Leaning Slides
Life Skills Posters
Life Skills
Menus
Pocket Cloths
Total
Svay Rieng 59 1760 112 15 10 1,956 Prey Veng 59 2080 111 15 10 2,275 Kg.Thom 66 2,000 200 15 10 2,291 Kg.Cham, Kratie, Siem Reap
-- -- -- 755 -- 755
Total Distributed 184 5,840 423 45 30 7,227
Life Skills Manuals: Revised Life Skills Manuals currently be-‐ing reviewed by the MoEYS Textbook Review Council. Blue manuals focus on Socially Relevant Issues, green indicates Prac-‐tical Livelihoods, and yellow indicates Economic Life Skills.

IBEC Annual Report – Year 4
37
Performance Indicator 38: At least 75% of students express satisfaction with learning envi-ronment /curriculum at LSS in comparison to the baseline.
Using an attitudinal base-line survey tool devel-oped in Year 2, the Com-ponent re-administered its attitudinal survey to the same sample of students chosen at Grade 7 during Year 2. The results of the survey continued to be positive with 83% of the sample ex-pressing satisfaction with their learn-ing environment since the introduction of life skills education activities de-signed to improve educational rele-vance (see Table 3.38). However, the-se results must be qualified by the ob-servation that less than half of the original sample remains from when the survey was first administered in 2011, i.e., at baseline. In this respect, the sample in Year 4 comprised only 64 students out of an original sample of 172 students. It is not clear where the other stu-dents in the original sample have gone though prob-able causes include transfer, dropout, or absenteeism. Thus, those with the least motivation and interest in education have been screened out introducing a large element of bias into the sample. Such phenomena demonstrate the limitations of doing this kind of longitudinal research in Cambodian schools. Never-theless, based on the available data, the perfor-mance has bee n achieved in spite of the limitations of the data.
Performance Indicator 39: 60% of schools demon-strate more relevant education according to a tool designed for the purpose.
IBEC measures educational relevance each year through an assessment tool that reviews the number of educational quality enhancement interventions that a school has implemented. During Year 4 im-plementation, this performance standard was admin-istered to 67 primary schools and 80 secondary schools in Cycle 2 to determine levels of educational relevance. In all, a total of 147 schools were sur-veyed. Quality enhancement activities include life skills activities and eleven other key activities that contribute to educational quality. These interven-tions are summarized in Tables 3.39 and 3.40 below.
Table 3.38: Results of Stakeholder Surveys on Satisfac-tion with Changes in Learning Environments at Their School, Year 4 (N=64)
Province % of Respond-ents Expressing
Satisfaction (Baseline)
% of Respondents Ex-pressing Satisfaction
(2012/13)
Total Respondents
Kg.Cham 35% 71% 31 Siem Reap 52% 94% 33
Total 44% 83% 64
The Quest for Quality and Rele-‐vance: IBEC has made many im-‐provements in school settings includ-‐ing Model Libraries (above) and Life Skills such as bicycle repair classes (below)
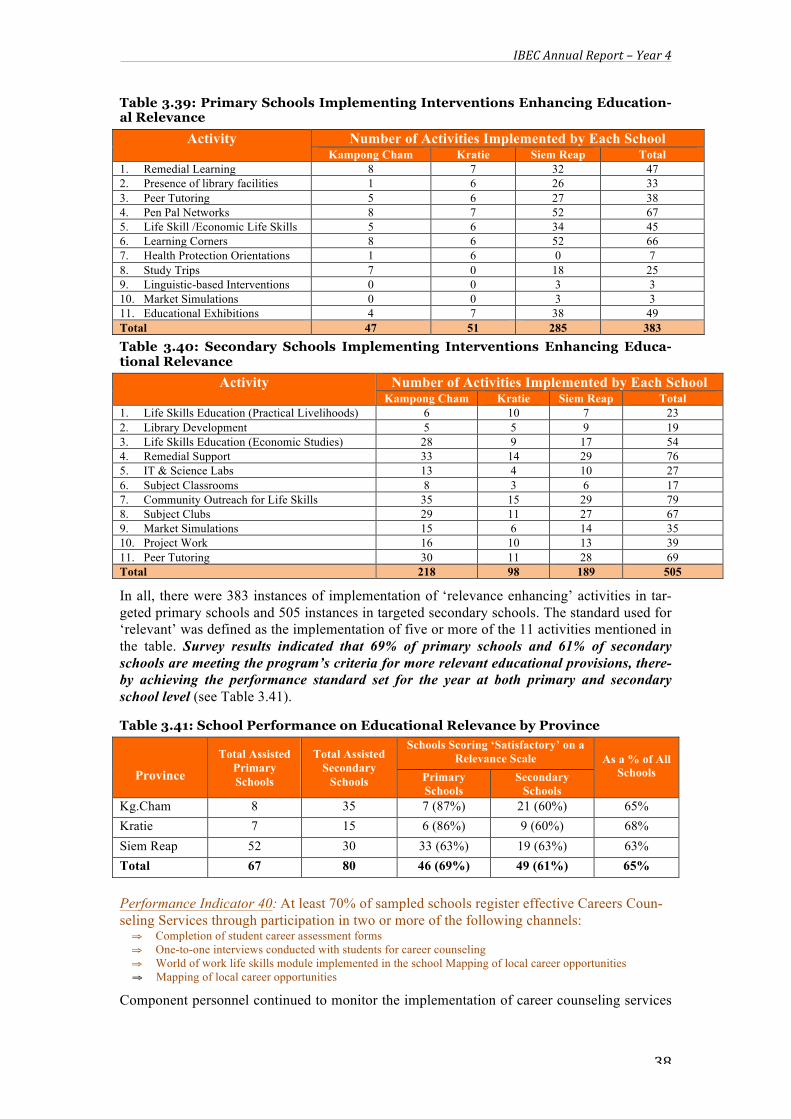
IBEC Annual Report – Year 4
38
Table 3.39: Primary Schools Implementing Interventions Enhancing Education-al Relevance
Activity Number of Activities Implemented by Each School Kampong Cham Kratie Siem Reap Total
1. Remedial Learning 8 7 32 47 2. Presence of library facilities 1 6 26 33 3. Peer Tutoring 5 6 27 38 4. Pen Pal Networks 8 7 52 67 5. Life Skill /Economic Life Skills 5 6 34 45 6. Learning Corners 8 6 52 66 7. Health Protection Orientations 1 6 0 7 8. Study Trips 7 0 18 25 9. Linguistic-based Interventions 0 0 3 3 10. Market Simulations 0 0 3 3 11. Educational Exhibitions 4 7 38 49 Total 47 51 285 383 Table 3.40: Secondary Schools Implementing Interventions Enhancing Educa-tional Relevance
Activity Number of Activities Implemented by Each School Kampong Cham Kratie Siem Reap Total
1. Life Skills Education (Practical Livelihoods) 6 10 7 23 2. Library Development 5 5 9 19 3. Life Skills Education (Economic Studies) 28 9 17 54 4. Remedial Support 33 14 29 76 5. IT & Science Labs 13 4 10 27 6. Subject Classrooms 8 3 6 17 7. Community Outreach for Life Skills 35 15 29 79 8. Subject Clubs 29 11 27 67 9. Market Simulations 15 6 14 35 10. Project Work 16 10 13 39 11. Peer Tutoring 30 11 28 69 Total 218 98 189 505
In all, there were 383 instances of implementation of ‘relevance enhancing’ activities in tar-geted primary schools and 505 instances in targeted secondary schools. The standard used for ‘relevant’ was defined as the implementation of five or more of the 11 activities mentioned in the table. Survey results indicated that 69% of primary schools and 61% of secondary schools are meeting the program’s criteria for more relevant educational provisions, there-by achieving the performance standard set for the year at both primary and secondary school level (see Table 3.41).
Table 3.41: School Performance on Educational Relevance by Province
Province
Total Assisted Primary Schools
Total Assisted Secondary
Schools
Schools Scoring ‘Satisfactory’ on a Relevance Scale As a % of All
Schools Primary Schools
Secondary Schools
Kg.Cham 8 35 7 (87%) 21 (60%) 65% Kratie 7 15 6 (86%) 9 (60%) 68% Siem Reap 52 30 33 (63%) 19 (63%) 63% Total 67 80 46 (69%) 49 (61%) 65% Performance Indicator 40: At least 70% of sampled schools register effective Careers Coun-seling Services through participation in two or more of the following channels: ⇒ Completion of student career assessment forms ⇒ One-to-one interviews conducted with students for career counseling ⇒ World of work life skills module implemented in the school Mapping of local career opportunities ⇒ Mapping of local career opportunities
Component personnel continued to monitor the implementation of career counseling services
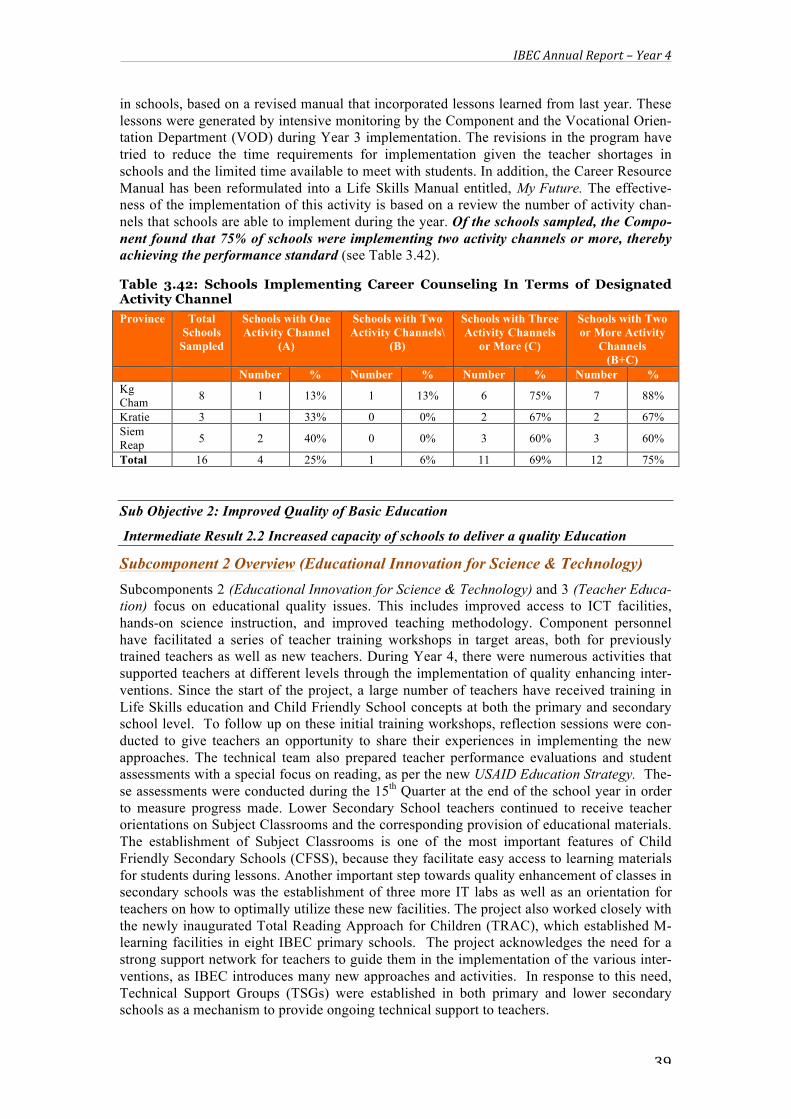
IBEC Annual Report – Year 4
39
in schools, based on a revised manual that incorporated lessons learned from last year. These lessons were generated by intensive monitoring by the Component and the Vocational Orien-tation Department (VOD) during Year 3 implementation. The revisions in the program have tried to reduce the time requirements for implementation given the teacher shortages in schools and the limited time available to meet with students. In addition, the Career Resource Manual has been reformulated into a Life Skills Manual entitled, My Future. The effective-ness of the implementation of this activity is based on a review the number of activity chan-nels that schools are able to implement during the year. Of the schools sampled, the Compo-nent found that 75% of schools were implementing two activity channels or more, thereby achieving the performance standard (see Table 3.42).
Table 3.42: Schools Implementing Career Counseling In Terms of Designated Activity Channel Province Total
Schools Sampled
Schools with One Activity Channel
(A)
Schools with Two Activity Channels\
(B)
Schools with Three Activity Channels
or More (C)
Schools with Two or More Activity
Channels (B+C)
Number % Number % Number % Number % Kg Cham 8 1 13% 1 13% 6 75% 7 88%
Kratie 3 1 33% 0 0% 2 67% 2 67% Siem Reap 5 2 40% 0 0% 3 60% 3 60%
Total 16 4 25% 1 6% 11 69% 12 75%
Sub Objective 2: Improved Quality of Basic Education
Intermediate Result 2.2 Increased capacity of schools to deliver a quality Education
Subcomponent 2 Overview (Educational Innovation for Science & Technology) Subcomponents 2 (Educational Innovation for Science & Technology) and 3 (Teacher Educa-tion) focus on educational quality issues. This includes improved access to ICT facilities, hands-on science instruction, and improved teaching methodology. Component personnel have facilitated a series of teacher training workshops in target areas, both for previously trained teachers as well as new teachers. During Year 4, there were numerous activities that supported teachers at different levels through the implementation of quality enhancing inter-ventions. Since the start of the project, a large number of teachers have received training in Life Skills education and Child Friendly School concepts at both the primary and secondary school level. To follow up on these initial training workshops, reflection sessions were con-ducted to give teachers an opportunity to share their experiences in implementing the new approaches. The technical team also prepared teacher performance evaluations and student assessments with a special focus on reading, as per the new USAID Education Strategy. The-se assessments were conducted during the 15th Quarter at the end of the school year in order to measure progress made. Lower Secondary School teachers continued to receive teacher orientations on Subject Classrooms and the corresponding provision of educational materials. The establishment of Subject Classrooms is one of the most important features of Child Friendly Secondary Schools (CFSS), because they facilitate easy access to learning materials for students during lessons. Another important step towards quality enhancement of classes in secondary schools was the establishment of three more IT labs as well as an orientation for teachers on how to optimally utilize these new facilities. The project also worked closely with the newly inaugurated Total Reading Approach for Children (TRAC), which established M-learning facilities in eight IBEC primary schools. The project acknowledges the need for a strong support network for teachers to guide them in the implementation of the various inter-ventions, as IBEC introduces many new approaches and activities. In response to this need, Technical Support Groups (TSGs) were established in both primary and lower secondary schools as a mechanism to provide ongoing technical support to teachers.

IBEC Annual Report – Year 4
40
Performance Indicator 41: 3 new IT labs constructed in Year 4 (26 labs by end of project).
Due to a last minute change requiring a diversion of funds from IT Grant funds to a grant to VSO for English-language instruction, the project was only able to complete two out of the three planned labs during the year, thereby causing the project to miss the projected performance standard of three labs. Nevertheless, the project is still on track to have completed at least 25 labs by the end of the project and will, therefore, achieve the end-of-project goal within a margin of 10%. These labs comprise 372 workstations and provide ICT access to a total of 31,711 students (16,043 girls) (see Table 3.43). The project is also discussing the possibility with USAID of allowing the construction of a 26th lab in Year 5, pending the availability of funds.
Table 3.43: Lab Establishment in IBEC, Year 4
Province Proposed Labs
Labs Com-pleted
Assigned Com-puter Teachers
Estimated Stu-dent Beneficiaries
Work Stations on Line Total Female Total Female
Kampong Cham 1 1 2 1 686 330 13 Siem Reap 1 1 3 0 350 197 13 Labs Supported by USAID (Y4) 2 2 5 1 1,036 527 26
Total for Year 4 3 2 5 1 1,036 527 26 Total for Year 3 8 8 22 6 10,892 5,675 129* Total for Year 2 7* 7* 29 5 8,368 4,092 113 Total for Year 1 8 8 28 13 11,505 5,749 104 Total Since IBEC Start-up 26 25 84 25 31,711 16,043 372
* Includes two labs constructed with cost share funds from the Oaktree Foundation. When including labs completed under the Schools for Life Project, IBEC’s predecessor upon which much of current programming is based, USAID will have supported the construction of 36 computer labs across four provinces through the World Ed-KAPE partnership (see Table 3.44). These labs provide services to over 37,000 students, helping them to acquire basic computer literacy skills as well as understanding of how to use computers in their regular subjects. Oth-er projects have also adopted the Thin Client Lab model first developed under Schools for Life including Creative As-sociates (108 labs), Asian Development Bank (12 labs), Plan International (2 labs), Oak Tree Foundation (2 labs), Save the Children Australia (1 lab), Al-catel-Lucent Foundation (1 lab), Vitol Foundation (1 lab), and others who are also considering support. Thus, USAID programming in this area has had a sig-nificant knock-on effect that reaches well beyond IBEC target sites.
Revolutionary Technology: A Thin Client Device, so small it can be clipped to the back of a monitor

IBEC Annual Report – Year 4
41
Table 3.44: Cumulative Lab Establishment in Target Areas (2008-2013)
Province Labs Estab-lished 2008-
13
Labs on line
Assigned Com-puter Teachers
Estimated Stu-dent Beneficiaries
Work Sta-tions on
Line Total Female Total Female Kg.Cham 17 16* 47 19 16,054 8,010 216* Kratie 5 5 15 3 4,683 2,050 61 Siem Reap 11 11 35 7 14,434 7,328 177 Mondulkiri 1 1 1 0 131 42 7 Total Labs Supported by USAID 34 33 98 29 35,302 17,430 461
Labs Supported by Cost Share 2 2 5 3 2,304 1,109 34 Total (USAID & Cost Share) 36 35 103 32 37,606 18,539 495
* Samdech Mer High School was stolen
Performance Indicator 42: At least 90% of schools register satisfactory performance in the operation of IT labs according to a standardized instrument.
At the end of Year 4, the ICT Team conducted general reviews of lab performance along four performance parameters including (i) General Administration, (ii) Curriculum and Teaching (i.e., ICT Integration), (iii) Student Learning, and (iv) Lab Maintenance. A minimum score for compliance was 50% on the standardized tool used for each section. None of the 205 school labs that were assessed scored below an average of 50% indicating that all were in compliance with minimum expectations for performance, thereby achieving the per-formance standard. Mean scores for each performance parameter were also reported indicat-ing relatively high performance across the board though some schools are still challenged by Curriculum & Teaching applications (Lowest Scoring School = 46%) and Student Learning (Lowest Score = 50%) (see Table 3.46). Table 3.45: Schools with ICT Facilities Scoring Satisfactory or Better on a Stand-ardized Assessment Instrument Province Total
Schools Sampled
Schools with Average Score
below 50%
Schools with Average Score 50-
64%
Schools with Average
Score 65% or Over
Total Schools with Satisfac-tory Scores or
Better
%
Kg Cham 9 0 0 9 9 100% Kratie 1 0 0 1 1 100% Siem Reap 10 0 0 10 10 100% Total 20 0 0 20 20 100% Table 3.46: Average Scores for IBEC-supported Labs on a Standardized Assess-ment Tool, Year 4 Parameter General
Administration Curriculum &
Teaching Student
Learning Lab
Maintenance 20 School Assessments (Mean Score) 74% 78% 69% 84%
Lowest Scoring School 67% 46% 50% 67% Highest Scoring School 81% 96% 83% 100% N=20
Performance Indicator 43: At least 90% of students in schools with computer labs indicate that they study IT 1 hour or more each week.
The ICT Team undertook annual attitudinal surveys to assess student access to computer lab facilities and overall attitudes about digital literacy instruction among students during the year. In this respect, the ICT team surveyed 411 students across 20 of the 34 IBEC schools
5 Several of the newest labs were not assessed because they were still being trained on lab organization and utilization.

IBEC Annual Report – Year 4
42
with ICT labs (see Table 3.47). Surveys were administered directly by project staff and comprised self-administered question-naires. Most students reported high access to IT facilities with 98% reporting that they had studied ICT at least 1 hour per week, thereby achieving the stated per-formance standard for the year. About 82% reported that this was the first time that they had ever had the opportunity to study ICT, suggesting that the investments made by the project in these schools was very much worthwhile. Similarly, nearly two-thirds of the students surveyed (60%) indi-cated that the availability of ICT facilities in their school had played a major role in their decision not to dropout. Nevertheless, 17% of students indicated that the depth of their under-standing in ICT was highly limited while about 73% indicated moderate understanding. These results suggest reasonably high levels of efficiency thus far in the administration of ICT ac-cess activities and the desire to empower youth.
Table 3.47: Results of Student Attitudinal survey on IT Access, Impact, & Effi-ciency (Year 4)
Question Response % 1. On average, how many hours per week were you able to
study computer with your teachers? Not at all 2% 1 hour 59% 2 hours 35% 3 hours or more 4%
2. Is this the first time in your life that you have ever had the opportunity to study computer?
Yes 82% No 18%
3. How satisfied were you with the quality of computer instruction that you received during the year?
Very satisfied 65% Moderately satisfied 33% Not very satisfied 2%
4. How would you describe your understanding of what you were taught in your computer class?
Very high Understanding 10% Moderately high understand-ing
73%
Low understanding 17% 5. To what extent did the opportunity to study computer
help to influence your decision to stay in school? A great deal 60% To some degree 24% Not at all 16%
6. Were you asked to pay for using the computer center during the last term?
Yes 9% No 91 %
N=411
Performance Indicator 44: At least 80% of schools register satisfactory performance in the operation of Science Labs according to a standardized instrument.
Since start-up, IBEC has supported 24 science labs (in Beacon Schools) including 14 labs in Kampong Cham, four in Kratie, and six in Siem Riep. The provision of science labs is part of the project’s efforts to actualize USAID Forward themes relating to improved learning among youth in science and technology. IBEC is not the only project to be providing science lab fa-cilities in Cambodia, but its approach has been more pro-active in terms of meeting the chal-lenge of limited school director management and low rates of utilization by teachers reported in many other projects. In this regard, IBEC has produced and implemented hands-on science training sessions for teachers using a specific manual designed for the purpose, enlisted the active support of school directors through the SMLTC training, identified simple materials to carry out experiments (as opposed to sophisticated equipment that often stays in the box in
Empowering Youth through ICT Access: A group of students from Kratie make a PowerPoint Presentation at a National Best Practices Workshop in Phnom Penh
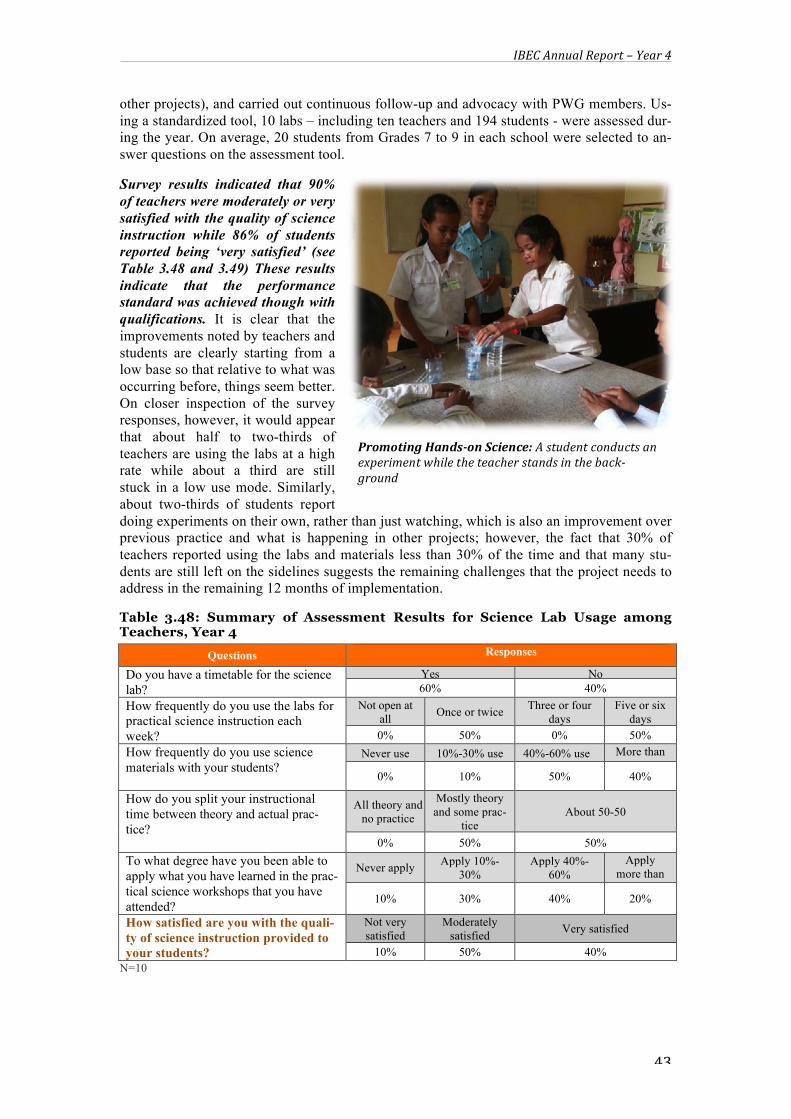
IBEC Annual Report – Year 4
43
other projects), and carried out continuous follow-up and advocacy with PWG members. Us-ing a standardized tool, 10 labs – including ten teachers and 194 students - were assessed dur-ing the year. On average, 20 students from Grades 7 to 9 in each school were selected to an-swer questions on the assessment tool.
Survey results indicated that 90% of teachers were moderately or very satisfied with the quality of science instruction while 86% of students reported being ‘very satisfied’ (see Table 3.48 and 3.49) These results indicate that the performance standard was achieved though with qualifications. It is clear that the improvements noted by teachers and students are clearly starting from a low base so that relative to what was occurring before, things seem better. On closer inspection of the survey responses, however, it would appear that about half to two-thirds of teachers are using the labs at a high rate while about a third are still stuck in a low use mode. Similarly, about two-thirds of students report doing experiments on their own, rather than just watching, which is also an improvement over previous practice and what is happening in other projects; however, the fact that 30% of teachers reported using the labs and materials less than 30% of the time and that many stu-dents are still left on the sidelines suggests the remaining challenges that the project needs to address in the remaining 12 months of implementation.
Table 3.48: Summary of Assessment Results for Science Lab Usage among Teachers, Year 4
Questions Responses
Do you have a timetable for the science lab?
Yes No 60% 40%
How frequently do you use the labs for practical science instruction each week?
Not open at all Once or twice Three or four
days Five or six
days 0% 50% 0% 50%
How frequently do you use science materials with your students?
Never use 10%-30% use 40%-60% use More than 60% use
0% 10% 50% 40%
How do you split your instructional time between theory and actual prac-tice?
All theory and no practice
Mostly theory and some prac-
tice About 50-50
0% 50% 50% To what degree have you been able to apply what you have learned in the prac-tical science workshops that you have attended?
Never apply Apply 10%-30%
Apply 40%-60%
Apply more than
60% 10% 30% 40% 20%
How satisfied are you with the quali-ty of science instruction provided to your students?
Not very satisfied
Moderately satisfied Very satisfied
10% 50% 40% N=10
Promoting Hands-‐on Science: A student conducts an experiment while the teacher stands in the back-‐ground

IBEC Annual Report – Year 4
44
Table 3.49: Summary of Assessment Results for Science Lab Usage (Students) Questions Re-
sponses How frequently did you study science in the lab this year?
Never Once or twice 3-6 times More than 6 times 6% 22% 40% 31%
When you used the lab, did you do experiments directly or just watch the teacher?
Never did Sometimes I did, sometimes I watched Did myself
7% 31% 62% How important is practicing science to you?
Not very important Important Very important 0% 10% 90%
How satisfied are you with the quality of science in-struction provided to you?
Not very satisfied Moderately satisfied Very satisfied
0% 14% 86%
N=194
Performance Indicator 45: At least 90 % of schools with IT facilities demonstrate IT integra-tion in the teaching-learning process through one or more of the following channels:
⇒ Development of news letters ⇒ A majority of trained teachers have developed Power Point Presentations for some selected
lessons ⇒ Subject Clubs use the IT labs for their projects ⇒ Project work activities in progress ⇒ Participation in project club fairs
During Year 4 implementation, IBEC supported 32 secondary schools with IT lab including 16 labs in Kampong.Cham, five in Kratie, and 11 in Siem Reap. These labs include IBEC-supported schools with labs provided under the Schools for Life Project. As part of ICT pro-gramming, the Component supports a number of activities to promote what is known as ICT integration, meaning the use of ICT facilities in other learning besides just acquiring digital literacy. There are five activity channels that the project supports in this regard (see indicator above). Based on school surveys, Component personnel reported a large number of schools doing many of the activities targeted with 97% using PowerPoint to make project presenta-tions and 85% using computers for project work and subject club activities.
o 15% of schools with Newsletter activities o 97% of schools with using power points o 59% of schools with subject clubs o 79% of schools with Project works o 85% of schools with Project work and Clubs fair
Based on these school surveys, this performance standard was readily achieved during the year with 88% of all schools reporting participation in 2-5 activity channels (i.e., teacher development of power point presentations, subject club usage of the labs, etc.) (see Table 3.50). These outcomes indicate that the project has made good progress in terms of moving the role of IT labs beyond one of simply providing digital literacy skills to students (albeit an important function) but also using the lab facilities to promote what is known as ‘IT Integra-tion.’ This refers to the use of the labs to promote more creative and critical thinking.
Table 3.50: Schools with IT Facilities Demonstrate IT integration in the Teaching-Learning Process
Province Schools with One Ac-tivity Only
Schools with 2-5 Activities Total
Kg.Cham 1 17 18 Kratie 2 3 5 Siem Reap 1 10 11 Total 4 30 34
% 12% 88% 100%

IBEC Annual Report – Year 4
45
Subcomponent 3 Overview (Teacher Education)
Performance Indicator 46: 1,000 trained secondary school teachers complete refresher courses in existing life skills modules but within emerging life skills outline.
This target was achieved within a margin of 10%, with 940 secondary school teachers (357 female) trained during the year in workshops on life skills education, student-centered learning, ICT usage, remedial tech-niques, and project work (See Table 3.51).6 These workshops includ-ed teachers trained in new provinces with Life Skills Demonstration Sites (114 teachers). The Life Skills technical team and MoEYS staff facilitated various orientations on the Local Life Skills Pilot Program (LLSP) for key stakeholders at the pro-vincial, district, and school levels. Workshops covered such topics as mind mapping, cooperative learning princi-ples, community engagement, as well as content-specific discussion of particular life skills topics.
Performance Indicator 47: At least 70% of teachers are able to use the Life Skills Cur-riculum Menu effectively in Cycle 1 and 2 schools.
Using a standardized assessment tool devel-oped by the IBEC life skills team to observe classroom practices during life skills instruc-tion, Component personnel, PWG members, and MoEYS staff cooperated to assess 574 (207 females) life skills trained teachers. The assessment primarily focused on Class-room Preparation, Teaching Methodology, and Student Learning activities. Using a statistically randomized sample comprising 106 teachers in all six provinces, or 18% of the total number of life skills teachers trained, the assessment found that 85 teachers or 80% of those observed achieved a score of ‘satisfactory’ or better, thereby exceeding the minimum performance standard of 70% (see Table 3.52). The best 6 Includes 576 Life Skills Teachers, 194 CFSS Teachers, 30 IT Teachers, 17 Project Work Teachers, 55 Remedia-tion Teachers, and 68 TSGs.
Table 3.51: Number of Teachers Trained in Life Skills Education in Year 4
Province Number of Teacher Trained in Life Skills
Total Female Original Provinces Kg Cham 441 160 Kratie 156 69 Siem Reap 229 107 Subtotal 826 336 Demonstration Site Provinces
Kg.Thom 34 8 Prey Veng 44 9 Svay Rieng 36 4 Subtotal 114 21 Total 940 357
Steady Progress in Teaching Quality: A CFSS teachers facilitates group work in Kampong Cham (above); mushroom cultivation (below)

IBEC Annual Report – Year 4
46
scoring provinces included Kampong Thom (100%), Svay Rieng (95%), and Kampong Cham (75%).
Table 3.52: Assessment Results of Life Skills Teachers in Secondary Schools, Year 4
Province
Number of
Schools
Number of Life Skills Teachers
Teachers Assessed
Teachers Scoring Satis-
factory or Better
% Of Those Ob-
served
Total Female Total Female Total Female Kg Cham 49 275 106 12 4 9 3 75% Kratie 21 64 28 9 1 6 0 67% Siem Reap 30 122 52 31 15 20 11 65% Svay Rieng 10 35 4 19 5 18 5 95% Prey Veng 10 44 9 14 3 11 1 79% Kg.Thom 10 34 8 21 4 21 4 100% Total 130 574 207 106 32 85 24 80%
Performance Indicator 48: At least 75% of students using the new lower secondary life skills curriculum demonstrate satisfactory mastery of competencies in Cycle 1 and 2 schools. One of the problems encountered by Component personnel during the situation analysis pre-ceding the development of the life skills pilot related to teachers’ inability to effectively eval-uate students’ learning. As a result, the project included a clear and simple assessment framework in each life skills manual to provide adequate guidance to teachers when teaching specific topics. In order to determine how well students had learned the recently piloted Life Skills curriculum, the project used a structured assessment framework for evaluating students’ understanding. In this respect, the project tested 1,226 students in 30 randomly selected schools. Students were assessed on their mastery of such Life Skills topics as Drug Abuse Prevention, Safe Migration, Money Management, Saving and Spending, Fish Raising, Frog Raising, and Vegetable Growing. Based on this survey, evaluators found that 75% of the students assessed had achieved a minimum level of subject mastery, thereby achieving the performance standard (See Table 3.53). Table 3.53: Life Skills Student Evaluation in Random Schools 2012/13
Province Schools Students Topics Assessment Result Poor Satisfactory
Kg.Cham 3 203 6 61 (30%) 142 (70%) Siem Reap 5 313 5 57(19%) 246 (81%) Kg. Thom 10 397 6 123 (31%) 274 (69%) Prey Veng 6 133 5 25 (19%) 108 (81%) Svay Rieng 6 190 5 41 (22%) 149 (78%)
Total 30 1,226 6* 25% 75% ¬Number of topics not overlapping; Includes 2 topics in Socially Relevant Themes, 2 topics in Economic Life Skills, and 2 topics in Practical Livelihoods. Performance Indicator 49: 700 trained primary level teachers completed refresher course to promote retention and transition (e.g., community teachers, BCAs, life skill teachers, etc.) This indicator was achieved within a margin of 10%, with a total of 645 primary level teachers (396 female) trained in child friendly teaching and learning methodologies7 (See Table 3.56). The Component delivered two-day refresher workshops this year. The train-
7 Includes 470 CFS teachers, 40 Community Teachers, 124 Reading and Writing Teachers, and 11 BCA.
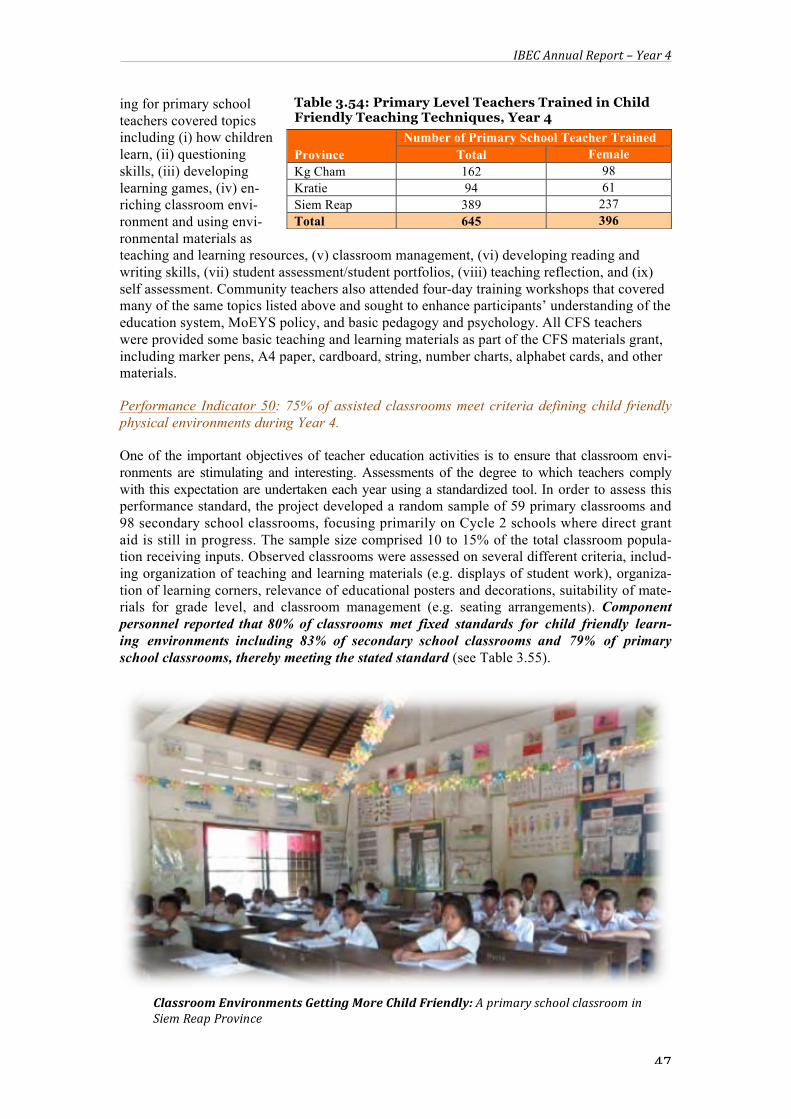
IBEC Annual Report – Year 4
47
ing for primary school teachers covered topics including (i) how children learn, (ii) questioning skills, (iii) developing learning games, (iv) en-riching classroom envi-ronment and using envi-ronmental materials as teaching and learning resources, (v) classroom management, (vi) developing reading and writing skills, (vii) student assessment/student portfolios, (viii) teaching reflection, and (ix) self assessment. Community teachers also attended four-day training workshops that covered many of the same topics listed above and sought to enhance participants’ understanding of the education system, MoEYS policy, and basic pedagogy and psychology. All CFS teachers were provided some basic teaching and learning materials as part of the CFS materials grant, including marker pens, A4 paper, cardboard, string, number charts, alphabet cards, and other materials.
Performance Indicator 50: 75% of assisted classrooms meet criteria defining child friendly physical environments during Year 4.
One of the important objectives of teacher education activities is to ensure that classroom envi-ronments are stimulating and interesting. Assessments of the degree to which teachers comply with this expectation are undertaken each year using a standardized tool. In order to assess this performance standard, the project developed a random sample of 59 primary classrooms and 98 secondary school classrooms, focusing primarily on Cycle 2 schools where direct grant aid is still in progress. The sample size comprised 10 to 15% of the total classroom popula-tion receiving inputs. Observed classrooms were assessed on several different criteria, includ-ing organization of teaching and learning materials (e.g. displays of student work), organiza-tion of learning corners, relevance of educational posters and decorations, suitability of mate-rials for grade level, and classroom management (e.g. seating arrangements). Component personnel reported that 80% of classrooms met fixed standards for child friendly learn-ing environments including 83% of secondary school classrooms and 79% of primary school classrooms, thereby meeting the stated standard (see Table 3.55).
Table 3.54: Primary Level Teachers Trained in Child Friendly Teaching Techniques, Year 4
Province Number of Primary School Teacher Trained
Total Female Kg Cham 162 98 Kratie 94 61 Siem Reap 389 237 Total 645 396
Classroom Environments Getting More Child Friendly: A primary school classroom in Siem Reap Province
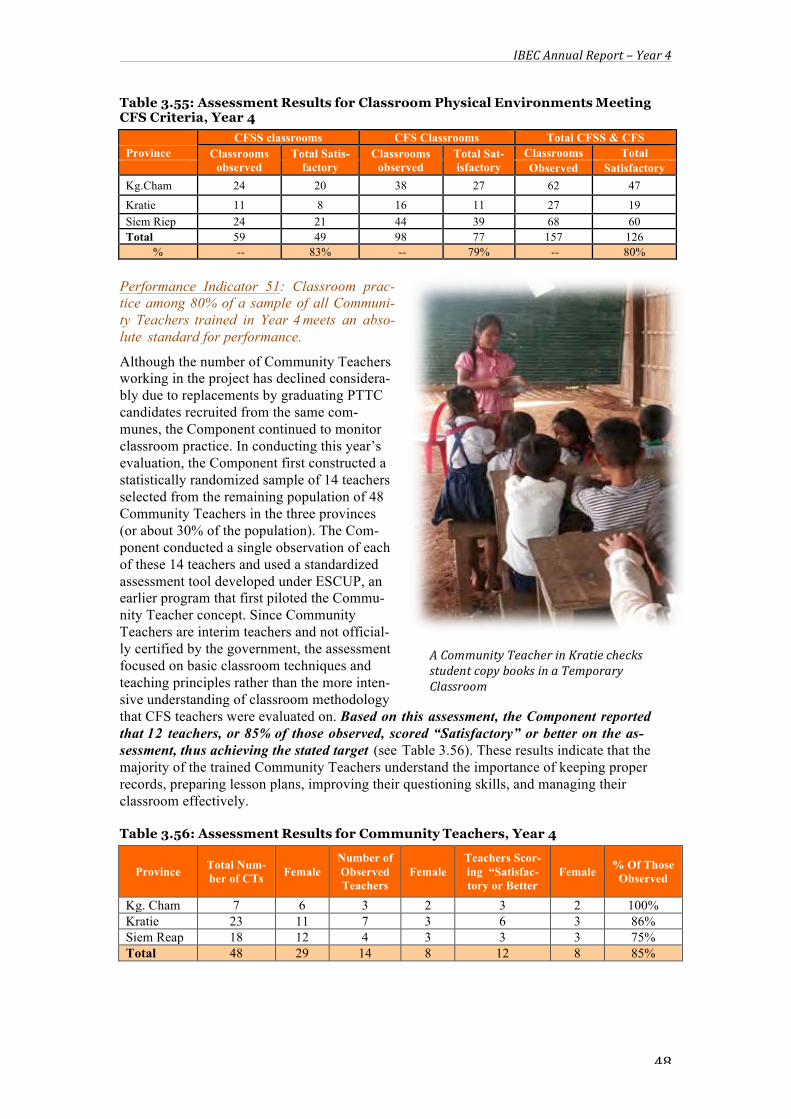
IBEC Annual Report – Year 4
48
Table 3.55: Assessment Results for Classroom Physical Environments Meeting CFS Criteria, Year 4
CFSS classrooms CFS Classrooms Total CFSS & CFS Province Classrooms
observed Total Satis-
factory Classrooms
observed Total Sat-isfactory
Classrooms Total Observed Satisfactory Kg.Cham 24 20 38 27 62 47
Kratie 11 8 16 11 27 19 Siem Riep 24 21 44 39 68 60 Total 59 49 98 77 157 126
% -- 83% -- 79% -- 80% Performance Indicator 51: Classroom prac-tice among 80% of a sample of all Communi-ty Teachers trained in Year 4 meets an abso-lute standard for performance.
Although the number of Community Teachers working in the project has declined considera-bly due to replacements by graduating PTTC candidates recruited from the same com-munes, the Component continued to monitor classroom practice. In conducting this year’s evaluation, the Component first constructed a statistically randomized sample of 14 teachers selected from the remaining population of 48 Community Teachers in the three provinces (or about 30% of the population). The Com-ponent conducted a single observation of each of these 14 teachers and used a standardized assessment tool developed under ESCUP, an earlier program that first piloted the Commu-nity Teacher concept. Since Community Teachers are interim teachers and not official-ly certified by the government, the assessment focused on basic classroom techniques and teaching principles rather than the more inten-sive understanding of classroom methodology that CFS teachers were evaluated on. Based on this assessment, the Component reported that 12 teachers, or 85% of those observed, scored “Satisfactory” or better on the as-sessment, thus achieving the stated target (see Table 3.56). These results indicate that the majority of the trained Community Teachers understand the importance of keeping proper records, preparing lesson plans, improving their questioning skills, and managing their classroom effectively. Table 3.56: Assessment Results for Community Teachers, Year 4
Province Total Num-ber of CTs Female
Number of Observed Teachers
Female Teachers Scor-ing “Satisfac-tory or Better
Female % Of Those Observed
Kg. Cham 7 6 3 2 3 2 100% Kratie 23 11 7 3 6 3 86% Siem Reap 18 12 4 3 3 3 75% Total 48 29 14 8 12 8 85%
A Community Teacher in Kratie checks student copy books in a Temporary Classroom

IBEC Annual Report – Year 4
49
Performance Indicator 52: Classroom practice among 65% of a sample of CFS Experi-mental Classroom Teachers trained in Year 4 becomes more child-centered by the end of the academic year. Because of the constant movement of personnel from school to school, field offices reported that there were now 578 primary school teachers remaining in supported schools who had been trained in CFS teaching methodologies, down from 668 in Year 3. This represents a decline of about 13%. The chal-lenge of teacher movement notwithstanding, the Component continued to monitor the quality of teaching and compliance with principles disseminated in workshops. The assessment re-sults summarized in Table 3.57 are based on a statistically ran-domized sample of 98 teachers comprising about 17% of the teacher population who have been trained in CFS practices. Of those teachers observed, 87 of the 98 teachers (89%) achieved a score of “Satisfac-tory” or better on the assess-ment tool prescribed by MoEYS, thus achieving and exceeding the performance tar-target. The assessment focused primarily on classroom environment (e.g. decorations, materials display, seating arrange-ment, and administrative work) and teaching and learning practices (e.g. lesson plans, ar-ranging learning activities, asking questions, using materials, extension activities, support to students, and general classroom management). Table 3.57: Child Friendly School Practice & Standards for Child-centeredness by Province (Primary Level)
Province Total Num-ber of CFS Teachers
Female Number of Observed Teachers
Female Number of Teach-ers Scoring “Satis-
factory or Better Female
% Of Those Ob-
served Kg cham 143 65 38 26 34 24 89% Kratie 69 45 16 14 13 12 81% Siem Reap 366 215 44 30 40 27 91% Total 578 325 98 70 87 63 89%
Performance Indicator 53: Classroom practice among 65% of a sample of CFSS Classroom Teachers trained in Year 4 becomes more child-centered by the end of the academic year. Following a process similar to that described above for primary schools, Component person-nel also administered a standardized monitoring tool developed by MoEYS to observe class-room practices at secondary level. Using a statistically randomized sample, the assessment evaluated a sample of 59 teachers, or 9% of the total CFSS teacher population of 684 teach-ers, i.e., those that had been trained in CFS teaching methodologies. The sample actually con-tained 10% of the population but there were several absences due to the national elections. Fifty-one of the 59 teachers assessed, or 86%, achieved a score of “Satisfactory” or better
Promoting Innovative Practice: A thoughtful prima-‐ry school teacher uses ‘group writing boards’ to organ-‐ize student group work.

IBEC Annual Report – Year 4
50
thereby exceeding the performance standard (see Table 3.58). The assessment covered the same topics as those for primary level CFS teachers discussed above. Based on these results the Component concluded that a majority of trained teachers were able to apply and demon-strate effective classroom management strategies, utilize a child-centered learning approach, and use appropriate teaching and learning materials. Table 3.58: Child Friendly Secondary School Practice & Standards for Child-centeredness by Province
Province
Total Number of
CFSS Teacher
Female Number of Observed Teachers
Female Teachers Scor-ing “Satisfac-tory or Better
Female % Of Those Observed
Kg cham 350 143 24 11 19 10 79% Kratie 102 45 11 3 9 6 82% Siem Reap 232 120 24 15 23 12 96% Total 684 308 59 29 51 28 86%
Performance Indicator 54: At least 55% of sampled schools register enhanced reading environments through one or more of the follow-ing channels:
⇒ Story book hours in library ⇒ Reading corners in classrooms ⇒ Use of special readers and oth-
er materials developed by BETT in classrooms
⇒ Administration of formative reading test.
In order to promote improved in-struction of reading and writing and comply with the new USAID Edu-cation Strategy, the project imple-mented the measures listed below by providing a one-day orientation for new schools and a refresher training to old schools involving 155 participants during the year. A total of 57 schools comprising 109 Grade 1 teachers and a number of support staff from Government participated in this intervention. The interventions that were implemented during Year 4 include the following activities:
• Provisioning schools with teaching aids and learning games (combination of vowel and con-sonant board game, matching word and picture board game, writing words according to pic-ture, matching vowel and consonant chart, alphabet and vowel charts, mobile letters, ordering
• words into sentences, etc.) • Story reading in library and in class • Organizing peer tutoring activities • Setting up reading and writing corners in classrooms • Organizing remedial classes in selected villages • Providing bilingual classroom assistants (BCA) based on school request in minority areas • Testing students on reading and writing at the end of the school year.
Follow-up survey results involving 27 teachers in 15 schools were very encouraging with 89% of teachers reporting that they now do story reading to children in the library and that they carry out this activity at least once every two weeks. Another 93% reported that they had set up literacy corners in their classrooms and that a majority of students are using these cor-ners (see Table 3.59). Overall, surveys reported that all schools are implementing at least
Students in Kampong Cham get access to storybooks to reinforce their reading skills
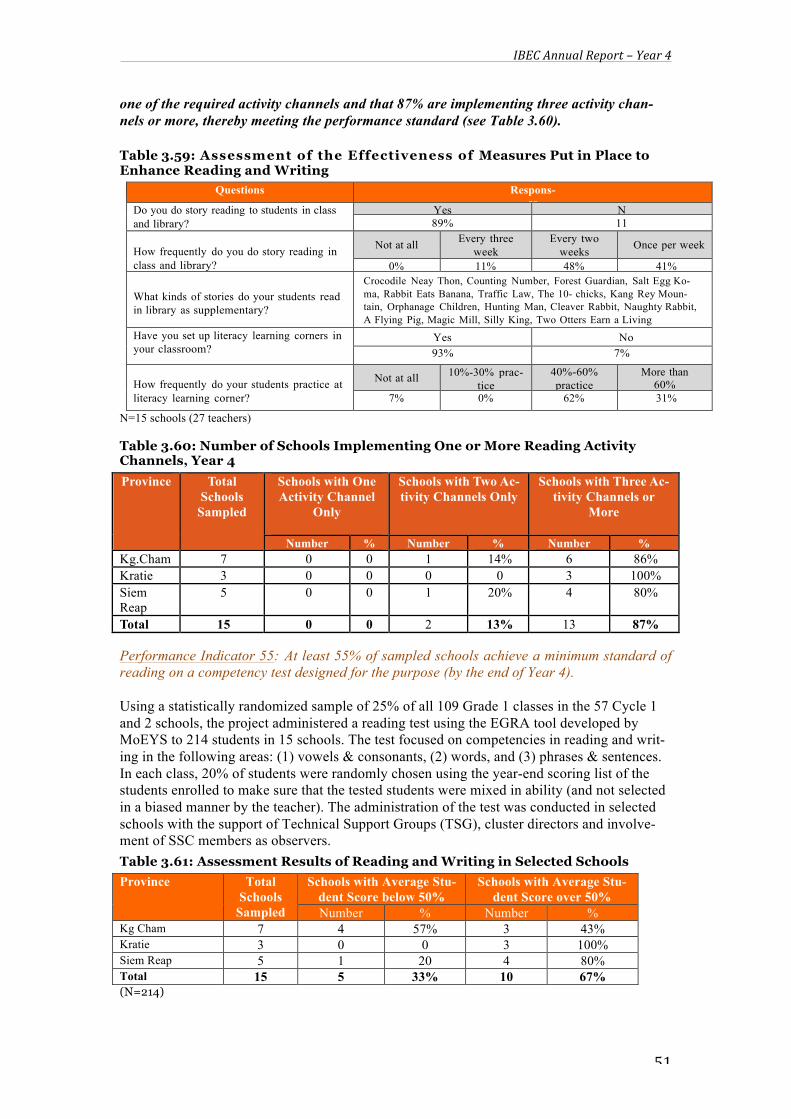
IBEC Annual Report – Year 4
51
one of the required activity channels and that 87% are implementing three activity chan-nels or more, thereby meeting the performance standard (see Table 3.60). Table 3.59: Assessment of the Effectiveness of Measures Put in Place to Enhance Reading and Writing
Questions Respons-es
Do you do story reading to students in class and library?
Yes No 89% 11%
How frequently do you do story reading in class and library?
Not at all Every three week
Every two weeks
Once per week 0% 11% 48% 41%
What kinds of stories do your students read in library as supplementary?
Crocodile Neay Thon, Counting Number, Forest Guardian, Salt Egg Ko-ma, Rabbit Eats Banana, Traffic Law, The 10- chicks, Kang Rey Moun-tain, Orphanage Children, Hunting Man, Cleaver Rabbit, Naughty Rabbit, A Flying Pig, Magic Mill, Silly King, Two Otters Earn a Living
Have you set up literacy learning corners in your classroom?
Yes No 93% 7%
How frequently do your students practice at literacy learning corner?
Not at all 10%-30% prac- tice
40%-60% practice
More than 60% prac-tice
7% 0% 62% 31% N=15 schools (27 teachers)
Table 3.60: Number of Schools Implementing One or More Reading Activity Channels, Year 4 Province
Total
Schools Sampled
Schools with One Activity Channel
Only
Schools with Two Ac-tivity Channels Only
Schools with Three Ac-tivity Channels or
More
Number % Number % Number % Kg.Cham 7 0 0 1 14% 6 86% Kratie 3 0 0 0 0 3 100% Siem Reap
5 0 0 1 20% 4 80%
Total 15 0 0 2 13% 13 87% Performance Indicator 55: At least 55% of sampled schools achieve a minimum standard of reading on a competency test designed for the purpose (by the end of Year 4). Using a statistically randomized sample of 25% of all 109 Grade 1 classes in the 57 Cycle 1 and 2 schools, the project administered a reading test using the EGRA tool developed by MoEYS to 214 students in 15 schools. The test focused on competencies in reading and writ-ing in the following areas: (1) vowels & consonants, (2) words, and (3) phrases & sentences. In each class, 20% of students were randomly chosen using the year-end scoring list of the students enrolled to make sure that the tested students were mixed in ability (and not selected in a biased manner by the teacher). The administration of the test was conducted in selected schools with the support of Technical Support Groups (TSG), cluster directors and involve-ment of SSC members as observers. Table 3.61: Assessment Results of Reading and Writing in Selected Schools Province Total
Schools Sampled
Schools with Average Stu-dent Score below 50%
Schools with Average Stu-dent Score over 50%
Number % Number % Kg Cham 7 4 57% 3 43% Kratie 3 0 0 3 100% Siem Reap 5 1 20 4 80% Total 15 5 33% 10 67% (N=214)

IBEC Annual Report – Year 4
52
Based on a review of the testing, it was found that: • 70% of children are able to read vowels and
consonants • 59% of children are able to read words • 54% of children are able to read
phrases/sentences. • 80% of children are able to write vowels and
consonants • 59% of children are able to write words • 52% of children are able to write
phrases/sentences Overall, it was found that 67% of schools generated mean scores on standardized reading tests that were 50% or greater, the cut-off point for passing, thereby achieving the performance standard for this indicator (see Table 3.61). Nevertheless, a third of the sampled schools had mean scores below 50%. The rate of failure seemed to be great-est in Kampong Cham where only 43% of school failed to achieve a mean score over 50%. The Component further reported that the majority of children in about four or five schools were not able to demonstrate even basic competencies such as reading conso-nants, vowels, and phrases. Causes for poor performance range from the use of Contract Teachers with no pedagogical training, poor school management due to the retirement of previously strong school director, low levels of teacher professionalism, and minority lan-guage issues. These problems demonstrate even with strong interventions, certain situational factors will still undermine implementation.
Performance Indicator 56: At least 80% of children remediated in Year 4 are promoted.
In order to enhance promotion rates at target schools each year, IBEC provides technical support to teachers to set up village-based remedial classes (mainly in the case of prima-ry school students) that keep student groupings small and informal with copious use of learning aids. Remedial classes comprising 215 student groupings of 20 students or less be-gan in February 2013. At the primary school level, there were a reported 16 remedial groups organized by schools and another 199 such groups at the secondary school level.
Student selection for this intervention is based on the identification of children at the end of Term 1 who have class averages of 4.99 or less in specific subjects. The organization of this intervention runs over a period of 15 weeks with at least six hours of tutorial support each week. During Year 4, 4,423 students, 49% of whom were girls, received remedial support from IBEC. Of the students receiving support, 270 (121 girls) were at the primary level and 4,153 (2,063 girls) were at the lower secondary level. The project achieved the per-formance standard of at least an 80% promotion rate for at-risk children, with 89% of those receiving remedial services moving to the next grade (91% for girls) (See Table 3.62).
A child in Siem Reap writes words accord-‐ing to the picture provided (above); indi-‐vidualized reading test in Krate Province
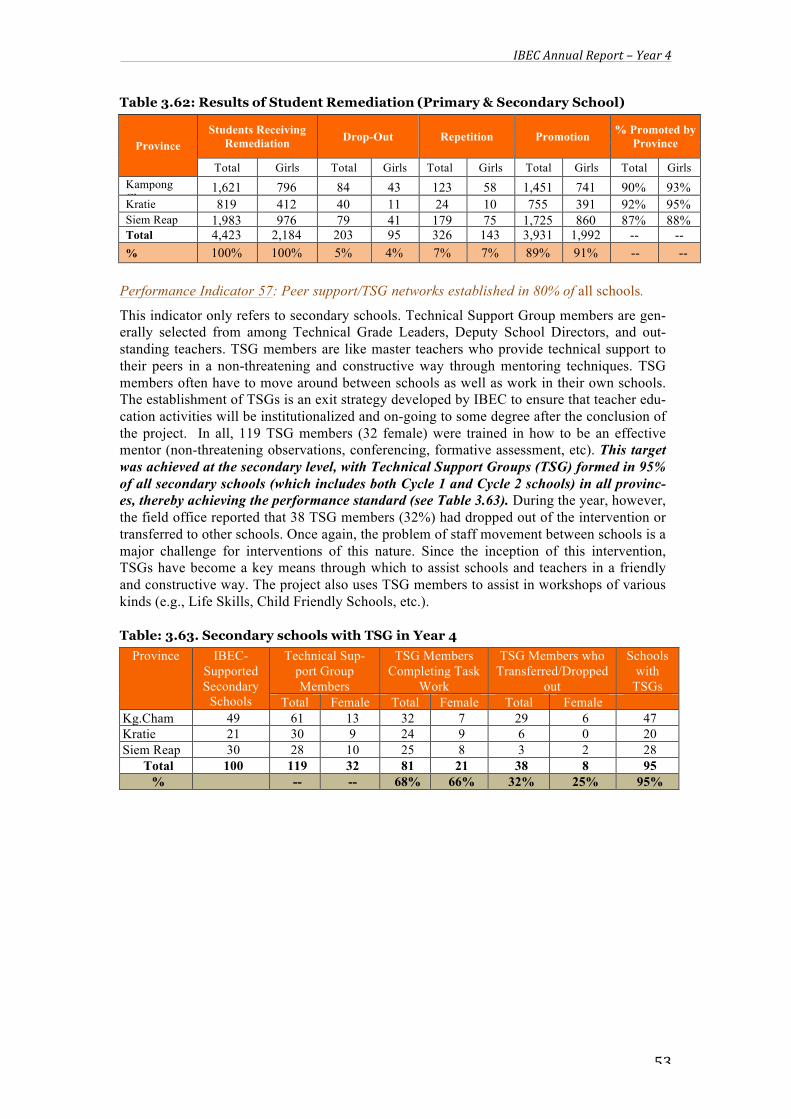
IBEC Annual Report – Year 4
53
Table 3.62: Results of Student Remediation (Primary & Secondary School)
Province Students Receiving
Remediation Drop-Out Repetition Promotion % Promoted by Province
Total Girls Total Girls Total Girls Total Girls Total Girls Kampong Cham
1,621 796 84 43 123 58 1,451 741 90% 93% Kratie 819 412 40 11 24 10 755 391 92% 95% Siem Reap 1,983 976 79 41 179 75 1,725 860 87% 88% Total 4,423 2,184 203 95 326 143 3,931 1,992 -- -- % 100% 100% 5% 4% 7% 7% 89% 91% -- --
Performance Indicator 57: Peer support/TSG networks established in 80% of all schools.
This indicator only refers to secondary schools. Technical Support Group members are gen-erally selected from among Technical Grade Leaders, Deputy School Directors, and out-standing teachers. TSG members are like master teachers who provide technical support to their peers in a non-threatening and constructive way through mentoring techniques. TSG members often have to move around between schools as well as work in their own schools. The establishment of TSGs is an exit strategy developed by IBEC to ensure that teacher edu-cation activities will be institutionalized and on-going to some degree after the conclusion of the project. In all, 119 TSG members (32 female) were trained in how to be an effective mentor (non-threatening observations, conferencing, formative assessment, etc). This target was achieved at the secondary level, with Technical Support Groups (TSG) formed in 95% of all secondary schools (which includes both Cycle 1 and Cycle 2 schools) in all provinc-es, thereby achieving the performance standard (see Table 3.63). During the year, however, the field office reported that 38 TSG members (32%) had dropped out of the intervention or transferred to other schools. Once again, the problem of staff movement between schools is a major challenge for interventions of this nature. Since the inception of this intervention, TSGs have become a key means through which to assist schools and teachers in a friendly and constructive way. The project also uses TSG members to assist in workshops of various kinds (e.g., Life Skills, Child Friendly Schools, etc.).
Table: 3.63. Secondary schools with TSG in Year 4 Province IBEC-
Supported Secondary
Schools
Technical Sup-port Group Members
TSG Members Completing Task
Work
TSG Members who Transferred/Dropped
out
Schools with
TSGs Total Female Total Female Total Female
Kg.Cham 49 61 13 32 7 29 6 47 Kratie 21 30 9 24 9 6 0 20 Siem Reap 30 28 10 25 8 3 2 28
Total 100 119 32 81 21 38 8 95 % -- -- 68% 66% 32% 25% 95%
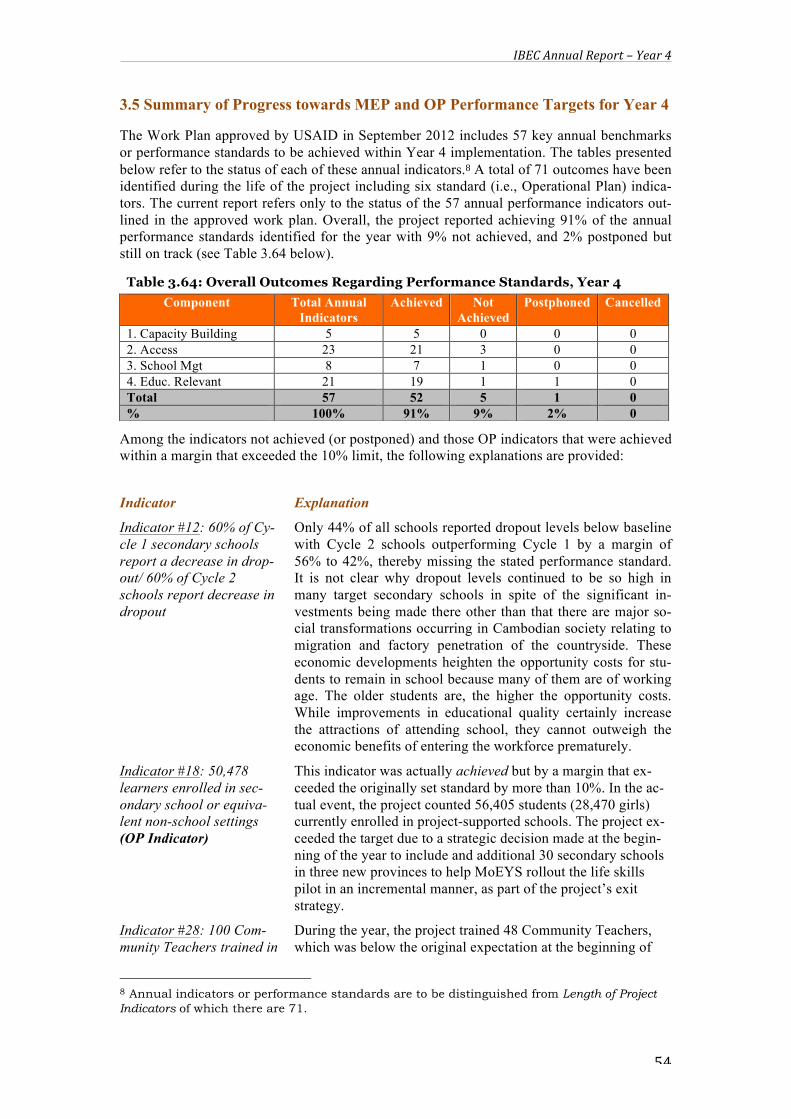
IBEC Annual Report – Year 4
54
3.5 Summary of Progress towards MEP and OP Performance Targets for Year 4
The Work Plan approved by USAID in September 2012 includes 57 key annual benchmarks or performance standards to be achieved within Year 4 implementation. The tables presented below refer to the status of each of these annual indicators.8 A total of 71 outcomes have been identified during the life of the project including six standard (i.e., Operational Plan) indica-tors. The current report refers only to the status of the 57 annual performance indicators out-lined in the approved work plan. Overall, the project reported achieving 91% of the annual performance standards identified for the year with 9% not achieved, and 2% postponed but still on track (see Table 3.64 below).
Among the indicators not achieved (or postponed) and those OP indicators that were achieved within a margin that exceeded the 10% limit, the following explanations are provided:
Indicator Explanation
Indicator #12: 60% of Cy-cle 1 secondary schools report a decrease in drop-out/ 60% of Cycle 2 schools report decrease in dropout
Only 44% of all schools reported dropout levels below baseline with Cycle 2 schools outperforming Cycle 1 by a margin of 56% to 42%, thereby missing the stated performance standard. It is not clear why dropout levels continued to be so high in many target secondary schools in spite of the significant in-vestments being made there other than that there are major so-cial transformations occurring in Cambodian society relating to migration and factory penetration of the countryside. These economic developments heighten the opportunity costs for stu-dents to remain in school because many of them are of working age. The older students are, the higher the opportunity costs. While improvements in educational quality certainly increase the attractions of attending school, they cannot outweigh the economic benefits of entering the workforce prematurely.
Indicator #18: 50,478 learners enrolled in sec-ondary school or equiva-lent non-school settings (OP Indicator)
This indicator was actually achieved but by a margin that ex-ceeded the originally set standard by more than 10%. In the ac-tual event, the project counted 56,405 students (28,470 girls) currently enrolled in project-supported schools. The project ex-ceeded the target due to a strategic decision made at the begin-ning of the year to include and additional 30 secondary schools in three new provinces to help MoEYS rollout the life skills pilot in an incremental manner, as part of the project’s exit strategy.
Indicator #28: 100 Com-munity Teachers trained in
During the year, the project trained 48 Community Teachers, which was below the original expectation at the beginning of
8 Annual indicators or performance standards are to be distinguished from Length of Project Indicators of which there are 71.
Table 3.64: Overall Outcomes Regarding Performance Standards, Year 4 Component Total Annual
Indicators Achieved Not
Achieved Postphoned Cancelled
1. Capacity Building 5 5 0 0 0 2. Access 23 21 3 0 0 3. School Mgt 8 7 1 0 0 4. Educ. Relevant 21 19 1 1 0 Total 57 52 5 1 0 % 100% 91% 9% 2% 0

IBEC Annual Report – Year 4
55
refresher courses. the project that there would still be left 100 Community Teach-ers in project schools. This indicator, retained from the original PMP submitted and approved by USAID in Year 1, no longer adequately captures the progress of this activity, as the project has actually succeeded in phasing out these interim teachers with permanent replacements through the linkage with the PTTC scholarship program. Thus, although only 48 of the re-maining 50 Community Teachers were trained this year, this indicator does not capture the highly successful progression towards sustainability for this intervention whose main purpose was to address teacher shortages in schools as an interim meas-ure until locally recruited PTTC candidates could replace them. In this respect, field offices have reported that 147 Community Teachers out of the 204 originally recruited have now been re-placed with locally recruited individuals who are now on state salaries.
Indicator #33: 14 second-ary schools improve their tier status; 16 primary schools improve their tier status
This indicator was partially achieved for primary schools (16 upgraded) but not for secondary schools (9 upgraded). The pro-ject has actually moved faster on this indicator with more schools upgraded in Years 2 and 3 than originally anticipated with the result that there are fewer schools to upgrade in Year 4. Thus, the project is still on track to reach its end-of-project goal of ensuring that at least 50% of all schools (i.e., 146 schools) are able to improve their performance tier designation by the end of the project in 2014 (see Table 3.33). In this respect, 75% secondary schools and 53% primary schools for a total of 61% schools now have performance tier status that is greater than when the project first started.
Indicator #37: Number of textbooks and other teach-ing and learning materials provided (OP Indicator)
⇒ 500 LS curriculum menus printed and distributed
⇒ 12,800 Life Skills Manuals printed and distributed
⇒ 65,000 laminated study slides printed and distrib-uted
⇒ 9,800 Life Skills posters printed and distributed.
Due to the extended period of time taken by the Textbook Re-view Council in the MoEYS to review, revise, and approve manuals, it has not been possible to print revised curriculum documents along with posters and learning slides as originally expected. During the year, the Ministry approved 22 manuals; two manuals were rejected because they relate to raising the political and cultural awareness of youth. Given the results of the recent election and the role of youth, the MoEYS feels that it is too politically risky to approve such curriculum documents. Thus, there are still six manuals remaining that need to be ap-proved. Given that many agencies have reported waiting for over a year for the Ministry to approve just one manual, the ap-proval of 22 manuals is astonishing; nevertheless, this is not adequate for the project to meet its publishing timetable. Thus, given these difficulties with the Ministry approval process, this performance standard has been postponed to Year 5.
Indicator #41: 3 new IT labs constructed
In the actual event, only two labs were constructed due to a tac-tical decision made with USAID to divert funds from IT Lab construction to support for English language instruction, in-stead. Nevertheless, the project is still on track to achieve its overall goal of 26 IT labs within a margin of 10% by the end of the project.

IBEC Annual Report – Year 4
56
A full summary of indicators achieved and not achieved (or postponed) is provided in Table 3.65 below. Indicators shaded in ‘green’ indicate OP indicators while those shaded in ‘red’ indicate those not achieved; those shaded in brown have been postponed.
Table 3.65: Individual Status of MEP & OP Indicators for Year 4 Implementation Intermediate
Results Operational Indicator Current Status
COMPONENT 1: Local NGO and Government Capacity Building & Advocacy for Sustainability Increased Ca-pacity of Local Civil Society, Including Edu-cation NGO(s), and Govern-ment Note: IR from RFA (2009)
1. One LNGO (Buddhist Social Development Associa-tion) receives CCC accreditation by the end of Year 4.
Achieved: One LNGO (BSDA) received CCC accreditation in January 2013.
2. 15 communes/district councils provide matching funds to schools.
Achieved: 16 communes council provide matching funds to schools ($9,652 from IBEC and $3,228 from CC equal 25%)
3. At least 75% of selected CEFACs meet minimum performance standards.
Achieved: 83% of selected CEFACs meet minimum performance standards.
4. Multiple channels for dissemination of programming active and in place including:
o 4 CG meetings o 3 radio programs o 2 NEP workshops o 10 success stories o 1 updated website o 4 Newsletters o 1 Research article
Achieved: ⇒ 4 CG meetings (Done) ⇒ 6 radio programs (Done) ⇒ 10 success stories (Done) ⇒ 1 updated website (On-going) ⇒ 4 newsletters (Done) ⇒ 1 Research Article (Done) ⇒ 2 National Workshops (Done)
5. 3 PWGs meet minimum performance standards. Achieved: 3 PWGs members achieved a minimum score or better for performance parameter.
COMPONENT 2: More Equitable School Access Subcomponent 1: Scholarships Increased enrollment, retention, pro-motion, and completion rates of youth from under-served popula-tions (includ-ing marginal-ized girls/boys, poor, ethnic and religious minorities, & handicapped children – (USAID-supported) (IR 1.1) Note: IR from RFA (2009)
6. 1,125 new children receive primary school scholar-ships (6,907 scholarship recipients since start-up)
Achieved: 1,317 new children received primary scholarships (671 female) .
7. 1,497 children receive scholarships (no new in-take/2nd cohort graduates; 2,241 recipients since start-up)
Achieved: 1,604 children received schol-arship (1,104 females) No new intake
8. 240 PTTC scholarship recipients (no new intake/2nd cohort graduates
Not Achieved: 120 scholarship recipients (80 female) currently receiving assistance ( So far graduated 360)
9. At least 70% of scholarship recipients at secondary level are girls, minority, and/or physically challenged
Achieved: 70% of scholarship recipients at secondary schools level are girls, mi-nority, and/or physical challenged.
10. At least 60% of scholarship recipients at primary level are girls, minority, or physically challenged
Achieved: (within a margin of 10%) 57% of scholarship recipients at primary schools level are girls, minority, and/or physical challenged
11. 65% of Cycle 1 primary schools report a decrease in dropout/ 65% of Cycle 2 schools report decrease in dropout
Achieved: 70% of Cycle 1 primary schools report a decrease in dropout/ 56% of Cycle 2 schools report decrease in dropout
12. 60% of Cycle 1 secondary schools report a decrease in dropout/ 60% of Cycle 2 schools report decrease in dropout
Not Achieved: 42% of Cycle 1 second-ary schools report a decrease in dropout/ 56% of Cycle 2 schools report decrease in dropout
13. 55% of Cohort 2 Scholarship recipients complete Grade 9
Achieved: 85% (84% girls) of Cohort 2 Scholarship recipients complete Grade 9.
14. 70% of target schools with scholarship programming demonstrate increased GPI
Achieved: 74% of target schools with scholarship programming demonstrate increase GPI. (1.04 for Kg.Cham, 1.11 for Kratie, and 1.2 for Siem Reap)
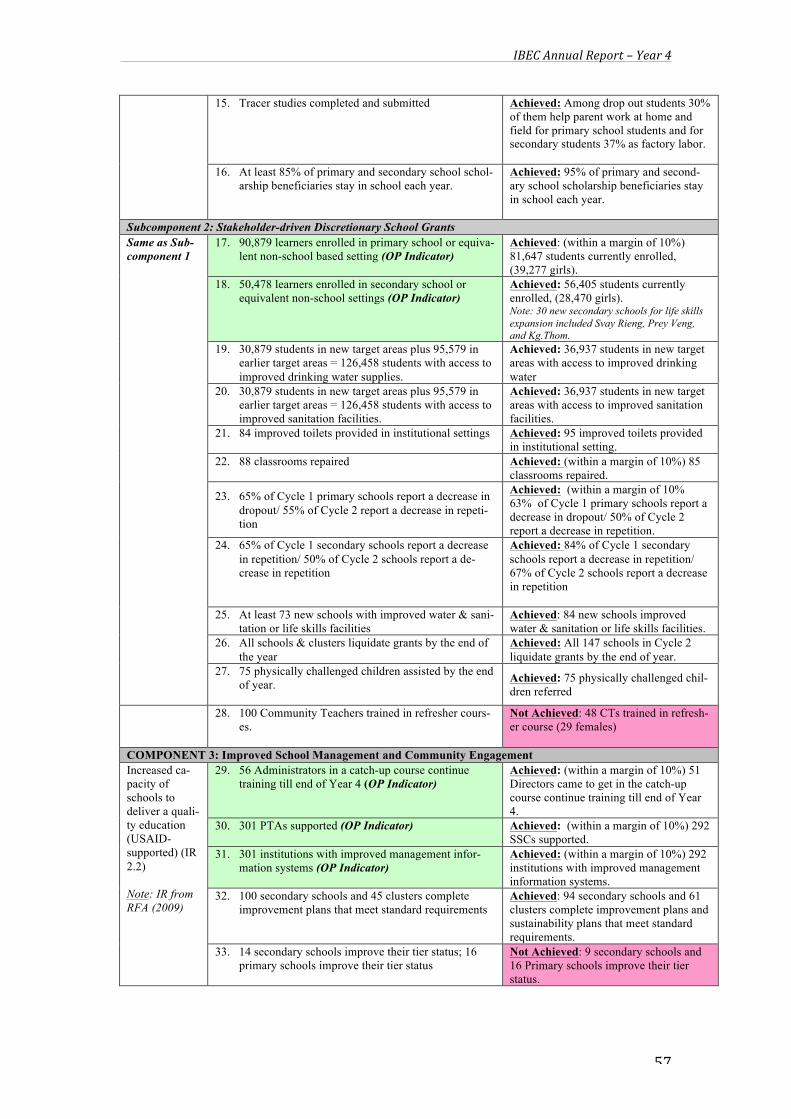
IBEC Annual Report – Year 4
57
15. Tracer studies completed and submitted Achieved: Among drop out students 30% of them help parent work at home and field for primary school students and for secondary students 37% as factory labor.
16. At least 85% of primary and secondary school schol-arship beneficiaries stay in school each year.
Achieved: 95% of primary and second-ary school scholarship beneficiaries stay in school each year.
Subcomponent 2: Stakeholder-driven Discretionary School Grants Same as Sub-component 1
17. 90,879 learners enrolled in primary school or equiva-lent non-school based setting (OP Indicator)
Achieved: (within a margin of 10%) 81,647 students currently enrolled, (39,277 girls).
18. 50,478 learners enrolled in secondary school or equivalent non-school settings (OP Indicator)
Achieved: 56,405 students currently enrolled, (28,470 girls). Note: 30 new secondary schools for life skills expansion included Svay Rieng, Prey Veng, and Kg.Thom.
19. 30,879 students in new target areas plus 95,579 in earlier target areas = 126,458 students with access to improved drinking water supplies.
Achieved: 36,937 students in new target areas with access to improved drinking water
20. 30,879 students in new target areas plus 95,579 in earlier target areas = 126,458 students with access to improved sanitation facilities.
Achieved: 36,937 students in new target areas with access to improved sanitation facilities.
21. 84 improved toilets provided in institutional settings Achieved: 95 improved toilets provided in institutional setting.
22. 88 classrooms repaired Achieved: (within a margin of 10%) 85 classrooms repaired.
23. 65% of Cycle 1 primary schools report a decrease in dropout/ 55% of Cycle 2 report a decrease in repeti-tion
Achieved: (within a margin of 10% 63% of Cycle 1 primary schools report a decrease in dropout/ 50% of Cycle 2 report a decrease in repetition.
24. 65% of Cycle 1 secondary schools report a decrease in repetition/ 50% of Cycle 2 schools report a de-crease in repetition
Achieved: 84% of Cycle 1 secondary schools report a decrease in repetition/ 67% of Cycle 2 schools report a decrease in repetition
25. At least 73 new schools with improved water & sani-tation or life skills facilities
Achieved: 84 new schools improved water & sanitation or life skills facilities.
26. All schools & clusters liquidate grants by the end of the year
Achieved: All 147 schools in Cycle 2 liquidate grants by the end of year.
27. 75 physically challenged children assisted by the end of year.
Achieved: 75 physically challenged chil-dren referred
28. 100 Community Teachers trained in refresher cours-es.
Not Achieved: 48 CTs trained in refresh-er course (29 females)
COMPONENT 3: Improved School Management and Community Engagement Increased ca-pacity of schools to deliver a quali-ty education (USAID-supported) (IR 2.2) Note: IR from RFA (2009)
29. 56 Administrators in a catch-up course continue training till end of Year 4 (OP Indicator)
Achieved: (within a margin of 10%) 51 Directors came to get in the catch-up course continue training till end of Year 4.
30. 301 PTAs supported (OP Indicator)
Achieved: (within a margin of 10%) 292 SSCs supported.
31. 301 institutions with improved management infor-mation systems (OP Indicator)
Achieved: (within a margin of 10%) 292 institutions with improved management information systems.
32. 100 secondary schools and 45 clusters complete improvement plans that meet standard requirements
Achieved: 94 secondary schools and 61 clusters complete improvement plans and sustainability plans that meet standard requirements.
33. 14 secondary schools improve their tier status; 16 primary schools improve their tier status
Not Achieved: 9 secondary schools and 16 Primary schools improve their tier status.
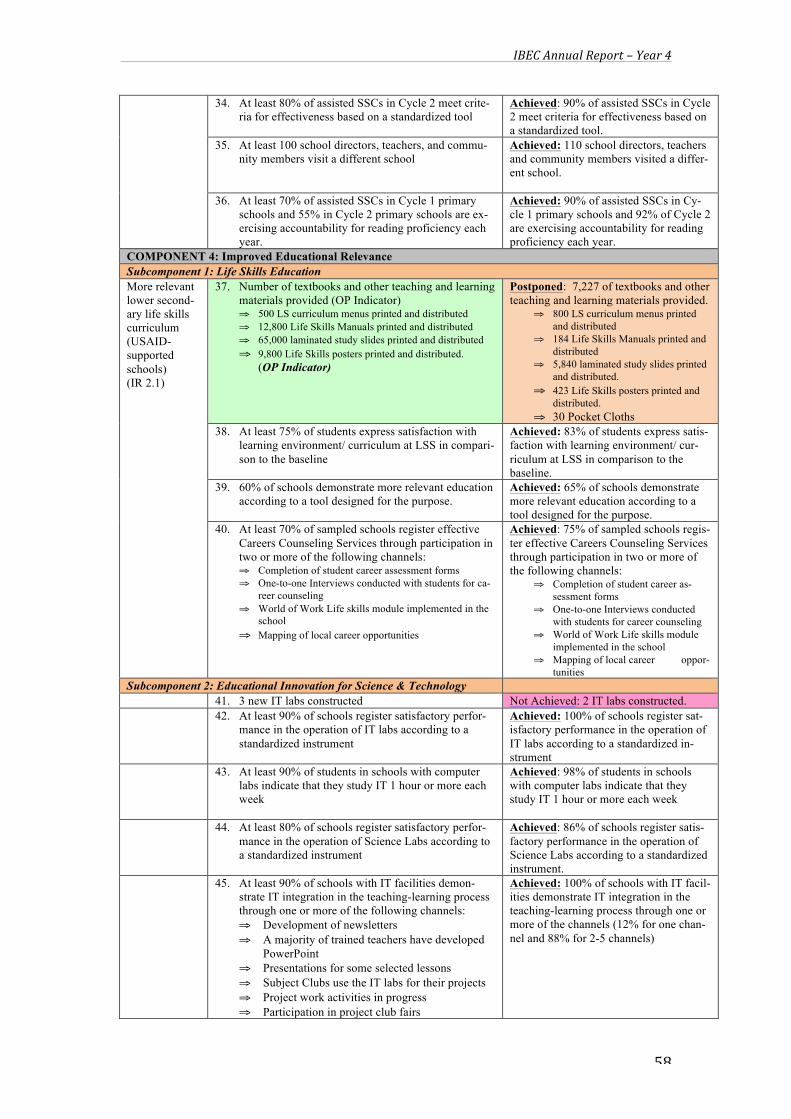
IBEC Annual Report – Year 4
58
34. At least 80% of assisted SSCs in Cycle 2 meet crite-ria for effectiveness based on a standardized tool
Achieved: 90% of assisted SSCs in Cycle 2 meet criteria for effectiveness based on a standardized tool.
35. At least 100 school directors, teachers, and commu-nity members visit a different school
Achieved: 110 school directors, teachers and community members visited a differ-ent school.
36. At least 70% of assisted SSCs in Cycle 1 primary schools and 55% in Cycle 2 primary schools are ex-ercising accountability for reading proficiency each year.
Achieved: 90% of assisted SSCs in Cy-cle 1 primary schools and 92% of Cycle 2 are exercising accountability for reading proficiency each year.
COMPONENT 4: Improved Educational Relevance Subcomponent 1: Life Skills Education More relevant lower second-ary life skills curriculum (USAID-supported schools) (IR 2.1)
37. Number of textbooks and other teaching and learning materials provided (OP Indicator) ⇒ 500 LS curriculum menus printed and distributed ⇒ 12,800 Life Skills Manuals printed and distributed ⇒ 65,000 laminated study slides printed and distributed ⇒ 9,800 Life Skills posters printed and distributed.
(OP Indicator)
Postponed: 7,227 of textbooks and other teaching and learning materials provided.
⇒ 800 LS curriculum menus printed and distributed
⇒ 184 Life Skills Manuals printed and distributed
⇒ 5,840 laminated study slides printed and distributed.
⇒ 423 Life Skills posters printed and distributed.
⇒ 30 Pocket Cloths 38. At least 75% of students express satisfaction with
learning environment/ curriculum at LSS in compari-son to the baseline
Achieved: 83% of students express satis-faction with learning environment/ cur-riculum at LSS in comparison to the baseline.
39. 60% of schools demonstrate more relevant education according to a tool designed for the purpose.
Achieved: 65% of schools demonstrate more relevant education according to a tool designed for the purpose.
40. At least 70% of sampled schools register effective Careers Counseling Services through participation in two or more of the following channels: ⇒ Completion of student career assessment forms ⇒ One-to-one Interviews conducted with students for ca-
reer counseling ⇒ World of Work Life skills module implemented in the
school ⇒ Mapping of local career opportunities
Achieved: 75% of sampled schools regis-ter effective Careers Counseling Services through participation in two or more of the following channels:
⇒ Completion of student career as-sessment forms
⇒ One-to-one Interviews conducted with students for career counseling
⇒ World of Work Life skills module implemented in the school
⇒ Mapping of local career oppor-tunities
Subcomponent 2: Educational Innovation for Science & Technology 41. 3 new IT labs constructed Not Achieved: 2 IT labs constructed. 42. At least 90% of schools register satisfactory perfor-
mance in the operation of IT labs according to a standardized instrument
Achieved: 100% of schools register sat-isfactory performance in the operation of IT labs according to a standardized in-strument
43. At least 90% of students in schools with computer labs indicate that they study IT 1 hour or more each week
Achieved: 98% of students in schools with computer labs indicate that they study IT 1 hour or more each week
44. At least 80% of schools register satisfactory perfor-mance in the operation of Science Labs according to a standardized instrument
Achieved: 86% of schools register satis-factory performance in the operation of Science Labs according to a standardized instrument.
45. At least 90% of schools with IT facilities demon-strate IT integration in the teaching-learning process through one or more of the following channels: ⇒ Development of newsletters ⇒ A majority of trained teachers have developed
PowerPoint ⇒ Presentations for some selected lessons ⇒ Subject Clubs use the IT labs for their projects ⇒ Project work activities in progress ⇒ Participation in project club fairs
Achieved: 100% of schools with IT facil-ities demonstrate IT integration in the teaching-learning process through one or more of the channels (12% for one chan-nel and 88% for 2-5 channels)
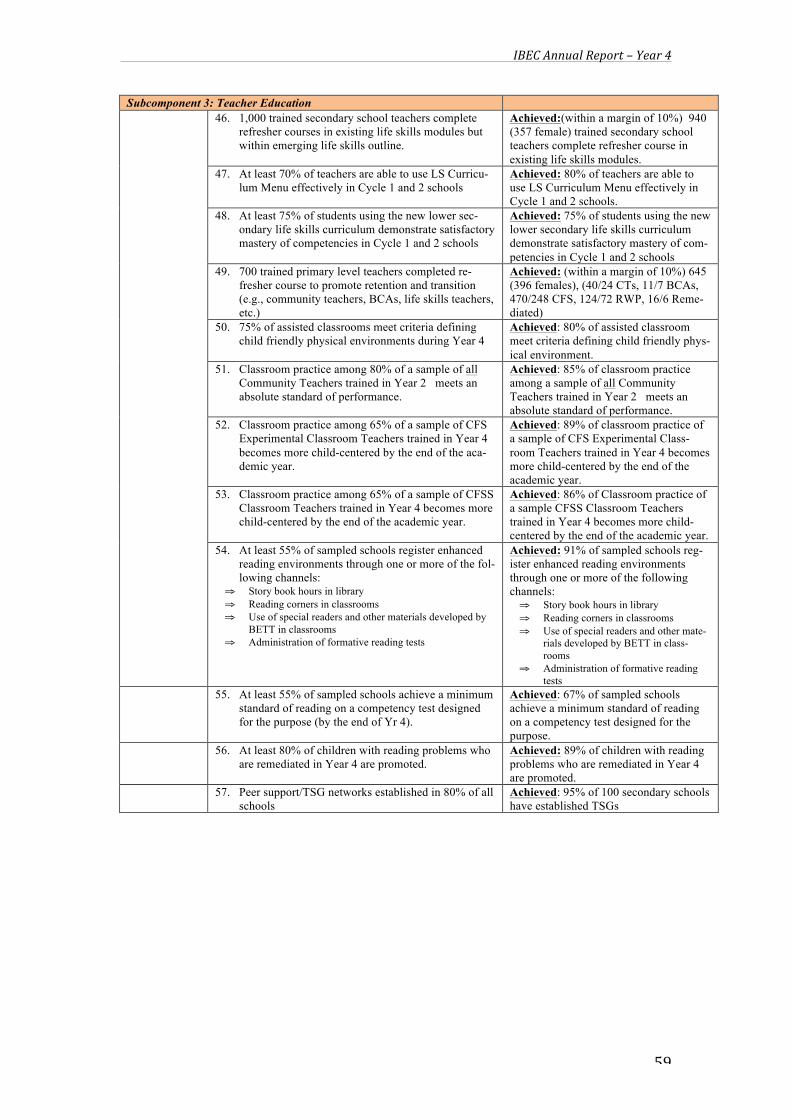
IBEC Annual Report – Year 4
59
Subcomponent 3: Teacher Education 46. 1,000 trained secondary school teachers complete
refresher courses in existing life skills modules but within emerging life skills outline.
Achieved:(within a margin of 10%) 940 (357 female) trained secondary school teachers complete refresher course in existing life skills modules.
47. At least 70% of teachers are able to use LS Curricu-lum Menu effectively in Cycle 1 and 2 schools
Achieved: 80% of teachers are able to use LS Curriculum Menu effectively in Cycle 1 and 2 schools.
48. At least 75% of students using the new lower sec-ondary life skills curriculum demonstrate satisfactory mastery of competencies in Cycle 1 and 2 schools
Achieved: 75% of students using the new lower secondary life skills curriculum demonstrate satisfactory mastery of com-petencies in Cycle 1 and 2 schools
49. 700 trained primary level teachers completed re-fresher course to promote retention and transition (e.g., community teachers, BCAs, life skills teachers, etc.)
Achieved: (within a margin of 10%) 645 (396 females), (40/24 CTs, 11/7 BCAs, 470/248 CFS, 124/72 RWP, 16/6 Reme-diated)
50. 75% of assisted classrooms meet criteria defining child friendly physical environments during Year 4
Achieved: 80% of assisted classroom meet criteria defining child friendly phys-ical environment.
51. Classroom practice among 80% of a sample of all Community Teachers trained in Year 2 meets an absolute standard of performance.
Achieved: 85% of classroom practice among a sample of all Community Teachers trained in Year 2 meets an absolute standard of performance.
52. Classroom practice among 65% of a sample of CFS Experimental Classroom Teachers trained in Year 4 becomes more child-centered by the end of the aca-demic year.
Achieved: 89% of classroom practice of a sample of CFS Experimental Class-room Teachers trained in Year 4 becomes more child-centered by the end of the academic year.
53. Classroom practice among 65% of a sample of CFSS Classroom Teachers trained in Year 4 becomes more child-centered by the end of the academic year.
Achieved: 86% of Classroom practice of a sample CFSS Classroom Teachers trained in Year 4 becomes more child-centered by the end of the academic year.
54. At least 55% of sampled schools register enhanced reading environments through one or more of the fol-lowing channels:
⇒ Story book hours in library ⇒ Reading corners in classrooms ⇒ Use of special readers and other materials developed by
BETT in classrooms ⇒ Administration of formative reading tests
Achieved: 91% of sampled schools reg-ister enhanced reading environments through one or more of the following channels: ⇒ Story book hours in library ⇒ Reading corners in classrooms ⇒ Use of special readers and other mate-
rials developed by BETT in class-rooms
⇒ Administration of formative reading tests
55. At least 55% of sampled schools achieve a minimum standard of reading on a competency test designed for the purpose (by the end of Yr 4).
Achieved: 67% of sampled schools achieve a minimum standard of reading on a competency test designed for the purpose.
56. At least 80% of children with reading problems who are remediated in Year 4 are promoted.
Achieved: 89% of children with reading problems who are remediated in Year 4 are promoted.
57. Peer support/TSG networks established in 80% of all schools
Achieved: 95% of 100 secondary schools have established TSGs

IBEC Annual Report – Year 4
60
4. PROGRAM MANAGEMENT REVIEW FOR YEAR 4
4.1 Status of Grant Disbursement to Schools
General Overview: As IBEC began a consolidation phase in Year 4 and started ramping down it grants to schools, total grant support to school dropped from $889,742 in Year 3 to $549,647 in Year 4. This represents a decline in support of 38% year on year. Nevertheless, grants to schools were still signifi-cant by any other measure and spanned a wide number of different kinds of support from scholarships to Community Teachers, and gen-eral school grants. Discretionary school grants to primary and sec-ondary schools still represented the largest single source of grant sup-port at $176,951 (32%) followed by WASH grants at $174,091 (31%) and secondary school scholarships at $49,917 (9%) (see Box 4.1). Fund utilization rates among schools continued to be very high. In this respect, primary schools re-ported utilizing 93% of the allocat-ed funds while secondary schools reported utilizing 94%. Fund utili-zation rates tended to be highest in Kampong Cham Province where a large number of schools are located. Primary Level Grants: Direct grants to primary schools were limited to only Cycle 2 schools of which there are 67 schools in 32 clusters. The project allocated $73,650 for cluster school grants of which $68,704 was requested and liquidated by schools during the quarter (see Table 4.1). This represents a fund utilization rate of 93%, which is quite high. Burn rates were greatest in Kratie with a 96% fund utilization rate and Kampong Cham with a 95% rate. Siem Reap utilized 91% of its budget. Activity implementation was somewhat hindered this year due to the national elections, causing many teachers and school directors to leave their posts to work at polling stations and with election organizations. Nevertheless, the project continued to show very high rates of fund absorption in the areas in which is it is working. Table 4.1: Approved Budgets and Expenditure for All Target Clusters by Province in Academic Year 2012/13
Province Number of Clusters
Budget Approved
Funds Re-ceived to
date
Liquidated to Date
Budget Remaining
Remaining as a % of Ap-
proved Budget
Kg Cham 3 (8 Schools) $29,470.00 $28,081.50 $28,019.00 $1,451.00 4.92%
Kratie 6 (7 Schools) $10,030.00 $9,612.50 $9,604.25 $425.75 4.24%
Siem Reap
23 (52 Schools) $34,150.00 $31,589.00 $31,081.60 $3,068.40 8.99%
Total 32 $73,650.00 $69,283.00 $68,704.85 $4,945.15 6.71%
Secondary Level Grants: A significant proportion of discretionary school grant funding was allocated at secondary school level, as part of the project’s heavy focus on youth empower-ment. In this regard, the project allocated $113,038 to 80 Cycle 2 secondary schools in the
Box 4.1: Summary of Grants Provided to Schools • Discretionary School Grants $176,951
• Water & Sanitation $174,091
• Secondary School Scholarships $49,917
• Primary School Scholarships $39,285
• Computer Labs $28,924
• PTTC Scholarship Grants $21,403
• Child Friendly School Grants (for science labs, classroom materials, etc.)
$20,403
• Community Teacher Grants $14,611
• Infrastructure $10,520
• Commune Grants $8,567
• Child to Child Help Networks $4,975 Total $549,647
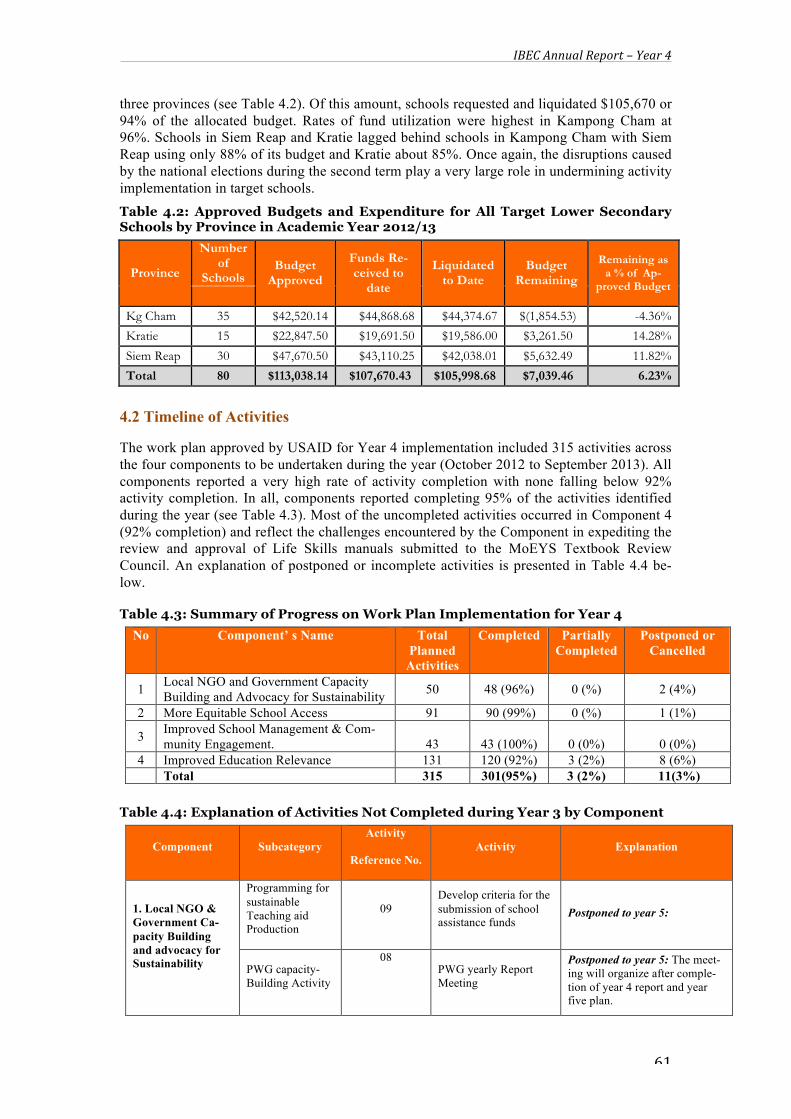
IBEC Annual Report – Year 4
61
three provinces (see Table 4.2). Of this amount, schools requested and liquidated $105,670 or 94% of the allocated budget. Rates of fund utilization were highest in Kampong Cham at 96%. Schools in Siem Reap and Kratie lagged behind schools in Kampong Cham with Siem Reap using only 88% of its budget and Kratie about 85%. Once again, the disruptions caused by the national elections during the second term play a very large role in undermining activity implementation in target schools. Table 4.2: Approved Budgets and Expenditure for All Target Lower Secondary Schools by Province in Academic Year 2012/13
Province
Number of
Schools Budget
Approved
Funds Re-ceived to
date
Liquidated to Date
Budget Remaining
Remaining as a % of Ap-
proved Budget
Kg Cham 35 $42,520.14 $44,868.68 $44,374.67 $(1,854.53) -4.36%
Kratie 15 $22,847.50 $19,691.50 $19,586.00 $3,261.50 14.28%
Siem Reap 30 $47,670.50 $43,110.25 $42,038.01 $5,632.49 11.82%
Total 80 $113,038.14 $107,670.43 $105,998.68 $7,039.46 6.23%
4.2 Timeline of Activities
The work plan approved by USAID for Year 4 implementation included 315 activities across the four components to be undertaken during the year (October 2012 to September 2013). All components reported a very high rate of activity completion with none falling below 92% activity completion. In all, components reported completing 95% of the activities identified during the year (see Table 4.3). Most of the uncompleted activities occurred in Component 4 (92% completion) and reflect the challenges encountered by the Component in expediting the review and approval of Life Skills manuals submitted to the MoEYS Textbook Review Council. An explanation of postponed or incomplete activities is presented in Table 4.4 be-low.
Table 4.3: Summary of Progress on Work Plan Implementation for Year 4 No Component’ s Name Total
Planned Activities
Completed Partially Completed
Postponed or Cancelled
1 Local NGO and Government Capacity Building and Advocacy for Sustainability 50 48 (96%) 0 (%) 2 (4%)
2 More Equitable School Access 91 90 (99%) 0 (%) 1 (1%)
3 Improved School Management & Com-munity Engagement.
43
43 (100%)
0 (0%)
0 (0%)
4 Improved Education Relevance 131 120 (92%) 3 (2%) 8 (6%) Total 315 301(95%) 3 (2%) 11(3%)
Table 4.4: Explanation of Activities Not Completed during Year 3 by Component
Component Subcategory Activity
Reference No. Activity Explanation
1. Local NGO & Government Ca-pacity Building and advocacy for Sustainability
Programming for sustainable Teaching aid Production
09 Develop criteria for the submission of school assistance funds
Postponed to year 5:
PWG capacity- Building Activity
08
PWG yearly Report Meeting
Postponed to year 5: The meet-ing will organize after comple-tion of year 4 report and year five plan.

IBEC Annual Report – Year 4
62
2. More Equitable School Access
PTTC Scholar-ships
01 Orientation to the earli-er selected PTTC scholarship beneficiar-ies at all colleges
Cancelled: There was no more new PTTC intake for year five.
3: Improved School Manage-ment & Communi-ty Engagement
All activities completed
4. Improved Edu-cational Relevance
Review and Revi-sion of Manuals
04 Reprint revised man-‐uals and other teach-‐ing aids (e.g., posters and learning slides)
Partially Completed: Due to slowness of the MoEYS, Text Book review committee to ap-prove submitted Manuals.
03 Approve newly re-‐vised manuals (MoEYS)
06 Distribute/implement finalized curriculum materials in schools
Teacher training for Computer Proficiency
06
Organize advocacy workshop for IT Lab sustainability with school directors and community
Postponed to year 5:
Theme School Development in Science & Tech-nology
01
Do a costing of how theme schools could be supported, focusing on technology inputs from Microsoft
Cancelled: Project not able to negotiate tri-partite partnership with Microsoft Corporation
02 Develop MoU with World Education, USAID, and Microsoft as signatories
03
Develop an amendment to the existing MoU between World Educa-tion and MoEYS, which MoEYS will sign.
04 Brainstorming workshop with Microsoft to gener-ate ideas for pilot framework
05
Develop detailed imple-mentation framework and budget for putting theme schools into prac-tice (including monitor-ing guidelines)
06 Theme School Identifi-cation with PWGs
07 Orientations and training for Theme School Set-up
IBEC Annual Report – Year 4
63
5. LESSONS LEARNED AND ISSUES IN IMPLEMENTATION
5.1 Major Movements Forward in Sustaining Change
Project implementation during Years 4 has increasingly seen a major shift in program focus towards consolidation and sustainability issues. This process will continue into Year 5 as well. The project has been very active during the year in this regard on a number of fronts. For example, the project has actually started to channel school improvement grants through local commune councils with a significant cash matching contribution from the councils themselves. Cycle 1 schools (which completed their development cycle at the end of Year 3) have now started to negotiate directly with local government for school support grants, there-by instilling institutional habits of support in the future.
During Year 4 implementation, the project also achieved a formal commitment from govern-ment to adopt the 30 life skills manuals developed and piloted during Years 2 and 3, with a Textbook Review Committee at ministerial level now reviewing all such documents for for-mal adoption. In parallel with these activities, IBEC has also begun an exit strategy for its life skills support by involving the Ministry in a process of incremental roll-out of life skills pro-gramming by establishing 30 demonstration sites in three new provinces (Kampong Thom, Prey Veng, and Svay Rieng) besides those where the life skills pilot originally took place (Kratie, Kampong Cham, and Siem Reap). Life skills programming in the demonstration sites is intended to help inform other nearby schools how to introduce practical life skills edu-cation to their curriculum, as per the new Ministry policy. This incremental approach is much less resource-intensive than a national roll-out and, with the experience generated by the es-tablishment of demonstration sites, should help the Ministry to replicate a gradual expansion in other provinces.
5.2 Strong Synergies with Other Programming
During the year, IBEC has been able to leverage its resources significantly by partnering with other projects and donors. These synergies have not only achieved significant knock-on ef-fects for the funding provided by USAID but have also helped to transform the project into a key national network for disseminating educational innovation throughout hundreds of schools at both the primary and secondary school level.
A number of important successes in expanding this network were achieved during the year including close consultations with the Asian Development Bank, leading to the submission of an official design report for the Third Educational Sector Development Program (ESDP III) adopting key IBEC products. This includes the Activity Menu used in school planning, the Life Skills Menu, and many Life Skills manuals. The design report has been officially ac-cepted by Ministry, thereby ensuring the likely implementation of these interventions in 100 pilot schools under the School-based Enrichment Program, which is a component under ESDP III. Similarly, the start of the Total Reading Approach for Children Project (TRAC) in October 2012, funded by the ‘All Children Reading Coalition,’ provided significant opportu-nities for IBEC to greatly deepen its inputs to improve Early Grade Reading. This includes the introduction of M-learning activities, a Reading Toolkit, and Literacy Coaches into pro-ject areas. All target schools under TRAC are also IBEC schools, following the pilot within a pilot model that has also been used successfully with financial literacy activities in Kratie Province under funding from Barclay’s Bank. These activities have themselves been signifi-cantly expanded with additional funding from Barclay’s Bank, which was used in Kampong Cham Province to introduce financial literacy topics at secondary school level. Finally, the project continued to cooperate with a project known as the Beacon School Initiative, which is implemented by KAPE with funding from the Oak Tree Foundation. This project operates in three IBEC schools and has made significant progress in producing learning environments of

IBEC Annual Report – Year 4
64
exceptional quality that contribute greatly to the beacon school activities supported under the IBEC Project.
5.3 Continuing Delays in the Review and Approval of Life Skills Manuals by Ministry
As noted in earlier sections, 30 life skills were submitted to the Ministry’s Textbook Review Council at the beginning of the school year but after one year of review, only 22 have been approved with two rejected (due to political sensitivities) and six remaining. These delays have resulted in the need to use the unrevised pilot test versions of manuals in all schools this year. With the fifth and final year of IBEC implementation looming, IBEC has sought the assistance of the Consultative Group, which is headed by H.E. Sam Sereyrath, Director Gen-eral. The DG has been very helpful in advocating for an expedited review process so that all manuals can be printed for the Ministry in time for the next school year. IBEC remains hope-ful that with assistance of the DG, the project will be able to meet its deadlines.
5.4 Late Disbursement of Funds for Local Government Matching Funds
A key aspect of project implementation in Year 4 refers to the transition from project to commune mediated grant support for all target schools. Although 16 communes have indeed agreed to use resources received from central government as planned for school support as part of a match to project funds, two communes have been very slow to receive/release funds to target schools. While IBEC is very encouraged that the institutional shift from project to commune-mediated grant support to schools is unfolding as planned, the fact that the central government is sometimes very slow to release funds to communes is of some concern, partic-ularly as disbursements appear to happen in the middle of the school year, which is too late to implement many school-level activities.
5.5 Recent Contact with the Research Department of MoEYS
During the year, Dr. Chan Roth, Director of the Research Department within MoEYS con-tacted IBEC to discuss the possibility of collaboration on various IT projects. During a visit to the World Education Office, Dr. Chan talked about the unfortunate circumstances surround-ing the proposed collaboration with Microsoft Corp. under a concept note describing Tech-nology Theme Schools. Dr. Chan indicated that he thought that the idea had merit and that the Ministry had not authorized the rejection of the concept note by the ICT Office. While IBEC saw great potential in a possible collaboration with the Research Department, all funds origi-nally intended for the Technology Theme Schools had unfortunately been allocated to other activities as was suggested by the ICT Office. However, IBEC informed the Research De-partment that if other funds become available, the project would like to review possibilities for future collaboration. Dr. Chan asked for a Khmer version of the concept note for his rec-ords and would like to meet with the project further for a review of possible areas of collabo-ration. The ICT team within IBEC continues to pursue this possible collaboration in the fu-ture, pending the availability of funding.
5.6 Disruptions Caused by Parliamentary Elections As happens every five years when the country holds national elections for Parliament, hun-dreds of teachers and school directors flock to seek work in the various election committees that are set up through the countryside. The government is happy for school personnel to seek this extra employment because it realizes that salaries are very low. The problem with this practice is that it is very disruptive to the operation of schools as well as the affiliated devel-opment projects that are providing material and technical assistance. The election of 2013 has been no exception. Many field offices reported that many schools had closed early, classes had been doubled up, and many activities had been delayed or abbreviated. Because the pro-ject is also working very closely with communes this year to increase their role in school sup-
IBEC Annual Report – Year 4
65
port, this activity was also adversely impacted as nearly every commune was busy during the end of the year with election campaigning for their respective political parties. As a result, many of the activities planned by Component 1 to build the capacity of CEFACs had to be delayed. Similarly, many of the advances to schools as part of their grant support could not be liquidated in a timely manner as the responsible personnel had left their posts to work in the election committees. Commune matching grants were similarly impacted. This made it very difficult for KAPE, which has primary responsibility for the administration of these grants, to close its books for the year, causing many problems in reporting to the donor.
5.7 Decision to Develop a Comprehensive Exit Strategy for All Components As IBEC gets closer to the conclusion of its support activities with only one year remaining for implementation, refining exit strategies across all components has become increasingly important. Each component has identified many strategies to sustain project inputs in a post-project environment. The following list gives some idea of the amount of thought that has already gone into the exit strategy process:
Component 1: 1. Introducing commune matching grants to put in place institutional habits in councils to see
support for educational services as part of their mandate 2. Training schools how to advocate for funds from commune councils 3. Development of Beacon Schools to act as permanent depositories of best practices developed
by the project since these schools have high levels of management and professionalism and can be counted upon to maintain these practices.
4. Organizing exposure visits to Beacon Schools to disseminate best practices to surrounding schools
5. Organizing National Workshops to Promote the Dissemination of Best Practices to other agencies in collaboration with NEP
6. Documenting empirical evidence of best practice through the development of research arti-cles each year
7. Establishing an independent social enterprise to ensure the sustainable development and dis-semination of teaching aids that are not linked to any specific project (TTS)
8. Setting up School Assistance Funds in provinces that will be resourced by sales by TTS. 9. Certification of two LNGOs through extensive capacity building inputs to that they can play a
major role in the education sector in terms of maintaining IBEC interventions with their con-tinued institutional presence in the three provinces.
Component 2: 1. Structuring the school development process by establishing a fixed three year development
cycle of grant support with transition to commune council mediated grants (see above) 2. Providing school grants in a way that builds local ownership of the activities by promoting
stakeholder-driven planning 3. Organizing Sustainability Planning in all schools to help them to prioritize the most success-
ful activities and identifying external and internal resources accordingly. 4. Training schools how to advocate for resources from local government (i.e., commune coun-
cils) 5. Linking Community Teachers with the local recruitment of teachers in communes with se-
vere teacher shortages who can study at PTTCs with scholarship support and return to their communes of origin upon completion of their studies with state salaries in order to sustainably replace Community Teachers.
6. Building the capacity of student councils to maintain libraries, WASH facilities, life skills education, and lab facilities.
Component 3
1. Building the capacity of School Support Committees to increase their role in ensuring ac-countability for school performance, especially reading.
2. Building the capacity of school administrators in planning, fund raising, and quality con-trol through a certificatory course in school management.

IBEC Annual Report – Year 4
66
3. Providing grants to poor families that enable them to link life skills education with activities at home that generate income for the family.
Component 4 1. Advocacy with ADB to incorporate life skills education and career resource persons into the
School-based Enrichment Program. The former Chief of Party advocated actively for this with the Ministry during a consultancy and MoEYS has accepted these recommendations as laid out in the Design Recommendations Report
2. Establishment of Life Skills Demonstration Sites in three new provinces to promote an in-cremental and more practical approach to life skills expansion in new areas.
3. Agreement from Ministry for formal approval of 30 life skills manuals. 4. Design and implementation of Life Skills Innovation Grants that enable schools to sustain
life skills activities 5. Development of Science Education manual that links suggested experiments (identified in
the state curriculum) with materials easily available in the local environment. 6. Design and implementation of Computer Labs that are energy self-sufficient and low
maintenance 7. Successful advocacy with ADB for adoption of Computer Lab model in the EEQP Project 8. Training of Computer Teachers in trouble shooting and computer maintenance
In all, IBEC has identified over 25 exit strategies for different activities to ensure that as the project reaches a conclusion, as many activities as possible will continue in a post-project en-vironment. World Education and KAPE plan to develop a more detailed statement and expla-nation of these strategies in a comprehensive Exit Strategy Document during Year 5 imple-mentation.
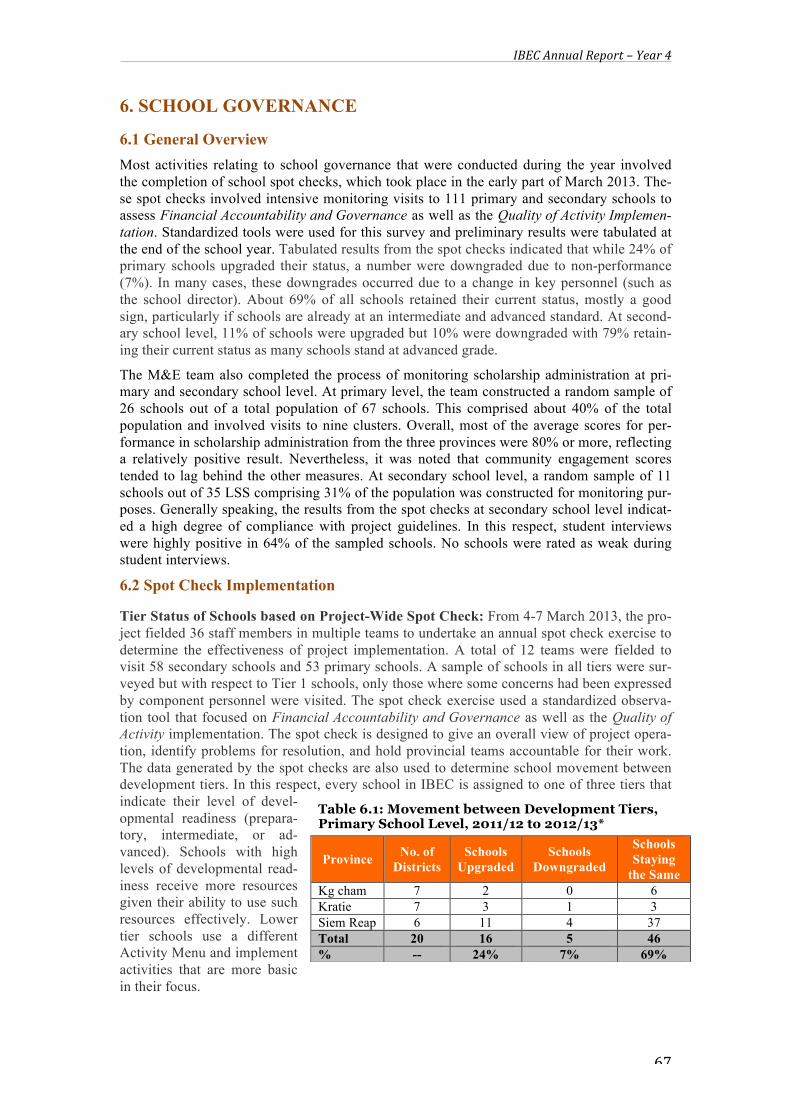
IBEC Annual Report – Year 4
67
6. SCHOOL GOVERNANCE
6.1 General Overview Most activities relating to school governance that were conducted during the year involved the completion of school spot checks, which took place in the early part of March 2013. The-se spot checks involved intensive monitoring visits to 111 primary and secondary schools to assess Financial Accountability and Governance as well as the Quality of Activity Implemen-tation. Standardized tools were used for this survey and preliminary results were tabulated at the end of the school year. Tabulated results from the spot checks indicated that while 24% of primary schools upgraded their status, a number were downgraded due to non-performance (7%). In many cases, these downgrades occurred due to a change in key personnel (such as the school director). About 69% of all schools retained their current status, mostly a good sign, particularly if schools are already at an intermediate and advanced standard. At second-ary school level, 11% of schools were upgraded but 10% were downgraded with 79% retain-ing their current status as many schools stand at advanced grade.
The M&E team also completed the process of monitoring scholarship administration at pri-mary and secondary school level. At primary level, the team constructed a random sample of 26 schools out of a total population of 67 schools. This comprised about 40% of the total population and involved visits to nine clusters. Overall, most of the average scores for per-formance in scholarship administration from the three provinces were 80% or more, reflecting a relatively positive result. Nevertheless, it was noted that community engagement scores tended to lag behind the other measures. At secondary school level, a random sample of 11 schools out of 35 LSS comprising 31% of the population was constructed for monitoring pur-poses. Generally speaking, the results from the spot checks at secondary school level indicat-ed a high degree of compliance with project guidelines. In this respect, student interviews were highly positive in 64% of the sampled schools. No schools were rated as weak during student interviews.
6.2 Spot Check Implementation
Tier Status of Schools based on Project-Wide Spot Check: From 4-7 March 2013, the pro-ject fielded 36 staff members in multiple teams to undertake an annual spot check exercise to determine the effectiveness of project implementation. A total of 12 teams were fielded to visit 58 secondary schools and 53 primary schools. A sample of schools in all tiers were sur-veyed but with respect to Tier 1 schools, only those where some concerns had been expressed by component personnel were visited. The spot check exercise used a standardized observa-tion tool that focused on Financial Accountability and Governance as well as the Quality of Activity implementation. The spot check is designed to give an overall view of project opera-tion, identify problems for resolution, and hold provincial teams accountable for their work. The data generated by the spot checks are also used to determine school movement between development tiers. In this respect, every school in IBEC is assigned to one of three tiers that indicate their level of devel-opmental readiness (prepara-tory, intermediate, or ad-vanced). Schools with high levels of developmental read-iness receive more resources given their ability to use such resources effectively. Lower tier schools use a different Activity Menu and implement activities that are more basic in their focus.
Table 6.1: Movement between Development Tiers, Primary School Level, 2011/12 to 2012/13*
Province No. of Districts
Schools Upgraded
Schools Downgraded
Schools Staying
the Same Kg cham 7 2 0 6 Kratie 7 3 1 3 Siem Reap 6 11 4 37 Total 20 16 5 46 % -- 24% 7% 69%

IBEC Annual Report – Year 4
68
Schools may move between tiers based on their level of progress, determined in large part by the spot check results that are conducted each year. In this respect, preliminary tabulated results from the spot checks and other sources con-ducted during the quarter in-dicated that while 24% of primary schools upgraded their status, a small number (7%) were downgraded due to non-performance issues (see Table 6.1) and 46 schools stayed the same (69%). In many cases, these downgrades occurred due to a change in key personnel (such as the school director or lead teacher. About 69% of schools retained their current status, a good sign, particularly if schools are already at an intermediate or advanced standard. At secondary school level, 11% of schools were upgraded while 10% were downgraded with 79% retaining their current status (Table 6.2). Given the more intensive resource investments that occur at secondary school level, these findings at mid-year indicate that a majority of pro-ject schools are moving in the right direction. As noted above, the most common reason that schools were downgraded appeared to be linked with a change in leadership at the school, usually in the form of a new director who had less of a professional commitment to improving the school than the previous school director.
Financial Accountability and Governance Scores: During the spot check, schools were scored on performance parameters relating to Financial Accountability and Governance. The performance scores given to schools are a composite result in the areas of Financial Account-ability, School Governance and Technical Implementation. Schools tended to perform best in terms of financial management areas (only 4% scored ‘poor’) while some struggled with Governance and Activity Implementation (23% scored ‘poor’) (see Table 6.5). In addition, secondary schools scored better than primary schools (85% of primary schools scored ‘good’ or ‘satisfactory’ whereas 92% of secondary schools did so (see Tables 6.3 and 6.4). Overall, weak schools (scores of 50% or less) comprised the minority (11%), which indicates that a majority of schools are moving in the right direction.
Table 6.3: IBEC School Spot Check Results for Primary Level, Year 4
Province
Financial Management Governance All Sections Good Satisfactory Poor Good Satisfactory Poor Good Satisfactory Poor
Kg.Cham 5 3 0 3 3 2 5 1 2 Kratie 6 1 0 5 1 1 4 3 0 Siem Reap 39 10 3 23 16 13 33 11 8 Total 50 14 3 31 20 16 42 15 10 % 75% 21% 4% 46% 30% 24% 63% 22% 15%
N=67
Table 6.4: IBEC School Spot Check Results for Secondary Level, Year 4
Province Financial Management Governance All Sections Good Satisfactory Poor Good Satisfactory Poor Good Satisfactory Poor
Kg.Cham 31 2 2 16 11 8 25 7 3 Kratie 10 5 0 7 1 7 8 6 1 Siem Reap 23 6 1 17 10 3 25 3 2 Total 64 13 3 40 22 18 58 16 6 % 80% 16% 4% 50% 28% 23% 73% 20% 8%
N=80
Table 6.2: Movement between Development Tiers, Secondary School Level, 2011/12 to 2012/13*
Province No. of Districts
Schools Upgraded
Schools Down-graded
Schools Staying the
Same Kg cham 16 4 2 29 Kratie 6 0 4 11 Siem Reap 9 5 2 23 Total 31 9 8 63 % -- 11% 10% 79% *Note: Refers only to schools that were surveyed
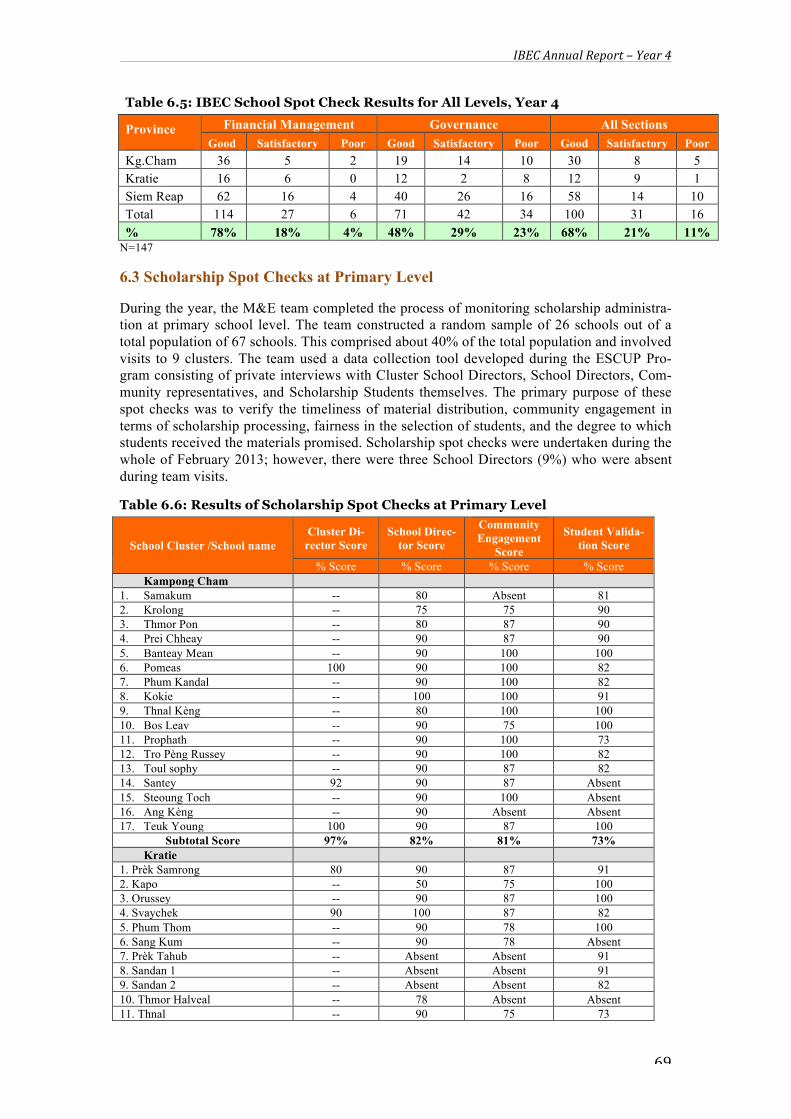
IBEC Annual Report – Year 4
69
Table 6.5: IBEC School Spot Check Results for All Levels, Year 4
Province Financial Management Governance All Sections Good Satisfactory Poor Good Satisfactory Poor Good Satisfactory Poor
Kg.Cham 36 5 2 19 14 10 30 8 5 Kratie 16 6 0 12 2 8 12 9 1 Siem Reap 62 16 4 40 26 16 58 14 10 Total 114 27 6 71 42 34 100 31 16 % 78% 18% 4% 48% 29% 23% 68% 21% 11%
N=147
6.3 Scholarship Spot Checks at Primary Level
During the year, the M&E team completed the process of monitoring scholarship administra-tion at primary school level. The team constructed a random sample of 26 schools out of a total population of 67 schools. This comprised about 40% of the total population and involved visits to 9 clusters. The team used a data collection tool developed during the ESCUP Pro-gram consisting of private interviews with Cluster School Directors, School Directors, Com-munity representatives, and Scholarship Students themselves. The primary purpose of these spot checks was to verify the timeliness of material distribution, community engagement in terms of scholarship processing, fairness in the selection of students, and the degree to which students received the materials promised. Scholarship spot checks were undertaken during the whole of February 2013; however, there were three School Directors (9%) who were absent during team visits.
Table 6.6: Results of Scholarship Spot Checks at Primary Level
School Cluster /School name Cluster Di-
rector Score School Direc-
tor Score
Community Engagement
Score
Student Valida-tion Score
% Score % Score % Score % Score Kampong Cham
1. Samakum -- 80 Absent 81 2. Krolong -- 75 75 90 3. Thmor Pon -- 80 87 90 4. Prei Chheay -- 90 87 90 5. Banteay Mean -- 90 100 100 6. Pomeas 100 90 100 82 7. Phum Kandal -- 90 100 82 8. Kokie -- 100 100 91 9. Thnal Kèng -- 80 100 100 10. Bos Leav -- 90 75 100 11. Prophath -- 90 100 73 12. Tro Pèng Russey -- 90 100 82 13. Toul sophy -- 90 87 82 14. Santey 92 90 87 Absent 15. Steoung Toch -- 90 100 Absent 16. Ang Kèng -- 90 Absent Absent 17. Teuk Young 100 90 87 100
Subtotal Score 97% 82% 81% 73% Kratie
1. Prèk Samrong 80 90 87 91 2. Kapo -- 50 75 100 3. Orussey -- 90 87 100 4. Svaychek 90 100 87 82 5. Phum Thom -- 90 78 100 6. Sang Kum -- 90 78 Absent 7. Prèk Tahub -- Absent Absent 91 8. Sandan 1 -- Absent Absent 91 9. Sandan 2 -- Absent Absent 82 10. Thmor Halveal -- 78 Absent Absent 11. Thnal -- 90 75 73

IBEC Annual Report – Year 4
70
School Cluster /School name Cluster Di-
rector Score School Direc-
tor Score
Community Engagement
Score
Student Valida-tion Score
% Score % Score % Score % Score 12. 2Thnou 70 80 Absent 91
Subtotal Score 80% 84% 81% 90% Siem Reap
1. Choug Kneas -- 60 87 73 2. Thai Syo -- 60 75 82 3. Preichhrouk 80 80 87 82 4. Athebadei 80 80 75 73 5. Svay Leu 80 70 87 82
Subtotal Score 80% 70% 82% 78% Student Validation Score Rang-
es (Number of Schools) 80 or Above Between
60-79 59 or Less Absent
Number of Schools 17 65% 4 15% 0 0% 5 19%
Overall, most of the average scores for performance in scholarship administration from the three provinces were 80% or more, reflecting a relatively positive result (see Table 6.6). Nev-ertheless, it was noted that community engagement scores tended to lag behind the other measures. Considerable importance was attached to student reporting about the materials they had received. In this respect, none of schools were found to have student validation scores that fell below an acceptable margin. In contrast, 65% of schools reported validation scores of 80 or more while 15% reported scores between 60 and 79 High scores such as this indicate that students validated claims that they had received promised materials on a timely basis. An important recurring problem found by the monitoring team related to the failure of school directors to report scholarship dropouts to the main office but rather simply replacing the stu-dent with another, without reference to project staff. To address this problem, the M&E team plans to hold a meeting with scholarship oversight staff to ensure that substitutes are regis-tered with the field offices before formalizing the replacement process.
6.4 Scholarship Spot Checks at Secondary Level
Spot checks at secondary school level were also undertaken during the year. In this respect, a random sample of 11 schools out of 35 LSS comprising 31% of the population was construct-ed for monitoring purposes. Key respondents interviewed included Local Scholarship Man-agement Committee members (LSMC), individual School Directors, Community Representa-tives, and Scholarship Students. Key criteria considered included transparency in procure-ment, fairness in student selection, responsiveness to student needs, and stakeholder engage-ment.
Generally speaking, the results from the spot checks indicated a high degree of compliance with project guidelines. In this respect, student interviews were highly positive in 64% of the sampled schools (see Table 6.7). No schools were rated as weak during student interviews. These results were very uniform across the three provinces. Nevertheless, there were some problems reported by monitoring teams that related mainly to procurement issues and inade-quate engagement by LSMC members in the way that materials are purchased. The quality of bicycles purchased centrally was also reported to be a major problem because of low price cost. These results have been shared with the Access Component for further action to increase local engagement in procurement and to address the need for widespread maintenance of the bicycles provided.
Table 6.7: Results of Scholarship Spot Checks at Lower Secondary School Level
Schools LSMC Score School Direc-tor Score
Community Engagement
Score
Student Vali-dation Score
% Score % Score % Score % Score Kampong Cham
1. LSS Sang Kèb 100 90 100 79

IBEC Annual Report – Year 4
71
Schools LSMC Score School Direc-tor Score
Community Engagement
Score
Student Vali-dation Score
% Score % Score % Score % Score 2. LSS Srètanong 100 90 100 90
Subtotal Score 100% 90% 100% 85% Kratie
1. LSS Svaychhah 80 80 78 82 2. LSS Koh Khgèr 90 90 75 91
Subtotal Score 85% 85% 77% 87% Siem Reap
1. USS Samponpheap 90 90 Absent 2. LSS Samaky 90 80 85 73 3. LSS Krabeiriel 90 90 78 100 4. LSS Bouyong Don Keo 90 80 78 87 5. LSS Kok Kandal 80 80 87 91 6. LSS Romdul 80 80 87 Absent 7. USS Svayleu 80 80 87 91
Subtotal Score 86% 83% 84% 88% Student Validation Score Ranges
(Number of Schools) 80 or Above Between
60-79 59 or Less Absent
Number of Schools 7 64% 3 27% 0 0% 2 18%
IBEC Annual Report – Year 4
72
7. CONCLUSIONS 7.1 General Observations Key Achievements and Milestone Events: The IBEC Project continued to demonstrate a very high standard of performance during the year with the achievement of 91% of its per-formance standards across each of the four technical components. Even for the indicators where expectations were not fully met, the project is still on track to achieve length-of-project indicators by the end of the project in most cases. The project was also able to demonstrate impact on bottom-line impacts such as those relating to grade repetition and changes in edu-cational relevance, though curtailing dropout has been a stubbornly difficult problem for the project to grapple with, especially at secondary school level where performance standards were not met.
Among key milestone events, the project reported that it was able to agree with MoEYS to begin an incremental Rollout of the Life Skills Program, as opposed to pursuing less mean-ingful nation-wide replication approach. Although the project was not able to achieve the ap-proval of all curriculum products during the year, it was able to get approval of 73% of 30 life skills modules, which is a major achievement in comparison to the waiting times experienced by other agencies and projects. Another key event during the year was the successful integra-tion of school support programming into commune investment plans as a key exit strategy. In this regard, 16 communes complied with project advocacy to provide investment funds for the support of educational activities in target areas. The project also succeeded in helping another local partner, Buddhist Social Development Association (BSDA) to achieve its ac-creditation with the Committee for Cooperation in Cambodia, the national accrediting agent for NGOs in Cambodia. This achievement along with the accreditation of Kampuchean Ac-tion for Primary Education will be a lasting legacy for the project that will help build institu-tional staying power in the Education Sector for the continuation of many of the interventions piloted under IBEC, much as USAID has done previously in the Health Sector. Although the implementation of the School Management and Leadership Training Course was completed in Year 3, IBEC organized a culminating certification event presided over by the MoEYS as another milestone event during the year. Finally, it should it should be noted that the social enterprise ensuring a continuous flow of teaching aids to schools was also made completely independent of the project in Year 4. This event has not been well captured in annual indica-tors for Year 4 but will be dealt with in annual indicators formulated in Year 5. The sustained operation of this enterprise, known as Thonthean Suksa, independent of the project, will also be another lasting institutional legacy that will be having impact on schools long after the clo-sure of IBEC.
Successful Advocacy: During the year, IBEC has been able to promote significant synergies with other agencies leading to the adoption of many interventions developed by the project. These synergies have not only achieved significant knock-on effects for the funding provided by USAID but have also helped to transform the project into a key national network for dis-seminating educational innovation throughout hundreds of schools at both the primary and secondary school level. Significant examples in this respect include the adoption of the life skills curriculum by the Educational Sector Support Program III (ESDP III) supported by the Asian Development Bank, continuing adoption of thin client labs by ADB, Creative Associ-ates, and other agencies, and the recent decision by Save the Children to include IBEC’s life skills programming in its new Empowering Youth through Education program, which is a global initiative funded by SCI.
Setbacks: One of the biggest setbacks during the year was the inability of the project to achieve approval of all revised life skills manuals by the MoEYS at the beginning of the school year. To a large extent, this was out of the project’s control but has impacted negative-ly nevertheless on program implementation, mainly causing target schools to use the old un-revised manuals that were field tested during the pilot. With only six manuals remaining to be
IBEC Annual Report – Year 4
73
reviewed by the Ministry, it is hoped that the entire life skills curriculum developed by IBEC can be approved for official adoption by the Ministry early in Year 5.
Another major disappointment during the year refers to the difficulty in getting a majority of secondary schools to reduce their dropout rates from baseline levels. While targeted reduc-tions were achieved at primary school level, IBEC has struggled with stubbornly high levels of dropout at secondary school level. The main issue at secondary school is the higher age of students and the consequent higher value of their labor in the market place, which creates huge opportunity costs for staying in school. The project has also noted that intensifying eco-nomic transformations relating to the proliferation of large plantations and factories as well as increased rates of migration are exacerbating the problem. In its final year of operation, the project will continue to advocate with communities and schools to make a concerted effort to reduce dropout at target secondary schools.
7.2 Future Challenges As IBEC enters its final year, its biggest challenge will be to ensure sustained adoption of as many of its key interventions as possible. To this end, the project has developed an exit strat-egy that comprehensively brings together many elements that were originally built into IBEC’s design. This includes building institutional habits among communes to take over school grants, replacing Community Teachers with locally recruited PTTC graduates, sustain-ing IT lab operation through the use of solar powered, low maintenance equipment, and the development of local institutional partners who will use their resources and improved capaci-ty to carry on much of the work started by the project. For example, KAPE has reported that it will be incorporating the life skills curriculum into several new projects supported by the Oaktree Foundation, Save the Children, and Classroom of Hope. There are many other strate-gies as well (see Section 5.7) that IBEC will be working with its partners to ensure continued forward movement of the ideas and activities started during the project.
At the policy level, the project will continue its advocacy with the Ministry and development partners to ensure that the Ministry’s policy framework adopts and supports many of the in-novations developed during the last four years. A good start has been made with the agree-ment of the Ministry to adopt the life skills curriculum piloted in Year 3, even though the ap-proval process has taken longer than expected. The next step in this regard is to convince counterparts to adopt an incremental rollout process that is cognizant of the limited resources available for life skills education; a nationwide rollout is unlikely to be meaningful. Neverthe-less, the project can help the Ministry and schools tap into new resources that are now availa-ble for school improvement including the School Improvement Grants (SIG) that will be pro-vided by Sida for the next three years.
The project will also need to be active on other fronts to encourage other development part-ners to pick up those interventions that have been popular with the Ministry including ap-proaches to promoting ICT access (i.e., thin client technology), solving teacher shortages (i.e., Local Teacher Recruitment and PTTC scholarships), and student counseling (i.e., Career Re-source Manuals, Career Resource Persons), and empowering youth (i.e., Student Councils, Project Work, Constructivist Learning).
These tasks will set the stage for World Education and its partners during Year 5 implementa-tion and eventual project closure in 2014.