IBA - 05 omslag 06-07 Scale: 100%
177
JEROEN KUILMAN The Re-Emergence of Foreign Banks in Shanghai An Ecological Analysis
Transcript of IBA - 05 omslag 06-07 Scale: 100%

The Re-Emergence of Foreign Banks in Shanghai
An Ecological Analysis
Is China, with one of the world’s fastest growing economies, indeed
the market of high returns and quick profits as the popular press and
communis opinio seem to suggest? This book offers a more moderated
perspective. It shows, by employing theories and methods from the
field of organizational ecology, that the intricacies of the local market
might frequently have been underestimated. Based on a detailed
analysis of the re-emerging population of foreign banks in Shanghai,
it points out that as more and more foreign banks set up operations
in Shanghai, competition among them is intensifying to the extent
that it is deterring the founding of new foreign banks in Shanghai.
Foreign banks furthermore face long waiting times before they can
start providing banking services and, in addition, their profitability is
affected by the growing number of domestic banks. From a theoretical
perspective, the findings in this book add significantly to the study of
re-emerging organizational forms, the study of ecological dynamics
prior to entry into a population, and theories concerning inter-
population competition such as resource partitioning.
ERIM
The Erasmus Research Institute of Management (ERIM) is the
Research School (Onderzoekschool) in the field of management of
the Erasmus University Rotterdam. The founding participants of
ERIM are RSM Erasmus University and the Erasmus School of Econo-
mics. ERIM was founded in 1999 and is officially accredited by the
Royal Netherlands Academy of Arts and Sciences (KNAW). The
research undertaken by ERIM is focussed on the management of the
firm in its environment, its intra- and inter-firm relations, and its
business processes in their interdependent connections.
The objective of ERIM is to carry out first rate research in manage-
ment, and to offer an advanced graduate program in Research in
Management. Within ERIM, over two hundred senior researchers and
Ph.D. candidates are active in the different research programs. From
a variety of academic backgrounds and expertises, the ERIM commu-
nity is united in striving for excellence and working at the forefront
of creating new business knowledge.
www.erim.eur.nl ISBN 90-5892-096-8
JEROEN KUILMAN
The Re-Emergenceof Foreign Banksin ShanghaiAn Ecological Analysis
Desig
n: B
&T O
ntw
erp en
advies w
ww
.b-en
-t.nl
Print:H
aveka ww
w.h
aveka.nl
66
JER
OE
N K
UIL
MA
NT
he
Re
-Em
erg
en
ce o
f Fore
ign
Ba
nk
s in S
ha
ng
ha
i
IBA - 05 omslag 06-07 Scale: 100%

1
The Re-Emergence of Foreign Banks in
Shanghai: An Ecological Analysis
Jeroen Kuilman

2

3
The Re-Emergence of Foreign Banks inShanghai: An Ecological Analysis
De her-opkomst van buitenlandse banken in Shanghai:een ecologische analyse
PROEFSCHRIFT
ter verkrijging van de graad van doctoraan de Erasmus Universiteit Rotterdam
op gezag van de rector magnificus
Prof.dr. S.W.J. Lamberts
en volgens besluit van het College voor Promoties.
De openbare verdediging zal plaatsvinden op
donderdag 13 oktober 2005 om 13:30 uur
door
Jeroen Kuilmangeboren te Hoogezand-Sappemeer

4
Promotiecommissie
Promotor: Prof.dr. B. Krug
Overige leden: Prof.dr. Ch. BooneProf.dr. A.R. ThurikProf.dr. A. van Witteloostuijn
Copromotor: Dr. L. Polos
Erasmus Research Institute of Management (ERIM)RSM Erasmus University / Erasmus School of EconomicsErasmus University RotterdamInternet: http://www.erim.eur.nlERIM Electronic Series Portal: http://hdl.handle.net/1765/1ERIM Ph.D. Series Research in Management 66ISBN 90 - 5892 - 096 - 8Cover: Shanghai’s financial district, Lujiazui, as seen from the Bund. c©YangLiu/CORBIS.Print: Haveka www.haveka.nlc©2005, Jeroen KuilmanAll rights reserved. No part of this publication may be reproduced or transmittedin any form or by any means electronic or mechanical, including photocopying,recording, or by any information storage and retrieval system, without permissionin writing from the author.

5
Abstract
The substantive purpose of this dissertation is to address three important theoret-ical areas within the field of organizational ecology, namely: 1) the re-emergenceof organizational populations, 2) ecological interactions during the early stages offirm activity, and 3) the modeling of inter-population competition. It does so byexamining the evolution of the foreign banking industry in Shanghai, which has beensubject to a socio-political environment that for almost thirty years was inhospitableto foreign banks.
First, I examine the phenomenon of re-emerging organizational populations bymodeling data on organizational foundings between 1847 and 2004. Studying suchinstances of re-emergence allow us to look at processes of legitimation and identityformation under atypical conditions, processes that are fundamental to our under-standing of the evolution of organizational forms. The empirical analysis of the re-emerging foreign banking population in Shanghai after 1982 shows that a renewedlegitimation phase did not take place after the population had been largely absentfor almost three decades. The analysis, however, shows that organizational dynam-ics in an alternative social system, namely that of Hong Kong, are of paramountimportance in explaining the pattern of re-emergence in Shanghai. These resultsthus suggest moving beyond the customary approach of studying organizationalpopulations within a single social system to multiple social systems is important inunderstanding the evolution of organizational forms and their identity.
Second, I study the process by which a pre-producer or pre-operational entrantbecomes fully operational, in particular how this likelihood depends on the density ofother social actors in the environment of the potential entrant. The results indicatethat the likelihood of foreign banks in Shanghai moving from the pre-entry phase-having a representative office- to the entry-phase -obtaining a branch license- is non-monotonically dependent on the number of fully operational organizations. Results
v

6
vi ABSTRACT
also show that there is a negative effect on the transition process of the number ofother potential entrants, but this effect is only visible on a more limited geographicalscale. In addition, the findings suggest that the potential entrant’s magnitude ofcapabilities affect the likelihood of entry, while the nature of these capabilities seemsto affect the timing of entry.
Third, in this dissertation I ecologically model inter-population competition. Inline with a reversal of the ’resource partitioning’ process such effects can be linkedto decreasing concentration. However, an alternative explanation is provided bythe notion of competitive exclusion. According to this principle, one populationsimply outcompetes another population by means of its size or numbers. Usingevent-history methods to analyze the time-to-profitability of the foreign banks inShanghai, it is shown that - in this particular context - both explanations can beused to account for the sub-optimal performance of the foreign banks in Shanghai.These results suggest that in a transitioning economy such as China, the mass,density and concentration of the organizations occupying positions in the marketcenter all respond in an interrelated manner to the transition process.
Taken together, these results reveal some of the intricacies of the Shanghai mar-ket and how these have affected the overall re-emergence of foreign banks in Shang-hai.

7
Acknowledgements
First of all, I wish to thank my principal adviser and promotor Barbara Krug forher always supportive demeanor towards my work, for her confidence in me, andfor setting an excellent example in teaching and of rigor in academic research. Icouldn’t have wished for a better training during my time as a doctoral student.
I also wish to express my deep gratitude to my second adviser and co-promotorLaszlo Polos, whose guidance and advice has always been valuable, intellectuallystimulating and encouraging.
I am indebted to Christophe Boone, Glenn Carroll, Michael Hannan, GeorgeHendrikse, Roy Thurik, and Arjen van Witteloostuijn, who, despite their busy sched-ules, kindly agreed to be members of my committee.
Special thanks to Michael Hannan who generously allowed me to participate inhis doctoral course ’Organizations and Environments’ at Stanford University in thespring of 2004.
Special thanks also to Jiatao Li who collaborated with me on Chapter 5, andallowed me to learn from his experience and expertise in the meantime. Jiatao’sthoughtful comments helped me to improve my dissertation substantially.
I am also grateful to Howard Aldrich, Christophe Boone, Tai-Young Kim, DavidMcKendrick, Gabor Peli, Ivar Vermeulen, Lihua Wang, Arjen van Witteloostuijnand seminar participants at the University of Durham and the Hong Kong Universityof Science and Technology for valuable comments and advice. I especially wish tothank Christophe Boone for commenting on my research proposal during the earlystages of my doctoral studies. During my three-month research visit to Shanghai Ihave received the help of many people, in particular Celine Wang who helped mewith getting access to Chinese source materials and translating them.
I gratefully acknowledge the financial support of various institutions, in partic-ular the Netherlands Organization for Scientific Research (NWO), the Vereniging
vii

8
viii ACKNOWLEDGEMENTS
Trustfonds of Erasmus University Rotterdam, the Department of Organization andPersonnel Management at RSM Erasmus University, and the Erasmus Research In-stitute of Management (ERIM). In particular, I wish to thank Dicea Jansen andMyra Lissenberg for administrative aid.
Finally, I wish to thank my friends and family for reminding me to always putthings in the right perspective and appreciate the truly important things in life, andlast but certainly not least, Barbara, for her patience, love and support during thelast four years.

9
Contents
Abstract v
Acknowledgements vii
1 Introduction 1
1.1 Motivation . . . . . . . . . . . . . . . . . . . . . . . . . . . . . . . . 3
1.2 Major Theoretical Issues . . . . . . . . . . . . . . . . . . . . . . . . . 6
1.3 A Reader’s Guide . . . . . . . . . . . . . . . . . . . . . . . . . . . . . 8
2 Historical Background 11
2.1 British Monopoly . . . . . . . . . . . . . . . . . . . . . . . . . . . . . 11
2.2 Expansion of International Banking . . . . . . . . . . . . . . . . . . 15
2.3 Demise of Foreign Banks . . . . . . . . . . . . . . . . . . . . . . . . . 17
2.4 Re-emergence of Foreign Banks . . . . . . . . . . . . . . . . . . . . . 20
3 Data and Methods 25
3.1 Primary Data Sources . . . . . . . . . . . . . . . . . . . . . . . . . . 25
3.2 Analysis of Founding Rates . . . . . . . . . . . . . . . . . . . . . . . 27
3.3 Analysis of Transition and Profitability Rates . . . . . . . . . . . . . 29
3.4 Size-Localization Measure . . . . . . . . . . . . . . . . . . . . . . . . 32
3.5 Model Estimation and Comparison . . . . . . . . . . . . . . . . . . . 35
4 Re-emergence after a Period of Dormancy 37
4.1 Periods of Dormancy . . . . . . . . . . . . . . . . . . . . . . . . . . . 37
4.2 Theoretical Interpretations . . . . . . . . . . . . . . . . . . . . . . . 40
4.3 Non-local Persistence of Forms . . . . . . . . . . . . . . . . . . . . . 42
4.4 Hong Kong versus Shanghai . . . . . . . . . . . . . . . . . . . . . . . 45
ix

10
x CONTENTS
4.5 Variables . . . . . . . . . . . . . . . . . . . . . . . . . . . . . . . . . 504.6 Results . . . . . . . . . . . . . . . . . . . . . . . . . . . . . . . . . . . 534.7 Discussion . . . . . . . . . . . . . . . . . . . . . . . . . . . . . . . . . 59
5 Waiting Times and Pre-Entry Activity 65
5.1 Why Study Pre-Entry Activity? . . . . . . . . . . . . . . . . . . . . . 655.2 Theoretical Background . . . . . . . . . . . . . . . . . . . . . . . . . 675.3 Hypotheses . . . . . . . . . . . . . . . . . . . . . . . . . . . . . . . . 705.4 Empirical Context and Variables . . . . . . . . . . . . . . . . . . . . 785.5 Results . . . . . . . . . . . . . . . . . . . . . . . . . . . . . . . . . . . 845.6 Discussion . . . . . . . . . . . . . . . . . . . . . . . . . . . . . . . . . 91
6 De-Partitioning and Competitive Exclusion 95
6.1 Competition with Domestic Banks . . . . . . . . . . . . . . . . . . . 956.2 Reversed Resource Partitioning . . . . . . . . . . . . . . . . . . . . . 996.3 The Principle of Competitive Exclusion . . . . . . . . . . . . . . . . 1046.4 Variables . . . . . . . . . . . . . . . . . . . . . . . . . . . . . . . . . 1066.5 Results . . . . . . . . . . . . . . . . . . . . . . . . . . . . . . . . . . . 1096.6 Discussion . . . . . . . . . . . . . . . . . . . . . . . . . . . . . . . . . 114
7 Conclusion 119
7.1 Summary of Main Findings . . . . . . . . . . . . . . . . . . . . . . . 1197.2 Appraisal and Generalizability . . . . . . . . . . . . . . . . . . . . . 1227.3 Future Research Directions . . . . . . . . . . . . . . . . . . . . . . . 124
Appendix 127
References 135
Summary in Dutch 151

11
List of Figures
2.1 Number of foreign banks in Shanghai, 1847-2004 . . . . . . . . . . . 132.2 Number of exits of foreign banks in Shanghai, 1847-2004 . . . . . . . 142.3 Number of entries of foreign banks in Shanghai, 1847-2004 . . . . . . 17
3.1 Measures of size-localization . . . . . . . . . . . . . . . . . . . . . . . 34
4.1 Number of foreign banks in Hong Kong vs. Shanghai, 1845-2004 . . 464.2 Number of sub-branches per bank in Hong Kong, 1954-1972 . . . . . 484.3 Number of foreign banks founded in Shanghai (by origin), 1982-2004 49
5.1 Number of representative offices and branches of foreign banks inShanghai, 1982-2004 . . . . . . . . . . . . . . . . . . . . . . . . . . . 78
5.2 Transition rate from representative office to branch office, dependenton the duration of the organizing period and the extent of multina-tionality . . . . . . . . . . . . . . . . . . . . . . . . . . . . . . . . . . 85
6.1 Number and mass of domestic banks in Shanghai, 1990-2002 . . . . 976.2 Concentration of domestic banks in Shanghai, 1990-2002 . . . . . . . 986.3 De-concentration in a two-dimensional resource space . . . . . . . . 102
xi

12

13
List of Tables
2.1 Deregulation of the foreign banking industry in Shanghai, 1980-2006 23
4.1 Descriptive statistics and correlations . . . . . . . . . . . . . . . . . . 534.2 ML estimates of effects on the founding rate of foreign banks in Shang-
hai, 1847-1948 . . . . . . . . . . . . . . . . . . . . . . . . . . . . . . . 544.3 ML estimates of effects on the founding rate of foreign banks in Shang-
hai, 1982-2004 . . . . . . . . . . . . . . . . . . . . . . . . . . . . . . 554.5 ML estimates of effects on the founding rate of foreign banks in Hong
Kong, 1845-2004 . . . . . . . . . . . . . . . . . . . . . . . . . . . . . 58
5.1 Descriptive statistics and correlations . . . . . . . . . . . . . . . . . . 835.3 Piece-wise exponential models of the transition rate from representa-
tive office to branch office in Shanghai, 1990-2004 . . . . . . . . . . 87
6.1 Descriptive statistics and correlations . . . . . . . . . . . . . . . . . 1096.2 Weibull models predicting the profitability rate among foreign banks
in Shanghai, 1990-2002 . . . . . . . . . . . . . . . . . . . . . . . . . 111
xiii

14
15
1
Introduction
In the last twenty-five years, Shanghai has experienced a rapid inflow of foreignbanks. While only four ’quasi-foreign’ banks were present in Shanghai in the early1980s (banks such as the Hong Kong and Shanghai Banking Corporation (HSBC)),this number grew to over one hundred foreign banks after 1997. To many casualobservers, this may not seem surprising given the fact that this city has been receiv-ing the lion’s share of foreign direct investment (FDI) in China and accounts for alarge proportion of foreign trade, both of which increased substantially after Chinaembarked on its open door policy in the early 1980s. In 2004 for instance, Shang-hai, with a population of only 1.3 percent of China’s total population and a landarea of only 0.1 percent, accounted for more than ten percent of the total level ofFDI in China with a similar share of China’s total level of foreign trade, more thanany other city in China. Foreign enterprises have also come to play an importantrole in Shanghai’s local economy: foreign invested enterprises accounted for almostforty-eight percent of Shanghai’s gross industrial output in 2003.
There are some interesting features however that warrant closer analysis of therapid entry of foreign banks into Shanghai. One of these is that foreign directinvestment and the inflow of foreign banks into Shanghai are certainly not newphenomena. The history of foreign banking in Shanghai dates back to 1847, when thefirst international bank established its presence in this city. Much later, in the 1920sand 1930s, Shanghai developed into one of Asia’s main financial centers: Shanghaioutcompeted other financial centers in the region such as Hong Kong, Singapore,and Tokyo. Shanghai’s development as a financial center was stimulated by thefounding of many modern-style Chinese banks along with industry associations and
1
16
2 1. INTRODUCTION
a stock exchange. Shanghai’s main boulevard, the ’Bund’, at the time housed arelatively large number of foreign financial institutions and was widely referred to asthe ’Wallstreet of the Orient’. The city’s industrial identity in this period becameindelibly linked with banking and finance, and part of this identity may well haverevived during the re-emergence of foreign banks in Shanghai.
Another interesting feature is that the long-established link between banking,on the one hand, and Shanghai on the other, is seemingly not translating itselfinto successful performance of individual foreign banks in Shanghai. As statisticaldata shows, foreign banks have only been able to capture a marginal share of theChinese market (estimated at a meagre 1.2 percent at the end of 20021). This seemsto run counter to voices in communis opinio and contemporary popular press (e.g.Flannery 1997; Graham 2000; Yeh 1996) heralding the growth potential of Shanghaiand China at large. In contrast, the evidence based on the analysis of foreign banks,as presented in this dissertation, points out some difficulties associated with marketentry in this particular environment. Consider for instance the following findings.
• Chapter 4 shows that as more and more foreign banks set up operations inShanghai, competition among them is intensifying. In fact, this is deterring thefounding of new foreign banks in Shanghai: as the current ’carrying capacity’ ofthe market seems to have been reached, the local market is getting increasinglycrowded, making it less attractive for other banks to enter this market. Inaddition, as Chapter 6 shows, extant foreign banks in Shanghai also sufferfrom this crowded market as evidenced by their depressed profitability rate.
• Only a subset of the international banks that establish a presence in China,are allowed to generate profits in the local market. Foreign banks generallystart their operations in Shanghai with a small representative office, which isonly allowed by authorities to conduct non-profit oriented services, such asgathering market information. After a mandatory waiting time in China ofat least two years, the bank may get access to the local market, but over theperiod from 1990 to 2004 less than thirty-three percent has succeeded in doingso (Chapter 5).
• As both the number and aggregate size of domestic banks increase, and thesebanks gradually move towards the peripheral areas of the market, domestic
1People’s Bank of China’s Quarterly Statistical Bulletin.

17
1.1. MOTIVATION 3
banks increasingly engage in competition with foreign banks. The result ofthis increased competition between a growing population of domestic banksand the more peripheral foreign banks in this increasingly de-concentratedmarket is a depressed profitability rate of foreign banks in Shanghai (Chapter6).
These findings suggest that, although the city has experienced rapid growthrelative to other financial centers such as Hong Kong, the intricacies of the Shanghaimarket and the Chinese market at large might frequently be underestimated, leadingto suboptimal performance of foreign banks.
1.1 Motivation
This dissertation is based on a project that grew from the ambition to apply theecological framework (Hannan and Freeman 1977, 1989; Carroll and Hannan 2000)to organizational dynamics in a Chinese context. Doing so could matter in novelways since, to date, only scant ecological research has been conducted in this par-ticular environment (but see Kim and Delios 2003; Li, Yang, and Yue 2005; Krugand Polos 2004). The value of this type of research not only lies in the general-izability of some of organizational ecology’s earlier findings. More importantly, italso provides us with a unique opportunity to test some important theoretical issues(see below). This opportunity is unique given the idiosyncratic features of the Chi-nese business environment. China’s modern history is characterized by continuoussocial and political change and its institutional environment has historically movedbetween extremes. For instance, while in the 1920s and 1930s, China proved tobe a fertile ground for a variety of organizational forms, several decades later thatsame environment could be characterized as inhospitable to many of these forms.Today, diversity is again gradually increasing but with a degree of unpredictabilityand uncertainty incomparible to other transitional economies (Krug 2004; Krug andPolos 2004). The combination of strong historical path dependencies, a relativelyslow pace of deregulation, and the legacy of a fragile system of state-owned enter-prises provides a setting that is exceptional relative to other settings studied beforein organizational ecology.
Organizational ecology is a field of research that builds on insights from a vari-ety of disciplines -economics, sociology, and biology- and has a strong demographic

18
4 1. INTRODUCTION
character. Empirically, it concentrates on the modeling of the so-called vital rates oforganizations, including founding rates and survival rates, using longitudinal data onpopulations of organizations. Theoretically, these modeling efforts help researchersto address such issues as the consequences of organizational change, the age andsize dependence of organizational failure, the effect of the presence of competitorson organizational vital rates, and the evolution of organizational forms. The the-oretical framework that forms the basis of these modeling efforts has earlier beenapplied to organizational populations in a wide range of transitioning economies,from newspapers in Bulgaria (Dobrev 1997) and construction companies in Russia(Suhomlinova 1999) to political parties in Hungary (Peli 1999), strengthening theconfidence that organizational ecology can be applied in a Chinese context as well.
Why study banks? First of all, banks constitute a social form of great impor-tance. Sociologists, ever since the earliest approaches to financial markets and money(Marx 1964; Simmel 1978; Weber 1978), have conceptualized banks as key interme-diaries in a system of ongoing social interactions and exchange relations (Freeman,Audia, and MacGregor 2005; Keister 2002). In such a central position, banks areable to exert a strong influence on other organizational forms. As Uzzi (1999) notes,banks, through their social networks, influence the survival rates of other organi-zations and form a pivotal component in the process of economic growth. Second,banks play an important role in economic transition processes, processes that alsocharacterize the empirical context presented here. Not surprisingly, studies in eco-nomic sociology that focus on the transitional economies of Eastern Europe andChina have increasingly given attention to the dynamics of financial markets andthe role of banks during the period of transition (for an overview see Keister 2002).The third reason for focusing on banks is based on programmatic considerationswithin the field of organizational ecology. So far, ecologists have studied banks inDenmark (Lomi 2000), Italy (Lomi 1995), the United States (Banaszak-Holl 1991;Barnett, Greve and Park 1994; Barron, West, and Hannan 1998; Li 2002; Park andPodolny 2000), Singapore (Carroll and Teo 1998), and Japan (Greve 2000, 2002; Han1998). A single industry approach applied to multiple social systems using modelsthat are replicable in a variety of countries adds cumulatively to a body of researchin this area and is informative about the differences in institutional settings in whichthese banks operate. Such an approach would therefore also resonate with effortsto develop closer links between organizational ecology and institutional theory (e.g.Hannan, Polos, and Carroll 2005; Polos, Hannan, and Carroll 2002).

19
1.1. MOTIVATION 5
I have chosen to focus on foreign banks because of their particular social signif-icance. Banks, when entering a new geographical market, bring with them ideas,products and services from abroad and as such constitute an important social mech-anism spanning across national borders (cf. Bigelow, Carroll, Seidel, and Tsai 1997;Delacroix 2004; Han 1998; Hannan, Carroll, Dundon, and Torres 1995; Lomi 2000).These cultural images and ideas can provide important seeds for social change: theycould induce change in the structure of incumbent organizations and organizationalforms, but in a more extreme case they also could give rise to the emergence ofnew (hybrid) organizational forms2. It is clear that these processes are more likelyto take hold in places that are relatively hospitable to cultural images and ideasfrom abroad, such as Shanghai. As Stinchcombe (1965, 147) notes, ’organizationalforms from abroad are most generally found in metropolises, where there is extensivecommunication with other nations’.
Foreign banks as such can also be considered as a distinct organizational form inChina (cf. Hannan et al. 2005; Polos et al. 2002). Foreign banks differ from nativebanks in several important ways. From a legislative point of view, foreign banksin China are governed by a different and more restrictive set of laws than thosethat regulate the actions of local banks (Fu 1998). For instance, foreign banks havelargely been excluded from providing local currency services to domestic enterprisesin the private sector, and instead have mainly served multinational corporations (Heand Fan 2004). As a result of these different sets of regulations, the Chinese marketis highly segregated, and direct competition between foreign and local banks hasremained limited (but increasing, see Chapter 6). Foreign banks also differ from localbanks in terms of organizational structure, size (Wong and Wong 2001), corporategovernance and employment practices (He and Fan 2004, Lardy 1998). Furthermore,accounts of the Shanghai banking sector, such as those found in histories of bankingin Shanghai (Ji 2003; Tamagna 1942) as well as in contemporary media reports,invariably apply the categorization of foreign and local banks.
I have chosen to study these foreign banks from a city-level perspective, instead ofe.g. at the national level, because of the nature of the industry that will be studied:in both retail banking and to a large extent in wholesale banking as well, consumersof financial services most often opt for a bank whose office is located within rea-
2In the context of Chinese banking, one hybrid ownership arrangement that is widely expectedto emerge in the future is a dinstinct class of privately owned local banks, that resemble the foreignbanks in China in terms of their corporate governance.

20
6 1. INTRODUCTION
sonable distance. In other words, competition in this industry is a relatively localprocess when viewed at the local establishment level3, and system boundaries cantherefore be meaningfully specified at the city level. Not surprisingly, earlier eco-logical work has frequently adopted a city level perspective in analyses of bankingpopulations (e.g. Greve 2000, 2002; Han 1998; Lomi 2000). The choice for a city-level perspective also seems to be appropriate given the empirical context. China’sinstitutional environment is heterogeneous in the sense that subtle differences inbanking regulations exist between cities and regions. This may be a consequence ofthe fact that politically, much decision making power is decentralized at the localgovernment level. In addition, regions differ substantially in e.g. language, identity,and economic development. This has led Manion (1994) and Perry (1994) to con-clude that China shows a high degree of fragmentation4, that there is no localitythat is ”typical” of China and there are severe limits on the generalizability of theresults stemming from only one such locality. Needless to say, that also goes for thepresent study in which I make no claim that a study on Shanghai’s foreign bankingsector is generalizable to China as a whole. However, given Shanghai’s importancein finance and commerce and the fact that a large majority of the foreign banksare represented in this city, the findings do appear to be indicative for the overalldynamics and performance of foreign banks in China.
1.2 Major Theoretical Issues
The substantive purpose of this dissertation is to address various theoretical issues inorganizational ecology (Hannan and Freeman 1977, 1989; Carroll and Hannan 2000),namely 1) the re-emergence of organizational populations, 2) ecological dynamicsduring the pre-entry stages, and 3) de-partitioning and competitive exclusion.
• Re-Emergence of Organizational Populations. One of organizational ecology’smain theory fragments seeks to gain an understanding of the evolution of orga-
3Of course, when viewed at a more general level, banks (as aggregates of local establishments)compete with each other in national or even global markets. Competition when seen in this per-spective however still requires capturing shares of local markets (in particular when retail bankingis concerned), and thus competition remains essentially local.
4Meyer (1992) and Meyer and Scott (1992a) examined the consequences of fragmentation onvarious aspects of the organizational system, such as e.g. the administrative burden, the level ofintegration within the system (Meyer 1992) and the legitimacy of local governments (Meyer andScott 1992a).

21
1.2. MAJOR THEORETICAL ISSUES 7
nizational forms and their identity (Hannan et al. 2005; Polos et al. 2002). Ofparticular interest here are the instances in which form-defined organizationalpopulations re-emerge after having experienced a period of dormancy. Theseoccasional instances of re-emergence allow us to closely examine processes ofcognitive legitimation and identity perception, processes that are not only ofimportance to the re-emergence of populations, but also to the evolution offorms in general. Understanding the re-emergence of organizational popula-tions is therefore one of the central concerns in this theory fragment. Previousstudies that have sought to explain the re-emergence of organizational pop-ulations after a period of temporary discontinuity have focused on the localpreservation of skills and knowledge (Hannan and Carroll 1992) or a locally pre-served collective memory of the blueprints of that population (Dobrev 2001).This dissertation investigates an alternative, but not necessarily contradic-tory, explanation to the re-emergence of organizational populations, namelythe continued preservation of the organizational form outside the society inwhich the period of dormancy takes place.
• Ecological Dynamics during the Pre-Entry Stages. Recently, organizationalecology has started to explore the dynamics that not yet fully establishedorganizations are subject to prior to their entry into an organizational pop-ulation (Carroll and Hannan 2000, 339–56; Carroll and Khessina 2005; Ruef2006; Sørensen and Sorenson 2003). Known is that these pre-entry stages canhave strong implications for the population into which these organizers seekentry (Carroll and Hannan 2000; Ruef 2006). On the level of the individualorganization, ample evidence also suggests that pre-entry experiences shapesubsequent (post-entry) performance (Carroll, Bigelow, Seidel, and Tsai 1996;Klepper 2002; Klepper and Simons 2000; Ruef 2006). Particular aspects ofpre-entry activity have received scant attention however, such as issues relatedto the possible ecological interactions with both other organizers and estab-lished organizations, the duration dependence of the rate of entry into thepopulation, and issues pertaining to the identity formation of individual or-ganizers. This dissertation aims to address these issues by studying the earlystages of foreign bank activity in Shanghai.
• Reversed Resource Partitioning and Competitive Exclusion. Organizationalecology offers at least two theoretical explanations for the observation that

22
8 1. INTRODUCTION
one population is outcompeted by another population. The first is that thecompeting population can be described as a generalist type of population thatis increasingly putting pressure on a specialist population by means of a shiftin the position of these generalists in the resource space. This explanation fitsthe idea of a reversed process of resource partitioning as advanced by Dobrev(2000). The second explanation is rooted in the ’principle of competitive exclu-sion’ (Gause 1934; Hannan and Freeman 1977, 942–943) and argues that onepopulation will always be outcompeted by another in a similar resource envi-ronment (independent of shifts in the position of each of these populations inresource space). Both explanations will be examined by studying various fea-tures of the domestic banking population and their effects on the profitabilityrates of foreign banks in Shanghai.
1.3 A Reader’s Guide
This dissertation proceeds by outlining the historical background to this study inChapter 2. This historical background covers the period from 1847, when the firstforeign bank was founded in Shanghai, to the end of the observation window, 2004.The three empirical chapters in this dissertation draw upon this historical back-ground to various degrees, but still can be seen as essential reading as it providesan understanding of the complex empirical context, an empirical context that ischaracterized by a distinct institutional environment that throughout history had astrong bearing on the activities of foreign banks in Shanghai. In order to preservereadability throughout the dissertation, most technical details are set aside and in-stead discussed in a separate chapter, Chapter 3. For readers not interested in thesetechnical details, skipping this chapter should not be problematic since the empiricalchapters that follow are relatively self-contained.
As indicated, the main part of this thesis is formed by three empirical chapters.In Chapter 4, an analysis is presented of the founding rates of foreign banks inShanghai over the full observation window (1847-2004). This chapter builds on thehistorical background in Chapter 2 and the methodology that is outlined in Chapter3 (section 2). Then, in Chapter 5, the observation window is narrowed down byfocusing on the period between 1982 and 2004, the period in which foreign banksreturned to the city after an absence of almost thirty years. In particular, I study inthis chapter how foreign banks made the transition from small representative offices

23
1.3. A READER’S GUIDE 9
to fully established branches. The context of this chapter is presented in Section4 of Chapter 2, the methodology (event history analysis) is presented in Chapter3 (Section 3). A similar observation window and methodology is used in the finalempirical chapter, Chapter 6, in which the likelihood is analyzed that a foreign bankin Shanghai will become profitable, as well as how their performance is affected bythe dynamics of China’s domestic banking industry.
Chapter 7 then summarizes the three empirical chapters of this dissertation aswell as their main findings. It reflects on using the ecological approach in a Chinesecontext and comments on the generalizability of the findings. It also points out tosome directions for future ecological research.
A final note on the terminology regarding founding and entry rates: a foundingis defined here as the initial establishment of an office in Shanghai. The notion ofentry is used here to denote entry into the population of fully established banks inShanghai, i.e. banks that transition to the stage of providing a full range of bankingservices in Shanghai. Entry of this type usually takes place at a later point in timethan the initial founding event: there normally is a time lag between the foundingof a first office and the moment at which the bank starts to generate revenue. Usingthese definitions, founding rates are analyzed in Chapter 4, while in Chapter 5the transition to the entry event is examined. Chapter 6 then analyses post-entryperformance.

24

25
2
Foreign Banks in Shanghai,
1847-2004
The aim of this chapter is to provide a background that describes some of thesignificant historical events and developments that have affected foreign banks inShanghai. I discuss these events and developments in the context of four distinctphases of foreign banking in Shanghai: (1) the British hegemony in financing foreigntrade with China, 1847-1889; (2) the rise of international banking, 1890-1934; (3)decline and by and large disappearance of foreign banks from the Shanghai scene,1935-1981; and (4) the re-emergence of foreign banks in Shanghai, 1982-2004.
2.1 British Monopoly
The first presence of foreign banks in Shanghai is generally seen to be a directconsequence of the Opium War (1839-1842) between China and Great Britain. Thiswar started when China demanded an end to the British imports of opium, whichhad devastating effects on the Chinese population. Growing addiction, smugglingand official corruption led the Chinese to take active steps to cut off opium tradein June 1839. The British, who imported the goods mostly from their territories inIndia, retaliated to these attempts. British imperial forces started a series of attackson the Chinese mainland, and finally defeated China. The war officially ended in theforced ratification of the Treaty of Nanking by the Chinese government on August29, 1842. This treaty stipulated that the Chinese government had to -besides payvast sums of war indemnities and exempt Westerners from Chinese law- open up
11

26
12 2. HISTORICAL BACKGROUND
five coastal cities for foreign residence and trade. These so-called ’treaty ports’ wereCanton (Guangzhou), Amoy (Xiamen), Fuzhou, Ningbo, and Shanghai (with HongKong being ceded to Britain).
Shanghai opened for foreign trade in November 1843, and, like the other treatyports, it experienced rapid economic growth. Shanghai was particularly successfulsince it had a favorable geographical position: easy access to large silk producingareas, while also some major tea plantations were within close distance of the city(McElderry 1976). Additionally, the city is situated at the mouth of the YangtzeRiver and in this way it was in the position to benefit from the increase in shippingbetween the upstream provinces and the delta region (Bergere 1996). Later, Shang-hai’s position as a trading hub was further enhanced due to the internal disruptionsthat China experienced between 1850 and 1865, most notably the Taiping Rebel-lion1. These disruptions closed off many of the other treaty ports from the resourcesin their hinterland, but the hostilities did not spread to the city of Shanghai. As aresult, treaty ports such as Canton saw its trade in silk and tea decline and largelydiverting to Shanghai, leading to ever greater exports in these commodities throughShanghai’s port (McElderry 1976).
In the midst of the increase of trade, foreign banks were essentially needed tofunction as a mediator between Chinese and foreign merchants, to finance the im-ports and exports of these foreign firms, and to provide foreign currency exchange(Tamagna 1942). The first foreign bank that was founded in Shanghai was the Ori-ental Banking Corporation in early 18472. This British chartered bank establisheditself on Shanghai’s left riverbank, which became known as the Bund. This boule-vard, part of the so-called ’International Settlement’ in which foreign firms enjoyedextraterritorial rights, later housed many other local and foreign banks as well asother financial institutions. In 1854, the Mercantile Bank of India, London, andChina joined the Oriental Banking Corporation as it also established a branch officein Shanghai. Later, on April 3, 1865, one of the most prominent and largest foreign
1The Taiping Rebellion was one of the largest peasant upheavals in Chinese history, directed atthe educated Confucian elite. Twenty million Chinese died as a result of this Rebellion. See alsoFeuerwerker (1975), Kuhn (1978), and Nee and Peck (1975).
2Among historians there seems to be little consensus regarding the founding year of this bankin Shanghai. Authors such as Cheng (2003), McElderry (1976), and Tamagna (1942) claim itsbranch office was opened in 1848. Others, such as Hong, Wang, and Li (2003) and Ji (2003) pointout 1847 as the starting year. Here I follow the latter, based on Ji’s (2003) convincing source andargumentation. Moreover, the year 1847 is mentioned by two museums in Shanghai (the BankHistory Museum and the Bund History Museum) as the year of establishment.

27
2.1. BRITISH MONOPOLY 13
Figure 2.1: Number of foreign banks in Shanghai, 1847-2004. Totals are for De-cember 31 of each year.
banks in Shanghai’s financial history was founded: the Hong Kong and ShanghaiBanking Corporation (HSBC). By the end of 1865, the number of foreign banks inShanghai totaled eleven (see Figure 2.1), of which ten had British origins.
In 1866, these banks were hit hard by a financial crisis that erupted outsideChina, namely in London. This crisis was due to excessive speculation in shares oflimited liability companies. The so-called ’Overend-Gurney Crisis’ (named after thecompany that took a leading but disputable role in this speculation boom) led towidespread failures within and outside banking circles. Compared to merely domes-tically operating British banks, British banks with office overseas were particularlyvulnerable since the panics caused by the Overend-Gurney Crisis also led to runson the branches of these banks worldwide (Baster 1929). In Shanghai, the offices ofsuch banks as the Agra and Masterman’s Bank, the Bank of India, and the Com-mercial Bank of India were closed down as a result of heavy losses (see also Figure2.2). Of these banks, only the Agra and Masterman’s Bank was able to re-establish

28
14 2. HISTORICAL BACKGROUND
Figure 2.2: Number of exits of foreign banks in Shanghai (including failures ofjoint venture banks, and exits resulting from mergers and acquisitions), 1847-2004.
itself after the crisis. In May 1870, it re-opened in Shanghai under the name AgraBank. The Deutsche Bank opened its first office in Shanghai in 1872, however thisventure did not appear to be very successful. Silver prices declined sharply in themid 1870s, and unfortunately the East-Asian offices of the Deutsche Bank (anotheroffice existed in Yokohama) mainly had their corporate assets in silver. In 1875, theShanghai and Yokohama offices of this bank were closed down.
From 1873 to 1884, Shanghai did not experience any new foundings. In thisperiod, existing banks did seek further expansion throughout China3 (Tamagna1942). In 1885, Shanghai’s first foreign bank, the Oriental Banking Corporation,re-established itself in Shanghai as the New Oriental Banking Corporation, after itfailed a year earlier.
In the last decade of the nineteenth century, the hegemony of British foreign
3For instance, the Hong Kong and Shanghai Banking Corporation also opened offices in Xiamen(1873), in Fuzhou (1877), and in Tianjin (1881).

29
2.2. EXPANSION OF INTERNATIONAL BANKING 15
banks slowly started to erode. Towards the turn of the century, the British banksdominance became increasingly challenged by competition from banks from othernations. A new phase in Shanghai’s financial history was preluded by the entryof a consortium bank representing German interests (among the stakeholders wasthe earlier mentioned Deutsche Bank). This bank, the Deutsch-Asiatische Bank,officially opened its headquarters in Shanghai on January 2, 1890. Later, in 1893,also a Japanese bank (the Yokohama Specie Bank) established a branch office inShanghai and with the creation of the Russo-Chinese Bank in 1896, the first foreign-Chinese jointly owned bank was founded.
2.2 Expansion of International Banking
From only five foreign banks in 1889, the number of banks grew to thirteen banksin 1903. The gradual expansion of international financial institutions at the endof the nineteenth century was driven by several factors. First, China’s trade withother nations through its ports increased substantially. For instance, China’s foreigntrade with the United States went from a tonnage of 22,000 in 1890 to a tonnageof 131,000 in 1900, and to 289,000 tons in 1910. Its trade with Japan increasedfrom 219,000 tons in 1890 to a tonnage of 751,000 in 1900, and further increasedto 2,655,000 tons in 1910. Other countries experienced a similar growth in theirtrade with China (Hsiao 1974). In the midst of this growth in trade, banks becameimportant devices in organizing and financing trade at the local level. Second, for-eign banks also increasingly moved into a new line of business, which was financinggovernment projects. The number of such projects increased substantially at theend of the nineteenth century. They included setting up a railway and a telecom-munications infrastructure, and were part of an effort by the Chinese government tomodernize and strengthen the national economy. Since China at the time lacked awell developed internal capital market, foreign banks were in the position to play apivotal role in providing the Chinese government with loans4. A particularly largeexpansion in the number of loans to the Chinese government by the foreign bankscame after the Chinese-Japanese War ended in 1894. China was defeated by Japanand forced to pay heavy war indemnities. For this, they also turned to foreign banks(Cheng 2003). As a consequence of these factors, financiers in countries other than
4This contrasts with, for instance, the modernization of Japan, which was largely financed by adomestic government debt market, modeled after successful Western models (Han 1998).

30
16 2. HISTORICAL BACKGROUND
Britain increasingly experienced the disadvantages of not having a direct presencein Shanghai, such as a lack of local information (Jones 1993). Previously, countriesthat traded with China did so through British merchant banks, but there was anincreasing need to reduce this relative dependency. This pushed banks from othernations towards setting up their own branch offices in China and building up directties.
Although the business of foreign banks was affected by several social and polit-ical events that took place over time, these events did not threaten their existence.For instance, foreign bank failures did not increase substantially as a result of theRevolution in 1911 and subsequent change of regime, i.e. the founding of the Re-public of China. Also during the First World War, the number of foreign banks inShanghai remained relatively stable (although the assets of the Deutsch-AsiatischeBank were frozen in 1917, as China joined the allies). After the First World Warhowever, some European banks had to take a step back. Pre-occupied with post-warreconstruction, these banks retrenched or reduced their financial interests in Chinaby channeling funds to their home country. Nevertheless, the number of foreignbanks increased steadily in the post-war period. This growth however was largelydue to the arrival of ’new foreign financial powers’ (Ji 2003, 141-63): most notablynew American and Japanese banks. These banks basically moved into the void leftby the European banks. In 1918 alone, seven banks established a presence in Shang-hai, two of which were from the United States (the American Express Company andthe American Oriental Banking Corporation) and three from Japan (the Bank ofChosen, the Exchange Bank of China and the Shanghai Bank) (see also Figure 2.3).
In the following years, Shanghai experienced a period that is sometimes referredto as its ’golden age’ (Ji 2003). In this period, Shanghai gained a reputation amongmultinational banks as a center of international finance. Not only by the prosperityof the ever increasing number of foreign banks present in the city, but also throughthe rapid development of modern local banks and other financial institutions, such asstock exchange markets. Shanghai’s Bund, which housed many of the foreign banks,became known in this golden age as the ’Wall Street of the Orient’. By the endof 1934, the number of foreign banks reached its preliminary maximum of 33. Forcomparison, alternative financial centers such as Singapore (21 ’full-license’ banksin 1934, many of which were foreign banks, see Carroll and Hannan (2000, 23)) andHong Kong (17 foreign banks, excluding banks from mainland China) hosted a muchlower number of foreign banks. About Hong Kong, Jones (1992, 407) states that the

31
2.3. DEMISE OF FOREIGN BANKS 17
Figure 2.3: Number of entries of foreign banks in Shanghai (including joint venturebanks, and banks arising from mergers and acquisitions), 1847-2004.
city ’was essentially a smaller version of Shanghai throughout the interwar years’.However, starting in the mid-1930s, the position of Shanghai as a major finance andtrading hub slowly started to erode.
2.3 Demise of Foreign Banks
Numerous factors contributed to the decline of Shanghai’s role in international fi-nance. Starting in 1935, there was a currency crisis that resulted from shortages inthe supply of silver. Responding to this crisis, monetary reforms were introduced bythe nationalist government: among others, the silver standard was to be abandonedand the issuing of bank notes was to become the sole right of three governmentbanks (i.e. the Central Bank of China, the Bank of China, and the Bank of Com-munications). This implied a de facto shift in financial power from foreign banks,many of which issued their own notes, to the nationalist government. In addition,

32
18 2. HISTORICAL BACKGROUND
as a result of the abandoning of the silver standard, banks also had to hand overtheir silver supplies to the government. Foreign banks which previously had almostautonomously operated in the Chinese financial market, now found themselves in aposition of ’subordinate dependence’ (Tamagna 1942, 119). The onset of the Sino-Japanese War in 1937 (and the subsequent occupation of substantial parts of Chinaby the Japanese), did not have immediate consequences for the presence of foreignbanks in Shanghai, although their financing activities were hampered by a decreasein trade flows. Protected by the extraterritorial rights of the International Settle-ment, they continued their banking activities in e.g. currency exchange. In themeantime the Japanese, attempting to gain more control over China’s financial sys-tem, expanded their financial interests in the occupied territories. In May 1939, theJapanese-supported Hua Hsing Bank was established. Later, in January 1941, alsothe Central Reserve Bank of China was founded. Both the Hua Hsing Bank and theCentral Reserve Bank of China issued their own banknotes and were instrumentalin financing the expenditures of Japanese armed forces in China.
The immunity of foreign banks in the International Settlement lasted until De-cember 1940 when, immediately after the Japanese attack on Pearl Harbor, Japanesemilitary forces entered the settlement. Japanese aggressors took control of American,Belgian, British, and Dutch banks in Shanghai and turned them over to Japanesebanks, such as the Yokohama Specie Bank, for liquidation. Banks of friendly orneutral nationalities (French, German and Italian banks) continued to operate, to-gether with the Japanese banks, albeit on a more limited scale (Tamagna 1942).However, the end of the Second World War led to the closing down and confisca-tion of all Japanese and Japanese-supported banks (Ji 2003). Among them werethe Central Reserve Bank of China, the Yokohama Specie Bank, and the Deutsch-Asiatische Bank. In total, ten foreign banks had to close their banking facilities inShanghai in 1945. On the other hand, foreign banks originating from other countries(of which the branches had been liquidated at the end of 1940) started to re-opentheir branches in Shanghai again, which more than made up for the decline in thetotal number of foreign banks in Shanghai. Initially, these foreign banks hoped theycould rapidly restore their banking business including their elaborate networks ofbranches they previously maintained in mainland China. However, after it appearedthat a new Civil War (1946-1949) between the Communists and the Nationalists wasspreading across the country, and that the Communists would win the Civil War,these hopes were soon gone. The Civil War was accompanied by economic and

33
2.3. DEMISE OF FOREIGN BANKS 19
financial chaos and heavy inflationary pressure troubled the banking business inChina. For September 1947, Chang (1958) even reported a wholesale price index of4,635,700, with the first half of the year 1937 indexed at 100. As a result of theseadverse circumstances, foreign banks were never able to fully recover from the tur-bulence generated by the Second World War even though they were able to restoretheir presence.
The Communists seized formal power on October 1, 1949, and this event preludedthe end of the presence of foreign banks. An adverse economic environment combinedwith a socio-political environment in which foreign banks were seen as agents ofwestern imperialism, led to the final demise of international banking activities inthe city. In the years that followed, foreign banks disbanded their operations one byone. American banks, such as Chase Bank and the National City Bank of New York,were among the first to shut down their operations at the end of 1950, because of thetensions generated by the Korean War. A United Nations trade embargo imposed onChina in May 1951 worsened the economic climate for the remaining foreign banksin Shanghai. Banks such as the Nederlandsche Handel-Maatschappij, the BanqueBelge pour l’Etranger, and the Banque de l’Indochine all closed their branches.
In the end (i.e. by the mid-1950s), only four ’quasi-foreign’ banks were left inShanghai. From Hong Kong these were: HSBC, the Bank of East Asia, and theChartered Bank of India, Australia, and China (later to become Standard Char-tered). The Overseas Chinese Banking Corporation, incorporated in Singapore, alsodecided to remain active in Shanghai5. These four banks were granted a special legalstatus and were only permitted to provide the financial services as the governmentdetermined was necessary for China’s national economic development (MacCormac1993), in practice this resulted in a small routine business in inward remittances andexport bills. As these banks kept operating, China moved into a phase of economicisolationism.
The Sino-Japanese War, the Civil War, and several financial crises all had left adefinite mark on Shanghai. Shanghai had lost its glory as an international financial
5But even if these quasi-foreign banks wanted to leave they ran into severe difficulties. Thisis shown most clearly by the experiences of the Hong Kong and Shanghai Banking Corporation.For this bank it appeared to be problematic to sell its local assets and withdraw its funds fromthe Chinese mainland. After years of negotiation, the Chinese authorities eventually confiscatedHSBC’s prominent building on the Bund, but insisted that the branch itself remained active inShanghai. Its staff therefore moved into rented premises where it continued its (limited) businessactivities (Collis 1965).

34
20 2. HISTORICAL BACKGROUND
center and became an industrial city under heavy state control. As a result, manyof its financial functions shifted to alternative financial centers, in particular HongKong. It was especially this city that took over Shanghai’s position in the late 1950sas the main international trade and financial center in the Far East (Schenk 2001;Tian 1996).
2.4 Re-emergence of Foreign Banks
Starting in 1978, a series of steps were taken that ended China’s period of economicisolationism: a new reform program6 was introduced during the Third Plenum ofthe Eleventh Central Committee of the Chinese Communist Party in December ofthat year. The new reform policy had the aim of stimulating economic growth andto improve living standards, and included the opening up of the national economyto foreign trade and investment7. The part of the reform program with respectto foreign trade and investment became known as the so-called open-door policy.Within this open-door policy, particular emphasis was put on the role of foreignfinancial institutions. Foreign banks were in essence needed to channel funds toChina in order to stimulate economic development, but also to promote reform ofthe financial system and to foster China’s economic and financial relationships withother countries (Lees and Liaw 1996).
In 1980, the first foreign banks started to open so-called representative offices8
in China. These foreign banks, however, initially focused on expansion in citiesother than Shanghai. Beijing, for instance, attracted many representative offices inthe early 1980s. The main reason for these foreign banks to establish a presencein Beijing was that relevant organizations, such as regulatory commissions and theBank of China, were all headquartered in this city. Establishing a representativeoffice in Beijing proved to be more efficient in, for example, liaison activities. How-ever, the most important locations for foreign banks were the four Special EconomicZones (SEZs) in Southern China. The central government had provided opportuni-ties for receiving foreign investment in these selected areas, three of which were in
6For a detailed account of various aspects of the reform program, see Qian (2000).7Although the original plans made at the December 1978 meeting made no mention of foreign
investment and trade, it was announced a few days later following their publication by senior partyleader Li Xiannian (Shirk 1994).
8For a detailed description of the activities of representative offices of foreign banks see Chapter5.

35
2.4. RE-EMERGENCE OF FOREIGN BANKS 21
Guangdong and one in Fujian province. These SEZs were granted more autonomy,support in infrastructure, and tax incentives. Foreign investment projects in theseareas grew rapidly in number.
With the central government’s choice for the SEZs as the main recipients offoreign investment in the 1980s, Shanghai was put at a relative disadvantage. Tian(1996) notes that one of main reasons for not having included Shanghai in theinitial implementation of the open-door policy was the fear of political instability.In the previous decades, Shanghai had become a heavy contributor to the centralgovernment’s tax revenues (eighty-five percent of its local revenue was remitted tothe central government in the period 1958-82) and a failure of the reform policy inShanghai would greatly upset the national budget.
Nevertheless, Shanghai did see some considerable growth in the 1980s, mostnotably in the development of its financial functions. First of all, also Shanghaiexperienced the founding of new foreign banks for the first time since 1949. InDecember 1982, the Banque Nationale de Paris and the Bank of Tokyo establishedrepresentative offices in the city. In April 1984, the number of foundings experienceda new impetus by the fact that Shanghai, along with fourteen other coastal cities,was ’opened’ for foreign investment. Shanghai also started to strengthen its financialsystem in other areas. In 1986, an interbank lending market was established andin 1988, a forex swapping market was introduced. By 1989, the number of foreignbanks in Shanghai even reached 34, a figure that exceeded the highest number offoreign banks in the period before 1949 (as indicated, 33 foreign banks had a presencein Shanghai by the end of 1934).
Several limitations on entering China’s financial markets however became visi-ble after the Tiananmen Square uprising in June 1989 (MacCormac 1993). Foreignbanks adopted a wait-and-see attitude towards the Chinese market and new devel-opments progressed with great caution. The earlier boom in the entry of new foreignbanks (in the form of new representative offices) came to a halt. Moreover, the aus-terity program9(1989-1991) put in place after the Tiananmen Square uprising ledto loan defaults, and foreign banks that had already opened branches elsewhere inChina found themselves in a position in which collecting debts or enforcing guar-antees was difficult (MacCormac 1993). The aftermath of the Tiananmen Square
9This austerity program was introduced to prevent the economy from overheating. In this period,the Chinese government also attempted to re-centralize investment and financial powers (Weingast,Qian, and Montinola 1995).

36
22 2. HISTORICAL BACKGROUND
incident did turn out positively for the economic development of Shanghai. Thecentral government wanted to show to the outside world that China was still openfor investments and was continuing its reforms (Gold 1991). This accelerated theimplementation of existing plans for a new development zone for trade and financein Shanghai, more specifically in the sub-district Lujiazui (part of the suburbanPudong area in the east of Shanghai). This new financial zone was announced in1990 and opened the possibility for foreign banks to open branch offices10. In ad-dition to this initiative, other ways were explored to further enhance Shanghai’seconomic development. Investments were made in physical infrastructure (e.g. aring road bypassing the city center, public transportation, gas and water works)and overall modernization. Financial institutions were also set up in Shanghai. Forinstance, in December 1990, the Shanghai Stock Exchange re-opened for business,stimulating the growth of China’s financial market. The events in 1990 heralded aperiod of rapid economic growth.
Since 1991, Shanghai’s annual growth rates in gross domestic product (GDP)have generally started to exceed the national average: GDP growth rates reachedfourteen to fifteen percent per year between 1992 and 1995. Foreign direct in-vestment (FDI) figures also improved substantially. In 1995, Shanghai became thesecond largest region in China for attracting FDI (after the province Guangdong)(Tian 1996). This improved economic climate, together with a thriving real estatemarket and a more attractive capital market, led to a further increase in the numberof foreign banks in the 1990s. From 34 foreign banks that were present in Shanghaiin 1990, this number increased to a total of 108 foreign banks by the end of 199911.In the midst of this renewed growth, Shanghai was able to regain its status as main-land China’s main financial center, the position it had earlier occupied in the 1920sand 1930s (Lees and Liaw 1996).
Despite the increase in the number of foreign banks, their share of the Chinesefinancial market remained small; this market share has in fact decreased in thelate 1990s, from 2.5 percent in 1996 to 2 percent in 2000 and 1.2 percent at the
10Branch offices, in contrast to representative offices, are allowed to engage in profit-makingoperations, such as the granting of loans. By allowing foreign banks to open branch offices in thecity, the local government created a source of working capital and funds for the development ofPudong. For more on branch offices and how these differ from representative offices, see Chapter 5.
11A wave of mergers and acquisitions in the global banking industry, most notable among Japanesefinancial institutions, was among the main factors that caused the number of foreign banks to declineafter 1999.

37
2.4. RE-EMERGENCE OF FOREIGN BANKS 23
Table 2.1: Deregulation of the foreign banking industry in Shanghai, 1980-2006.
Date Event Business scope implications
Oct. 30, 1980 Representative Foreign banks are allowed to:offices permitted - liaison with the Bank of China
- give advice to foreign firms in China- develop business with Chinese commer-cial and trade organizations.
Dec. 1990 Upgrading to Foreign banks are allowed tobranch possible engage in profit-making operations
but prohibited to accept deposits ormake loans to private domestic enterprisesand Chinese individuals. Also restrictedto foreign currency transactions.
Dec. 31, 1996 Local currency Foreign banks can obtain a locallicenses currency license provided that they have
been profitable for two consecutive years.
Dec. 17, 2001 WTO entry China Selected foreign banks are allowed to expandtheir foreign currency business to all insti-tutions and individuals within Chineseterritory.
Dec. 17, 2003 Two years after Foreign banks with a local currencyWTO entry license are allowed to lend to and accept
deposits from private domestic enterprises.
Dec. 17, 2006 Five years after Foreign banks with a local currencyWTO entry license are allowed to lend to and accept
deposits from Chinese citizens.Private banking is also permitted.
end of 200212. To a large extent this is a result of the restrictions that foreignbanks have faced in the Chinese market. Foreign banks have throughout China’sreform era mainly been permitted to provide foreign currency services to non-Chineseindividuals and enterprises, i.e. foreign corporations and joint-ventures in China.Despite the fact that this potential customer base itself is rapidly growing, this hasnot resulted in a larger market share for foreign banks. Foreign banks thus appearto be merely peripheral players in a market that is practically dominated by large,state-owned domestic banks.
However, further deregulation of the banking system (see Table 2.1) followingChina’s accession to the World Trade Organization (WTO) in December 2001, isgenerally expected to have a substantial impact on the position of foreign banks.The accession of China to the WTO was conditional upon lifting several constraints.
12PBOC Quarterly Statistical Bulletin.

38
24 2. HISTORICAL BACKGROUND
Among others, China was to allow foreign banks to provide local currency servicesto local enterprises by the end of 2003, and to Chinese citizens by the end of 2006(i.e. five years after WTO accession). Lifting these restrictions is likely to lead to amore liberalized and competitive financial market in Shanghai.

39
3
Data and Methods
This chapter introduces the data and methods used in this dissertation. After ex-plaining the data sources, I discuss the two types of statistical methods utilized:event-count and event-history models (in Sections 3.2 and 3.3 respectively). Thischapter also introduces a new measure of size-localization in Section 3.4, a measurethat will be used in Chapter 5. It concludes with the techniques for model estimationand comparison.
3.1 Primary Data Sources
Data on the history of foreign banks in Shanghai were drawn from a variety ofpublications, publications that not only differ in organizational coverage, but alsoin temporal coverage. In general, there were two types of publications in terms oftheir temporal coverage: those on the pre-1949 period and those sources that werehelpful in mapping the post-1978 period. Unfortunately, no consistent source wasavailable that covered all banks in both periods. (Indeed, the list provided in theAppendix is likely to be the first effort in this direction.) For the pre-1949 period,two sources were particularly helpful: Tamagna (1942) and Hong et al. (2003).The precision of the dates reported in these publications and the limited extent towhich additional banks were found in alternative sources such as Ji (2003) and invarious local archives in Shanghai, provided considerable confidence in the low degreeof underinclusion of the data. This confidence was strengthened by the historicaltrajectory of banks in Singapore (Carroll and Hannan 2000, 23) which evolved witha strikingly similar pattern prior to 1949, but in somewhat lower numbers. For the
25

40
26 3. DATA AND METHODS
post-1978 period, The Bankers’ Almanac was used to compile a first ’master list’ ofall foreign banks. Although The Bankers’ Almanac is a very comprehensive source,the method of determining the timing of entry by the first listing in The Bankers’Almanac at times proved to yield inaccurate dates: sometimes the first listing inThe Bankers’ Almanac was delayed by one or two years. For this reason, the fullmaster list was checked by running through articles in Lexis-Nexis and individualbanks’ annual reports. In Chapter 4, I contrast the historical evolution of foreignbanking in Shanghai with the evolution of foreign banks in Hong Kong. For thispurpose, various local archives were consulted, including the Hong Kong CompaniesRegistry and those of the Hong Kong Monetary Authority (HKMA). The mostvaluable sources appeared to be the HKMA’s annual reports (since 1993), reportsof the Office of the Commissioner of Banking (1987-1992), and several listings suchas those published in Hong Kong Banking (1985) and the Far Eastern EconomicReview (starting in 1960). Jones (1965a, 1965b) provided detailed information onthe early history of foreign banks in Hong Kong. As in the case of Shanghai, thedegree of underinclusion is likely to be low1.
Coding efforts of the data revealed that not all foreign banks that were identifiedto have operated in Shanghai (or in Hong Kong) at one time or another, started ascompletely new ventures. Occasionally, a parent bank of an already existing ven-ture experienced an ownership change, for instance through a merger or acquisition(coded as ”2” in the Appendix), and subsequently changed its name. Althoughsometimes the motivation for such ownership changes is to gain access to particularmarkets and resources, it is unlikely that a majority of such changes are motivatedby specific local market conditions in Shanghai and are therefore considered to be ir-relevant to our analyses. For this reason, in Chapter 4, I only took into account thosebanks that started with completely new ventures. This included the limited numberof joint venture banks (coded as ”3” in the Appendix). Joint venture banks are byall standards seen as foreign banks: they fall under the regulations for foreign banks,and are treated as foreign banks in histories of banking in Hong Kong and Shanghai(Ji 2003; Jones 1965b; Tamagna 1942). This treatment of joint-venture banks is ex-
1The annual reports of the HKMA and, before that, those of the Commissioner of Bankinginclude every single bank in Hong Kong as this is the overarching regulatory institution. For theearly history of banking in Hong Kong, the list of banks in the then larger financial center Shanghaiwas used as a reference: banks listed as having a presence in Shanghai but that were not includedin the preliminary list for Hong Kong (based on Hong Kong Banking (1985), Jones (1965a, 1965b)and the Far Eastern Economic Review) were double-checked, and generated very few missing cases.

41
3.2. ANALYSIS OF FOUNDING RATES 27
tended to the two other empirical chapters, Chapters 5 and 6. Exploratory analysesdid not yield notably different outcomes when joint venture banks were excludedfrom the analysis.
In Chapter 5, the likelihood that a bank obtained a branch license is analyzed.Data on the year in which a foreign bank received a branch license were drawn fromseveral editions of the PBOC Quarterly Statistical Bulletin and was cross-checkedagainst and validated by means of the annual reports of these foreign banks.
Chapter 6 required data on the first profitable year. Data on the first year ofprofitability in Shanghai were obtained using a source not often used in ecologicalresearch: personal interviews2. Personal interviewing has the advantage that onecan probe with additional questions and gather supplemental information throughobservation (Cooper and Schindler 1998). The nature of the data needed facilitatedthe effectiveness of the interviewing technique: the first year of profitability is arather objective measure, about which respondents were not reluctant to report (incontrast to the exact amount of profits). This resulted in a reasonably high coverage:data on the first year of profitability could be secured for 41 out of the 48 foreignbanks (85 percent) that were allowed to generate profits3.
3.2 Analysis of Founding Rates
In Chapter 4, I analyze the founding rate of foreign banks in Shanghai (and theparallel development in Hong Kong). Such an analysis of foundings typically makesuse of ’count data’ (Barron 1992), i.e. data which represents counts of the numberof founding events within pre-defined periods of time. Count data has several prop-erties. Besides non-negativity and the fact that only natural numbers are relevant,in aggregated form it also tends to follow a distribution that is heavily skewed tothe right. Visual inspection of the data used in Chapter 4 confirms that all these
2The reasons being that 1) the studied firms are too numerous, making the effort time andcost-intensive or 2) many firms have usually already failed prior to the time at which the researchis conducted. Here both reasons do not apply since the population is of manageable size (N=48)and nearly all foreign banks that were in the position to generate profits (that operated in the formof a branch office) survived up to the period of the interviews (September-December 2003).
3Of course, it is not known to what extent these missing seven banks alter the results reportedin Chapter 6. However, a possible selection bias (in terms of performance) should be mitigated bythe fact that the number of missing banks is relatively low and these banks are reasonably diversein terms of e.g. country-of-origin, international experience, and size. In this respect they do notappear to be ’outliers’ compared to the banks that were included in the study.

42
28 3. DATA AND METHODS
conditions are satisfied. The Poisson regression is generally treated in ecologicalstudies as one of the main options in analyzing count data representing foundingevents (see for applications e.g. Freeman and Lomi (1994), Li (2002), Lomi (2000),Mezias and Mezias (2000), Ranger-Moore, Banaszak-Holl, and Hannan (1991), andWade (1996)). The Poisson probability plot for y number of foundings is:
Pr{Yt = yt} =e−λtτλtτ
yt
yt!(3.1)
Given the nature of the available data (in a substantial number of cases only theyear is known), events counts are aggregated by the year and, hence, τ is set equalto 1. The mean and variance are then both λ, typically specified to be:
λt = exp(β′xt) (3.2)
where β′xt is a vector of coefficients (β) and covariates (x). However, it mustbe noted that the assumption of equal mean and variance often has appeared to beproblematic in previous studies on organizational foundings. More specifically, thevariance may exceed the mean, which implies overdispersion. Overdispersion mightarise from unobserved heterogeneity in the data or from time dependence in the rate(the Poisson process assumes the rate λ to be constant within an observation periodwith a length of τ (Barron 1992)). In order to cope with possible overdispersion,the negative binomial model is used here as an alternative to the Poisson model. Inthis particular model, the variance follows a different specification:
V ar(yt) = λt(1 + αλt) (3.3)
If dispersion parameter α is equal to 0, then the negative binomial model isreduced to a Poisson model, indicating that the latter is nested in the negativebinomial model. If α is (close to) 0, the Poisson model is always preferred given thefewer number of parameters it uses. The models that are estimated here show, inmost cases, no sign of overdispersion. In models that do show overdispersion, thevalue of α is reported, indicating that a negative binomial regression is used.
43
3.3. ANALYSIS OF TRANSITION AND PROFITABILITY RATES 29
3.3 Analysis of Transition and Profitability Rates
In Chapters 5 and 6, the level of analysis shifts from the population-level to theorganization-level as the empirical analyses make use of ’event-history’ data ratherthan aggregated event-count data. Event-history analysis (e.g., Allison 1984; Tumaand Hannan 1984; Yamaguchi 1991) is suitable to analyze the probability that aparticular event takes place, taking into account the time span prior to the possibleevent. Organizational ecologists have frequently used this method in modeling or-ganizational mortality. This is an approach which in principle assumes two ’states’(Carroll and Hannan 2000): in ecological parlance the organization is either aliveor dead. The analytical approach in other words focuses on how the hazard of atransition to the state of mortality (i.e. the mortality hazard) depends on a set ofindependent variables. Occasionally, ecologists have also used event history analysisto model other important events such as, in the case of biotechnology companies, thelikelihood of an Initial Public Offering (Stuart and Sorenson 2003), the likelihoodof commencing organizational operation (Carroll and Hannan 2000, 339–56; Ruef2006; Schoonhoven, Eisenhardt, and Lyman 1990; Sørensen and Sorenson 2003), orthe likelihood that a next founding event takes place (Han 1998; Haveman, Rao,and Paruchuri 2004).
Chapter 5 focuses on the change in two other ’states’ that foreign banks have usedin the period from 1990 to 2004: the transition from the state of the representativeoffice to the ’state’ of becoming a foreign branch, the latter of which is allowed toprovide a fuller range of banking services. In order to gain insight into what drivesthis shift from representative office to branch office, event history analysis was thusapplied, with the issuing of the branch license as the event. The transition rate fromrepresentative office to branch office was defined as the probability that a foreignbank opens a branch office in Shanghai at (or shortly after) time t, given that it hasmaintained a representative office in the city up to time t.
ri(t) = lim∆t↓0
Pr(Branch in Shanghai(t + ∆t)|Rep. office in Shanghai(t))∆t
(3.4)
Since one of the issues investigated in Chapter 5 is how this transition ratedepends on the duration of the time spent as a representative office, it was imperativethat no functional form for this transition rate be chosen in advance. Instead, I

44
30 3. DATA AND METHODS
first relied on piece-wise exponential specifications which have the characteristicthat the transition rate can vary between pre-defined period segments, but remainsconstant within each period segment. In this way, no strong assumptions weremade about the shape of the transition rate, which in principle could be anything.Once, however, the piece-wise exponential specification pointed in the direction ofa particular shape, the performance of the model could be improved by seekinga (parametric) specification that captured this particular shape. The piece-wiseexponential model has the general form
ln ri(t) = αp + β′xit p = 1, ..., P (3.5)
where ln ri(t) is the transition rate; β′xit is a vector of coefficients (β) andcovariates (x) and α is a constant that is allowed to vary between pre-selectedperiods p. The piece-wise exponential specification was implemented by adding auser-defined routine (stpiece) to the statistical package STATA (Sørensen 1999).
After experimenting with several alternatives, the following division appeared toproduce the sharpest results: 〈 0,2], 〈 2,4], 〈 4,7], 〈 7,11], and periods longer than 11years. Table 3.1 depicts the results from this model, as well as for other (parametric)models such as the lognormal model,
ri(t) =1t exp[− (logt)2
2σ2 ]
σ√
2π −∫ t0
1uexp[− (logu)2
2σ2 ]du(3.6)
the log-logistic model,
ri(t) = αtγ−1(1 +αtγ
γ)−1 (3.7)
and the Gompertz model (Tuma and Hannan 1984, 220–231).
ri(t) = θeγt (3.8)
Akaike’s (1974) Information Criterion (AIC) was used to compare these different(non-nested) models. The AIC value takes into account the Log Likelihood (ln L),number of covariates (k ; here 0) used in each model, and the number of model-specific parameters (c). The AIC value is equal to -2 ln L + 2(k+c), where, inprinciple, the model with the lowest AIC value is preferred.
The piece-wise exponential model shows that the duration dependence is in-

45
3.3. ANALYSIS OF TRANSITION AND PROFITABILITY RATES 31
Table 3.1: Duration dependence of the transition rate using various specificationsa.
Piece-wiseexponentialb Lognormal Log-logistic Gompertz
0<u ≤ 2 -4.816∗∗
(0.707)
2<u ≤ 4 -3.059∗∗
(0.316)
4<u ≤ 7 -2.829∗∗
(0.277)
7<u ≤ 11 -2.516∗∗
(0.277)
u >11 -2.833∗∗
(0.577)
γ 0.432∗∗ 0.120∗∗
(0.054) (0.035)
σ 0.760∗
(0.087)
Constant 2.467∗∗ 2.449∗∗ -3.750∗∗
(0.106) (0.097) (0.279)
Log-likelihood -86.05 -81.24 -82.31 -88.91Number of parameters 4 2 2 2AIC Valueb 180.10 166.48 168.62 181.82Significance levels : † : 10% ∗ : 5% ∗∗ : 1%a Standard errors are in parentheses.b u refers to the length of the organizing period, measured in years.
deed non-monotonic and inversely U-shaped, in line with previous studies on thistransition rate (Carroll and Hannan 2000; Schoonhoven et al. 1990). The transi-tion rate appeared to rise rapidly in the early years, after which it slowly declines.It is therefore not surprising that the lognormal specification (which assumes thisspecific shape if parameter σ<1) improved greatly over the piecewise-exponentialmodel, giving a lower AIC value (166.48 vs. 180.1). The pattern also persisted inthe log-logistic specification, but this model seems to perform slightly worse than thelognormal version. The Gompertz model, which cannot handle this non-monotonic,inverted U-shaped form of the transition rate, did not improve over the log-logisticand lognormal specifications with an AIC value of 181.82. To test hypotheses 5.1 and5.2 (which only involve an investigation into the duration dependence of the rate),the transition rate was therefore estimated by means of the lognormal specification.In terms of model building, however, we reverted to the piece-wise exponential spec-ification because we were predominantly interested in the transition rate itself rather

46
32 3. DATA AND METHODS
than the waiting time to setting up a branch (for an example of this type of studysee Schoonhoven et al. (1990)). This has also been the focus of other studies of pre-entry dynamics (Carroll and Hannan 2000; Ruef 2006; Sørensen and Sorenson 2003).Studying the waiting time as a dependent variable is better served by ’acceleratedfailure time’ (AFT) models such as the lognormal and log-logistic specifications4.
In Chapter 6, the focus then shifts to branch offices only and the likelihood thatthese branches will reach the state of profitability.
µi(t) = lim∆t↓0
Pr(Profitable(t + ∆t)|Not profitable(t))∆t
(3.9)
I focused on the likelihood of profitability as a performance measure instead ofthe more conventional mortality rates because not many foreign banks in Shanghaihave failed during the span of the observation window. Table 3.2 depicts the resultsfor various functional forms of the profitability rate: two specifications discussedabove (the Gompertz model and the piece-wise exponential specification) plus theWeibull model. The Weibull model has the following specification:
µi(t) = θρtρ−1 (3.10)
The Weibull model yielded the sharpest results as evidenced by the lowest AICvalue (69.32), and was therefore used in subsequent analyses.
3.4 Size-Localization Measure
In Chapter 5, one variable is used that deserves further elaboration. This variabledescribes the distance in size between a focal organization and its competitors. Thismeasure is constructed in order to make inferences about the possible size-localizednature of processes that are related to interactions between social actors, such ascompetition and legitimation. In previous studies, a number of measures have beendeveloped to weight the effects of competition and legitimation by size. This studytook as a starting point a measure developed by Banaszak-Holl (1991), who, in herstudy of the historical development of the Manhattan banking industry, focused onthe inverse of distance: nearness. (For a measure focusing on distance, see Hannan,
4The dependent variables in both types of models are closely related, however. Shorter waitingtime to market entry is associated with a higher transition rate. Estimates of coefficients and theirstatistical significance using various models were found to be comparable in exploratory analyses.

47
3.4. SIZE-LOCALIZATION MEASURE 33
Table 3.2: Duration dependence of the profitability rate using variousspecificationsa.
Piece-wiseexponentialb Weibull Gompertz
0<u ≤ 2 -1.922∗∗
(0.289)
2<u ≤ 3 -0.659∗
(0.258)
3<u ≤ 5 -0.965∗∗
(0.354)
u >5 -1.099∗
(0.447)
γ 0.267∗∗
(0.067)
ρ 2.054∗∗
(0.233)
Constant -2.896∗∗ -2.049∗∗
(0.413) (0.280)
Log-likelihood -40.21 -32.66 -39.20Number of parameters 3 2 2AIC Valueb 86.42 69.32 80.40Significance levels : † : 10% ∗ : 5% ∗∗ : 1%a Standard errors are in parentheses.b u refers to the length of time the bank has not achieved profitability, measuredin years.
Ranger-Moore, and Banaszak-Holl (1990) or Carroll and Hannan (2000).) Thisnearness measure, based on the difference in size S between an organization i andits competitor j, is constructed as follows:
Nearnessit =∑j:j 6=i
(1 + 0.1|Sit − Sjt|)−1 (3.11)
Although Banaszak-Holl’s (1991) measure offers several advantages5 over thedistance measure initially proposed by Hannan et al. (1990), a disadvantage is thata very small difference between the size of organization j and the size of organization iis translated into substantially lower Nearnessit between these organizations , whilea subsequent increase in the difference between Sit and Sjt decrease Nearnessit onlyto a lesser extent (Figure 3.1, left panel).
5As Banaszak-Holl (1991) notes, one of the problems of the ’traditional’ measure of distance,Dit, is that it makes use of an arbitrary size window in which organizations near the limit of thesize window, but within the window, contribute heavily to the value of Dit, but those organizations

48
34 3. DATA AND METHODS
Figure 3.1: Measures of size-localization: Banaszak-Holl (1991, left) and an alter-native measure used in Chapter 5 (right).
This effect is theoretically undesirable since, in the conceptualization of, forinstance, size localized legitimation, it implies that a very small difference in sizebetween organization i and j can be equated with a substantially lower level ofcognitive legitimation of these organizations towards each other compared to the casein which i and j are of equal size. It seems unlikely that organizations which differonly marginally in size would have such a low likelihood of recognizing each other,so an alternative measure was developed for this study which takes into accountthe idea that very small differences in size between organizations i and j inducerelatively little change in the value of Nearnessit, compared to the case in which iand j would be of equal size (Figure 3.1, right panel). This measure is a Gaussianfunction of the distance between Sit and Sjt.
Nearnessit =∑j:j 6=i
exp(−(δ|Sit − Sjt|
max(Sit − Sjt))2) (3.12)
Parameter δ in this analysis was set equal to 2, since this yields a nearnessof almost zero as the difference in size between i and j approaches its maximum,meaning that, in terms of size, organization i is not near to its competitors at all.(Alternative parameterizations (δ = 1.5 and δ =2.5) were tested and did not changethe statistical significance of the final results.)
just outside the window (and thus of very similar size) contribute nothing to Dit.

49
3.5. MODEL ESTIMATION AND COMPARISON 35
3.5 Model Estimation and Comparison
To estimate the (logistic) models presented in this dissertation, the Maximum Like-lihood (ML) method is used. Through this method, the likelihood of a particularoutcome y is calculated based on an assumed distribution of that outcome and acombination of a set of model parameters, θ. These model parameters are thenoptimized through an iterative procedure for the product of individual observationsi.
n∏i=1
L(θ|y) (3.13)
As Carroll and Hannan (2000, 127-133) demonstrate, in both event-history aswell as in event-count models, the ML estimates takes the form of the well-knownoccurrence/exposure ratio from classical actuarial mathematics, i.e. the ratio of thenumber of times an event occurs and the length of time the unit(s) of analysis hasbeen exposed to the ’risk’ that the event occurs.
The (nested) models were compared using a test statistic based on the workof Haberman (1977) which parallels the likelihood ratio test of a restricted modelspecification (S2) against a less restricted specification (S1). Haberman (1977) showsthat the analogy holds even if the event count is small.
−2[lnL(S2)− lnL(S1)] ∼ χ2 (3.14)
This statistic has an asymptotic chi-square distribution with degrees of freedomequal to the difference in the number of restrictions (i.e. variables) between S1 andS2.

50

51
4
Re-emergence after a Period of
Dormancy
This chapter examines the process by which foreign banks re-entered the Shanghaimarket during the period from 1982 to 2004. Previous studies that have sought toexplain the re-emergence of an organizational population after a period of tempo-rary discontinuity have focused on the local preservation of skills and knowledge ora locally preserved collective memory of the blueprints of the organizational form towhich the population pertains. This chapter takes a different approach and investi-gates alternative explanations for the re-emergence of an organizational populationfrom the perspective of the organizational form’s continued preservation outsidethe society in which the period of dormancy takes place. Failing to find support-ing evidence for a process of re-legitimation among the re-emerging foreign banksin Shanghai, it is argued that much of the re-emergence instead can be explainedby legitimacy spillovers and niche expansion of the broader multinational bankingcommunity outside mainland China, as represented in such places as Hong Kong.
4.1 Periods of Dormancy
Contemporary organization theory has thus far depicted industrial evolution mainlyas a process of birth, growth, maturity, decline (Gort and Klepper 1982; Klepperand Graddy 1990), and - under some conditions - resurgence (Carroll 1985; Hannan1997; Ruef 2004b). Occasionally however, we encounter industries that temporar-ily go extinct, remain in dormancy for some years, and re-surface at a later stage
37

52
38 4. RE-EMERGENCE AFTER A PERIOD OF DORMANCY
(sometimes quite rapidly). The causes for such discontinuities in the evolution oforganizational populations may vary. In some cases, unfavorable regulations mighttemporarily repress particular populations, and a re-emergence might then occurwhen the regulation is lifted. In other cases, a change in the regime of a countrymight lead to the temporary extinction of whole sets of organizational populations.Totalitarian regimes might for instance prove unfavorable to many political parties,labor unions or various social movement organizations1.
Examples of ecological studies that have described such periods of temporarydormancy are those of American breweries and wineries (Carroll and Swaminathan1991; Delacroix, Swaminathan, and Solt 1989; Hannan and Carroll 1992), and ofthe Bulgarian newspaper industry (Dobrev 2001). Starting with the former, theevolution of American breweries and wineries experienced a period, known as thenational Prohibition, in which many breweries were forced to suspend operations orto move to other lines of business. During this Prohibition, which lasted from 1920to 1933, the production and sale of alcohol was forbidden as a result of the VolsteadAct. The number of breweries and wineries dropped to zero, but the annulment ofthe act caused the populations of breweries and wineries to re-emerge. Notewor-thy is that after the Prohibition (at least in case of the breweries), the number oforganizations also went back to the trend line that it was following prior to the Pro-hibition (Swaminathan and Carroll 1995). According to Hannan and Carroll (1992),many individuals still possessed the skills necessary for brewing and wine making,which made a relatively rapid re-emergence of these organizational forms possible.As soon as 1934, the number of wineries in California alone (where the majority ofU.S. wineries are located) reached a high of 804 (Delacroix et al. 1989). By the sameyear, the number of breweries in the U.S. reached 926 (Swaminathan and Carroll1995). In the Bulgarian newspaper industry, as described by Dobrev (2001) mostindependent commercial newspapers were forced to disband when Bulgaria becamepart of the Soviet Bloc in 1948. This was a result of the fact that the communistparty obtained the legal authority to publish, sell and distribute newspapers, andas such it caused a severe censorship on free press. More than forty years later, thepopulation of independent newspapers started to re-emerge again after the crum-bling of the ’iron curtain’ and the formal legalization of anti-communist opposition
1Of course, the effects of such unfavorable regulations and regimes may extend beyond thedomain of organizations. Other social forms might experience periods of dormancy as well. Becker(1982, 185–191) for instance discusses how these processes take hold on forms of art.

53
4.1. PERIODS OF DORMANCY 39
in December of 1989. Virtually non-existent in the state socialist era, an expand-ing population of independent newspapers caused the total number of Bulgariannewspapers to exceed the count of 500 in the second half of 1991 (Dobrev 1997)2.
In this chapter, I analyze the full history of foreign banks in Shanghai, a popu-lation that experienced a discontinuity of more than 30 years in the second half ofthe twentieth century. The period of dormancy, of course, started not long after theCommunist Party came to power in October 1949, and China moved into a phase ofeconomic isolationism. This situation lasted until the early 1980s, when the foreignbanking form (rapidly) re-established itself in Shanghai. Within a few years (as soonas 1989), the number of foreign banks exceeded the previous historical high of 33foreign banks (reached in 1934) and ten years later, in 1999, the number of foreignbanks in Shanghai reached a preliminary maximum of 108 foreign banks. How canwe possibly account for the speed at which the re-emergence of an organizationalpopulation, as it happened here, takes place? The occurrence of such phases ofdormancy requires a theoretical mechanism that is able to account for such periodsof discontinuity, that can explain the patterns of re-emergence after such periods,and that can be used effectively in empirical analyses. But with a few exceptions(Dobrev 2001; Hannan and Carroll 1992) little attention has been paid to provid-ing such a theoretical foundation. Existing studies, making use of organizationalecology’s theory of density dependence (Hannan and Carroll 1992) have focused onwhether or not a renewed growth of local legitimation takes place, but alternativeexplanations are lacking. This study points out to legitimacy spillovers (Bigelow etal. 1997; Delacroix 2004; Han 1998; Hannan et al. 1995; Lomi 2000) but also in-troduces another ecological theory fragment to the analysis of re-emergence, namelyniche width theory (Freeman and Hannan 1983; Hannan, Carroll, and Polos 2003;Hannan and Freeman 1977; McPherson 1983; Peli 1997), by arguing that periods ofdormancy might be caused by processes of niche contraction and expansion of thebroader organizational form. When a population in one society moves into a phaseof dormancy, the broader form withdraws itself from that society, but it may return
2Other studies have also pointed out to periods of dormancy. For instance, Carroll and Delacroix’(1982) analysis of the Argentinean newspaper industry shows that there was a phase in the earlyhistory of the industry in which temporarily no newspaper organizations existed. This period lastedroughly 2.5 years (between 1807 and 1810) and started after the first two entrants of the then newlyemerging Argentinean newspaper industry failed. A similar situation arose in the early history ofAmerican national labor unions, between 1837 and 1843 (Hannan and Freeman 1989). I interpretthese ’gaps’ however as discontinuities in the initial emergence of the form, rather than as instancesof re-emergence.

54
40 4. RE-EMERGENCE AFTER A PERIOD OF DORMANCY
by means of expansion. In doing so, the form follows the ecological ’principle ofallocation’ (cf. Levins 1968; Hannan et al. 2003; Hannan and Freeman 1977, 1989;Peli 1997). Before outlining this perspective however, I will first review existingtheoretical interpretations.
4.2 Theoretical Interpretations
Only two known studies have attempted to explicitly analyze the re-emergence oforganizations after a period of dormancy. These are Hannan and Carroll (1992, 47and 164–167) for breweries after the Prohibition, and Dobrev (2001) for indepen-dent newspapers after the legalization of anti-communist opposition. Both studiesuse arguments based on the theory of density dependence. Density dependence the-ory (as articulated in more detail by Hannan and Carroll (1992)) assumes, amongothers, an inverted U-shaped relationship between density (defined as the number oforganizations in a population, typically denoted by N ) and the founding rate of newentrants into that population (λt). Increases in density when the number of organi-zations is low facilitates the growth of cognitive legitimation (the social recognitionof that group of organizations), which in turn increases the founding rate. However,with the increase in density, also competition increases at an increasing rate, leadingto a decline in the founding rate at higher levels of density. The inverted U-shapedeffect of density on the founding rate that results from the processes of legitimationand competition is typically estimated in empirical analyses as follows:
λt = ltexp(αNt + βN2t ) (4.1)
Where α > 0 and β < 0 and where lt is the combined effect of other covari-ates. As this model suggests, the theory of density dependence in principle does notdistinguish between emergence and re-emergence as historical time and periods ofdormancy are not accounted for. Accordingly, Hannan and Carroll (1992) note thatone of the implications of this theory is that, directly after the period of dormancy(when the density of the potentially re-emerging population is still low), the theo-retical framework implies low levels of competition and low levels of legitimation. Itis especially the latter that can be subject to discussion. Is cognitive legitimationindeed low for a population that experienced a phase of dormancy, such as the brew-eries after the national Prohibition compared to the legitimation breweries had prior

55
4.2. THEORETICAL INTERPRETATIONS 41
to the Prohibition3? Hannan and Carroll (1992) indeed fail to find support for a re-newed growth in legitimation among breweries after the Prohibition, which suggeststhat legitimation did not weaken substantially during the Prohibition. They notethat the organizational form for producing beer was still well-known to potentialinvestors and consumers. Instead, they conclude that the main legitimation phasetook place in the early (pre-dormancy) history of the population. This result sug-gests that, at least when periods of dormancy are reasonably short, complete and fullhistories of organizational populations need to be analyzed in order to capture thefull effects of legitimation. Only if the period of dormancy is long enough, a renewedlegitimation phase might be necessary, and density dependence in the founding ratecan then be found by studying the post-dormancy period only.
Dobrev (2001), in his analysis of Bulgarian newspapers, indeed does considerthe possibility that a renewed legitimation phase took place after the somewhatlonger period of dormancy that affected the newspaper industry. He analyzes there-emergence process in more detail by studying the founding rate which in generalreaches a maximum at a density of
N∗λ = − α
2β(4.2)
which is basically the point at which competition comes to have a stronger bear-ing on the founding rate. This point is generally seen as the threshold at whichalready a reasonable extent of legitimation can be assumed. How this threshold, N∗
λ ,is reached is of main interest to Dobrev (2001). Dobrev’s formal analysis is basedon a comparison between legitimation processes in two periods: the pre-dormancyperiod (p1) and the post-dormancy period (p2), the latter of which in fact experi-ences a process of what Dobrev (2001) refers to as re-legitimation. As he argues,re-legitimation requires fewer organizations in p2 compared to legitimation in p1.
N∗λ,p1
> N∗λ,p2
(4.3)
Additionally, the time in which the maximum founding rate in both periods werereached (T (N∗
λ)) should be shorter in p2 than in p1.
3Hannan (1997) provides an alternative theoretical rationale (and analytical solution) for thisphenomenon by arguing that legitimation remains ”sticky”, i.e. it does not decline easily once ithas achieved a substantial level.

56
42 4. RE-EMERGENCE AFTER A PERIOD OF DORMANCY
T (N∗λ,p1
) > T (N∗λ,p2
) (4.4)
What is the intuition behind these assertions? Dobrev (2001) notes that some ofthe newly founded independent commercial newspapers seem to have had predeces-sors in the era before 1948. These newspapers made reference to their founding yearon the top of their front pages, and as such they made an ’important, albeit purelysymbolic, attempt to infer legitimacy from an organizational form that had left itslasting mark on the collective memory’ (Dobrev 2001, 439). A possible presence ofsuch a collective memory of the blueprints of the earlier pre-dormancy populationwas supported by the observation that the re-emergence of independent commercialnewspapers indeed took place in a much shorter time span: while in the late nine-teenth century, several decades were needed before newspapers were considered ataken for granted aspect of the social and economic environment, in the 1990s thisprocess only took a few months. The collective memory in such a case is basicallyinvoked and revitalized, building on the legacy and recollection of the past (Dobrev2001).
In short, Dobrev’s (2001) explanation mainly focuses on the local preservationof a collective memory that facilitated the (rapid) re-legitimation of the organiza-tional form, while Hannan and Carroll (1992) focus on the local preservation ofknowledge and skills. However, in an alternative (although not necessarily contra-dictory) view, the re-emergence of an organizational population can be seen as aproduct of processes in a broader, non-local environment (Carroll and Teo 1998).This view takes into account the continued presence of the organizational form inother societies. I will elaborate on this perspective below.
4.3 Non-local Persistence of Forms
Organizational populations occasionally disappear from particular societies, mostoften due to unfavorable regulations, policies and regimes. Such regulations, policiesand regimes can make the environment for particular organizational populations(temporarily) inhospitable. However, these populations are part of organizationalforms that typically operate in a broader environment (Hannan and Freeman 1977;Hannan et al. 1995; Polos, Hannan, and Carroll 2002). The organizational form,defined as a socially coded identity that applies to a set of organizations (cf. Polos

57
4.3. NON-LOCAL PERSISTENCE OF FORMS 43
et al. 2002), might be able to survive in other, possibly neighboring societies. Theperiod of dormancy lasts until the society that was temporarily inhospitable toan organizational form changes its regulatory environment and makes conditionsmore favorable. This could lead to the return of the organizational form previouslybanned from that society. In principle, an organizational form can move back tosuch societies either by
1. ideas and cultural images describing the form and which may stimulate thefounding of new organizations pertaining to that form, or
2. extant organizations (members of the form) which were previously active out-side that society.
The first of these two mechanisms builds on the idea that a form that appliesto (populations of) organizations operates on a broader geographical scale. Popu-lations have features that they share with populations in alternative social systems,and the diffusion of the form is facilitated by the fact that the codes describing theseforms, e.g. cultural images, information or ideas, can easily flow beyond geographi-cal boundaries (Bigelow et al. 1997; Delacroix 2004; Han 1998; Hannan et al. 1995;Lomi 2000). For example, Hannan et al. (1995) describe how the codes pertainingto the automobile form diffused among several European countries in the late nine-teenth century, giving rise to local populations of automobile producers in each ofthese countries. According to Hannan et al. (2005), this possibility becomes increas-ingly likely. They note that the possibility that a cultural code gets maintained4
in one part of a system and made available to other parts seems especially likelyin a globalized world with rapid mass communications and pervasive informationtechnology, suggesting that contemporary forms are less likely to disappear thanearlier ones. The legitimacy of the organizational form in one social system maythus help to give rise to new populations elsewhere, and international legitimacyspillovers may thus be a first mechanism by which a population can re-emerge.
The second mechanism is that the population in an alternative social systemitself expands into a social system that previously could be characterized as beinginhospitable to the organizational form. Building on ideas from organizational niche
4Maintaining such codes in other societies could either be through the instantiation in organiza-tions, or alternatively in a collective memory of social actors in another society (in line with Dobrev(2001)).

58
44 4. RE-EMERGENCE AFTER A PERIOD OF DORMANCY
width theory (Freeman and Hannan 1983; Hannan et al. 2003; Hannan and Freeman1977; McPherson 1983; Peli 1997), the perspective is taken that multinationals canloosely be defined as a set of ’generalists’ in the sense that they operate in multipleenvironments and occupy a broad geographical niche5. Being able to cope with vari-ations in resources drawn from diverse environments, adversity in one environmentdoes not necessarily lead to the demise of the complete range of multinational ac-tivities: other environments might still offer sufficient opportunities for a reasonable’fitness’.
Niche width theory has suggested that this form of adaptation to diverse environ-ments follows the ’principle of allocation’. According to this principle, organizationshave a fixed amount of adaptive capacity (cf. Levins 1968; see also Hannan et al.2003; Hannan and Freeman 1977, 1989; Peli 1997). If this principle of allocationindeed applies, then a discontinuity in one environment simply leads to the alloca-tion of attention elsewhere. The generalist in such cases is more likely to invest itsavailable resources (possibly arising from excess capacity) in other locations. How-ever, when conditions become more hospitable again, generalists might decide tore-allocate their attention to that environment, causing the re-emergence of a localpopulation.
Empirical evidence has shown that, ceteris paribus, generalist (broad niche) or-ganizations are indeed more likely to expand and contract their niches comparedto specialist (narrow niche) organizations (Dobrev, Kim, and Carroll 2002b; Kim,Dobrev, and Solari 2003; Sorenson, McEvily, Ren, and Roy 2005). For instance,Kim et al. (2003) studied, among others, the effect of niche width (measured interms of the range of engine sizes produced) on niche expansion among Italian au-tomobile manufacturers between 1896 and 1981. They find that the greater the sizeof the niche, the higher the probability of expanding the existing niche. Similarly,Dobrev et al. (2002b), in a study on US automobile producers, find that the prob-ability of entering a new market segment increases with niche width. Sorenson etal. (2005) even argue that the higher rates of expansion among broad niche, gener-alist organizations is innate to these firms: generalists have the built-in tendency tocontinuously expand to new market segments. According to this perspective, niche
5Even among organizational ecologists there exists a lack of consensus on proper definitions ofgeneralism and specialism, ranging from product range to the diversity of routines used by a firm.For this reason, Hannan et al. (2003), in their formal model of the organizational niche, drop allreference to these terms. The lack of consensus is not problematic here, since I use the notion onlyin a metaphorical sense.

59
4.4. HONG KONG VERSUS SHANGHAI 45
expansion (and possibly also contraction) are seen as a behavioral trait of generalistorganizations.
The joint process of, on the one hand, an international legitimacy spillover relatedto the form in question, and on the other hand and expansion of the population ofform members (after an earlier niche contraction), leads to the following prediction:
Hypothesis 4.1. The rate at which organizations are founded in a social systemthat was previously inhospitable to these organizations, has a positive relationshipwith the number of organizations of the same form in a neighboring social system.
In order to apply these ideas to the case of the re-emerging foreign banks inShanghai, an alternative social system needed to be selected that is 1) located justoutside the society of which Shanghai is a part 2) that is representative for the multi-national banking community at large and 3) absorbed many of the foreign bankswhen Shanghai itself experienced a period of dormancy. Given these requirements,I opted for Hong Kong6. A parallel analysis of the evolution of banking in HongKong is likely to shed light on some of the dynamics described above, and allowsus to get a fuller understanding of the (historical) factors that have influenced there-emergence of banking in Shanghai.
4.4 Hong Kong versus Shanghai
Figure 4.1 shows the historical trajectories of foreign banks in Hong Kong as well asin Shanghai. Among others, this figure shows that, in the 1920s and the early 1930s,the number of foreign banks in Shanghai initially exceeded the number of foreignbanks in Hong Kong. Shanghai was in this period a major center of internationaltrade and finance and played a pivotal role in the East Asian region. This periodwas characterized by rapid economic development and became known as Shanghai’s
6Why choose Hong Kong over alternatives such as Singapore and Tokyo? I opted for Hong Kongbecause of its relative closer geographical proximity to Shanghai, its sheer location adjacent to main-land China, and its historical importance as a financial center in serving the Chinese market. Notsurprisingly, the (competitive) relationship between Hong Kong and Shanghai is widely discussedin the literature (e.g. Jao 1997, 1998, 2004; Meyer 2004; Schenk 2001). Schenk (2003) even arguesthat an analysis of Shanghai’s financial history is incomplete without reference to Hong Kong asa rival financial center. An additional reason is that Hong Kong outcompetes both Singapore andTokyo in terms of the number of foreign banks it hosts, and therefore may be more representativefor the international banking community at large. According to figures provided by Jao (1997), thenumber of foreign banks in Hong Kong was more than the combined number of foreign banks inTokyo and Singapore in the mid-1990s.

60
46 4. RE-EMERGENCE AFTER A PERIOD OF DORMANCY
Figure 4.1: Number of foreign banks in Hong Kong vs. Shanghai, 1845-2004 (thecounts of foreign banks in Hong Kong exclude banks from mainland China).
’golden age’ (Ji 2003). At that time, Hong Kong ’was essentially a smaller versionof Shanghai’ (Jones 1992, 407). As outlined in Chapter 2, Shanghai lost its positionas East Asia’s main financial center in the late 1930s and 1940s due to a variety ofreasons. A currency crisis in 1935 was among the first indicators of the decliningrole of foreign banks in Shanghai. The Sino-Japanese War that started in 1937 alsotroubled the banking business, and with the onset of the Pacific War in late 1941,many foreign banks in Shanghai ceased operations (in particular those banks origi-nating from Allied countries had to withdraw from Japanese-controlled Shanghai).After this war, a Civil War (1945-1949) erupted in China which, together with highinflation, created little new business opportunities for those foreign banks that wereable to return to Shanghai after 1945. In October 1949, the Civil War ended andChina came under Communist Party rule. The new regime was, at best, unfavorableto the presence of the remaining foreign banks in China. Foreign banks were in theseyears seen as agents of western imperialism. By 1956, only four ’quasi-foreign’ banks
61
4.4. HONG KONG VERSUS SHANGHAI 47
were left in Shanghai (i.e. HSBC, the Bank of East Asia, the Chartered Bank ofIndia, Australia, and China, and the Overseas Chinese Banking Corporation). Bythis time, Shanghai had already lost its eminent position as Asia’s main financialcenter.
The main beneficiary of the dismantling of Shanghai was Hong Kong (Jones1992; Wong 1988). During the Civil War, Hong Kong -as a British Crown Colony-remained ’free’ from the hostilities in mainland China. This was one of the reasonswhy Hong Kong experienced an inflow of both capital and labor. Schenk (2001)notes that between 100 and 150 Shanghai businessmen had moved to Hong Kongby November 1946. Many of these entrepreneurs, part of Shanghai’s economic elite,decided to continue their businesses in Hong Kong. These entrepreneurs, such as thecotton spinners described by Wong (1988, 50–53), formerly relied on Shanghai’s fi-nancial system, but now were in the need of capital to rebuild their business in HongKong. For this they turned to the foreign banks in Hong Kong. With the growingeconomic activity and the increasing need for financial services, Hong Kong grewin importance. In 1947, the China Association reported to the British Secretary ofState for the colonies that ’Hong Kong is now a far more important place than itwas before the war, as its functions as an entrepot and port of transshipment for theforeign trade of China have greatly increased owing to the conditions prevailing inShanghai and elsewhere in China’ (Schenk 2001, 19–20). The end of the civil war inChina only strengthened Hong Kong’s position as a center for international finance.Hong Kong at that time offered several advantages, of which the most importantwere a relatively stable social and political system, as well as economic freedom. Al-though the number of foreign banks did not increase substantially in the 1950s, ’toregard this as a reliable indicator of banking development is misleading’ (Jao 1973,18). Instead Jao (1973) claims that the 1950s was a period of phenomenal growth.Foreign banks in Hong Kong started to expand their operations by increasing thenumber of branches throughout the city, a trend which also domestic banks followed(see Figure 4.2 which shows the general branch/bank ratio in Hong Kong). Laterin the 1960s, the sheer number of foreign banks in Hong Kong also started to increase.
In the early 1980s, when China embarked on its open-door policy, ending China’speriod of economic isolationism, many of the foreign banks that were present inHong Kong also opened an office in Shanghai. Closer inspection of the available

62
48 4. RE-EMERGENCE AFTER A PERIOD OF DORMANCY
Figure 4.2: Number of sub-branches per bank in Hong Kong, 1954-1972 (adaptedfrom Jao (1973)).
data reveals that, out of the 127 foreign banks7 that entered Shanghai in the pe-riod between 1982 and 2004, 108 foreign banks previously also had a presence inHong Kong, roughly equal to 85 percent. The increased importance assigned toShanghai by these foreign banks in Hong Kong, also becomes evident by the factthat Shanghai became home to an increasing number of China headquarters. Forinstance, Citibank’s China headquarters was relocated from Hong Kong to Shanghaiin 1993. In 1999, another leading bank, HSBC, moved its corporate headquarters forChina from Hong Kong to Shanghai. Although in both cases, the Hong Kong officesretained their importance as headquarters for the broader Asia-Pacific area, theseshifts illustrate a clear shift in the allocation of attention of foreign banks. Figure4.3 shows the number of bank foundings in Shanghai over the 1982-2004 time span.Striking is again that a large majority of the foreign banks founded in Shanghai alsohad a previous presence in Hong Kong, as illustrated by the black- and grey-coloredbars. It also becomes evident that until the middle of the 1990s, not a single bankmoved into the Shanghai market without first having an office in Hong Kong. Ad-ditionally, Figure 4.3 points out that some foreign banks (n=15; black-colored bars)also had a presence in Shanghai’s pre-dormancy period. All of these banks had a
7This figure excludes locally incorporated Hong Kong banks.

63
4.4. HONG KONG VERSUS SHANGHAI 49
Figure 4.3: Number of foreign banks founded in Shanghai (by origin), 1982-2004.
previous presence in Hong Kong before they returned to Shanghai and, interestinglyenough, a majority of these banks were able to be among the first batch of foreignbanks that returned to Shanghai (although also some of these banks entered laterin the 1990s).
The main argument here is that the nearby presence of many foreign banks inHong Kong should explain at least part of the rapid re-emergence and increase inthe number of foreign banks in Shanghai. In ecological parlance, the multinationalbanking community experienced a niche contraction in the late 1940s and early1950s (i.e. China became excluded from the feasible set for multinational banks),and, instead, allocated their attention to Hong Kong. The contraction was notreversed until the early 1980s when conditions in China became more favorableagain. A niche expansion phase took place, by which multinational banks regainedtheir positions in mainland China. It must be noted however that this was a nicheexpansion that was not accompanied by the abandonment of the position in HongKong: many international banks remained active in Hong Kong, but merely started

64
50 4. RE-EMERGENCE AFTER A PERIOD OF DORMANCY
to shift their attention to mainland China. In addition, banks moving into Shanghaimay have benefited from the high degree of legitimacy that foreign banks had inHong Kong. This legitimacy may have spilled over to mainland China, making iteasier for foreign banks to start ventures there as well.
This theoretical interpretation will be tested using data on both the historicaldevelopment of Hong Kong and Shanghai. Analytically, the chapter proceeds asfollows. In a first step, an attempt is made to replicate the findings of Dobrev(2001) by looking only at the city that experienced a phase of dormancy, Shanghai.Dobrev’s (2001) study is chosen as a starting point since that context resemblesthe empirical context presented here both in terms of the cause of the period ofdormancy (state socialism) as well as in the length of period of dormancy. Then, ina second step, the main alternative financial center to Shanghai (i.e. Hong Kong)is included in order to investigate how the presence of foreign banks in this cityaffected the re-emergence of foreign banks in Shanghai.
4.5 Variables
The main dependent variable in the first analytical step is the founding rate8 offoreign banks in Shanghai. As mentioned in Chapter 3, only new ventures of foreignbanks are included in the analyses; ’new’ ventures that result from a merger or anacquisition are not. This brings the total number of founding events to 211, with134 foundings taking place in the period from 1982 to 2004.
The main variables of interest are the density measures, i.e. variables that rep-resent the number of foreign banks in both Shanghai as well as in Hong Kong. Inline with density dependence theory (Hannan and Carroll 1992) and equation 4.1,density measures are accompanied by a second order, squared version to account fornon-monotonic effects and all variables are lagged one year. For both populationsstudied, I have also tested interaction effects with first and second order effects ofthe time since the founding of the population’s first organization (cf. Hannan 1997),however adding these interaction effects did not significantly improve the modelsand were therefore omitted. For the analysis of bank foundings in Shanghai after1982, also the number of domestic banks in Shanghai was included as an alternative
8The method of analyzing founding rates in order to get insight into the process of form emer-gence has earlier been adopted by McKendrick, Jaffee, Carroll, and Khessina (2003) in a study ofdisk array producers between 1986 and 1998.

65
4.5. VARIABLES 51
source of legitimacy from which foreign banks may have benefited, in addition tothat possibly generated by foreign banks in Hong Kong. The population of domesticbanks in Shanghai may have signaled the legitimacy of banking in this particularlocation, in turn facilitating the entry of foreign banks into Shanghai. Aside fromthe density measures, the following covariates are included in the empirical analysis:
Period Effects. Since obtaining consistent and reliable statistics over the fullrange of the observation window proved to be a sheer impossible effort in this specificcontext, I relied on period effects in capturing the more significant environmentalchanges affecting foreign banks. In line with previous analyses of e.g. Banaszak-Holl (1991) and Hannan et al. (1995), overlapping period effects were used in orderto create a piece-wise constant model in historical time. In this specification, thebaseline founding rate is basically the sum of the constant term and the effect of aparticular period plus all previous periods (Hannan et al. 1995). The first periodstarts with the onset of the observation window, 1847. In this year, the first foreignbank in Shanghai was founded, the British chartered Oriental Banking Corporation.This event preluded a period in which British banks maintained a dominant positionon the Shanghai financial market. The second period starts with the founding of oneof the first non-British banks, the Deutsch-Asiatische Bank in 1890, after which alsobanks from other nations rapidly started to enter the Shanghai scene (introducingmore competition in the market). The third period starts after the First World Warin 1918, when Shanghai started to become an international center for commerceand finance. The fourth period starts in 1935, when an economic crisis disruptedthe financial market and (as mentioned above) new monetary reforms changed theposition of foreign banks. As indicated, it was in this period that Shanghai startedto lose its position as the main financial center of East Asia. In the analysis for the(post-dormancy) period from 1982 to 2004, I used an additional period effect rangingfrom 1998 to 2004. This period effect was added to account for the consequences oftwo important events that took place during 1997: 1) Hong Kong lost its status asa British Crown Colony and became part of the People’s Republic of China as ofJuly 1, 1997, and 2) the Asian Crisis took place which disrupted the entire region,in particular Hong Kong. Unfortunately, there is no way to disentangle these twoevents in the empirical analyses.
End of World War II. As described in Chapter 2, at the end of the SecondWorld War, foreign banks (other than the Japanese or Japanese-supported banks)re-opened their offices in Shanghai. In total, twelve foreign banks started their

66
52 4. RE-EMERGENCE AFTER A PERIOD OF DORMANCY
operations in 1945, all of which were also active prior to the war. To control for this’artificially’ high number of new entrants, a dummy variable was added for the year1945.
Lagged Foundings. The number of foundings in the previous year was also addedto the models, since many previous studies (e.g. Carroll and Huo 1988; Delacroixand Carroll 1983; Delacroix and Solt 1988; Hannan et al. 1995; Hannan and Freeman1989; Mezias and Mezias 2000; Ranger-Moore et al. 1991; Sørensen and Sorenson2003) have found evidence of positive contagion: founding events in one periodstimulate the founding rate in a subsequent period. Occasionally, these studieshave also found that the effect of lagged foundings is inversely U-shaped: too manyfoundings in a previous period in such cases actually reduces the rate of founding.To test this possibility, also a squared version of lagged foundings was added.
Population Age. Population age was defined as the time in years since the found-ing of the first foreign bank (the Oriental Banking Corporation) in Shanghai in 1847.This variable is used in order to capture general temporal trends in the foundingrate of foreign banks.
Foreign Trade. Since a majority of the foreign banks in Shanghai have beenmerchant banks, the total value of foreign trade through Shanghai (imports andexports, in USD 10 billion) was included as an indicator of the ’carrying capacity’of the local market. Expected is that the more foreign trade will pass throughShanghai, the more foundings of foreign banks will take place. Figures on foreigntrade were adapted from the Shanghai Statistical Yearbook and were lagged one year.
The analysis of the founding rate of foreign banks in Hong Kong in the secondanalytical step (for which I counted 530 founding events), basically used the sameset of variables, but with two slight modifications: First, the period effect that startsin 1918 was omitted since Hong Kong did not experience a ’golden age’ (Ji 2003) tothe extent that Shanghai did. Second, I added two period effects for Hong Kong:one to mark the Communist Party rule in mainland China since 1949 (a proxyfor the period of dormancy for foreign banks in Shanghai) and one to mark theyears following 1980 in which economic reforms first allowed foreign banks to set upoperations on China territory again (a proxy for the end of the period of dormancy).Table 4.1 summarizes the variables used9.
9Multicollinearity can lead to potential problems in estimating models, however as McKendricket al. (2003, 78) note, this is not a problem when statistically significant support is found withcollinear data, as is the case here.

67
4.6. RESULTS 53
Table 4.1: Descriptive statistics and correlationsa.
Variable Mean SD Min. Max. Correlations
Shanghai, 1847-1948 (1) (2) (3)
(1) Density SH 13.03 10.05 0 33(2) Lagged Foundings 0.75 1.51 0 11 .27(3) Population Age 50.5 29.58 0 101 .83 .26(4) End of WW II 0.01 0.10 0 1 .01 -.05 .16
Shanghai, 1982-2004 (5) (6) (7) (8)
(5) Trade 2.34 2.77 0.39 11.24(6) Density SH 57.48 38.46 4 108 .73(7) Density HK 243.78 44.18 174 309 -.38 .20(8) Lagged Foundings 5.78 5.02 0 21 -.04 .37 .54(9) Domestic Banks 9 4.68 3 15 .77 .89 .11 .30
Hong Kong, 1845-2004 (10) (11) (12) (13)
(10) Density HK 50.64 84.63 0 309(11) Lagged Foundings 3.3 6.25 0 35 .84(12) Population Age 79.5 46.33 0 159 .72 .63(13) End of WW II 0.01 0.08 0 1 -.04 -.04 .04(14) Density SH 17.65 23.45 0 108 .67 .34 .53 -.01
a Period effects are omitted from this table; correlations beyond +/- .25, .52, and .20, re-spectively, are significant at the 1 percent level.
4.6 Results
Table 4.2 presents the results of the analysis of founding rates of banks in Shanghaibetween 1847 and 1948, i.e. the pre-dormancy period. The period effects in Table 4.2show that, as expected, both period 2 and 3 saw a substantially higher founding ratecompared to the first period (1847-1889). Of all periods, period 4 (1935-1948) expe-rienced the lowest founding rate, which is interpreted as a reflection of the declineof Shanghai’s importance in international finance and trade. A closer inspection ofthe data reveals that, between 1935 and 1948, there were only three new foreignbanks in Shanghai (aside from the twelve foreign banks that re-opened their officeafter the end of the Second World War, for which a dummy variable was added).
Surprisingly, no effect was found for lagged foundings. Omitting the quadraticversion did not significantly alter the results. Increasing the lag (here one year) alsodid not improve the models. Population age negatively influenced the founding rateof foreign banks. Apparently, the activities of international banks with respect toentry into Shanghai declined as the local industry matured. Model 2 then includesthe density variables. This model improves significantly over model 1 (Haberman’s
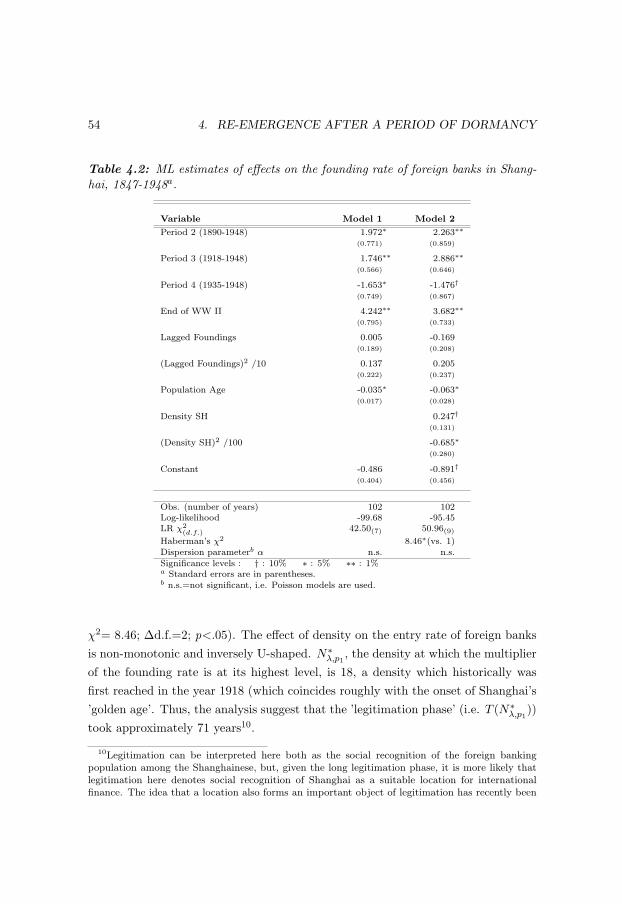
68
54 4. RE-EMERGENCE AFTER A PERIOD OF DORMANCY
Table 4.2: ML estimates of effects on the founding rate of foreign banks in Shang-hai, 1847-1948a.
Variable Model 1 Model 2
Period 2 (1890-1948) 1.972∗ 2.263∗∗
(0.771) (0.859)
Period 3 (1918-1948) 1.746∗∗ 2.886∗∗
(0.566) (0.646)
Period 4 (1935-1948) -1.653∗ -1.476†
(0.749) (0.867)
End of WW II 4.242∗∗ 3.682∗∗
(0.795) (0.733)
Lagged Foundings 0.005 -0.169(0.189) (0.208)
(Lagged Foundings)2 /10 0.137 0.205(0.222) (0.237)
Population Age -0.035∗ -0.063∗
(0.017) (0.028)
Density SH 0.247†
(0.131)
(Density SH)2 /100 -0.685∗
(0.280)
Constant -0.486 -0.891†
(0.404) (0.456)
Obs. (number of years) 102 102Log-likelihood -99.68 -95.45LR χ2
(d.f.)42.50(7) 50.96(9)
Haberman’s χ2 8.46∗(vs. 1)Dispersion parameterb α n.s. n.s.Significance levels : † : 10% ∗ : 5% ∗∗ : 1%a Standard errors are in parentheses.b n.s.=not significant, i.e. Poisson models are used.
χ2= 8.46; ∆d.f.=2; p<.05). The effect of density on the entry rate of foreign banksis non-monotonic and inversely U-shaped. N∗
λ,p1, the density at which the multiplier
of the founding rate is at its highest level, is 18, a density which historically wasfirst reached in the year 1918 (which coincides roughly with the onset of Shanghai’s’golden age’. Thus, the analysis suggest that the ’legitimation phase’ (i.e. T (N∗
λ,p1))
took approximately 71 years10.
10Legitimation can be interpreted here both as the social recognition of the foreign bankingpopulation among the Shanghainese, but, given the long legitimation phase, it is more likely thatlegitimation here denotes social recognition of Shanghai as a suitable location for internationalfinance. The idea that a location also forms an important object of legitimation has recently been
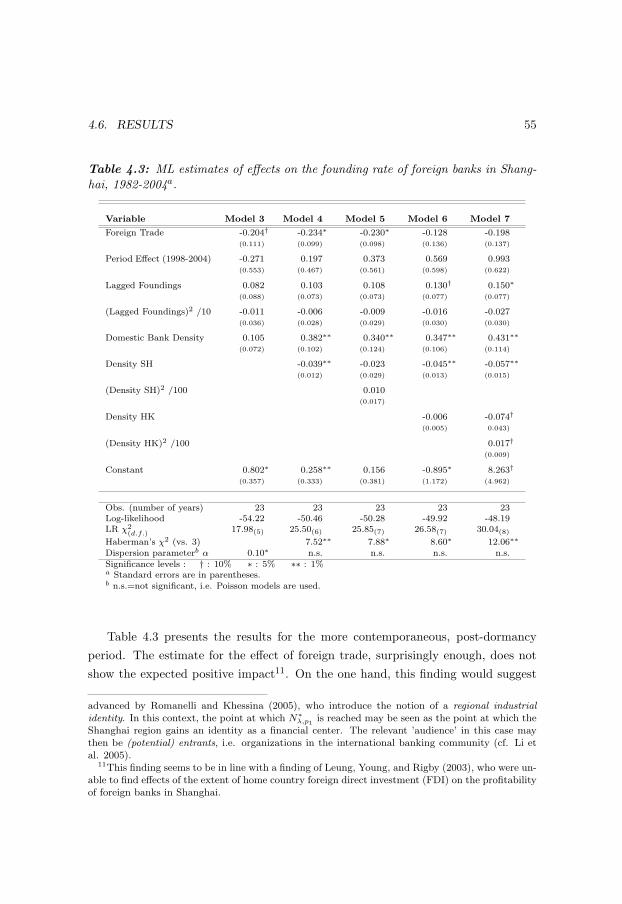
69
4.6. RESULTS 55
Table 4.3: ML estimates of effects on the founding rate of foreign banks in Shang-hai, 1982-2004a.
Variable Model 3 Model 4 Model 5 Model 6 Model 7
Foreign Trade -0.204† -0.234∗ -0.230∗ -0.128 -0.198(0.111) (0.099) (0.098) (0.136) (0.137)
Period Effect (1998-2004) -0.271 0.197 0.373 0.569 0.993(0.553) (0.467) (0.561) (0.598) (0.622)
Lagged Foundings 0.082 0.103 0.108 0.130† 0.150∗
(0.088) (0.073) (0.073) (0.077) (0.077)
(Lagged Foundings)2 /10 -0.011 -0.006 -0.009 -0.016 -0.027(0.036) (0.028) (0.029) (0.030) (0.030)
Domestic Bank Density 0.105 0.382∗∗ 0.340∗∗ 0.347∗∗ 0.431∗∗
(0.072) (0.102) (0.124) (0.106) (0.114)
Density SH -0.039∗∗ -0.023 -0.045∗∗ -0.057∗∗
(0.012) (0.029) (0.013) (0.015)
(Density SH)2 /100 0.010(0.017)
Density HK -0.006 -0.074†
(0.005) 0.043)
(Density HK)2 /100 0.017†
(0.009)
Constant 0.802∗ 0.258∗∗ 0.156 -0.895∗ 8.263†
(0.357) (0.333) (0.381) (1.172) (4.962)
Obs. (number of years) 23 23 23 23 23Log-likelihood -54.22 -50.46 -50.28 -49.92 -48.19LR χ2
(d.f.)17.98(5) 25.50(6) 25.85(7) 26.58(7) 30.04(8)
Haberman’s χ2 (vs. 3) 7.52∗∗ 7.88∗ 8.60∗ 12.06∗∗
Dispersion parameterb α 0.10∗ n.s. n.s. n.s. n.s.Significance levels : † : 10% ∗ : 5% ∗∗ : 1%a Standard errors are in parentheses.b n.s.=not significant, i.e. Poisson models are used.
Table 4.3 presents the results for the more contemporaneous, post-dormancyperiod. The estimate for the effect of foreign trade, surprisingly enough, does notshow the expected positive impact11. On the one hand, this finding would suggest
advanced by Romanelli and Khessina (2005), who introduce the notion of a regional industrialidentity. In this context, the point at which N∗
λ,p1 is reached may be seen as the point at which theShanghai region gains an identity as a financial center. The relevant ’audience’ in this case maythen be (potential) entrants, i.e. organizations in the international banking community (cf. Li etal. 2005).
11This finding seems to be in line with a finding of Leung, Young, and Rigby (2003), who were un-able to find effects of the extent of home country foreign direct investment (FDI) on the profitabilityof foreign banks in Shanghai.

70
56 4. RE-EMERGENCE AFTER A PERIOD OF DORMANCY
that, with respect to Shanghai, foreign banks have not been showing the ’client-following behavior’ that seems to be typical of financial institutions (Grosse andGoldberg 1991; Nigh, Cho, and Krishnan 1986). On the other hand, the negativesign of the coefficient could also point out to a case in which foreign banks enteredin anticipation of a future increase in foreign trade (or FDI)12.
The key variables however are again the density measures. Adding a first-orderdensity measure significantly improves the model (Model 4 vs. 3: Haberman’s χ2=7.52; ∆d.f.=1; p<.01). Model 5, in which a second-order density measure is added,does not improve over model 4, and the effect of the two density measures becomesstatistically insignificant. The main effect of density on the founding rate thereforeseems to be negative, suggesting that only competition is driving the founding rate.Surprisingly, no evidence is found for a process of (re-)legitimation. Apparently,legitimation of the presence of foreign banks in Shanghai did not decline enoughduring the period of dormancy to make a renewed legitimation phase necessary.Whereas studies such as Dobrev (2001) for Bulgarian newspapers find strong evi-dence for non-monotonic density dependence after a period of dormancy, for the caseof foreign banks returning to Shanghai no such effect is found. Hence, the analyti-cal strategy used here to replicate the findings of Dobrev (2001) for this particularcontext fails.
What, if any, is the effect of banking activity in Hong Kong on the re-emergenceof foreign banking in Shanghai? Model 7 expands on model 4 by including a first- andsecond-order density measure of foreign banks in Hong Kong. Adding these variablesyields an interesting picture. While the effect of density in Shanghai remains ofcompetitive nature, the effect of density in Hong Kong appears to be non-monotonicwith N∗
λ equal to 218, which falls well within the observed range. Increases in densityof foreign banks in Hong Kong up to this point seem to delay the re-emergence offoreign banking in Shanghai initially. But when the number of foreign banks in HongKong passes a threshold (N∗
λ exceeds 218 banks), which it did during much of thelate 1980s and 1990s, attention instead seems to be allocated to Shanghai, providingevidence for the ’niche expansion hypothesis’. This niche expansion seems to bedriven here by crowding in the existing niche (Hong Kong), a mechanism earlierdescribed by Dobrev et al. (2002b) and Kim et al. (2003). According to Dobrev etal. (2002b), tightly packed niches not only lead to elevated failure rates (as many
12Thanks to Arjen van Witteloostuijn for pointing to this possibility.

71
4.6. RESULTS 57
existing ecological studies suggest) but also to changes in position and the search fornew markets. This may explain what drove foreign banks in Hong Kong to set upoffices in Shanghai: increases in density in Hong Kong initially may have signaledthe growing importance of this city to foreign banks (leaving them to temporarilyallocate less attention to Shanghai). When density exceeded a threshold, crowdingin Hong Kong became too intense leading these foreign banks to explore alternativemarkets. In doing so, they have opted for Shanghai, a still legitimate location forforeign banks (as the previous analyses in this chapter have suggested) and one thatbecame part of the feasible set of suitable locations after its period of dormancyended in the early 1980s. An alternative interpretation would be that legitimacyspillovers led to the re-emergence of foreign banking in Shanghai, but if this were truein this context, it would probably have generated a positive relationship betweenthe density in Hong Kong and the founding rate in Shanghai throughout the post-dormancy period. The fact that this was not found casts doubts on the validity ofthe explanation in this particular context.
Can we also observe the process and consequences of niche contraction from theperspective of foreign banks in Hong Kong after the onset of Shanghai’s period ofdormancy? Table 4.5 reports the results for the analyses of founding rates of for-eign banks in Hong Kong (1845-2004). Models 8 to 10 shows that in the period1949-1979, the founding rate was substantially higher compared to previous peri-ods. This is interpreted as evidence for the assertion that Hong Kong’s growing rolein international finance was to a large extent driven by mainland China’s periodof economic isolationism. In this period, many multinational banks may have seenHong Kong as the main alternative to setting up a branch in China itself. Models 9and 10 also shows that in the period from 1980 to 1997 the founding rate was signif-icantly lower in comparison with the previous period, suggesting that the elevatedlevel of foundings did not persist during mainland China’s reform era. Adding thedensity variables improves model fit (Model 9 vs. 8: Haberman’s χ2=9.04; ∆d.f.=2;p<.05), and the effect on the founding rate is inversely U-shaped, cf. the theory ofdensity of dependence (Hannan and Carroll 1992). This suggests that the elevatedfounding rate in the period 1949-1979 occurred independent of density dependentpatterns. Models 10 to 12 experiment with a ’mirror image’ model that investigateshow density in Shanghai was related to the founding rate of foreign banks in HongKong. The relationship seemed to depend to a large extent on the observation win-dow chosen. Over the full window (model 10), no relationship was found between

72
58 4. RE-EMERGENCE AFTER A PERIOD OF DORMANCY
Table 4.4: ML estimates of effects on the founding rate of foreign banks in HongKong, 1845-2004a.
Variable Model 8 Model 9 Model 10 Model 11 Model 12pre-1949 post-1982
Period 2 (1890-2004) -0.535 0.420 0.283 2.299∗
(0.593) (0.681) (0.699) (1.057)
Period 3 (1935-2004) -0.773 -0.013 -0.108 1.520(0.589) (0.636) (0.651) (1.090)
Period 4 (1949-2004) 1.403∗∗ 1.452∗∗ 1.275∗
(0.541) (0.541) (0.591)
Period 5 (1980-2004) 0.063 -0.814∗ -0.827∗
(0.269) (0.397) (0.394)
Period 6 (1998-2004) -0.593† -0.610∗ -0.269 -0.271(0.321) (0.301) (0.555) (0.546)
End of WW II 3.264∗∗ 3.366∗∗ 3.273∗∗ 3.981∗∗
(0.724) (0.685) (0.694) (1.158)
Lagged Foundings 0.189∗∗ 0.080† 0.071 0.083 -0.098(0.035) (0.048) (0.049) (0.358) (0.071)
(Lagged Foundings)2 /10 -0.043∗∗ -0.016 -0.014 0.448 0.027(0.009) (0.013) (0.013) (0.493) (0.018)
Population Age 0.018† -0.006 -0.001 -0.082∗∗ -0.084(0.010) (0.013) (0.015) (0.032) (0.060)
Density HK 0.027∗∗ 0.025∗∗ 0.324† 0.086∗
(0.009) (0.009) (0.193) (0.033)
(Density HK)2 /100 -0.006∗∗ -0.005∗ -2.493∗ -0.017∗
(0.002) (0.008) (1.118) (0.007)
Density SH -0.005 0.192∗∗ 0.004(0.008) (0.074) (0.011)
Constant -1.724∗∗ -1.258∗∗ -1.326∗∗ -1.405∗ 4.716(0.373) (0.385) (0.401) (0.601) (8.514)
Obs. (number of years) 160 160 160 104 23Log-likelihood -227.88 -223.36 -223.10 -71.77 -67.90LR χ2
(d.f.)195.22(9) 204.25(11) 204.78(12) 35.08(9) 21.51(7)
Haberman’s χ2(vs. 8) 9.04∗ 9.56∗
Dispersion parameterb α 0.17∗∗ 0.13∗∗ 0.12∗∗ n.s. 0.09∗∗
Significance levels : † : 10% ∗ : 5% ∗∗ : 1%a Standard errors are in parentheses.b n.s.=not significant, i.e. Poisson models are used.
the number of banks in Shanghai and the rate of founding in Hong Kong. Whenthe window was narrowed down to the pre-1949 period, a period in which Shanghaiappeared to be a larger financial center than Hong Kong, there was a positive rela-tionship between density in Shanghai and the rate of founding in Hong Kong. For

73
4.7. DISCUSSION 59
the more contemporary reform era in China (1982-2004) again no relationship wasfound. These tests with the mirror image model suggest that the relative position ofthese financial centers might matter in the degree to which cross-density effects arefound on founding rates in these centers: in the pre-1949 Shanghai was the dominantfinancial center in the East-Asian region, being larger than other financial centerssuch as Hong Kong. In the post-1982 era, these roles were reversed and Hong Kongwas more dominant. Therefore the organizational dynamics in Hong Kong weremore likely to affect Shanghai in this later period, than the other way around.
Among the control variables, there is also a notable tendency for the foundingrate of foreign banks in Hong Kong to be substantially lower in the period from 1998to 2004 compared to previous periods. It is difficult however to attribute this to asingle underlying cause. On the one hand, it may be that the observed depressedfounding rates are a consequence of the 1997/1998 Asian crisis. On the other hand,there might be a relation with the fact that Hong Kong since 1997 is no longer aBritish Crown Colony as it became part of China again. With the methods used hereit is hard to control for both potential causes separately. Closer contextual analysismight however be able to sort out these effects, and could form an interesting areafor future research.
4.7 Discussion
Previous studies that have sought to explain the re-emergence of organizationalforms after a period of dormancy have focused on the local preservation of skills andknowledge (Hannan and Carroll 1992) or on the revitalization of a locally preservedcollective memory of the blueprints of the organizational form (Dobrev 2001). Thischapter investigated an alternative explanation to the re-emergence of organizationalforms, namely the continued preservation of the organizational form outside thesociety in which the period of dormancy takes place. It is shown here that, incase of the re-emergence of foreign banking in Shanghai, the multinational bankingcommunity outside mainland China -as represented in Hong Kong-, indeed playedan important role in stimulating the entry of banks into the city.
The explanation that the form survives outside the society in which a period ofdormancy takes place is not necessarily at odds with Dobrev’s (2001) account. Thecontinued existence of a social form in other societies might well complement a localpreservation of a collective memory (Carroll and Teo 1998; Hannan et al. 2005).

74
60 4. RE-EMERGENCE AFTER A PERIOD OF DORMANCY
Consider for instance a passage in Becker’s (1982) seminal work on the sociology ofart. Here Becker discusses how certain forms of literature are (temporarily) bannedfrom a society.
”In states which do not act against the artist directly, the most completeform of censorship is the total destruction of the works the governmentfinds offensive. The modern archetype of such action is book burning,even though that actually destroys, not the work itself, but only somecopies of it; the work will continue to exist in areas the governmenthas no jurisdiction over, notably other countries with different politicalsystems and aims. (Ray Bradbury’s ’Fahrenheit 451’ considers the moreextreme case in which every physical copy has been destroyed by animplacable and efficient regime; even there the work continues to existby being recorded in people’s memories.)” (Becker 1982, 186; emphasisadded).
As Becker (1982) points out, the form might both continue to exist in othercountries, as well as within the society in which the form is banned, through a col-lective memory. But although they are possibly complementary, these mechanismsmay however produce different outcomes when they operate in isolation. Forms thathave continued to exist in other societies through the instantiation in existing or-ganizations have been subject to continuous processes of code selection: as Hannanet al. (2005) describe, the codes describing the organizational form are subject tocontinuous change due to interactions between the behavior of members of the formand the relevant audiences. In contrast, a form that re-emerges on the basis of alocally preserved collective memory does so by using ideas or images that becameimprinted (cf. Stinchcombe 1965) at the onset of the period of dormancy. Theseideas and images reflect the organizational form at the time before its demise. Sincethese ideas and images are likely to become fixed in people’s minds (or in writtenrecords), they do not change substantially during the dormancy period since thesecodes are not subject to strong selection pressures (although some elements of theform identity might fade as time passes). When the form then re-emerges an iden-tity may be re-constructed with codes that previously applied to the pre-dormancyform13.
13In a sense, this resembles the process described in the immigration literature where instead of

75
4.7. DISCUSSION 61
One of the more surprising findings of this study was that no new phase of le-gitimation phase took place in this empirical context. While Dobrev (2001), butalso Windzio (2003) in a study of several industries in former East Germany, foundstrong evidence for curvi-linear density dependent patterns in post-socialist settings,no such effects are found here. Why would this be the case? One explanation couldbe that the length of the period of dormancy was simply not long enough to wipeout the legitimacy of a presence of foreign banks in Shanghai. A period of roughly 30years (against approximately 40 years of state socialism in Eastern Europe) might betoo short to erase the cognitive legitimacy of Shanghai’s prominent position in inter-national finance. An alternative, more plausible, explanation is that the identity ofShanghai as a financial center may have been more actively preserved compared tothe case of Bulgarian newspapers that has been described by Dobrev (2001). Activepreservation by local audiences in Shanghai is evident from the high degree of aware-ness among the Shanghainese of their financial history (Gamble 2003). But also themultinational banking community outside China, in particular in Hong Kong, mayhave actively preserved Shanghai’s identity as a financial center. This multinationalbanking community, throughout China’s phase of economic isolationism, retaineda keen interest in this large market and remembered the historical importance ofShanghai in international finance. This preserved identity may have been so strongthat no re-legitimation or revitalization of a collective memory was needed for foreignbanks to return to Shanghai. Two other types of banks may have helped to preserveor enhance the legitimacy of Shanghai as a location for international finance. Onthe one hand, the analyses showed that the number of domestic banks was positivelyrelated to the founding rate of foreign banks in Shanghai. Domestic banks thus mayhave enhanced the legitimacy of Shanghai as a financial center. On the other hand,there is a small subset of foreign banks so far not discussed in this chapter in termsof the possible legitimacy they have generated. These are the four quasi-foreignbanks that remained active during Shanghai’s period of dormancy (albeit on a verylimited scale). Although including these banks explicitly in the analysis was notpossible (due to a lack of variance over time), these banks may well have played arole as well in preserving the legitimacy of banking in this market.
This study took a sociological perspective to provide an account for the re-
a temporal discontinuity there is a spatial discontinuity. Immigrants in such cases build a collectiveidentity in a host country based on a cultural repertoire brought from their home country (Nee andNee 1973; Portes and Sensenbrenner 1993).

76
62 4. RE-EMERGENCE AFTER A PERIOD OF DORMANCY
emergence of organizational populations. A seemingly related perspective drawsfrom the international business literature to explain such phenomena. Ghoshal andBartlett (1990) for instance develop the notion of the multinational as an interor-ganizational network of geographically dispersed affiliates. Adaptation to changingmarket conditions may occur at the affiliate level, independent of other affiliates.Such a notion implicitly implies that a multinational corporation may decide towithdraw its subsidiary from an inhospitable market but restore its operations ata later stage. However, this and other interpretations in the international businessliterature are mainly on the level of the individual organization, while this studyseeks to advance a macro, population-level account.
Of course, this study also has its limitations. One of them may be that thisstudy relied on Hong Kong as the sole indicator of movements of the broader or-ganizational form. Indeed, a more complete picture might emerge when also othernearby financial centers are included in the analyses, such as Singapore and Tokyo.However, it deserves mention that, as indicated earlier, Hong Kong is currently thelargest international financial center in the region and if any city captured the ef-fects of Shanghai’s period of dormancy, it is certainly Hong Kong. It is also doubtedthat the results could be replicated if large financial centers elsewhere in the worldwere to be selected for this study, instead of Hong Kong. All international bankshave a presence in Hong Kong anyway, one may argue, and these banks are alsopresent elsewhere. Such an argument would overlook the many regional banks thatare present in even the largest financial centers. A review of the historical trajec-tories of banks in New York (Barron, West, and Hannan 1998) suggest that, incontrast to the number of banks in Hong Kong, the number of financial institutionssuch as credit unions and savings banks has in fact been declining throughout thepost-World War period. The same goes for commercial banks until the 1970s, be-fore it rebounded in the 1980s. The only type of financial institution that saw anincrease comparable to the increase in the number of banks in Hong Kong are themutual funds, but this organizational form started at a much later stage than thebanking industry in Hong Kong. Each of the trajectories displayed by Barron et al.(1998) shows a unique historical pattern different from the one observed for HongKong, and the densities that underlie these pattern will surely not have the samerelationship with the rate of bank foundings in Shanghai that the bank density inHong Kong has.
In conclusion, let me emphasize that this study relied on counts of the num-

77
4.7. DISCUSSION 63
ber of organizations as an approximation for the degree of legitimacy that mightspillover to other social systems. Future research however may take a closer look,with more direct measures, at the cultural images and ideas that flow beyond ge-ographical boundaries (cf. Han 1998; Hannan et al. 1995; Bigelow et al. 1997;Lomi 2000; Delacroix 2004). Since these cultural images and ideas may give riseto the re-establishment of (form-defined) populations in previously dormant mar-kets, studying how these processes, possibly together with the movement of extantorganizations as studied here, could lead to the re-emergence of an organizationalform in a particular society might be of great sociological importance and thereforewarrants further investigation. In addition, such an analysis would resonate withrecent efforts in organizational ecology to understand the evolution of social formsand their identity (Hannan et al. 2005; Polos et al. 2002).

78
79
5
Waiting Times and Pre-Entry
Activity
In Chapter 4, I argued that much of the re-emergence of foreign banking in Shanghaicould be explained by a broadening and expansion of the niche of multinationalbanks, a niche that came to include Shanghai after reforms were set in motionin China in 1978. By shifting attention to the newly opened possibilities in China,foreign banks had to start generating appeal for their products and services. Hannanet al. (2005) point out that after niche expansion, it normally takes some time togenerate actual appeal, and that waiting times are common before one can becomea fully established member of a population. The pre-entry phases that arise fromsuch waiting times, and the ecological dynamics that characterize such phases, areexamined more closely in this chapter1.
5.1 Why Study Pre-Entry Activity?
The view that ecological dynamics, defined as competitive and legitimating inter-actions among social actors, occur not only within established organizational pop-ulations but also affect organizers seeking to gain entry into these populations isincreasingly recognized by organization theorists (Carroll and Hannan 2000, 339-356; Carroll and Khessina 2005; Ruef 2006; Sørensen and Sorenson 2003). This shiftin focus to the stages that pre-date entry into an organizational population is de-
1This chapter draws from joint work with Jiatao Li of the Hong Kong University of Science andTechnology.
65

80
66 5. WAITING TIMES AND PRE-ENTRY ACTIVITY
fendable on the grounds that several studies have shown that pre-entry experiencesshape the subsequent success of individual firms (Carroll et al. 1996; Helfat andLieberman 2002; Klepper 2002; Klepper and Simons 2000; Ruef 2006). One pos-sible explanation is that organizations are imprinted by their environment duringthe early stages of firm activity (Stinchcombe 1965; Carroll and Hannan 1989) andsubsequently find it hard to deviate from these initial patterns (Hannan and Free-man 1984). On a macro-level, there are clear ramifications of the length of pre-entryphases. Ruef (2006) shows by simulating population trajectories under various con-ditions that lengthy organizing periods can cause instability in the form of ’boomand bust cycles’, i.e. periods in which the population grows rapidly followed by ashakeout. In growing populations, organizers may fail to recognize (the potentiallymany) others in the same process, underestimating the true level of competitionthey will encounter when they have become fully operational (Ruef 2006).
The study of the pre-operational phase brings a fresh perspective to the analysisof organizational founding. A large majority of studies in the field of organiza-tional ecology have treated founding attempts as single events which occur withinan undefined pool of potential entrepreneurs. Unlike failure rate studies, the not yetfully established organization cannot be identified and cannot be meaningfully repre-sented in the analysis in terms of its characteristics. By decomposing the foundingrate into its component parts, i.e. the organizing attempt and subsequent entryinto the population, such an analysis becomes possible (Carroll and Khessina 2005).The organizing attempt and subsequent entry constitute two separate events thateach have received considerable empirical attention, but overall, still ’very little isknown what happens in between an organizing attempt and an actual founding’(Carroll and Khessina 2005, 159), in particular when it comes to the question ofhow the ecological processes that are active during the pre-entry phase affect thelikelihood of entering an organizational population (for recent exceptions see Carrolland Hannan 2000; Ruef 2006; Sørensen and Sorenson 2003). A study was thus de-signed to further develop and extend this line of inquiry by taking into account (1)the emerging organization’s characteristics (scant research in this area has predom-inantly investigated environmental effects), and (2) weighted effects of social actorsin the competitive environment. In order to illuminate the nature of these potentialeffects, we applied an ecological model to predict a social actor’s likelihood of mov-ing from pre-entry activity to becoming a fully established member of a population(a likelihood which is also referred to as the ’transition rate’ or the rate of entry

81
5.2. THEORETICAL BACKGROUND 67
into the population of operational organizations). We found that this rate dependson the presence of other potential entrants, but also on the presence of already es-tablished organizations. Our findings are informative not only for those studyingorganizational founding patterns, but also for those interested in the early processof identity formation. After investigating the effect of the geographical location ofother potential entrants, as well as the effect of relative sizes and countries of origin,we have drawn inferences about the strength of these competitors’ identities andtheir impact on a social actor’s decision to enter the population.
The empirical analysis in the chapter makes use of the fact that foreign banksseeking entry into the Chinese market experience a mandatory pre-entry stage inthe form of establishing a ’representative office’ first, before the bank can start toprovide revenue generating banking services. This provides observable events tomark the start of organizing activities and the start of actual operations. In thisstudy, successful entry into the population was defined as a successful applicationfor branch bank status (after which it becomes possible to generate revenue, cf.Jovanovic (2004)), rather than the initial establishment of a representative office. Inwhat follows, the time a bank spends between these events is interpreted as waitingtime before the transition (cf. Hannan et al. 2005; Jovanovic 2004; Schoonhoven etal. 1990).
5.2 Theoretical Background
This study was designed to analyze the ecological process by which social actors(which we refer to as organizers) seek entry into a broader population or community.Organizers can generally be either de novo entrepreneurs, or de alio organizationsthat originate from other geographical markets or industries and have to go througha protracted pre-entry stage because the resources required in the new populationare essentially different from those used in the previous one (Helfat and Lieberman2002; Jovanovic 2004). One example of an industry that has seen both de alio and denovo entrants (in these studies referred to as pre-producers) is the U.S. automobileindustry (Carroll et al. 1996; Carroll and Hannan 2000, 339-356). Both de alio andde novo organizers have attempted to launch automobile production in the U.S.,and both are likely to have gone through organizing periods of various lengths prior

82
68 5. WAITING TIMES AND PRE-ENTRY ACTIVITY
to their entry into the industry2. The de alio organizations in this case came fromrelated industries ranging from engine manufacturing to manufacturers of carriagesand bicycles (Carroll et al. 1996).
Although with respect to pre-entry activities, de alio and de novo organizersare likely to differ in terms of resources and capabilities (Carroll et al. 1996; Helfatand Lieberman 2002; Klepper 2002; Klepper and Simons 2000), we argue that thereis an underlying pre-entry process that applies to both types. The core featuresof this process are, first, that there is, in principle, a non-zero waiting time fororganizers prior to their entry into a population. A waiting time, defined as thelength of the organizing period (also referred to as the gestation period (Hannanand Freeman 1989)), is used by the organizer to accumulate resources, to build upexternal ties with relevant actors, and to generate appeal for certain products orservices (Hannan et al. 2005). Since many of these activities seem hard to avoidprior to the commencement of operations, the assumption of a minimum waitingtime seems reasonable (Hannan et al. 2005). Empirical studies show that waitingtimes can be of considerable length. Ruef (2006) for example, who analyzed thefounding of medical schools in the U.S. between 1766 and 1930, reports an averagewaiting time (between the announcement of the school and operational startup) ofabout two years, but with individual waiting times varying between a few monthsand as much as twenty-six years. Schoonhoven et al. (1990) report waiting timesfor semiconductor firms (between the start of organizing activities and first productshipment) from one month up to more than four years (with a mean duration ofalmost two years).
A second, related feature of the typical pre-entry process is that there are anumber of other organizers engaged in the process at the same time, of which onlya subset can enter. Due to restrictions, possibly arising from limits on the carryingcapacity of the market, only a limited number of the pool of organizers normally willbe able to reach the operational stage. In their study of automobile pre-producers,Carroll and Hannan (2000) showed that indeed many aspiring automobile manufac-turers failed prior to commencing production: of the 3,845 automobile pre-producersthat were identified as having been involved in organizing efforts between 1885 and
2In contrast to the empirical context analyzed here, Carroll and Hannan’s (2000) data did notallow for the measurement of the preproduction efforts of de alio, established firms. As they note(p. 349), ’new enterprises more likely get noticed when they undertake visible preproduction.Established firms in other industries can likely conceal their automobile preproduction efforts’.

83
5.2. THEORETICAL BACKGROUND 69
1981, only 11 percent succeeded in making the transition to production (Carroll andHannan 2000). Based on the first core feature of this pre-entry process, which is inessence a type of Darwinian ’variation with selective retention’ model on the pre-entry level, theoretical arguments will be presented relating the length of the waitingtime to the likelihood of becoming a fully established organization. Based on thesecond feature, specific hypotheses will be developed concerning the interaction withother organizers during pre-entry activity and how these interactions influence thelikelihood of entry into the population.
This study has focused on de alio organizations only, given the lack of atten-tion these types of organizers have received in previous empirical studies and giventhe relative ease of observing characteristics of the emerging organization (and tostudy effects associated with these characteristics). With very few exceptions3, mostof the growing number of foreign banks in Shanghai went through the process de-scribed above, thereby qualifying this population as an excellent opportunity tostudy pre-entry activity (cf. Carroll and Hannan 2000, 345). Local banking regula-tions stipulate that in principle foreign banks wishing to enter the Chinese marketneed to start their operations in China as so-called representative offices. Such officeswere considered for the purposes of this study to be the equivalent of organizers.Such representative offices are generally small in terms of office space and number ofemployees (often not more than five) and they require a relatively small amount ofinvestment by the parent bank. Representative offices are sanctioned to engage inconsulting, liaison, market research, and other non-profit activities. As their namesuggests, they represent their parent bank abroad.
After having operated a representative office in China for some time, a foreignbank may decide to apply for full branch status offering trade services. Local reg-ulators may then issue a license if the bank meets certain requirements. The twomost important of these minimum requirements are:
• That the bank must have had total assets of no less than USD 20 billion witha capital-adequacy ratio of no less than 8 percent at the end of the year beforethe application was made.
3Four ’quasi-foreign’ banks (HSBC, the Overseas Chinese Banking Corporation, Standard Char-tered, and the Bank of East Asia) had, throughout China’s socialist era, already operated as branchoffices in the city (albeit on a limited scale from 1949 until the reforms) but had to re-apply fornew licenses under the new regulations.

84
70 5. WAITING TIMES AND PRE-ENTRY ACTIVITY
• That the bank must have maintained a representative office in China for atleast two years4.
The intent of this two tier (representative office-branch office) system, from theperspective of local regulators, is two-fold. On the one hand it ensures that onlycommitted and financially healthy foreign banks are allowed to actually providefinancial services in the Chinese market. On the other hand, it protects the localbanking sector from too much competition from foreign banks. By gradually allowingforeign banks to integrate into China’s financial market, local regulators hope topromote financial reform of the domestic banking sector (Lees and Liaw 1996). Froma foreign bank’s perspective, despite the fact that it requires a substantial increasein commitment and investment (Chang 1995; Johanson and Vahlne 1977), there isa clear incentive to become a member of the population of foreign banks allowed tooperate branches. Branch offices are allowed to offer a wide range of banking services- accepting deposits, making loans, extending trade services, and in some cases,underwriting securities offerings - hence, the branch offices are allowed to generateprofits. This explains why firms are willing to operate unprofitable representativeoffices for periods which can sometimes be protracted. From an analytical angle,the transition from a representative office to a branch thus matters substantially,since the shift in the mode of operation also means that the foreign bank becomessubject to a whole new set of market forces, such as price competition. A foreignbank that obtains a branch license also has to start tapping into broader parts ofthe labor market, as differently skilled employees have to be hired.
5.3 Hypotheses
Duration Dependence
How does the likelihood that an organizer achieves organizational startup varyover the length of the organizing period? Studies on the ’liability of newness’ (aterm coined by Stinchcombe (1965)) suggest that organizers face some typical prob-lems associated with new venture formation (such as difficulties establishing tieswith relevant external actors or problems in learning new roles for those within theemerging organization), but that they will increasingly be able to overcome these
4Prior to 1994, when the Regulations for the Administration of Foreign Investment FinancialInstitutions were introduced, the length of this ’probation period’ was three years (Fu 1998).

85
5.3. HYPOTHESES 71
difficulties as time passes. Numerous empirical studies show that as organizers pro-ceed through the organizing period, their survival chances increase and bottlenecksare broken (see Aldrich (1999) or Carroll and Hannan (2000, 288)). As an organizergradually overcomes these problems, the liability of newness erodes, and the likeli-hood of successful entry increases5. Ruef’s (2006) study of initial organizing amongmedical schools indeed found that the probability of entry was substantially higherlater in the organizing period (over two years) compared to the early stages (lessthan two years).
However, studies which have examined the pattern of duration dependence moreextensively have consistently found that the likelihood of entry drops at later stagesin the organizing period (Carroll and Hannan 2000; Schoonhoven et al. 1990). Car-roll and Hannan (2000), for instance, report a clear peak in the pattern of durationdependence after approximately six years. Schoonhoven et al. (1990), in a studyof semiconductor firms between 1978 and 1985, found a similar inverted U-shapedeffect of the waiting time, but here the peak occurred after two and a half years.Reasons why the likelihood of entry declines at later stages may include limited fore-sight in the design of organizational structures and strategies (Hannan and Freeman1989, 122). These issues are often decided upon at the beginning of organizing pe-riod with the aim of being well aligned with the environment at the time of theactual founding event. However, which organizational structure and strategy willbe most effective at that time becomes more difficult to predict as the length of theorganizing period increases. As a result, the probability of a successful transitionfrom organizing activities to the operational stage might decline as the organizingperiod becomes too lengthy. These arguments lead us to expect (as a baseline) aninverted U-shaped relationship between the length of the waiting time and the like-lihood of entry into the organizational population. However, instead of aiming toreplicate earlier findings, this study was designed to extend those findings by look-ing at firm-level differences in terms of capabilities. Helfat and Lieberman’s (2002)review of the literature related to pre-entry capabilities suggests that the magnitudeand nature of pre-entry capabilities strongly influence the likelihood of entry. Agreater magnitude of pre-entry capabilities enhances an organizer’s chances of suc-cessfully entering a population, but it also encourages more positive evaluations byexternal parties or ’audiences’ (Hannan et al. 2005; Hsu and Hannan 2005; Philips
5The liability of newness may of course extend well after the founding event; see Ruef (2006) fora graphical representation of a pre- and post-founding negative age dependence of failure rates.

86
72 5. WAITING TIMES AND PRE-ENTRY ACTIVITY
and Zuckerman 2001; Zuckerman 1999), which in turn could facilitate successfulentry. In an international context, multinational experience and the ability to copewith diverse and complex environments are likely to be among the most relevant or-ganizational capabilities determining success in entering new geographical marketsand populations. Multinational experience from previous investments, if transfer-able, should lead to a higher likelihood of entering new markets. Chang (1995) forinstance showed, in his study of the international expansion of Japanese electronicsfirms, that past international investments are more likely to give rise to subsequentinvestments suggesting that experiences from earlier investments matter. Hence, weposit that
Hypothesis 5.1. In an international context, a higher rate of entry will be observedover the duration of the organizing period for organizers that have more multinationalexperience.
Helfat and Lieberman (2002) also make a distinction between generalized andspecialized capabilities. Specialized firm capabilities are defined as those that arespecific to particular settings and only useful in a limited number of environments.Generalized capabilities, in contrast, can be applied more broadly. Helfat and Lieber-man (2002) posit that organizers with specialized capabilities are more likely to suc-cessfully enter markets in which the required capabilities are similar. In a similarvein, Carroll et al.’s (1996) findings show that, for the automobile industry, produc-ers that originated from related industries (bicycle and carriage manufacturing) weremore likely to be successful than those from less related industries. Furthermore,Zuckerman, Kim, Ukanwa, and von Rittmann (2003) also suggest that specializedcapabilities (or at least a social identity reflecting these capabilities) are favored byaudience members in the early pre-entry stages. In an international context, if weview the degree of multinationality of an organization as a capability relevant todetermining the probability of successful entry into a population, then the locus ofmultinationality should reflect the degree to which these capabilities are specialized.Organizations that have built up multinational experience in the region in whichthey aim to enter a new population can be seen as having specialized capabilities,whereas those that have gained multinational experience on a more global scale canbe seen as having more generalized capabilities. A pattern that displays the rela-tionship between the length of the waiting time and the likelihood of entry wouldthen be expected to reflect differences between firms with regional and worldwide

87
5.3. HYPOTHESES 73
multinational experience.
Hypothesis 5.2. In a international context, a higher rate of entry will be observedover the duration of the organizing period for organizers that have more regionalmultinational experience.
Ecological Dynamics
Aside from characteristics pertaining to the organizers, factors stemming fromthe competitive environment also appear to be of considerable importance in influ-encing entry into a population. During the organizing period, two types of com-petitors are likely to influence the likelihood of entry: other organizers and alreadyestablished, operating organizations. In predicting the effect of the presence of thenumber of operational organizations we follow the logic of density dependence theory(Hannan and Carroll 1992). According to this theory, two important processes in-fluence new organizational foundings6: competition and (constitutive) legitimation.When a particular organizational form is perceived as legitimate (in the sense thatit is seen as a taken-for-granted aspect of the institutional environment (Meyer andScott 1992b)), this greatly facilitates founding an organization pertaining to thatform (Hannan and Carroll 1992). Legitimation has its strongest effect on organiza-tional founding when the number of organizations is low. Competition, in contrast,is more dominant when the number of operational organizations in the market is highand has exceeded a threshold (Hannan and Carroll 1992). Competition in such casesdeters entry, because it signals a scarcity of resources and decreased opportunitiesto potential founders7.
Similarly, in a pre-entry context, it is likely that organizers are positively in-fluenced to attempt entry by initial increases in the number of fully establishedorganizations. The fact that some organizers have made the transition to an op-erating organization has a contagious, legitimating effect on other organizers and,based on this feedback, they are more likely to make the transition as well (Greve1995; Lee and Pennings 2002). If, however, too many organizers decide to enter a
6This theory has also been applied to organizational growth and mortality rates (Carroll andHannan 2000, 216-222).
7An exception to this is the phenomenon of ’resource partitioning’ in which two seeminglyopposing trends occur simultaneously: 1) intense scale-based competition among incumbent orga-nizations, and 2) the proliferation of many small organizations. See also Carroll (1985) or Carroll,Dobrev and Swaminathan (2002).

88
74 5. WAITING TIMES AND PRE-ENTRY ACTIVITY
population (i.e. the number of operating organizations exceeds a threshold) thenthe probability of organizers attempting to achieve operational startup will decline.With the prospect of intense competition, an increased proportion of organizers willrefrain from following their peers into the operational stage. Hence, it is expectedthat the impact of the number of operational organizations on the likelihood of entrywill show an inverted U-shaped pattern. While density dependence theories havereceived widespread support in firm founding studies (for an overview see Carrolland Hannan 2000), previous studies on pre-entry ecological dynamics so far showmixed evidence for and against this parallel prediction. Schoonhoven et al. (1990)found that higher numbers of established organizations actually shortened waitingtimes before entry into a market. Ruef (2006) also found positive effects of thenumber of operational organizations on the likelihood of entry. In contrast, Carrolland Hannan (2000) found only a negative (and second-order) effect of automobileproducer density, similar to the findings of Sørensen and Sorenson (2003) who, basedon a study of organizing activities in television broadcasting between 1965 and 1987,also found strong negative effects of the presence of organizations that had alreadymade the transition. In fact, as Sørensen and Sorenson (2003) show in their analysis,potential founders frequently underestimate these effects when they evaluate oppor-tunities and start their initial organizing efforts. Despite this somewhat inconclusiveevidence, we posit:
Hypothesis 5.3. The number of organizations in a population has an inverted U-shaped relationship with the organizer’s rate of entry into that population.
It is expected that a similar inverted U-shaped pattern would hold for the effectof the number of organizers that simultaneously try to establish operational organi-zations. With initial increases in the number of peers, being a candidate to enter aparticular population would be legitimized. This should lead external constituentsto make more resources available, increasing the likelihood that an organizer willbe able to establish a fully operational organization. When organizers become toonumerous however, the effect of other organizers on the likelihood of entry is in-stead likely to be dominated by competition. As the number of organizers increases,more of the resources that are needed to establish an operating organization willalready be claimed by others. This increase in diffuse competition (Hannan andCarroll 1992) causes supplies of suitable locations, employees, potential customersand other resources to become exhausted. As the number of organizers increases it

89
5.3. HYPOTHESES 75
will therefore become increasingly difficult to move from the pre-operational stageto the operational stage. The only study which has investigated the effect of otherorganizers is that of Carroll and Hannan (2000). In their study of automobile pre-producers, they argued that the transition from potential to operating automobileproducer depended to a large extent on the presence of other pre-producers whowere engaged in initial organizing, and that this effect had an inverted U-shapedpattern. As the number of other organizers increased, the likelihood of achievingoperational startup increased initially, but with a higher number of organizers thislikelihood was negatively affected.
Hypothesis 5.4. The number of organizers seeking to gain entry into a populationhas an inverted U-shaped relationship with the rate of entry into that population.
Proximity
Ecological interactions between both organizers and operational organizationsare likely to have a clear spatial component. Competition, for instance, is particu-larly strong when organizations are located in close geographical proximity. Organi-zations located in close proximity are more likely to serve the same set of customers,and more likely to draw on the same set of suppliers and labor. As the distancebetween organizations increases, competition between these organizations will gen-erally tend to decrease. Legitimation has similar spatial constraints. Althoughthe legitimation process has a tendency to operate more widely than competition(Bigelow et al. 1997; Delacroix 2004; Han 1998; Hannan et al. 1995; Lomi 2000),the relative strength of legitimation still seems to be higher on smaller geographicalscales. Organizations located close by might be more visible, and thus have greaterimpact on opportunity perceptions and entry decisions. Organizations located inclose proximity also provide a potential entrant with more opportunities to acquireknowledge and resources through local networks (Sorenson and Audia 2000). So asthe distance between a potential entrant and a set of organizations decreases, thelikelihood of founding an organization of that type will increase. Spatial proxim-ity has frequently appeared to matter in testing density dependence (e.g. Baumand Mezias 1992; Carroll and Wade 1991; Greve 2002; Lomi 1995). Whereas non-monotonic patterns have been found on a variety of scales, these patterns oftenappear to be stronger within closely bounded areas. Greve (2002), for instance, whostudied entries in the Tokyo banking industry between 1894 and 1936, found strong

90
76 5. WAITING TIMES AND PRE-ENTRY ACTIVITY
non-monotonic effects of density in specific areas (wards and counties) within theTokyo prefecture, signaling both processes of legitimation and competition. Theseprocesses were weaker however for more distant areas. When the effects of densitywere estimated for neighboring areas, the same non-monotonic pattern showed up,but both its first and second order effect (reflecting legitimation and competition)appeared to be substantially lower in magnitude. Similarly, in a pre-entry context,the effects proposed in Hypotheses 5.3 and 5.4 might be expected to be strongerwhen measured on a more limited geographical scale.
Hypothesis 5.5. The organizer’s rate of entry into a population will have a strongerrelationship with the number of operational organizations in the same geographicalarea compared to those in other areas.
Hypothesis 5.6. The organizer’s rate of entry into a population will have a strongerrelationship with the number of other organizers in the same geographical area com-pared to those in other areas.
Mimetic Entry
So far, we have implicitly assumed that the likelihood that organizers enter apopulation depends on the total number of organizations in their environment re-gardless of the features of those organizations. Cognitive approaches to strategy(e.g. Greve 1995; Porac and Thomas 1990; Weick 1979), however, point out thatsocial actors label and make sense of their environment by forming cognitive cat-egories, and that these actors will be more likely to respond to the actions andfeedback of those in the same category as themselves. Organizations that are in anorganizer’s reference group should therefore be more likely to affect the likelihoodthat the organizer enters the population than those that are outside that referencegroup. Building on this principle, a well-established finding in organization theoryis that interactions among organizations tend to be localized on a size dimension,i.e. organizations tend to interact most intensely with those organizations that aresimilar in size (e.g. Banaszak-Holl 1991; Baum and Mezias 1992; Han 1998; Hannanet al. 1990; Lee and Pennings 2002; Ranger-Moore, Beckenridge, and Jones 1995).It has also been suggested that similarity in size can induce mimetic behavior, asorganizations are more susceptible to market feedback about those organizations intheir size class (Haveman 1993a; Lee and Pennings 2002). For instance, Lee andPennings (2002) found strong mimetic patterns among similar-size organizations in

91
5.3. HYPOTHESES 77
their study of the adoption of a new form of organization in the Dutch accounting in-dustry between 1925 and 1990. They found that the percentage of organizations thathad adopted the new organizational form stimulated subsequent adoptions amongsimilar-sized organizations. These mimetic patterns not only apply to incumbentorganizations in a population, but can also explain a potential entrant’s likelihoodof entering (Haveman 1993a). Haveman (1993a) has argued that operational organi-zations in a market that are similar in size to a potential entrant will more stronglylegitimate that market than those that are less similar. The presence of similar sizedorganizations signals the feasibility of organizations of that size competing in themarket, encouraging the entry of organizations in that size class. However, whentoo many similar size organizations are operating in a market, competition will tendto decrease the likelihood that new organizations in that size class will seek to enter(Haveman 1993a). Organizations of similar size are likely to have similar strategiesand structures, and as a consequence to draw on similar sets of resources (Carrolland Hannan 2000). Competition among many similar sized organizations may there-fore be particularly intense, and so too will be its detrimental effects (Banaszak-Holl1991; Baum and Mezias 1992; Han 1998; Hannan et al. 1990; Ranger-Moore et al.1995). In a pre-entry context, if too many organizations of a similar size move froman organizing phase into the operational phase, other organizers from that same sizeclass may refrain from following. Combining these arguments, it is expected that theorganizers’ likelihood of entry will first increase and then decrease with the numberof similar size organizations.
Hypothesis 5.7. The number of similar size organizations already in operation willhave an inverted U-shaped relationship with the organizer’s rate of entry.
Aside from size as a determinant of the relevant reference group, the region-of-origin might be another dimension along which competitive and mimetic effectsare localized as, in an international context, organizations seem to be perceptuallyfocused on their peers from the same home region (cf. Guillen 2002; Yiu and Makino2002). Organizations from the same home region may form distinct communities inwhich actors mutually recognize each other’s presence and actions. Organizationsthat originate from the same region are therefore more likely to be in the samecognitive category and mimic each other’s behavior. But again, this happens onlyup to a certain extent (Haveman 1993a): if too many organizations from a particularhome region move from organizing into operation, other organizers from that same

92
78 5. WAITING TIMES AND PRE-ENTRY ACTIVITY
Figure 5.1: Number of representative offices and branches of foreign banks inShanghai, 1982-2004. Totals are for December 31 of each year.
home region may refrain from following.
Hypothesis 5.8. The number of operational organizations from the same homeregion has an inverted U-shaped relationship with the organizer’s rate of entry.
5.4 Empirical Context and Variables
Figure 5.1 depicts the historical trajectory of both representative offices and bankbranches in Shanghai. As this figure shows, the number of both representative officesand foreign branches in Shanghai grew rapidly for 20 years from the early 1980s. InDecember 1982, the Banque Nationale de Paris and the Bank of Tokyo were amongthe first to establish representative offices in Shanghai. By the end of 1988, the totalnumber of foreign banks in Shanghai had already reached 32.
The rise in the number of representative offices in Shanghai, however, came to astandstill in 1990 and even decreased in 1991. This decrease may be attributed to

93
5.4. EMPIRICAL CONTEXT AND VARIABLES 79
two causes. First, limitations on entering China’s financial markets became visibleafter the Tiananmen Square uprising in June 1989. Foreign banks, for their part,adopted a wait-and-see attitude towards the Chinese market and new developmentsprogressed with great caution (MacCormac 1993). As a result, the earlier boom innew representative offices came to a halt. Second, in the early 1990s it first becamepossible for foreign banks in Shanghai to ’upgrade’ their operations to the status ofbranch office. In other words, the decrease in the number of representative offices inthis period is partly complementary to the increase in the number of branches. Atfirst, the granting of licenses was rather experimental. Banks were chosen based on amixture of economic, political and historical motives. Favored were the quasi-foreignbanks, i.e. HSBC, the Overseas Chinese Banking Corporation, Standard Charteredand the Bank of East Asia, which had maintained a continuous presence in Shanghaisince the Communist Party seized power in 1949, but also banks such as Citibankthat had left the city shortly after the change of regime but had a long history in thecity before 1949. These banks were given branch permissions as early as 1990 and1991. Soon, however, the process of applying for licenses became more formalizedand mechanistic, so that in principle, every foreign bank meeting the requirementswas eligible to apply and equally likely to receive a branch license. It took bankson average four and a half years to establish a branch, with variations from aboutone year8 up to thirteen years (right-censored cases (n=53) and endings withoutachieving branch status9 (n=31) not included). Despite the relatively long waitingtimes (compared to those reported by Carroll and Hannan (2000), Ruef (2006),and Schoonhoven et al. (1990)) the number of candidates for a branch license(i.e. representative offices) as well as the number of branch licensees continued toincrease in the mid-1990s, mainly due to an improved economic climate in terms ofrapid growth in gross domestic product, a thriving real estate market, and a moreattractive capital market. A wave of mergers and acquisitions, most notable among
8Banks that were able to upgrade to branch status after one year may have fulfilled part ofthe mandatory waiting time requirement by means of a representative office elsewhere in China.Assumed here is that these banks started preparing for the status upgrade only after they came tobe located in Shanghai with a representative office. This assumption is based on our interpretationof the initiation of this event as a signal of the intent to set up a branch at a later stage. So forthese banks (n=13) the start of a representative office in Shanghai was coded as the start of theorganizing period.
9The substantial proportion of endings, of which 16 banks dropped out of the market altogether,moderates possible concerns over a selection bias in that only those banks that will transitionanyway might establish an office in the first place.

94
80 5. WAITING TIMES AND PRE-ENTRY ACTIVITY
Japanese financial institutions, was among the main factors that caused a drop inthe number of branch licensees during the last years of our observation window.
In order to model the transition from representative office to foreign branch, anumber of variables are introduced. Hypotheses 5.1 and 5.2 required measures re-lated to the magnitude and nature of multinationality. For this reason, we countedthe total number of foreign countries in which the parent organization had establish-ments (cf. Youssef 1975). This was done on two levels: 1) the number of countries inwhich the bank operated worldwide and 2) the number of countries in East Asia inwhich the bank had a presence. These variables could be further classified as eitherhigh or low (using the mean as a cut-off point). The result was that banks could becategorized in a two by two matrix: banks had either a low regional and low world-wide presence (462 ’bank-year’ observations), a high regional presence but a lowworldwide presence (54 observations), a high degree of multinationality worldwide,but little experience in East Asia (82 observations), or both regional and worldwideexperience (300 observations). Transition rates were then calculated for the four cat-egories10. In subsequent transition rate models only the extent of multinationalityworldwide was included for reasons of parsimony.
A second set of variables were density measures. Density was a time-varyingcovariate specified for both representative offices and branch offices, and on the citylevel and the district level. The city of Shanghai is divided in several administra-tive districts, of which (after investigating the address information in The Bankers’Almanac) nine were found to host foreign banks11. The effect of the presence ofother representative offices and foreign branches in the same district as well as inother districts on the rate of transition to branch office was tested. Similarly, inorder to test Hypothesis 5.8, the effect of the density of bank branches from thesame home region, as well as from other regions was evaluated. Home region wasdefined in terms of the following areas: Japan, Middle East, the rest of Asia, Europe,North America, South America, Africa, and Australia. In each of these analyses,the density measure was a simple count of offices or branches. All density measureswere lagged one year in the modeling. Some density tests were accompanied by asecond order term in order to capture any non-monotonic patterns, but when mod-
10The lognormal model appeared to be the superior functional form for each of these sub-categories.
11These districts are the four central districts of Luwan, Nanshi, Huangpu, and Jingan; the urbandistricts of Hongkow, Yangpu, Xuhui, and Changning; and the suburban district Pudong.

95
5.4. EMPIRICAL CONTEXT AND VARIABLES 81
eling these density effects we avoided testing them concurrently with other sets ofquadratic terms to avoid multicollinearity (cf. Hannan et al. 1995; McKendrick etal. 2003; Sørensen and Sorenson 2003; Sorenson and Audia 2000). A measure of sizeeffects was constructed based on the nearness between the size of an organizer andthe sizes of the organizations already operating. This nearness variable showed ahigh value for a particular representative office if its parent bank was similar in sizeto the banks already maintaining a branch office anywhere in Shanghai. (For detailson this measure of size localization, see Chapter 3.) Size, which was also includedseparately to capture the parent bank’s capacity to provide its affiliate in Shang-hai with the necessary funds, was approximated by the parent bank’s total assets.The size of the parent organization was used rather than the size of the affiliate inShanghai as (particularly in this stage of the development of the financial sector inShanghai) the foreign affiliates were far from self-sufficient. It is easy to imaginethat larger banks might experience lower political and economic entry barriers andwill find it easier to upgrade their offices to branch status (cf. Haveman 1993b;Haveman and Nonnemaker 2000). The logarithm of total assets was used in orderto normalize its distribution. To control for possible spatial heterogeneity acrossdistricts in Shanghai, the methods of Greve (2000, 2002) were applied by includinga dummy variable reflecting the centrality of the district. The distinction betweenurban districts, the suburban district Pudong, and the central districts (the latterbeing the benchmark in the models) appeared to capture much of this heterogeneitywhile remaining parsimonious in adding degrees of freedom. To control for possibletemporal heterogeneity in the transition rate, a variable was created describing thetiming of initial entry into Shanghai12, where initial entry refers to the setting upof a representative office. This variable was coded from 0 for foreign banks whichestablished a representative office in Shanghai in 1982, up to 22 for banks whichfirst established a representative office in 2004. To capture additional temporal vari-ations in the transition rate, the three month Eurodollar interest rate was included.It might be expected that higher interest rates would make it more attractive toestablish a branch office. Both types of variables have earlier been used by Leunget al. (2003) in a study of the profitability of foreign banks in Shanghai.
On the local market level, three variables were used. The first was the annualfigure for the total value of trade of the foreign bank’s home country with China. The
12A second-order effect of a squared term was investigated but it did not appear to be statisticallysignificant, so this term was therefore omitted.

96
82 5. WAITING TIMES AND PRE-ENTRY ACTIVITY
data were taken from various editions of the Direction of Trade Statistics Yearbookof the International Monetary Fund. Although no exact information was availableon the customer bases of the parent firms, it was assumed that in moving into Chinabanks were responding, at least in part, to the needs of their existing customers, inparticular those from their home country (cf. Martin, Mitchell and Swaminathan1995; Martin, Swaminathan and Mitchell 1998), and that these activities would alsoinfluence the bank in establishing a full branch. Including this measure of trade alsoserved as a crude approximation of the market’s carrying capacity (Hannan andCarroll 1992), which should be relevant to density dependence.
Another dummy variable was created to account for the foreign banks whichhad obtained licenses in 1990 and 1991. These were the first two years in whichobtaining a branch license was possible. As pointed out earlier, in this initial phasethe procedure for granting such licenses was less formal. Since Sørensen and Sorenson(2003) found a statistically significant negative effect of the number of transitions inthe previous year (in contrast to the findings of Carroll and Hannan (2000) or Ruef(2006) who tried similar measures), a variable was added to represent this as well.
Three control variables in the form of period effects were added to the dataset(which included all foreign banks in Shanghai), in order to account for the periodsin which each bank was factually not ’at risk’ of obtaining a branch license. One ofthese period effects related to the condition that a bank had to have maintained arepresentative office in China for two years before it could upgrade to a branch office(three years prior to 1994). So a bank was not ’at risk’ to make the transition in itsfirst years, during this probationary period. Since event history analysis focuses ontime at risk, these first years were coded with a dummy variable. A second controladded to the dataset concerned the capital requirements. According to the localregulations, foreign banks needed to be capitalized with at least USD 20 billion inorder to obtain a branch license, and to have a minimum capital adequacy ratio of8 percent. The years in which parent banks failed to meet these requirements werealso coded with a dummy variable. In addition to these two controls, a third controlwas added to reflect the period in which setting up a branch office was not yetpossible, i.e. the period between 1982 and 1989. This dummy variable is intendedto mitigate left censoring problems, such as sample selection bias. All variables aresummarized in Table 5.1.
A distinct class of banks included those which already had branches in China orwhich met the minimum waiting time requirement by maintaining a representative

97
5.4. EMPIRICAL CONTEXT AND VARIABLES 83
Table 5.1: Descriptive statistics and correlationsa.
Variable Mean SD Min. Max. Correlations
(1) (2) (3) (4) (5) (6)
(1) Multinationality 17.53 15.54 1 69(2) Size (in bln USD)b 138.61 144.41 1.14 1248.26 .58(3) Pudong 0.13 0.34 0 1 -.17 .11(4) Urban Districts 0.23 0.42 0 1 -.25 -.05 -.21(5) Entry Timing 11.97 5.35 0 22 -.33 -.29 .39 .28(6) Interest Rate 5.42 2.32 1.14 16.79 .28 .13 -.25 -.18 -.52(7) Lagged Transitions 2.94 2.55 0 11 -.10 -.02 -.08 .14 .17 -.23(8) Period Effect 1990/91 0.06 0.24 0 1 .30 .15 -.10 -.13 -.32 .37(9) Home Country Trade 2.76 3.10 0.01 13.36 -.40 -.15 .06 .32 .21 -.36(10) Left Censoring 0.16 0.36 0 1 .27 .12 -.17 -.23 -.53 .57(11) Size Requirement 0.14 0.35 0 1 -.31 -.73 .18 -.09 .24 -.12(12) Waiting Time 0.10 0.31 0 1 -.16 -.18 .06 .06 .27 -.13(13) Bra.Off. (City) 30.38 17.66 4 52 -.40 -.25 .37 .27 .73 -.60(14) Rep. Off. (City) 44.50 16.15 0 62 -.38 -.22 .26 .29 .67 -.49(15) Branch Off. (Dis.) 6.82 12.12 0 45 -.22 -.16 .92 -.16 .44 -.31(16) Rep. Off. (Dis.) 10.98 6.03 0 24 -.20 -.04 .20 .25 .10 -.09(17) Bra. Off. (Oth. Dis.) 23.56 16.62 4 52 -.26 -.15 -.28 .41 .46 -.42(18) Rep. Off. (Oth. Dis.) 33.53 15.85 0 62 -.31 -.20 .19 .20 .64 -.47(19) Nearness 21.44 14.14 0 41.10 -.35 .12 .36 .29 .71 -.62(20) Bra. (Same Reg.) 8.00 6.65 0 20 -.18 .07 .30 .14 .50 -.42(21) Bra. (Other Reg.) 22.38 13.89 2 52 -.42 -.28 .33 .28 .69 -.57
(7) (8) (9) (10) (11) (12) (13) (14) (15) (16) (17) (18) (19) (20)(8) -.29(9) .03 -.14(10) -.50 .42 -.24(11) .05 -.10 -.05 -.16(12) .15 -.09 -.04 -.15 .11(13) .20 -.39 .40 -.65 .22 .05(14) .31 -.39 .32 -.69 .21 .05 .89(15) -.02 -.15 .09 -.24 .20 -.09 .43 .31(16) -.01 -.01 .23 -.12 -.02 -.07 .15 .24 .36(17) .22 -.31 .35 -.51 .09 -.01 .75 .72 -.28 -.11(18) .32 -.39 .24 -.66 .22 .08 .85 .93 .18 -.14 .77(19) .21 -.39 .41 -.66 -.09 .03 .89 .80 .41 .15 .74 .83(20) .19 -.29 .01 -.48 .18 .01 .70 .64 .34 .13 .49 .60 .68(21) .16 -.35 .50 -.59 .20 .06 .94 .82 .38 .13 .72 .79 .83 .41a N of bank-year observations=889; correlations beyond +/- .09 are significant at the 1 percent level.b Correlations reported for size are those based on the logged version.
office for two years elsewhere in China. They could then set up a branch office inShanghai without first having had a representative office in the city. These bankshave been omitted from the analysis, since the length of their organizing period couldnot be objectively recorded, and because attempting to include them would havecompromised some variables. (For example, if some banks have no prior presence inone of Shanghai’s districts, densities at this level cannot be calculated.) Additional

98
84 5. WAITING TIMES AND PRE-ENTRY ACTIVITY
sensitivity analyses not reported here suggest that omitting these banks did notsubstantially bias the results13.
The final dataset contained 899 bank-year observations, including 125 individualbanks ’at risk’ of transition, of which 41 banks (or 32.8 percent) made the transitionto branch office before the end of the observation window.
5.5 Results
Figure 5.2 plots the duration dependence of the transition rate from representativeoffice to branch office for banks with different types and magnitude of multination-ality. Banks which had high degrees of both regional and worldwide multinationalexperience clearly had higher chances of setting up a branch office compared to bankswhich scored low on both items. This provides support for Hypothesis 5.1, whichpredicted that organizations with better developed capabilities would have an over-all higher transition rate over the duration of the organizing period. Hypothesis 5.2,however, which stated that organizations with a tendency towards more specializedcapabilities would also see this reflected in an overall higher transition rate, was notsupported. Banks which scored high on worldwide multinational experience, buthad little East Asian experience did not have higher overall transition rates thanthose which had a large presence in the region but not necessarily worldwide: bothcurves appear intertwined. What is striking, however, is that the transition rate ofbanks with regional experience peaked much earlier that of banks with experienceoutside the region: the transition rate for the first group peaked at around 9 years,while the latter group peaked at around 15 years. Taken together, these findingssuggest that the magnitude of an organization’s capabilities mainly predicted thelikelihood of entry, while the nature of those capabilities predicted the timing ofentry.
Table 5.2 reports the influence of the model’s covariates on the transition rate.In line with Hypothesis 5.3, the size of the branch office population appears to have
13We followed the methods of Carroll and Hannan (2000, 349) in re-estimating the models withsupplemental data attaching pre-entry spells to each bank that was able to establish a branchwithout first having had a representative office in Shanghai. Given the structure of the dataset(spells are split in annual pieces), a pre-entry phase of one year was assumed for each of thesebanks (n=11). Results of these tests are available on request from the author. They showed thatthe coefficients of the variables of interest were only marginally affected in terms of magnitude andstatistical significance.

99
5.5. RESULTS 85
Figure 5.2: Transition rate from representative office to branch office, dependenton the duration of the organizing period and the extent of multinationality.
been strongly related to an individual bank’s decision to upgrade to a branch office.Furthermore, the relationship was, as predicted, inverse U-shaped, as shown by thepositive first-order effect and the negative second-order effect. Below a particularthreshold (N *=22, falling well within the observed range), the number of branchoffices induced other foreign banks to start a branch office as well; beyond thatthreshold the transition rate declined. In contrast with the prediction of Hypothe-sis 5.4, no non-monotonic density dependent effects are evident for the number ofrepresentative offices at the city level (model 3). A model which tested for a lineareffect of the number of representative offices at the city level (not reported here) alsodid not display density dependence. The decision to upgrade to a branch office wasseemingly unrelated to the total number of representative offices in Shanghai. Inorder to test Hypothesis 5.5, density was also measured at the district level (models4 to 7). Again, an inverted U-shaped relationship was found between the number ofbranches and the transition rate. The size of the first-order relationship with branch

100
86 5. WAITING TIMES AND PRE-ENTRY ACTIVITY
density was found to be somewhat less strong on the district level than on the citylevel. In contrast, the second-order relationship with branch density was somewhatstronger.
A comparison between the coefficients related to within-district density and thedensity outside the district (i.e. city-level density minus district-level density), yieldsno statistically significant difference in a Wald test (first-order coefficients: χ2=0.14,second-order coefficients: χ2=0.08). The district-level specification (model 4) alsoshows poorer fit than the city-level specification (model 2). So, with respect tobranch offices, there was no support for the expectation that a stronger associationwould be found at smaller geographical scales. Hypothesis 5.6 was better supported.In contrast with what was found at the city level, representative office density at thedistrict level showed a statistically significant relationship with the transition rate.
The influence of the number of representative offices at the district was, how-ever, linear (in contrast with expectations): one additional representative office inthe same district predicted a reduction in the likelihood of transitioning to the op-erational stage by almost nine percent (exp(-0.092)=0.912). Representative officesthus were seemingly more strongly influenced in their decision to apply for a branchlicense by the number of other representative offices already in their district thanby offices elsewhere in the city. A Wald test of the equality of coefficients betweenthe density of representative offices within the district and the density outside thedistrict (based on the coefficients in model 7) confirmed a statistically significantdifference (at the one percent level) with a χ2 value of 9.99. Carroll and Hannan(2000) have earlier argued that organizers are particularly sensitive to other orga-nizers during the pre-entry stages. Our results prompt a refinement of this idea,suggesting that it is especially the organizers in nearby locations that matter.
The intuition that the identity of representative offices is particularly strong atthe district level while the identity of branch offices remains strong at the city levelwas further explored in model 8. This model included the density of branch officescitywide and the density of representative offices in each district, and this model didindeed improve significantly on the other models (e.g. model 8 vs. 2: Haberman’sχ2=5.92, ∆d.f.=1, p<.05). This suggests that the actions of a particular representa-tive office were visible to other representative offices in close geographical proximitybut were less clearly perceived in other parts of the city. When representative officesin other parts of the city upgraded their operations to the status of branch office,however, they did become more visible, and then exerted a stronger influence on

101
5.5. RESULTS 87
Table 5.2: Piece-wise exponential models of the transition rate from representativeoffice to branch office in Shanghai, 1982-2004a.
Variable Model 1 Model 2 Model 3 Model 4 Model 5
Organizing Periodb
0<u ≤ 2 -8.358∗∗ -11.578∗∗ -5.643 -7.177∗ -11.764∗∗
(3.092) (3.346) (4.699) (3.129) (3.379)
2<u ≤ 4 -6.873∗ -9.998∗∗ -4.095 -5.659† -10.273∗∗
(3.006) (3.307) (4.690) (3.072) (3.285)
4<u ≤ 7 -7.018∗ -9.216∗∗ -4.245 -5.854† -9.903∗∗
(2.937) (3.222) (4.639) (3.033) (3.205)
7<u ≤ 11 -6.874∗ -8.561∗∗ -4.045 -5.389† -9.430∗∗
(2.952) (3.318) (4.707) (3.023) (3.227)
u >11 -7.680† -8.885∗ -4.669 -6.251∗ -10.155∗∗
(2.925) (3.470) (4.856) (3.083) (3.248)
OrganizationalCharacteristicsMultinationality 0.030∗ 0.036∗ 0.030∗ 0.030∗ 0.029∗
(0.013) (0.014) (0.013) (0.013) (0.014)
Sizec 0.365 0.254 0.361 0.292 0.375(0.242) (0.277) (0.243) (0.248) (0.266)
Spatial HeterogeneityPudong 1.991∗∗ 2.565∗∗ 2.016∗∗ 2.764∗∗ 1.612∗∗
(0.525) (0.568) (0.537) (0.596) (0.574)
Urban Districts 0.786 1.071∗ 0.793 0.631 0.807(0.505) (0.525) (0.515) (0.508) (0.517)
TemporalHeterogeneityTiming Initial Entry -0.071 0.107† -0.053 -0.055 0.000
(0.059) (0.065) (0.075) (0.058) (0.068)
EnvironmentInterest Rate -0.138 -0.003 -0.149 -0.301∗ -0.160
(0.113) (0.125) (0.129) (0.140) (0.148)
Lagged Transitions 0.129∗ 0.024 0.108 0.070 0.057(0.066) (0.083) (0.070) (0.084) (0.098)
Period Effect 1990/91 2.151∗∗ 2.243∗ 2.181∗∗ 3.059∗∗ 3.646∗∗
(0.703) (0.930) (0.757) (0.894) (1.183)
Home Country Trade -0.119 -0.083 -0.113 -0.107 -0.118(0.079) (0.088) (0.080) (0.083) (0.085)
Other ControlsLeft Censoring -19.511 -18.443 -20.226 -19.156 -17.820
(4.363*103) (3.764*103) (4.460*103) (3.633*103) (2.394*103)
Size requirement -17.473 -17.025 -17.472 -16.763 -16.134(4.909*103) (4.274*103) (4.915*103) (4.362*103) (2.931*103)
Mandatory waiting time -17.070 -17.090 -17.010 -16.586 -16.230(5.936*103) (5.316*103) (5.883*103) (5.178*103) (3.598*103)
Continued on next page.

102
88 5. WAITING TIMES AND PRE-ENTRY ACTIVITY
Table 5.2: Continued
Variable Model 1 Model 2 Model 3 Model 4 Model 5
Densities (City-Level)Branch Offices 0.214∗∗
(0.075)
(Branch Offices)2/100 -0.487∗∗
(0.134)
Representative Offices -0.137(0.178)
(Rep. Offices)2/100 0.150(0.197)
Densities (District-Level)Branch Off. District 0.165∗
(0.074)
(Branch Off. District)2/100 -0.592∗∗
(0.201)
Branch Off. Other Dist. 0.267†
(0.077)
(Branches Other Dist.)2/100 -0.534†
(0.153)
Obs. (bank-years) 889 889 889 889 889Log-likelihood -45.91 -35.72 -45.60 -37.26 -37.63LR χ2
(d.f.)96.42(16) 116.79(18) 97.03(18) 113.73(18) 112.98(18)
Haberman’s χ2 (∆d.f.) 20.38(2)∗∗ 0.31(2) 17.30(2)∗∗ 16.56(2)∗∗
vs. baselineSignificance levels : † : 10% ∗ : 5% ∗∗ : 1%a Standard errors are in parentheses.b u is the length of the organizing period measured in years.c Natural logarithm.
other banks’ decisions to convert to branch offices as well.
Relative size also appeared to play an important role in delineating the strengthof the identity of other organizations in the market, providing support for Hypoth-esis 5.7. Nearness, which was designed to reflect differences in size between anorganizer and the fully established organizations, showed a statistically significantnon-monotonic relationship. With initial increases in the proportion of similar sizeorganizations, the transition rate increased as well, but when organizations of sim-ilar size became too numerous, the transition rate declined. Including nearness inmodel 9 also led to an (albeit small) improvement in fit over model 8.
Hypothesis 5.8, in which we predicted that the number of operational organiza-tions from the same home region has an inverted U-shaped effect on the transitionrate, receives general support. In addition to banks from the same home region,

103
5.5. RESULTS 89
Table 5.2: Piece-wise exponential models of the transition rate from representativeoffice to branch office in Shanghai, 1982-2004a -Continued-
Variable Model 6 Model 7 Model 8 Model 9 Model 10
Organizing Periodb
0<u ≤ 2 -8.722∗∗ -7.839∗∗ -11.490∗∗ -11.727∗∗ -10.120∗∗
(3.208) (3.022) (3.316) (3.244) (3.469)
2<u ≤ 4 -7.194∗ -6.222∗ -9.838∗∗ -10.043∗∗ -8.350∗
(3.173) (2.967) (3.289) (3.204) (3.450)
4<u ≤ 7 -7.295∗ -6.269∗ -9.042∗∗ -9.273∗∗ -7.827∗
(3.115) (2.896) (3.179) (3.093) (3.348)
7<u ≤ 11 -7.027∗ -5.988∗ -8.320∗ -8.561∗∗ -7.185∗
(3.109) (2.910) (3.247) (3.152) (3.412)
u >11 -7.740∗ -6.605∗ -8.567∗ -8.860∗∗ -7.234∗
(3.139) (2.987) (3.411) (3.307) (3.533)
OrganizationalCharacteristicsMultinationality 0.023† 0.026∗ 0.031∗ 0.029∗ 0.029∗
(0.013) (0.013) (0.014) (0.014) (0.014)
Sizec 0.411† 0.356 0.293 0.357 0.372(0.243) (0.236) (0.266) (0.255) (0.282)
Spatial HeterogeneityPudong 1.962∗∗ 1.753∗∗ 1.949∗∗ 1.928∗∗ 1.926∗∗
(0.554) (0.509) (0.578) (0.581) (0.556)
Urban Districts 0.753 0.565 0.831 0.765 0.777(0.540) (0.506) (0.518) (0.513) (0.517)
TemporalHeterogeneityTiming Initial Entry -0.042 -0.082 0.125† 0.126† 0.112
(0.058) (0.074) (0.065) (0.066) (0.069)
EnvironmentInterest Rate -0.134 -0.108 0.004 -0.013 -0.089
(0.123) (0.130) (0.133) (0.140) (0.120)
Lagged Transitions 0.109 0.108 0.018 -0.005 0.061(0.070) (0.068) (0.085) (0.090) (0.072)
Period Effect 1990/91 2.496∗∗ 2.208∗∗ 2.478∗∗ 2.684∗∗ 2.211∗∗
(0.816) (0.776) (0.956) (1.028) (0.843)
Home Country Trade -0.104 -0.093 -0.065 -0.069 -0.114(0.081) (0.081) (0.089) (0.090) (0.104)
Other ControlsLeft Censoring -19.226 -19.445 -18.162 -17.995 -18.425
(3.710*103) (4.304*103) (3.261*103) (3.240*103) (2.556*103)
Size requirement -16.965 -17.341 -16.604 -17.492 -16.643(4.409*103) (4.982*103) (3.844*103) (3.920*103) (3.881*103)
Mandatory waiting time -16.888 -17.074 -16.830 -16.813 -16.549(5.145*103) (5.757*103) (4.568*103) (4.520*103) (4.492*103)
Continued on next page.

104
90 5. WAITING TIMES AND PRE-ENTRY ACTIVITY
Table 5.2: Continued
Variable Model 6 Model 7 Model 8 Model 9 Model 10
Densities(City-Level)Branch Offices 0.199∗
(0.079)
(Branch Offices)2/100 -0.441∗∗
(0.139)
Densities(District-Level)Rep. Offices District 0.032 -0.092∗∗ -0.070∗ -0.067∗ -0.076∗∗
(0.124) (0.035) (0.029) (0.030) (0.028)
(Rep. Off. Dist.)2/100 -0.595(0.615)
Rep. Off. Other Dist. -0.006(0.020)
Other Weighted Dens.(City-Level)Branches Size Nearness 0.227∗
(0.095)
(Size Nearness)2/100 -0.684∗∗
(0.219)
Branches Same Region 0.234†
(0.130)
(Same Region)2/100 -1.345∗
(0.621)
Branches Other Regions -0.049(0.030)
Obs. (bank-years) 889 889 889 889 889Log-likelihood -39.97 -40.41 -32.76 -32.52 -35.87LR χ2
(d.f.)108.30(18) 107.41(18) 122.73(19) 123.73(19) 116.50 (20)
Haberman’s χ2 11.88∗∗ 11.00∗∗ 26.30∗∗ 26.78∗∗ 20.08∗∗
vs. baselineSignificance levels : † : 10% ∗ : 5% ∗∗ : 1%a Standard errors are in parentheses.b u is the length of the organizing period measured in years.c Natural logarithm.
another variable represented banks from other regions. The effect appeared to beeconomically significant (an additional bank from another region implied a reduc-tion in the estimated transition rate of almost five percent), but this relationshipwas not statistically significant. Overall, it should be noted, however, that model 10,in which region-of-origin effects were tested, did not seem to substantially improvethe fit achieved with model 8, so a conclusion that banks from the same region

105
5.6. DISCUSSION 91
are a more relevant reference group with a stronger identity does not appear tobe warranted. Among the control variables, the likelihood that an individual bankupgraded to a branch office was seemingly positively affected by a location in thePudong district of Shanghai and by exploiting the preferential policy of the years1990 and 1991. Also the extent of multinationality showed a statistically significanteffect. This latter finding shows that a bank’s international experience mattered, asopposed to sheer size, for which no significant predictive power was evident.
5.6 Discussion
The early stages of firm activity that pre-date its entry into a population have re-ceived only scant attention in previous organizational ecology research. This studyinvestigated how successful entry is related to both the duration of the organizingperiod as well as on social actors in the entering organization’s environment. Sev-eral hypotheses related to these issues were tested using data on a population ofnew affiliates of international banks in Shanghai. The findings show, first of all,that the transition from the organizing period to entry into the population was non-monotonically dependent on the duration of the organizing period, a finding that is inline with results of earlier studies by Carroll and Hannan (2000) and Schoonhoven etal. (1990). The exact pattern of duration dependence appeared to differ dependingon the organizer’s capabilities: banks with more multinational experience had highertransition rates throughout the organizing period than those which had little multi-national experience. In addition, banks with more context-specific multinationalexperience (experience in the East Asia region) seem to have had shorter waitingtimes than those which had gained their experience elsewhere. One explanationcould be that the timing and likelihood of entry were each influenced by differentprocesses or constituents. Social actors in the organizer’s environment might, forinstance, have influenced the overall likelihood by assigning positive evaluations toorganizers with a high degree of multinationality, while the speed at which the orga-nizer could go through the pre-entry stages then depended on the extent to which itsown capabilities (in terms of multinationality) were specialized. At the very least,the finding that an organizer’s capabilities were related to the likelihood and timingof entry hints at possible differences between de novo and de alio organizers in thepre-entry stages. Although this study focused on de alio organizers exclusively (andthus was precluded from being affected by heterogeneity of this type), its results
106
92 5. WAITING TIMES AND PRE-ENTRY ACTIVITY
strongly suggest that future studies on mixtures of de alio and de novo organizersshould control for their inherent differences in capabilities.
In addition to investigating how the likelihood of moving from pre-entry activityto entry was related to duration, how this process was influenced by social interac-tions was investigated in greater depth than in previous studies. Those effects wereweighted by location and size, as well as country-of-origin. In terms of location,organizers appeared to be affected only by the actions of their peers within closelybounded areas, and they were seemingly unaffected by organizers located outsidethose areas. In developing an interpretation for this finding, we draw attention toanother stream in ecological research, namely that studying organizational identity(Hannan et al. 2005; Hsu and Hannan 2005; McKendrick et al. 2003; Polos et al.2000, 2002; Ruef 2000). The results showing that the influence of organizers dif-fers from that of operational organizations suggests that any organizer starts with aspatially limited identity. (Though it is not necessarily weak, since many other or-ganizers located in close geographical proximity will recognize that organizer, as willothers in the organizer’s local network.) The actions of the organizers at this stageare strongly influenced, however, by the identities of the organizations already in op-eration. Geographical distance plays a lesser role here: the actions of the organizerare also influenced by the still sharp identities of already established organizationsin more distant areas. This also implies that once an organization becomes fullyestablished, its identity is likely to broaden geographically and is likely to influencea broader audience. One possible explanation could be that the organizer, once ithas entered, starts to adopt more features of the form’s identity (Polos et al. 2000,2002; Hannan et al. 2005), features it shares with other members of the form.
The findings of this study also suggest that future empirical studies of pre-entryactivity could substantially improve their specifications by considering the effectsof organizers and fully established organizations on different geographical levels.They also suggest that much is to be gained by analyzing the spatial dimensionof social identity. Future research could further explore not only how geographicaldistances between organizations matter, but also how distances between audiencemembers (Hannan et al. 2005; Hsu and Hannan 2005) or between audiences andorganizations affect social identities. Another interesting avenue for research wouldbe how geographical distance between organizations affects the similarity judgmentsof audience members. An example of the latter is provided by an earlier analysisby McKendrick et al. (2003) who showed that organizational identities more readily

107
5.6. DISCUSSION 93
cohere into an organizational form if the organizations are geographically proximate.This study also found that operational organizations differ in the extent to whichthey exert an influence on individual organizers. Organizations that resemble theorganizer are especially likely to influence the organizer in making the transitionto a fully established organization (cf. Helfat and Lieberman 2002). Evidence wasfound for size-localized legitimation and competition, indicating that organizers areparticularly sensitive to the identities of similarly-sized organizations, which theyare likely to consider part of the same cognitive category. A similar pattern couldnot be found for banks that originated from the same home region. Home regioneffects were found, but models that investigated them did not substantially improveupon models with ’standard’ density variables, suggesting that organizations fromthe same home region did not form a significant reference group in this particularsetting.
One potential limitation of this study is the highly regulated nature of the pre-entry process, which may have been driven by political motives instead of the char-acteristics of the foreign banks. This might especially have been the case in the early1990s, for which we tried to control in our statistical models. In general, however, wethink the limitations of studying a strong regulatory environment are outweighedby its benefits. Although, as Sørensen and Sorenson (2003) indicate, regulationcreates a disadvantage in terms of one’s ability to draw strong inferences, it doesprovide a rare insight into the pre-entry phase, since the sequential stages are soclearly marked with objectively recorded data. As this study shows, regulations canprovide an exceptional natural experiment in delimiting a time period of potentialentry and a transition phase from one clearly defined pre-entry organizational formto another more developed organizational form.
Another limitation might be a potential lack of generalizability of the resultsof this study. Some would argue that the context presented here is too atypicalof other countries in terms of the level of government control, the culture, and thesocial dynamics. Although these issues have certainly affected the findings to someextent, we think that the overall patterns found are not necessarily context specific.Take again our results concerning the duration dependence of the transition rate(which we found to follow an inverted U-shaped pattern). As noted, this particularpattern has earlier also been found in a study of US automobile producers (Carrolland Hannan 2000) and in a study of semiconductor firms (Schoonhoven et al. 1990).In these studies, however, the peak in the duration dependent transition rate came

108
94 5. WAITING TIMES AND PRE-ENTRY ACTIVITY
after six and two and a half years respectively; in the context presented here thepeak came after roughly twelve years. Despite the differences in the location of thepeak (which can be explained by context-specific factors), the inverted U patternwas nevertheless found in highly diverse regions and industries. Where else it holds,of course, remains an issue to be examined in future research.
Future research should attempt to incorporate the effects of other audiencesthat might influence organizers to move from pre-entry to full membership of apopulation (Philips and Zuckerman 2001; Zuckerman 1999). Such audiences mayinclude the already validated members of the population (here, bank branches),investors, employees, potential customers, regulators, and industry analysts (Hsuand Hannan 2005; Hannan et al. 2005). In this particular context, regulators wereprobably the most relevant audience, but employees (involved in the factual resourceallocation needed for the status upgrade) and potential customers may also have beenimportant. For instance, if multinational companies allocated their attention andresources to particular representative offices, those representative offices would havebeen more likely to apply for a branch license with local regulators. The allocationof attention and resources by potential customers in the candidacy phase shouldsignal that there is a reasonable prospect of sufficient customers once the bank hasbecome a member in the population of bank branches. On the other hand, the bankwill probably wait and postpone the transition to branch office status if there isno reasonable prospect of receiving business in the future. An ecological model topredict the likelihood of moving from pre-entry activity to entry, as developed here,may serve as a basis for incorporating measures for various audiences. Such an effortis likely to further illuminate various aspects of the identity formation process.

109
6
De-Partitioning and
Competitive Exclusion
This chapter examines the competitive interactions between domestic Chinese banksand foreign banks in Shanghai. First, a background is provided on the domesticbanking sector. It is postulated here that in recent years domestic banks haveincreasingly started to exert competitive pressure on their foreign counterparts. Twopossible explanations are subsequently presented based on ecological arguments: onebased on Carroll’s (1985) resource partitioning theory, the other on Gause’s (1934)’principle of competitive exclusion’. These explanations are then closer examinedby modeling data on the time-to-profitability of foreign banks. On a more generallevel, the results of this chapter shed light on the degree to which domestic bankshave impeded the re-emergence of foreign banks in Shanghai.
6.1 Competition with Domestic Banks
Prior to the reforms initiated in 1978, there were only three domestic banks in China:the People’s Bank of China, the Bank of China, and the Construction Bank of China.The de facto structure of China’s banking structure however resembled more thatof a mono-bank system: the Bank of China did not operate independently and wassubordinate to the People’s Bank of China. The Construction Bank of China was abank only in name as it functioned as a subsidiary of the Ministry of Finance (Lardy1998). The dominant bank, the People’s Bank of China, operated both as the solecommercial bank, as well as the central bank which regulated money supply and
95

110
96 6. DE-PARTITIONING AND COMPETITIVE EXCLUSION
interest rates.
During the initial phase of the reform era, the first steps were taken to departfrom this mono-bank system. In February 1979, the Agricultural Bank of Chinacame into existence and later that year, the Bank of China was separated from thePeople’s Bank of China. The most fundamental change in China’s banking systemhowever came in January 1984, when the People’s Bank of China was assigned theformal status of central bank. As a consequence, all of its deposit and lending activ-ities were transferred to a newly established bank, the Industrial and CommercialBank of China. The result of these changes was a banking system consisting offour large banks (which became known as the ’Big Four’), supervised by the Peo-ple’s Bank of China. This system was highly segregated with each bank coveringa distinct part of the market space. The Agricultural Bank of China focused ondeposit-taking and lending activities in rural areas, the Construction Bank of Chinaaimed at financing real estate projects and investments in fixed assets, the Indus-trial and Commercial Bank of China focused on financing state owned commercialand industrial enterprises, and the Bank of China covered the area of internationalbanking and foreign exchange. Due to this market segregation, competition amongthe Big Four banks remained limited (Wong and Wong 2001).
This situation changed with the founding of three so-called policy banks in 1994,banks that among others took over the activity of extending policy loans1 from thefour large banks. The three policy banks (the China Development Bank, the Export-Import Bank of China, and the Agricultural Bank of China) not only increasinglyposed more competitive pressure on the Big Four state banks, but also experienceddirect competition amongst themselves (Wong and Wong 2001). Further liberaliza-tion of the market led to the establishment of several other banks, such as the Bankof Communications in 1987 and the Everbright Bank in 1992, introducing more el-ements of competition to the market. In Shanghai, also so-called city commercialbanks were set up, including the Pudong Development Bank in 1993 and the Bankof Shanghai in 1995. By the end of 2002, there were 15 domestic banks in Shanghaialone (Figure 6.1). With the increase in the number of domestic banks, the marketalso became less concentrated. While in the pre-reform era, the four-firm concen-tration ratio in the Shanghai market was close to unity (the market basically beingin the hands of the People’s Bank of China), this figure has been decreasing to 81
1Policy loans can be seen as directed credit programs, in which the allocation of loans is drivenby government objectives (Lardy 1998).
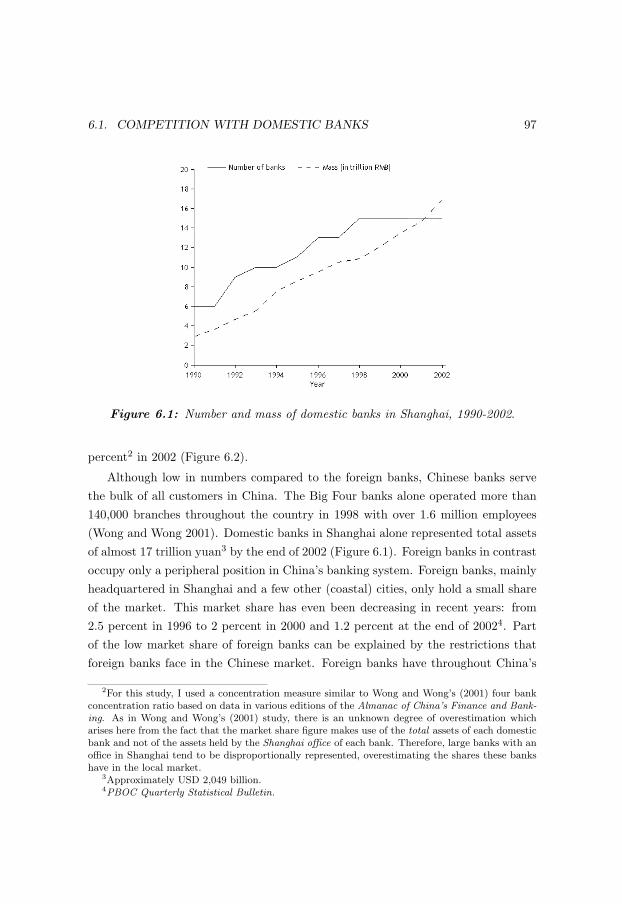
111
6.1. COMPETITION WITH DOMESTIC BANKS 97
Figure 6.1: Number and mass of domestic banks in Shanghai, 1990-2002.
percent2 in 2002 (Figure 6.2).
Although low in numbers compared to the foreign banks, Chinese banks servethe bulk of all customers in China. The Big Four banks alone operated more than140,000 branches throughout the country in 1998 with over 1.6 million employees(Wong and Wong 2001). Domestic banks in Shanghai alone represented total assetsof almost 17 trillion yuan3 by the end of 2002 (Figure 6.1). Foreign banks in contrastoccupy only a peripheral position in China’s banking system. Foreign banks, mainlyheadquartered in Shanghai and a few other (coastal) cities, only hold a small shareof the market. This market share has even been decreasing in recent years: from2.5 percent in 1996 to 2 percent in 2000 and 1.2 percent at the end of 20024. Partof the low market share of foreign banks can be explained by the restrictions thatforeign banks face in the Chinese market. Foreign banks have throughout China’s
2For this study, I used a concentration measure similar to Wong and Wong’s (2001) four bankconcentration ratio based on data in various editions of the Almanac of China’s Finance and Bank-ing. As in Wong and Wong’s (2001) study, there is an unknown degree of overestimation whicharises here from the fact that the market share figure makes use of the total assets of each domesticbank and not of the assets held by the Shanghai office of each bank. Therefore, large banks with anoffice in Shanghai tend to be disproportionally represented, overestimating the shares these bankshave in the local market.
3Approximately USD 2,049 billion.4PBOC Quarterly Statistical Bulletin.

112
98 6. DE-PARTITIONING AND COMPETITIVE EXCLUSION
Figure 6.2: Concentration of domestic banks in Shanghai, 1990-2002.
reform era largely been banned from conducting banking business in the local cur-rency (the Renminbi or RMB). Additionally, since restrictions imposed on foreignbanks prevent them from taking deposits from and lending to privately owned localcompanies and Chinese citizens, foreign banks have mainly focused on multinationalcorporations and different types of foreign-invested enterprises (He and Fan 2004).Despite the fact that this is a rapidly growing group of potential customers, it hasclearly limited the growth potential of foreign banks.
On the other hand, deregulation did allow foreign banks to gradually move intoparticular areas. As indicated in Chapter 2, the regulatory environment for foreignbanks in China experienced some significant changes since the reform process was setin motion in 1978. Major changes in the regulatory environment were the possibilityfor representative offices to upgrade to the status of branch office in 1990 (see alsoChapter 5), the possibility to obtain a local currency license starting in 1996, andthe possibility to offer foreign currency services to Chinese citizens and enterprisesas of December 2001. These changes have allowed foreign banks to increasinglyoperate on the territory of domestic banks, in particular when it comes to providingloans to government agencies and state-owned enterprises. Domestic banks, for their

113
6.2. REVERSED RESOURCE PARTITIONING 99
part, have adopted aggressive strategies and progressively moved on the territoryof foreign banks, that is, financing multinationals in China5. In ecological parlance,it can thus be said that the niche overlap between domestic and foreign banks inChina has been increasing. Competition between domestic and foreign banks hasbeen facilitated by the existence of interest rate differentials, creating the conditionsfor price competition. In this market, domestic banks are able to offer low-interestrate loans to multinationals, rates with which foreign banks find it hard to compete.
How to account theoretically for the increased pressure felt by foreign banksin this market? Organizational ecology offers at least two lines of reasoning6 thatmight apply to this particular case. The first is a reversal of the resource partition-ing process (cf. Dobrev 2000), in which the increased pressure on the peripheralforeign banks is seen as a consequence of the decreased concentration among domes-tic banks, i.e. a shift of these domestic banks from the market center towards theperiphery. The second interpretation is that we are simply witnessing a process of’competitive exclusion’ (Hannan and Freeman 1977, 942–943), in which one organi-zational population is outcompeting another population in an increasingly similarresource environment. Both will be discussed below.
6.2 Reversed Resource Partitioning
Organizational ecology’s theory fragment of resource partitioning (Carroll 1985)takes as a starting point the environment in which populations of organizations areactive. In Carroll’s (1985) seminal article, this environment is represented as a finite,multidimensional and heterogeneous resource space in which organizations occupypositions dependent on the resources they draw upon. On a variety of dimensions,the resources in this space tend to be unevenly distributed and in many cases roughlyunimodal: there typically is one area along a particular dimension with a peaklevel of available resources. For example, Boone, Carroll and van Witteloostuijn(2002), in their analysis of the Dutch daily newspaper industry, point to a variety
5This is in line with Leung et al. (2003) who suggest that multinational corporations from onecountry no longer are served solely by banks from that same country: multinational enterprises inShanghai are also served by banks from other countries, and indeed domestic banks.
6A third perspective on inter-population competition might build on the Red Queen model oforganizational evolution (e.g. Barnett and Hansen 1996). In this model, the competitive pressuregenerated by an organizational population is represented by the sum of individual organizations’(recent) competitive experiences.

114
100 6. DE-PARTITIONING AND COMPETITIVE EXCLUSION
of resource dimensions that appear to be relevant in explaining the dynamics ofthis industry. Among the dimensions considered to represent consumer resources(newspaper readers) are the age structure, religious and political preferences, andeducation profile. All of these dimensions appeared to be distributed unimodally:for political preferences, for example, the authors describe five categories (extremeleft, left wing, center, right wing, extreme right) of which most resources are found tobe located in the left wing and center segments, with relatively few resources in themore peripheral extreme left and extreme right political segments. The organizationsthat are considered to occupy positions in this resource space generally come in twotypes: organizations that serve the peak, the so-called generalists, and those thatoccupy positions in peripheral areas with thinly spread resources, the specialists.
Each generalist tries to serve the peak because this allows the organization toachieve economies of scale. Paradoxically, the resulting scale-based competitionhowever leads to increased mortality rates among generalists (Carroll and Hannan1995) and consequently, the number of generalists declines. With the failure ofindividual generalists, resources that become available will generally be absorbedby adjacent generalists. The surviving generalists will thus become larger in size astime passes. As this increasingly smaller set of generalists moves towards the marketcenter, they will find it increasingly difficult to secure the resource areas that arelocated more towards the periphery of the resource space. This might be due to costor uncertainty considerations or even constraints in identity or capabilities (Booneet al. 2002). Concentration among generalists in the market center thus opens upfree resource space at the periphery. Specialists, which tend to operate in areaswith thinly spread resources, may therefore increasingly find suitable positions inthe margins of the resource distribution. In the periphery of the resource space,specialists can also grow and prosper. The causal mechanism of -on the one hand-increasing generalist concentration and -on the other hand- increased chances ofsuccess for specialists is the core prediction of resource partitioning theory (Carroll1985) and has been empirically validated in a large number of studies (e.g. Carroll1985; Dobrev et al. 2001; Freeman and Lomi 1994; Mezias and Mezias 2000; for amore complete overview see Carroll, Dobrev, and Swaminathan 2002).
Dobrev (2000) argues that the process can also be reversed. That is, decreasinggeneralist concentration leads to decreased chances of success for specialist orga-nizations. Dobrev (2000), however, does not claim that (decreasing) economies ofscale are responsible for lower levels of concentration. Instead, he points to two

115
6.2. REVERSED RESOURCE PARTITIONING 101
alternative mechanisms that drive down concentration, namely resource depletionand deregulation. Under the condition of resource depletion, small organizationsin the periphery will be the first to fail (due to a liability of smallness, see alsoCarroll and Hannan 2000, 313–338). As a consequence of this, and because of thefact that inertial tendencies prevent larger sized organizations near the center fromabsorbing the newly available resources in the periphery, the proportion of medium-size organizations will increase. The increase in these medium-size organizationswill lead to a decrease of concentration in the industry. Deregulation is the othercondition affecting concentration, since deregulation leads to the break-up of formerstate monopolies into smaller and leaner entities (Dobrev 2000; Peli 1999). Thesespin-off organizations will seek positions away from the crowded market center, defacto also reducing concentration. The result of de-concentration among the gener-alist organization puts increased pressure on the specialists in the periphery (Dobrev2000).
Figure 6.3 displays this process in a two dimensional resource space7. The cir-cles represent areas covered by individual organizations in this resource space. Ina concentrated market (panel A), a single organization (F1) occupies the marketcenter, the place where the distribution of resources peaks. If this organization iseither split up into smaller entities or new organizations are allowed into the market(as part of a deregulation policy), the market will de-concentrate. This situation isrepresented in panel B. Although individual organizations will tend to be smalleron average, their aggregate size (the area covered by areas F2 + F3 + F4 + F5)will generally be larger as each organization will seek some degree of differentiation,away from the market center. As a result, the amount of resource in the peripheralareas of the resource space decreases (i.e. the open space not covered by the circlesin Figure 6.3), which will reduce the survival chances of specialists.
Dobrev (2000), analyzing the post-socialist Bulgarian newspaper industry be-tween 1987 and 1992, indeed found that decreasing concentration among generalistnewspapers reduced the survival rates of specialist newspapers in the periphery. Asgeneralist newspapers experienced a decline of their market share they retrenchedtowards the periphery of the market where they engaged in more direct competitionwith specialist newspapers. Dobrev (2000) however did not find a similar result forhis hypotheses pertaining to founding rates: under decreased concentration he pre-
7This figure is in fact a reversal of Carroll’s (1985) figure 1.

116
102 6. DE-PARTITIONING AND COMPETITIVE EXCLUSION
Figure 6.3: De-concentration in a two-dimensional resource space.
dicted higher founding rates for generalists in the market center and lower foundingrates for specialists in the periphery, but no empirical support was found. Reflect-ing on this result, Dobrev (2000) argued that resource distributions in the Bulgariannewspaper market might have been bimodal and the decreased concentration overallmight have been concealing increased concentration in each of the two peaks in thisresource distribution8.
In the present analysis, it is assumed however that, due to a lack of evidencepointing in the direction of bimodality, the Shanghai banking industry does notexhibit such a dual market structure, but instead a default unimodal resource dis-tribution. Furthermore, it is argued that in this particular environment, domesticbanks can be defined as a set of generalists, whereas foreign banks are defined asspecialist organizations9. These roles are assigned based on the differences between
8Dobrev (2000) however leaves open the question why this dual market structure did not affectthe relationship between concentration and specialist mortality rates.
9Earlier, in Chapter 4, I defined the community of multinational banks as a set of generalistorganizations. Here, however, these banks are seen as specialists. What has changed? In Chapter4, the environment in which multinational banks operate was seen from a global perspective, withmultinational banks operating in a variety of nation-states. In this chapter however, the nation-state is kept constant and the multinational banks appear to be very peripheral players in thisenvironment. This is in line with Freeman and Hannan (1983, n11) who argue that the extent ofspecialism or generalism must be defined relative to the environment. Also note that there is asubtle difference between generalism in the context of resource partitioning theory and generalismin the context of niche width theory. In resource partitioning, generalists try to serve the peak inthe distribution of resources (the ’depth’ of the appeal), whereas in niche width theory, generalistshave broad niches (the ’breadth’ of the appeal).
117
6.2. REVERSED RESOURCE PARTITIONING 103
foreign and domestic banks in terms of their position in resource space: foreign banksoperate in the areas with thinly spread resources, while Chinese banks are active insuch areas as retail banking, the market where the bulk of available resources arelocated (He and Fan 2004; Fu 1998; Lees and Liaw 1996; MacCormac 1993). Theinterpretation of Shanghai’s banking system is that, over time, the generalist domes-tic banks have moved into a direction that is in line with the reversal of the resourcepartitioning theory as described by Dobrev (2000). From a mono-bank system, inwhich one bank attempted to control and cover various central areas of banking,the banking system has expanded and became increasingly de-concentrated. Newbanks that came into existence have sought differentiation by providing new servicesand targeting new areas. By doing so they generally moved away from the marketcenter in the direction of the peripheral areas in which the specialist foreign bankswere located. Hence, it is postulated that:
Hypothesis 6.1 (Reversed Resource Partitioning). Decreased concentration amongthe generalist, domestic banks is associated with a lower profitability rate of specialist,foreign banks.
In order to test this hypothesis, one particular assumption as put forward inCarroll’s (1985) resource partitioning theory has to be relaxed however. As I pointedout in the introductory part of this chapter, it is clear that price levels (i.e. interestrates) do play a role in this particular context. Part of the reason why in someareas foreign banks are outcompeted by domestic banks is because the latter groupis able to grant loans at lower interest rates. One of the scope conditions of Carroll’s(1985) resource partitioning theory however is the absence of price competition: withequal price levels (and in the presence of economies of scale), large-scale firms willhave the highest profit margins. Since a reversed resource partitioning process is inessence not driven by (a diminished importance of) economies of scale, but rather byderegulation (Dobrev 2000), relaxing the scope condition of no real price competitionhere seems to be defendable. A consequence would be that, if Hypothesis 6.1 indeedholds, then this may provide evidence that price competition is asymmetric in itsfunction as a scope condition: an absence of price competition might then be anecessary condition for a general resource partitioning process (as Carroll (1985)argues), but not a necessary condition for a reversed resource partitioning processas articulated by Dobrev (2000).

118
104 6. DE-PARTITIONING AND COMPETITIVE EXCLUSION
6.3 The Principle of Competitive Exclusion
Independent of the movement of generalist banks from the center towards the periph-ery, increased competition with foreign banks may also result from general growthof the size of the domestic banking population. This interpretation is in line withearly ecological models inspired by the work of Lotka (1932) and Volterra (1926).These initial models do not take into account the possibility that one subpopula-tion might move towards the other, but instead focus on the relative sizes of eachof these populations and the competitive pressure that each of them can exert onthe other (the position of these populations relative to each other is kept constant).Competition between two populations is particularly strong when both populationsoccupy a similar position in resource space, i.e., when they occupy the same niche.Ecologists usually invoke Gause’s (1934) ’principle of competitive exclusion’ whenmodeling such effects. The principle of competitive exclusion states that ’no twopopulations can continuously occupy the same niche’, and ’populations are said tooccupy the same niche to the extent that they depend on identical environmentalresources’ (Hannan and Freeman 1977, 942–943). In the presence of such condi-tions, one of the two populations will always be forced to drop out from the market.The principle of competitive exclusion, as shown by Gause (1934), is in essence amathematical result based on Lotka-Volterra models of competing populations.
dN1
dt= b1N1
K1 − (N1 + αN2)K1
(6.1)
anddN2
dt= b2N2
K2 − (N2 + βN1)K2
(6.2)
where the growth rate of a population is influenced by the number of organiza-tions pertaining to the population, the carrying capacity (K) for that population,and the number of organizations in the competing population. In Lotka-Volterraequations of competing populations, an equilibrium (i.e. population growth forboth populations equals zero) can only exist when
1α
<K1
K2< β (6.3)
It is easy to see that in these models a stable equilibrium for two very similarpopulations (when α and β are close to unity), can only exist under a very precise

119
6.3. THE PRINCIPLE OF COMPETITIVE EXCLUSION 105
K1/K2 ratio. Any external shock to the system will result in the competitive ex-clusion of one of the two populations10. Ruef (2004a) illustrates how competitiveexclusion can lead to the demise of an organizational population. In his study onthe disappearance of the plantation system between 1860 and 1880, Ruef (2004a)finds that among alternative populations, medium-sized farms exerted the strongestcompetitive pressures on the plantation system. Medium-sized farms had similarresource requirements, among others in terms of crop diversity. The crop diversitythat both populations relied on was almost identical, as both focused on cotton,corn and a few selected other crops. Both populations also made use of the same la-bor force, which was a relatively homogeneous one in terms of ethnical background,education, and economic status.
It is assumed here that the niche that is occupied by both domestic and foreignbanks (i.e. that part of the resource space in which both foreign and domestic banksare active) also shows sufficient overlap to allow for the possibility of competitiveexclusion. As pointed out earlier in this chapter, both sub-populations serve foreignmultinationals in China, and both are allowed to extend loans to the governmentand state-owned enterprises in China. In these domains, foreign and domestic bankshave come to compete increasingly. In the interpretation presented here, the growingand increasingly competitive population of domestic banks is causing a depressionof the profitability rates of foreign banks. In order to test the possible competitiveexclusion of foreign banks in Shanghai, I follow Hannan and Carroll (1992) andHannan and Freeman (1989) in measuring the effect of a competing population byincorporating a variable representing the number of organizations in the competingpopulation, i.e. the density of domestic banks.
Hypothesis 6.2 (Competitive Exclusion). An increased density of domestic banksis associated with a lower profitability rate of foreign banks.
A second way to represent the competitive pressure generated by a populationis the mass11 of that population (i.e. the aggregate size of the organizations in that
10Relaxing the assumption of similarity however, equilibria in the set of equations can generallybe found when the level of within-population competition is high, and the competition between thetwo different populations is relatively low. In other words, co-existence is possible when some formof niche differentiation would occur and when there is some distance between the two competingpopulations in the resource space. The question of how different these competing populations mustbe to make co-existence possible is known as the problem of ’limiting similarity ’ (MacArthur andLevins 1967; MacArthur 1972).
11Barnett and Amburgey (1990) provide an interesting extension of the Lotka-Volterra equations

120
106 6. DE-PARTITIONING AND COMPETITIVE EXCLUSION
population). Barron et al.’s (1998) study of several competing populations in thefinancial services sector provides such an approach. They find that after the in-dustry’s deregulation, populations such as credit unions, savings banks, commercialbanks, and savings and loans associations (S&Ls) showed greater intensity of com-petition. Using data on the aggregate size of each of these populations (measured interms of total assets), they show for instance that credit unions competed stronglywith S&Ls, and that the credit union population was growing substantially overtime at the expense of S&Ls. Barron et al. (1998) attribute the increased compe-tition after the deregulation of the industry to increasing overlap in the financialservices that are provided by these populations. In a similar vein, it is argued herethat deregulation of the financial sector led to increasing overlap between domesticand local banks in China. As a result, foreign banks have also increasingly beenaffected by the growing population of domestic banks. As Barron et al.’s (1998)approach shows, the competitive interaction resulting from this increased pressurecan be effectively modeled using the aggregate size of the competing population,here domestic banks. Hence, it is hypothesized that:
Hypothesis 6.3 (Competitive Exclusion). An increased mass of domestic banks isassociated with a lower profitability rate of foreign banks.
6.4 Variables
In order to test the hypotheses postulated above, the profitability rate of foreignbanks in Shanghai is analyzed using the event history method. For this purpose,self-reported data is collected on the first year of profitability of foreign banks inShanghai, covering the period from 1990 to 2002. The resulting dataset includes147 observations, representing the time-to-profitability of 41 foreign banks. Onlyone foreign bank in Shanghai reported that it had not become profitable before theend of the observation window; the other foreign banks reached profitability afteran average of 2.45 years12(see Chapter 3 for a more detailed treatment of the data
presented earlier in this chapter, by incorporating mass effects and a mass-defined carrying capacityconstraint.
12138 observations divided by 40 profitable banks results in an average of 3.45 years. However,when a bank is allowed to generate profit in year t and it becomes profitable in year t+1, then thisis represented by two observations in the dataset. Since none of the banks reached profitability inthe same year it was allowed to do so and foreign banks are in reality assumed to be able reachprofitability levels any time during the year, subtracting this average with 1 yields a more accurate

121
6.4. VARIABLES 107
and method).
The main variables used for predicting the profitability rates of foreign banksare:
Concentration of domestic banks. This variable is represented by a four-firmconcentration ratio (C4), defined as the total assets held by the Big-Four domesticbanks (the Bank of China, the Construction Bank of China, the Agricultural Bank ofChina, and the Industrial and Commercial Bank of China) divided by the total assetsheld by all banks in the industry. To construct this variable, data was adapted fromannual editions of the Almanac of China’s Finance and Banking as well as balancesheets in the annual editions of The Bankers’ Almanac.
Mass of domestic banks. Using the same sources, the total mass of domesticbanks, defined as the aggregate of individual organizations’ total assets, is calculatedand updated annually. A measure based on total assets is especially appropriatein a study of financial institutions, given their function of accepting deposits andproviding credit (Barron et al. 1998).
Density of domestic banks. A list of domestic banks was obtained comparing theannual editions of The Bankers’ Almanac, and starting dates for each of these bankswere easily found via Lexis-Nexis. Since domestic banks are not numerous, everysingle domestic bank could be identified implying full coverage of this population.Density, as well as mass and the C4 concentration ratio, were all lagged one year.Change variables were also computed, defined as the growth (or decline) in mass,density and C4 in the previous year.
The following control variables were used:
Experience China/Hong Kong. This variable can be seen as an extension of theanalysis presented in Chapter 4. In Chapter 4, I outlined how the multinationalbanking community withdrew itself from Shanghai in the 1930s and 1940s and in-stead allocated their attention to Hong Kong. However, in the 1980s many banksthat had a presence in Hong Kong started their operations in Shanghai again. Here,I examine the consequences for individual banks. Foreign banks that have spentmany years in Hong Kong during the time at which an office in mainland Chinawas not an option, may have had the chance to build up experience and positionaladvantages that turn out to be helpful in post-dormancy mainland China. Alterna-
estimate.

122
108 6. DE-PARTITIONING AND COMPETITIVE EXCLUSION
tively, foreign banks that have maintained an office in Hong Kong and were amongthe first batch of banks returning to mainland China may be perceived by local cus-tomers and regulators as more reliable and committed to the local market (ratherthan being perceived as opportunistic actors only interested in short-term gains).
Foreign direct investment. As an approximation of the carrying capacity of theenvironment in which foreign banks are active, foreign direct investment (FDI) isused. FDI is measured in 100 million US dollars and lagged one year.
Interest rates. As indicated, foreign and domestic banks appear to competestrongly on the basis of the prices of their loans (i.e. the interest rates.) Similar toLeung et al. (2003), I included the Eurodollar three-month rate to control for thepossible effects of price competition.
Branch sequence. Foreign banks that were in a position to obtain a branchlicense early may have enjoyed first-mover advantages, and may have found it easierto become profitable. For this reason, a control variable is included that equals 0for banks that obtained a branch license in 1990 and 12 for banks that obtained alicense in 2002 (cf. Leung et al. 2003).
Branches China. This variable was defined as the number of other branches abank maintained in China in a previous year.
Extent of multinationality. Multinationality was defined as the number of coun-tries in which the organization has an investment (Youssef 1975). The more interna-tional experience, the better the bank will be able to cope with diverse and complexenvironments and the less difficulties the bank is likely to have to become profitablein Shanghai.
Size. Leung et al. (2003) show that the bank’s asset size also is a relevantcontrol variable. According to Leung et al. (2003) large banks have reputationaland informational advantages and are likely to be in a better position to assessand monitor risks associated with lending. As a result, larger banks will experiencehigher profitability rates. The size of the foreign bank is measured in trillion USdollars, and lagged one year.
Length of organizing period. Since previous research (Carroll et al. 1996; Klepper2002; Klepper and Simons 2000; Ruef 2006) shows that pre-entry experiences haveenduring effects on organizational performance, the length of time spend prior tobecoming a branch office (i.e. as a representative office) is included as well. Carrollet al. (1996), for instance, in their study of pre-production activities in the U.S.automobile industry between 1885 and 1981, found that firms that have spend a
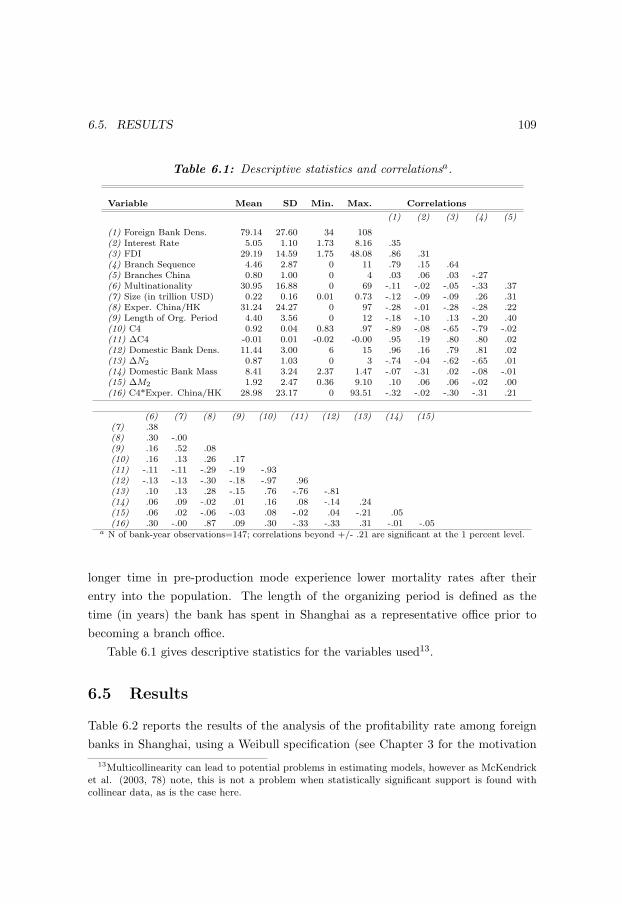
123
6.5. RESULTS 109
Table 6.1: Descriptive statistics and correlationsa.
Variable Mean SD Min. Max. Correlations
(1) (2) (3) (4) (5)
(1) Foreign Bank Dens. 79.14 27.60 34 108(2) Interest Rate 5.05 1.10 1.73 8.16 .35(3) FDI 29.19 14.59 1.75 48.08 .86 .31(4) Branch Sequence 4.46 2.87 0 11 .79 .15 .64(5) Branches China 0.80 1.00 0 4 .03 .06 .03 -.27(6) Multinationality 30.95 16.88 0 69 -.11 -.02 -.05 -.33 .37(7) Size (in trillion USD) 0.22 0.16 0.01 0.73 -.12 -.09 -.09 .26 .31(8) Exper. China/HK 31.24 24.27 0 97 -.28 -.01 -.28 -.28 .22(9) Length of Org. Period 4.40 3.56 0 12 -.18 -.10 .13 -.20 .40(10) C4 0.92 0.04 0.83 .97 -.89 -.08 -.65 -.79 -.02(11) ∆C4 -0.01 0.01 -0.02 -0.00 .95 .19 .80 .80 .02(12) Domestic Bank Dens. 11.44 3.00 6 15 .96 .16 .79 .81 .02(13) ∆N2 0.87 1.03 0 3 -.74 -.04 -.62 -.65 .01(14) Domestic Bank Mass 8.41 3.24 2.37 1.47 -.07 -.31 .02 -.08 -.01(15) ∆M2 1.92 2.47 0.36 9.10 .10 .06 .06 -.02 .00(16) C4*Exper. China/HK 28.98 23.17 0 93.51 -.32 -.02 -.30 -.31 .21
(6) (7) (8) (9) (10) (11) (12) (13) (14) (15)(7) .38(8) .30 -.00(9) .16 .52 .08(10) .16 .13 .26 .17(11) -.11 -.11 -.29 -.19 -.93(12) -.13 -.13 -.30 -.18 -.97 .96(13) .10 .13 .28 -.15 .76 -.76 -.81(14) .06 .09 -.02 .01 .16 .08 -.14 .24(15) .06 .02 -.06 -.03 .08 -.02 .04 -.21 .05(16) .30 -.00 .87 .09 .30 -.33 -.33 .31 -.01 -.05
a N of bank-year observations=147; correlations beyond +/- .21 are significant at the 1 percent level.
longer time in pre-production mode experience lower mortality rates after theirentry into the population. The length of the organizing period is defined as thetime (in years) the bank has spent in Shanghai as a representative office prior tobecoming a branch office.
Table 6.1 gives descriptive statistics for the variables used13.
6.5 Results
Table 6.2 reports the results of the analysis of the profitability rate among foreignbanks in Shanghai, using a Weibull specification (see Chapter 3 for the motivation
13Multicollinearity can lead to potential problems in estimating models, however as McKendricket al. (2003, 78) note, this is not a problem when statistically significant support is found withcollinear data, as is the case here.

124
110 6. DE-PARTITIONING AND COMPETITIVE EXCLUSION
underlying this choice). Model 1 shows a baseline model with control variablesonly. These control variables are used in all subsequent models and show somevery consistent effect for some variables. Branch sequence, for instance, appearedto generate statistically significant effects in every model tested, indicating thatlate entrants enjoy advantages in terms of their profitability rates. Expanding onthe results of Chapter 4, it also becomes evident that China or Hong Kong specificexperience (measured by the number of years that the bank has spent in the GreaterChina region) results in higher profitability rates. Foreign banks that diverted toHong Kong -while Shanghai experienced a period of dormancy- may somehow haveretained local market knowledge or, alternatively, are more valued by local audiencesin Shanghai. Surprisingly, foreign banks with longer organizing periods, i.e. with alonger time spent as a representative office, do not show higher profitability rates,a finding which is inconsistent with previous findings on pre-entry experience andpost-entry performance (Carroll et al. 1996; Klepper 2002; Klepper and Simons2000). Clearly, the length of time spent as a representative office did not affect thetime to profitability, suggesting that, from a managerial point of view, it would bebetter to keep these organizing periods as short as possible since there is little to begained in terms of profitability rates.
In model 2, the four-firm concentration ratio, C4, is added to the baseline model(which improves the model significantly; Haberman’s χ2= 41.08; ∆d.f.=1; p<.01).C4 shows the expected positive relationship with the performance of foreign banks.Accordingly, the decrease in the C4 concentration ratio as observed in this empiricalsetting appeared to significantly depress the profitability rates of foreign banks,providing support to Hypothesis 6.1. A decrease in the market concentration signalsa shift in the position of domestic banks from the center towards the periphery, andthis clearly had a substantial negative impact on the peripheral foreign banks. If themarket share of the Big Four domestic banks decreased by one standard deviationfrom the mean, the profitability rate of foreign banks would fall by 94.5 percent14.
In model 3, the density of domestic banks is added to the baseline model andclearly shows its expected negative relationship with bank performance. This nega-tive association is indicative of processes of competitive exclusion and is interpreted
14Large effects of market conditions on organizational vital rates such as those found here arenot uncommon. Haveman et al. (2004), for instance, find a drop of 92 percent in the foundingrate of thrifts after a similar increase in public opinion concerning bureaucracy. The procedure ofcalculating these effect sizes is identical to the one used by Haveman et al. (2004).

125
6.5. RESULTS 111
Table 6.2: Weibull models predicting the profitability rate among foreign banks inShanghai, 1990-2002a.
Variable Model 1 Model 2 Model 3 Model 4 Model 5
EnvironmentForeign Bank Dens. (N1) -0.116∗∗ -0.026 -0.067† -0.032 0.050
(0.032) (0.035) (0.036) (0.035) (0.042)
Interest Rate 0.575∗∗ 0.558∗ 0.568∗∗ 0.066 -0.376(0.195) (0.273) (0.192) (0.233) (0.284)
FDI (K1) 0.037 -0.033 0.019 0.034 -0.016(0.027) (0.030) (0.024) (0.028) (0.030)
OrganizationalCharacteristicsBranch Sequence 1.018∗∗ 3.167∗∗ 1.425∗∗ 2.164∗∗ 3.730∗∗
(0.230) (0.500) (0.275) (0.378) (0.574)
Branches China -0.486† -0.349 -0.408 -0.508† -0.402(0.263) (0.291) (0.253) (0.285) (0.277)
Multinationality -0.025† -0.041∗ -0.023 -0.020 -0.033∗
(0.015) (0.016) (0.014) (0.015) (0.016)
Size 1.750 1.546 1.934 1.103 1.810(1.387) (1.466) (1.356) (1.401) (1.416)
Exper. China/HK 0.025∗∗ 0.025∗∗ 0.021∗ 0.022∗ 0.022∗
(0.009) (0.009) (0.009) (0.009) (0.009)
Length of Org. Period 0.006 0.006 -0.000 0.012 0.038(0.074) (0.076) (0.070) (0.077) (0.072)
Domestic BanksC4 199.902∗∗ 100.516∗
(35.842) (48.376)
Density (N2) -0.854∗∗ -1.001∗∗
(0.285) (0.324)
Mass (M2) -1.687∗∗ -1.573∗
(0.371) (0.658)
ρ 5.560∗∗ 12.684∗∗ 6.935∗∗ 9.456∗∗ 14.723∗∗
(0.796) (1.720) (0.984) (1.292) (1.968)
Constant -6.432∗∗ -206.386∗∗ -3.112∗ -5.170∗∗ -102.146∗
(1.361) (36.074) (1.477) (1.436) (49.023)
Obs. (bank-years) 147 147 147 147 147Log-likelihood -6.78 13.76 -1.98 4.97 18.05LR χ2
(d.f.)51.76(9) 92.83(10) 61.36(10) 75.25(10) 101.41(12)
Haberman’s χ2 41.08∗∗ 9.60∗∗ 23.50∗∗ 8.58∗
(vs. 1) (vs. 1) (vs. 1) (vs. 2)Significance levels : † : 10% ∗ : 5% ∗∗ : 1%a Standard errors are in parentheses.
as support for Hypothesis 6.2. In terms of the size of the effect, an increase of onestandard deviation from the mean number of domestic banks in Shanghai results in

126
112 6. DE-PARTITIONING AND COMPETITIVE EXCLUSION
Table 6.3: Weibull models predicting the profitability rate among foreign banks inShanghai, 1990-2002a.
Variable Model 6 Model 7 Model 8 Model 9 Model 10
EnvironmentForeign Bank Dens. (N1) -0.047 -0.077† -0.037 -0.176∗∗ -0.046
(0.036) (0.039) (0.035) (0.041) 0.036
Interest Rate -0.502† 1.442∗∗ 0.103 0.963∗∗ -0.538†
(0.272) (0.293) (0.241) (0.269) (0.278)
FDI (K1) 0.032 0.015 0.038 0.044 -0.028(0.029) (0.027) (0.030) (0.035) (0.031)
Org. CharacteristicsBranch Sequence 3.594∗∗ 3.332∗∗ 2.300∗∗ 1.668∗∗ 3.258∗∗
(0.578) (0.496) (0.391) (0.323) (0.512)
Branches China -0.368 -0.425 -0.478† -0.477† -0.423(0.292) (0.275) (0.287) (0.281) (0.292)
Multinationality -0.032∗ -0.030∗ -0.022 -0.022 -0.033∗
(0.015) (0.014) (0.015) (0.015) (0.016)
Size 1.259 1.784 1.146 1.312 0.641(1.445) (1.457) (1.422) (1.406) (1.488)
Exper. China/HK 0.021∗ 0.021∗ 0.021∗ 0.021∗ 0.497∗
(0.009) (0.009) (0.009) (0.009) (0.239)
Length of Org. Period -0.002 -0.022 0.011 0.004 0.042(0.078) (0.077) (0.079) (0.080) (0.075)
Domestic BanksC4 209.713∗∗ 209.222∗∗
(37.655) (36.344)
∆C4 100.192∗ 93.619(44.597) (58.167)
Density (N2) -2.695∗∗
(0.478)
∆N2 1.964∗∗ 0.478†
(0.352) (0.261)
Mass (M2) -1.774∗∗
(0.388)
∆M2 0.153† 0.239∗
(0.085) (0.097)
C4*Exper. China/HK -0.507∗
(0.257)
ρ 14.097∗∗ 13.543∗∗ 9.839∗∗ -7.782∗∗ 13.274∗∗
(1.947) (1.774) (1.330) (1.144) (1.791)
Constant -216.103∗∗ -2.184 -5.579∗∗ -8.590∗∗ -214.895∗∗
(37.922) (1.571) (1.524) (1.927) (36.553)
Obs. (bank-years) 147 147 147 147 147Log-likelihood 16.22 17.01 6.34 -0.05 15.67LR χ2
(d.f.)97.76(11) 99.33(11) 77.99(11) 65.12(12) 96.66(11)
Haberman’s χ2 4.92∗ 37.98∗∗ 2.74† 13.66∗∗ 3.82†
(vs. 2) (vs. 3) (vs. 4) (vs. 1) (vs. 2)Significance levels : † : 10% ∗ : 5% ∗∗ : 1%a Standard errors are in parentheses.

127
6.5. RESULTS 113
a drop in the profitability rate of 93 percent. This is somewhat less than the effectof C4, but, again, substantial. Interestingly, the effect of domestic bank density isalso substantially larger than that of within-population competition among foreignbanks. By comparing the competition coefficients, it becomes evident that one addi-tional domestic bank has a much stronger bearing on the profitability rate comparedto the addition of one additional foreign bank. When the density of domestic banksis replaced with the mass of the domestic banks (model 4), the competitive natureof the effect of domestic banks on foreign banks persists. Here, an increase of onestandard deviation from the mean aggregate size of domestic banks results in a 96.2percent lower profitability rate. Finally, model 5 shows a joint test of C4, density,and mass. This model improves significantly over other models (Haberman’s χ2=8.58; ∆d.f.=2; p<.05). The effect of each of the variables of interest as observed inearlier models, persist in model 5, suggesting that both the principle of competitiveexclusion as well as a reversed resource partitioning process can account for theperformance of foreign banks in Shanghai.
In Table 6.3 the effects of C4, density and mass are explored in more detail. Inparticular, it is investigated whether it is the absolute value of each of these variablesthat matters, or changes in each of these variables. Model 6 starts by investigatingwhether this is the case for the concentration measure. Here, it appears that both theabsolute value of C4 as well as a change in C4 have a statistically significant impacton the profitability rate. In a reversed resource partitioning context this impliesthat the profitability rate of specialist organizations in a given year is negativelyaffected by both the sheer existence of a lower market concentration as well as furtherdecreases (changes) in that given year. In models 7 and 8, change variables are alsoadded for density and mass, respectively. Surprisingly, both changes in density andmass have a positive effect, suggesting that any increase in the number or aggregatesize of domestic banks would actually have a positive effect on the profitabilityrate of foreign banks, at least in the short term. The main effects of density andmass remain negative, implying that, overall, the domestic banking population stillcompetes strongly with the foreign banking population. One explanation for theinitial positive effect of increases in the density and mass of domestic banks mightbe that such increases temporarily disrupt the industry social structure which leadsto some short-term benefits for foreign banks or, alternatively, the founding of newdomestic banks may lead to a temporary legitimacy spillover. In model 9, all changevariables are jointly tested. The statistical significance of all change variables drops

128
114 6. DE-PARTITIONING AND COMPETITIVE EXCLUSION
substantially, and in the case of change in C4 it is no longer significant at the tenpercent level. In terms of fit, model 9 also performs substantially worse than thebest-fitting model, model 7.
In model 10, an extension of Chapter 4 is tested concerning the boundariesof legitimation: it is tested whether some foreign banks were able to reduce thenegative effects stemming from the shift of domestic banks towards the periphery,and were perhaps perceived to be more legitimate than others in the market. Thereason for this may be that the market displayed strong path dependence: foreignbank that had a long history in perhaps pre-socialist mainland China or Hong Kongmay have been able to develop strong positional advantages, advantages that otherforeign banks find difficult to overcome (despite the fact that these banks might havebetter organizational designs and capabilities (Carroll and Hannan 2000, 11–12)).The interaction effect between local market experience and the C4 measure confirmsthis interpretation, as the negative effect of C4 decreases with more local marketexperience.
6.6 Discussion
Starting with the observation that foreign banks are increasingly feeling the com-petitive pressure generated by domestic banks, this chapter examined two ecologicalmechanisms that could account for this increased pressure. The first, a reversal of theresource partitioning process as described by Dobrev (2000), argues that domesticbanks (being the generalists in this market) are increasingly shifting their positiontowards the periphery where they engage in more direct competition with the morespecialist foreign banks. The other ecological mechanism, based on the principleof competitive exclusion (Gause 1934), argues that (independent of changes in po-sition) the two populations are in fact competing because of their similar resourceenvironment. Domestic banks in such an environment are able to exert pressure onforeign banks because of their increase in numbers and aggregate size. Both type ofexplanations have been tested and gained support in the empirical analysis.
The fact that both reversed resource partitioning and competitive exclusion ap-ply to this particular case, warrants a closer examination of the possible relationbetween the two. In this particular context it is clear that generalist concentration,and generalist density and mass are not totally unrelated as all seem to be prod-ucts of the process of deregulation. Normally, the first response to deregulation in

129
6.6. DISCUSSION 115
a post-socialist setting is an increase in the number of (generalist) market players(Dobrev 2000; Peli 1999): new organizations that arise from the break up of formerstate monopolies or those that make use of the incentives offered by the introductionof market mechanisms. Such an increase in the number of organizations will drawaway resources from the key state-owned organizations that previously were the soleparticipants in the market. As a result, market concentration tends to go down.Generally the mass of the increasing number of generalists will also tend to increase,as these generalists try to differentiate themselves by securing their own niches. Bydoing so they increase the generalists’ total resource base15. As shown in this chap-ter, the exact mechanism that causes the pressure on specialists such as foreign bankscan be difficult to identify. In this case, both concentration (C4) and density as wellmass can be used to represent the effect of deregulation on specialist performance.Only with more fine-grained data, such as e.g. marketing data which would allowfor the actual mapping of the positions of these banks in resource space, we wouldbe able to identify the processes that deteriorate the performance of foreign banks.With such data, actual shifts in position and changes in resource distributions canbe observed, the examination of which would be a promising area for future research.The obvious question to ask is how concentration, density and mass of generalistsrelate to each other with respect to the more standard resource partitioning theory(as put forward by Carroll 1985). Generalist density and concentration for instanceappear to be strongly correlated in the reasoning of resource partitioning: underscale-based competition, the mortality rate of generalists increases and the densityof generalists drops. The surviving generalists then move closer to the market cen-ter leading to a concentrated market. Since both decreasing generalist density andincreasing concentration seem to be part of the same process, both can possibly beused to account for specialist proliferation. But this is problematic: what may turnup in some studies as resource partitioning might as well be the product of weakeningcompetitive exclusion or competitive ’inclusion’. Do specialists proliferate becausegeneralists move away from the periphery or do they proliferate because they faceless direct competition (due to a lower number of generalists)? Alternatively, asGeroski (2001, 525–527) suggests, competitive exclusion may in fact cause resourcepartitioning: the risk of being competitively excluded may lead (new) organizations
15Such an increase can then generate pressure on the periphery even in transition economies withan inflow and rapid growth of resources (such as China), so resource scarcity may not be a scopecondition in a reversed resource partitioning as Dobrev (2000) would argue.

130
116 6. DE-PARTITIONING AND COMPETITIVE EXCLUSION
to differentiate themselves from the generalists by developing a specialist strategy.And because the risk of becoming competitively excluded makes it less attractiveto become a generalist, the market may fall in the hands of a few oligopolists, in-creasing concentration in the market. It is important for theory development in thefield of resource partitioning to distinguish between resource partitioning on the onehand and competitive exclusion on the other hand (or otherwise to integrate them).It is important to note in a discussion of this issue that it became evident duringthis study that the reversed resource partitioning theory as described here and byDobrev (2000) is not the perfect mirror image of Carroll’s (1985) resource parti-tioning theory. For instance, in a reversed resource partitioning, scope conditions ofprice competition and economies of scale might not be applicable. There is ampleevidence of price competition in the Chinese banking system, but still the resultsof the analysis presented here provide strong evidence in favor of a reversal of theresource partitioning process. Also there is no reason why economies of scale shouldbe a scope condition in a reversal of the resource partitioning process16. Instead,deregulation seems to drive much of this phenomenon and can be seen as a scopecondition that applies specifically to departitioning (Dobrev 2000).
Does the analysis presented here imply that, sooner or later, foreign banks willbe forced to drop out of the market? Recently, Beamish and Delios (2005) havesuggested that the proportion of China’s economy dominated by foreign firms willdecline in the coming years, pointing to a lack of profitability as one of the mainreasons. Based on an evaluation of the performance of a large number of Japanesefirms in China, Beamish and Delios (2005) report that the percentage of Japanesesubsidiaries that report profitable performance has been decreasing over the pastdecade, and has become lower relative to other countries in the world. This leadsthem to expect that many of the foreign firms in China will eventually exit as foreigninvestors. On the other hand, there are at least two good reasons to suggest thatthis is not likely to happen. First, the offices of international banks in Shanghaiare backed by financial resources which in some cases even exceed those of domesticbanks. Backed by such assets, foreign banks in Shanghai may continue to exist evenin the absence of reasonable returns (Leung et al. 2003). The weaker sub-population
16In the absence of these scope conditions, the set of organizational populations in which areversed resource partitioning process might take place, is less restrictive; we can e.g. expect sucha process to take place in populations not characterized by economies of scale as well. Of course,one might wonder whether such process really deserves the label of resource partitioning.

131
6.6. DISCUSSION 117
here thus has the means to defend itself in some way (cf. Geroski 2001). Second, onemight also point to expected changes in the resource environment for banks in China.This resource environment is likely to become more heterogeneous in the future.Chinese consumers will for instance demand a greater variety of financial services(He and Fan 2004). This increased heterogeneity is likely to provide opportunitiesfor niche differentiation and could enhance the performance of the specialist foreignbanks (cf. Peli and Nooteboom 1999; Boone et al. 2002), since it diminishes boththe pressures arising from competitive exclusion as well as those arising from de-concentration among the generalist, domestic banks.
One limitation of this research is that it did not investigate recent developmentsin resource partitioning theory that sketch a more complicated picture than the onesuggested here. For instance, Boone et al. (2002) incorporate data on the resourcedistributions affecting the partitioning process, and show that homogeneity in theresource distribution drives generalist consolidation, while, paradoxically, hetero-geneity seems to enhance specialist proliferation. In another study, Boone and vanWitteloostuijn (2004) propose that scope economies, in addition to scale economies,affect the partitioning process. Unfortunately, data limitations did not allow forempirically testing these recent advances in the present study.
Future research may investigate whether the effect of the competitive exclusiongenerated by domestic banks can also be extended to the founding rates of for-eign banks. There is some reason to suggest that this might not be the case. Li(2002), for instance, investigates the possible presence of competitive exclusion inthe Californian banking industry between 1979 and 1988. In examining the reversedrelationship, namely that of the effect of foreign banks on the entry of domesticbanks, Li (2002) finds that at higher levels, the density of foreign banks actuallystimulates the entry rate of domestic banks. The increase of foreign bank densitymay in such cases signal a favorable opportunity structure which then attracts anincreasing number of local banks. If this finding applies to the Shanghai bankingindustry as well, then an increase of domestic banks in Shanghai may attract anincreasing number of foreign banks, especially when the number of domestic banksexceeds a particular threshold level. Such an effect could persist even in the presenceof the deleterious consequences of competitive exclusion, if it would mirror recentresearch in industrial geography (Sorenson and Audia 2000; Stuart and Sorenson2003).
Future research may also seek to incorporate reversed resource partitioning (and

132
118 6. DE-PARTITIONING AND COMPETITIVE EXCLUSION
possibly the principle of competitive exclusion) into existing logical formalizationsof resource partitioning. Recent studies (Vermeulen and Bruggeman 2001; Hannanet al. 2005) have sought to re-analyze the main arguments of resource partitioningtheory by means of formal logic, but it would be interesting to see how a reversal ofthe partitioning process, as well as the principle of competitive exclusion, would fitinto the developed logical structures.
133
7
Conclusion
In this final chapter, a summary of each of the three empirical chapters is presented,as well as some of their main findings. In addition, a brief appraisal is providedon using the ecological approach in the Chinese context, and on the generalizabilityof the findings of this study. The chapter closes with some possible directions forfuture research.
7.1 Summary of Main Findings
The substantive purpose of this dissertation was to address several important theo-retical issues in the field of organizational ecology (Hannan and Freeman 1977, 1989;Carroll and Hannan 2000), namely: 1) the re-emergence of organizational popula-tions, 2) ecological interactions during the early stages of firm activity, and 3) themodeling of inter-population competition. These were investigated using data onthe ventures of foreign banks in Shanghai.
First of all, an effort was thus made to further our understanding of how or-ganizational populations are able to re-emerge after a period of dormancy, as inthe case of foreign banks in Shanghai. An improved understanding is of theoreticalrelevance because many of the processes that underlie re-emergence are believed tobe relevant to the general evolution of organizational forms as well and instances ofre-emergence provide us with a unique opportunity to study these processes underunusual circumstances. These may include the degree of legitimacy of the organi-zational form and the construction of the social identity of the organizational form.But, as this dissertation showed, both of these can sometimes not be fully cap-
119

134
120 7. CONCLUSION
tured when the social system, in which the phase of dormancy and the subsequentre-emergence take place, is considered in isolation of other systems. It turned outthat a broader perspective that took into account organizational dynamics outsidethe social system in question offered a more complete picture of various aspects ofre-emergence. Analytically, this was shown by modeling the founding rate of foreignbanks in Shanghai, which increased substantially after a period of dormancy for thispopulation ended in the early 1980s. When only the foreign banking population inShanghai was considered, and both the pre-dormancy and the post-dormancy peri-ods were included in the analysis, one arrived at the conclusion that the re-emergenceof foreign banks did not involve a renewed increase in legitimation (as in the case ofDobrev (2001)) and that therefore this process could not fully account for patternsin the increased founding rate of foreign banks. However, such an account couldbe provided after studying the dynamics in an alternative financial center locatedrelatively closely to Shanghai, namely Hong Kong. The size of the foreign bankingpopulation in Hong Kong, which expanded substantially during the period in whichinternational banks were inactive in Shanghai, had a significant impact on the re-emergence of foreign banking in Shanghai, suggesting that broader movements ofthe form need to be taken into account when analyzing cases of re-emergence. It wasnoted however that, theoretically, the explanation offered by Dobrev (2001) relatedto ’re-legitimation’ and the explanation offered here are not necessarily at odds, asearlier pointed out as well by Carroll and Teo (1998). The research presented in thisdissertation has set the stage for studying both explanations simultaneously, andcan be an effort worthwhile given the centrality of these processes in the study oforganizational forms and their identity.
A second theoretical issue that was addressed in this dissertation is on the or-ganizational level and concerns the early stages of firm activity, i.e. the stages thatprecede the entry of an organization into a population, and how these are shapedby ecological interactions. The relevance of addressing this issue lies in the factthat the way these initial stages are passed has lasting consequences for growth andsurvival chances at later stages (e.g. Carroll et al. 1996), but also has consequencesfor the general evolution of the industry (Ruef 2006). In order to shed light on thesepre-entry dynamics, the transition from representative office to foreign branch wasmodeled in the empirical analysis. Representative offices were considered to be pre-operational ventures in this particular context, due to the nature of their activitiesand the fact that representative offices are precluded from providing revenue gener-

135
7.1. SUMMARY OF MAIN FINDINGS 121
ating services. Foreign banks are required to commence their activities in China asrepresentative offices, but after some time (after having obtained a branch license)they can start providing financial services. The moment at which this takes placewas defined as the actual market entry, as the bank at this point becomes subjectto a whole new set of market forces, such as price competition. The transition fromrepresentative office to branch office was modeled with the attributes of the rep-resentative office and its ’parent’ bank, the length of time the representative officehas spend in its pre-entry stage, as well as additional environmental factors. In thespirit of organizational ecology’s fundamental premise that the environment of anorganization is composed mainly of other organizations, specific attention was paidto the possible effects of the presence of representative offices that were in the sameprocess as well as the already established branch offices. A main finding was that thetransition of a representative office to entry into the population of bank branchesdepended strongly on the representative offices of competitors that were locatedwithin close distance (within the same city district), but not on those representativeoffices that were located in other parts of the city. The identity strength of an or-ganizer thus appeared to abate rapidly as the geographical distance increases. Thiscontrasted with the social identity of an already established organization (branchoffice) which clearly was present on a broader geographical scale.
A third theoretical issue that has received attention in this dissertation concernsmechanisms underlying inter-population competition. One perspective on inter-population competition holds that one population competes with another popula-tion depending on the level of concentration in the market. In highly concentratedmarkets where one (generalist) population occupies the center of the market andanother (more specialist) population operates in the periphery of the market, com-petition can be limited. In such situations, the market is effectively partitionedbetween two populations (Carroll 1985). However, competition between these pop-ulations can increase when the market becomes less concentrated (for instance dueto deregulation). The generalist population in the market center will then movetowards the periphery of the market where it will engage in competition with thespecialist population. In this dissertation, this process was referred to as a reversalof the resource partitioning process or ’de-partitioning’ (Dobrev 2000). Another per-spective on inter-population competition does not make any assumptions about thestrategic orientation of each of these populations or changes in the resource distrib-ution (as suggested by the level of concentration). This perspective simply studies

136
122 7. CONCLUSION
the competitive pressure each of these populations can exert, typically measured bysuch approximations as the number of organizations in the competing population(the density) or the aggregate size of these organizations (the population’s mass).When both populations operate in the same environment the population which canexert the highest competitive pressure will, in the most extreme case, force the otherpopulation to drop out of the market. This is referred to as the ’principle of compet-itive exclusion’ (Gause 1934). In less extreme situations (e.g. when environmentsare sufficiently heterogeneous), populations may find ways to co-exist, but individ-ual organizations may still suffer from the presence of a competing population interms of their performance. Studying competition between populations from bothof these perspectives is important because it allows us to assess which variables, andunder which conditions, can most effectively account for the degree of competition.Even in situations in which increased concentration of the market characterizes theevolution of an industry (as described in many studies of resource partitioning) itcould be investigated to what extent simple principles of competitive exclusion (orput differently: competitive inclusion) could account for the proliferation of special-ists as well. In this study, both explanations applied equally well, possibly becauseboth were in turn products of an underlying deregulation. As deregulation policieswere implemented in China after the early 1980s, the number of local banks hasincreased and market concentration has decreased. These developments have led toan increased pressure on foreign banks, which to date have only been able to capturea marginal share of the Chinese market.
7.2 Appraisal and Generalizability
This dissertation has demonstrated how organizational ecology can be used to shedlight on aspects of China’s rapidly changing economy. Ecological models build oninsights from a variety of disciplines -such as sociology, economics, and biology-,generally have a longitudinal focus, and are able to cope with spatial heterogeneity,aspects that are desirable attributes in an analysis of China’s complex transitionaleconomy. Ecological models have been applied here to illuminate the re-emergenceof organizational populations, pre-entry ecological dynamics, and inter-populationcompetition. But the ecological approach is able to generate more analytical yieldthan can be illustrated here. In particular, ecology can provide much needed insightsinto such topical issues as the structural or relative inertia of Chinese enterprises

137
7.2. APPRAISAL AND GENERALIZABILITY 123
(Nee 2005), their position in a changing resource space (Krug and Polos 2004),China’s organizational diversity (cf. Grabher and Stark 1997), and the legitimacyof new organizational forms in China (Li et al. 2005). The disadvantage thatother researchers might encounter in the Chinese context in terms of the potentiallack of consistent and high quality data spanning over several decades (a commonobservation window in ecological studies) is mitigated by the fact that the post-socialist reform era itself provides an empirical context that is free from left censoringproblems in the sense that many industries are either re-emerging or are startingfrom scratch. In this smaller observation window, spatial heterogeneity and thegrowing diversity of organizational forms should provide the researcher with ampleopportunities to adopt an ecological approach.
The logic and findings presented here, however, may extend well beyond the do-main of China and apply to other settings as well. For instance, the phenomenon ofre-emerging organizational populations, as described in Chapter 4, can be observedin many other transitioning economies as well, or even in western societies where reg-ulations may have temporarily suppressed an organizational population (as was thecase in the Prohibition in the U.S. during the Interbellum and lifting the regulationthen caused the re-emergence of the populations in question). Theoretically thesecases of re-emergence should be governed by the same general principles as thoseoutlined here: forms, by virtue of the codes that characterize it or the member thatpertain to it, generally survive in other social systems in the meantime, serving as aplatform from which organizational populations may re-emerge in a focal social sys-tem. In this respect, it would for instance be interesting to re-analyze the Bulgariannewspaper industry as studied by Dobrev (2001) from the perspective that specificcodes may have survived in neighboring societies and possibly have facilitated there-emergence of the independent newspaper population in Bulgaria (cf. Bigelow etal. 1997; Delacroix 2004; Han 1998; Hannan et al. 1995; Lomi 2000). Furthermore,in Chapter 5, an ecological model was applied to predict a social actor’s likelihoodfrom moving from pre-entry activity to becoming a fully established member of apopulation. Again, it is expected that the general outcomes of this model are notcontext specific. For example, findings related to the effect of the number of fullyestablished organizations on the likelihood of moving to the operational fase arein line with earlier findings by Carroll and Hannan (2000) and Schoonhoven et al.(1990). Similarly, findings related to mimetic entry based on relative size are inline with those reported by Haveman (1993a). These parallel findings provide confi-

138
124 7. CONCLUSION
dence that similar findings can be found in other industries and countries. Clearly,the reversed resource partitioning model that was tested in Chapter 6 should beapplicable to organizational dynamics in other countries as well, in particular thosewith transitional economies as was shown by Dobrev (2000). It is expected thatmodels that are constructed along these lines can provide much needed insights intothe industrial demography of these rapidly changing societies. It is less certain ifthe findings of this reversed resource partitioning model will be mirrored in ’classic’resource partitioning settings (cf. Carroll 1985). The generalizability here hingeson the degree to which the two processes are a perfect mirror image of each other,something that was questioned in Chapter 6. The extent to which the resource par-titioning process can be reversed in optima forma remains an issue to be examinedin future research.
7.3 Future Research Directions
The most obvious research strategy would be, aside from the datasets used hereon Hong Kong and Shanghai, to start collecting data on foreign banks in alterna-tive financial centers in the East Asian region. Such a data collection effort wouldcover earlier investigated cities such as Singapore (Carroll and Teo 1998) and Tokyo(Greve 2000, 2002; Han 1998), but also some cities in which the foreign banking pop-ulation remained much smaller (and possibly did not gain legitimation to the extentthat banking populations in Hong Kong and Shanghai did). There are at leasttwo theoretical issues that could be addressed with a dataset that is constructedalong these lines. The first is that it could test various aspects of ’multi-marketcompetition’ (e.g. Greve 2000; Stephan and Boeker 2001; van Witteloostuijn andvan Wegberg 1992). Theoretical work in this area has yielded a great number oftestable propositions that have only been scantly tested in the ecological arena. Forinstance, it would be interesting to see to what extent behavior such as reciprocalentry occurred, i.e. entry of a focal organization into another organization’s mar-ket after a similar event took place vice versa. Also, investigating what the effectsare of organizations meeting each other in multiple markets (so-called ’multimarketcontacts’) in terms of organizational learning or collusion would be a valuable areaof research. A second issue that could be addressed using a dataset that includesseveral banking populations, is how identities of these organizational populationsdiffer between settings. Identities get conferred to organizations and organizational

139
7.3. FUTURE RESEARCH DIRECTIONS 125
forms by relevant audiences (Hannan et al. 2005; Hsu and Hannan 2005), but theseaudiences may differ substantially in alternative settings. The features that makeup an identity in one society, may differ substantially from those that make up anidentity in other societies. While the organizational form might in principle displaythe same structural features across a variety of societies, its social identity maycome to highlight very different aspects dependent on the perspective of the localaudience. This is shown by Carroll and Swaminathan (2000) in their study of cul-tural identities in the U.S. brewing industry. They found that microbreweries, incontrast to mass breweries, hold an identity associated with authenticity and tra-ditional craftsmanship. Reflecting on their results, they note that (p. 754) theseidentities might be completely different in a society such as Hong Kong where tradi-tional production is instead associated with ’quality imperfections, higher costs, andinaccessibility’. Here, the larger, high-technology brewing companies were preferred.In a similar vein, I expect the foreign banking form to have a different identity insocieties other than China1. Throughout China’s modern history, foreign firms’ po-sition has always been ambiguous (Nee and Peck 1975), ranging from unwelcomeagents of western imperialism to an essential element in the opening up of the na-tional economy. In Hong Kong, the social identity of foreign banks is likely to beboth less surrounded by such ambiguity and also somewhat less sharp (cf. Baron2004) as foreign banks are seen more as an integrated element of Hong Kong’s socialsystem. Studying and mapping how such identities vary across societies is likely toenhance our understanding of the evolution of organizational forms.
1It might also be that an identity for foreign banks is non-existent in other societies. In manyWestern European countries it can for instance be doubted whether foreign banks have been ableto generate a distinct social identity, possibly because in many countries they have not been ableto pass a threshold in terms of density (cf. Hannan and Carroll 1992; Hannan et al. 2005).

140

141
Appendix
This appendix contains a list of all foreign banks that ever maintained a presencein Shanghai from the founding of the first foreign bank in 1847 to the end of thisstudy’s observation window, 2004. The first column of this list indicates the namewith which the bank started its venture in Shanghai. Subsequent name changes arenot mentioned, but are available on request from the author. Simple name changesdo not constitute an ending event.
The second column provides the starting month (SM), and the third columnthe starting year (SY). Three codes are used for the starting events (SE) in thefourth column. The event is coded ”1” if a foreign bank independently sets up anew office in Shanghai. Starting events with code ”2” are those ventures that comeinto existence after their parent bank merged into a new bank or was subject toan acquisition and the office in Shanghai changed its name2. Starting event ”3” isassigned to joint ventures between a foreign investor and a local partner.
The next two columns give the ending month (EM) and ending year (EY). Thereare three codes for ending events (EE). The ending event is coded ”5” if the bankfailed or disbanded, is coded ”6” if the bank again satisfies two conditions: its parentbank merged into a new bank or became subject to an acquisition, and the officein Shanghai experienced a name change, and ”9” if the bank was still in existence
2This second condition is added since a change in the ownership structure of the parent bankis not deemed sufficient to assume a starting event of a ’new’ affiliate in Shanghai. A foreignaffiliate can in principle continue functioning without being (immediately) affected by the ownershipchange. I interpret a subsequent name change of the Shanghai office as more indicative of a morefundamental change at the affiliate level and as such is recorded as a starting event. For example,when the National City Bank of New York (NCB) acquired a majority interest in the InternationalBanking Corporation (IBC) on October 29, 1915 (the latter having operations in Shanghai) thisis not translated into an ending event at IBC’s Shanghai branch and a starting event for NCBuntil January 1, 1927 when also the name of the branch changed into that of the NCB. For asimilar procedure see McKendrick (2001, 313 note 8), see also Carroll and Hannan (2000, 52) for adiscussion on differences in demographic activity between parent banks and bank branches.
127

142
128 APPENDIX
by December 31, 2004. Full names for ’starred’ banks appear at the end of theappendix.
Bank Name SM SY SE EM EY EEABN AMRO Bank 9 1991 1 12 2004 9ABSA Bank 2 1995 1 12 2004 9Agra and Masterman’s Bank 1864 2 7 1866 5Agra and United Services Bank 5 1858 1 1864 6Agra Bank 5 1870 1 7 1893 5American Express Company 1918 1 12 1941 5American Express Company 1946 1 12 1949 5American Express Bank 1992 1 12 2004 9American Oriental Banking Corp. 1918 1 5 1935 5Arab Bank 1996 1 12 2004 9Asahi Bank 4 1992 1 3 2002 5Asia Banking Corporation 2 1919 1 2 1924 6Asia Commercial Bank 1996 1 12 2004 9Asiatic Banking Corporation 8 1864 1 1866 5Australia and New Zealand Banking Group 12 1993 1 12 2004 9Banca Commerciale Italiana 1987 1 5 2001 6Banca di Roma 5 1995 1 12 2004 9Banca Intesa 1 1998 2 5 2001 6Banca Italiana per la Cina 1924 2 1945 5Banca Nationale del Lavoro 5 1986 1 12 2004 9Banca Sino-Italiana 9 1920 3 1924 6Banco Espırito Santo e Comercial de Lisboa 4 1998 1 12 2004 9Banco Santander 1995 1 4 1999 6Banco Santander Central Hispano 4 1999 2 2000 5Bangkok Bank 6 1993 1 12 2004 9PT Bank Bali 8 1997 1 2001 5BankBoston 1997 2 2000 5Bank Brussels Lambert 1999 1 6 2002 6Banking Corporation of China 10 1891 3 1911 5Bank of America N.T. and S.A. 1 1949 1 5 1951 5Bank of America N.T. and S.A. 10 1984 1 12 2004 9Bank of China, Japan and the Straits 7 1891 3 1902 5Bank of Chosen 4 1918 1 1945 6Bank of Credit and Commerce International 1989 1 7 1991 5Bank of East Asia 4 1920 1 12 2004 9

143
129
The Bank of Fukuoka 3 1995 1 12 2004 9Bank of Hindustan, China and Japan 2 1864 1 1 1866 5Bank of India 12 1864 1 5 1866 5Bank of Montreal 1 2002 1 12 2004 9The Bank of Nagoya 4 1995 1 12 2004 9The Bank of New York 6 1994 1 12 2004 9Bank of Taiwan 4 1911 1 9 1945 6Bank of Tokyo 12 1982 1 4 1996 6The Bank of Tokyo-Mitsubishi 4 1996 2 12 2004 9The Bank of Yokohama 12 1994 1 12 2004 9Banque Belge pour l’Etranger Extreme Orient 1945 1 1956 5Banque de l’Indochine 1899 1 1955 5Banque Francaise de Commerce Exterieur 9 1994 1 6 1997 6Banque Franco-Chinoise* 1925 3 1950 5Banque Indosuez 1984 1 7 1996 6Banque Industrielle de Chine 1913 3 6 1921 5Banque Nationale de Paris 12 1982 1 5 2000 6Banque Paribas 1987 1 5 2000 6Barclays Bank 9 1991 1 12 2004 9Bayerische Hypotheken- und Wechsel-Bank 1994 1 9 1998 6Bayerische Hypo und Vereinsbank 9 1998 2 12 2004 9Bayerische Landesbank Girozentrale 1 1995 1 12 2004 9Bayerische Vereinsbank 1994 1 9 1998 6The Bear Stearns Companies 4 1993 1 12 2004 9Joh. Berenberg, Gossler and Co. 6 2001 1 12 2004 9BNP Paribas 5 2000 2 12 2004 9Calyon 4 2004 2 12 2004 9Cassa di Risparmio Lomb.* 1996 1 1 1998 6Cathay Bank 4 2002 1 12 2004 9Cathay Trust Company 1902 1 1920 6Central Bank of West India 9 1861 1 1866 5Central Reserve Bank of China 1 1941 1 1945 6Ceska Sporitelna 4 1998 1 2000 5Chartered Bank of India, Australia, and China 8 1858 1 12 1941 5Chartered Bank of India, Australia, and China 1945 1 1 1970 6Chase Bank 5 1930 2 12 1941 5Chase Bank 12 1945 1 8 1950 5Chase Manhattan Bank 3 1993 1 11 2001 6Chemical Bank 6 1992 2 7 1996 6The Chiba Bank 11 1995 1 12 2004 9

144
130 APPENDIX
Chinese-American Bank of Commerce 9 1920 3 8 1927 5The Chugoku Bank 5 1996 1 12 2004 9Citibank 12 1985 1 12 2004 9Commercial Bank of India 1 1855 1 9 1866 5The Commercial Bank of Korea 4 1993 1 1 1999 6Commerzbank 1993 1 12 2004 9Commonwealth Bank of Australia 1995 1 12 2004 9Comptoir National d’Escompte de Paris 1860 1 1889 5CoreStates Bank 1995 1 5 1998 6Credit Agricole Indosuez 7 1996 2 4 2004 6Credit Foncier pour l’Extreme Orient 1912 1 1941 5Credit Industriel et Commercial 10 1998 1 12 2004 9Credit Lyonnais 1986 1 4 2004 6Credit Suisse 1992 1 12 2004 9The Dai-Ichi Kangyo Bank 1985 1 4 2002 6The Daiwa Bank 9 1985 1 12 2004 9Dao Heng Bank 1994 1 12 2004 9Deutsch-Asiatische Bank 1 1890 1 8 1917 5Deutsch-Asiatische Bank 1918 1 9 1945 6Deutsche Bank 1872 1 1875 5Deutsche Bank 8 1995 1 12 2004 9Deutsche Genossenschaftsbank 1995 1 12 2004 9The Development Bank of Singapore 12 1994 1 12 2004 9Dresdner Bank 1989 1 12 2004 9Equitable Eastern Banking Corp. 1 1921 1 5 1930 6Exchange Bank of China 9 1918 3 12 1928 5The Export-Import Bank of Korea 1997 1 1998 5Far Eastern Bank of Harbin 1925 1 9 1929 5Finance Banking Corporation 1932 1 1940 5First Commercial Bank 2003 1 12 2004 9First Interstate Bank 10 1991 1 4 1993 6First National Bank of Boston 4 1994 1 1997 6First Sino Bank 6 1997 3 12 2004 9First Union National Bank 5 1998 2 4 2002 6ForeningsSparbanken 5 2001 1 12 2004 9Fortis Bank 11 1999 2 12 2004 9The Fuji Bank 1983 1 8 2001 6The Fukui Bank 6 1997 1 2 1999 5The Fukuoka City Bank 11 1995 1 2 1999 5Generale Bank 1987 1 11 1999 6

145
131
Gota Bank 10 1985 1 1994 5Great Eastern Bank 1922 1 1927 5Hachijuni Bank 5 2002 1 12 2004 9Hamburgische Landesbank Girozentrale 1999 1 12 2004 9Hana Bank 7 1996 1 12 2004 9Hang Seng Bank 8 1991 1 12 2004 9Hankow Bank 1932 1 1945 5Hanil Bank 7 1993 1 1 1999 6Hanvit Bank 1 1999 2 12 2004 9The Hiroshima Bank 2 1996 1 12 2004 9The Hokuriku Bank 9 1994 1 12 2004 9HSBC 4 1865 1 12 1941 5HSBC 12 1945 1 12 2004 9Hua Hsing Bank 5 1939 1 2 1941 5Industrial Bank of Japan 1983 1 4 2002 6ING Bank 1992 1 12 2004 9International Bank Ningbo 12 1998 1 12 2004 9International Bank of Paris and Shanghai 11 1992 3 12 2004 9International Banking Corp. 5 1902 1 1 1927 6IntesaBci 5 2001 2 12 2004 9Istituto Bancario San Paolo di Torino 1996 1 6 1999 6Iyo Bank 10 1994 1 12 2004 9Joyo Bank 5 1996 1 12 2004 9Juroku Bank 3 1993 1 12 2004 9KBC Bank 6 1998 2 12 2004 9Kookmin Bank 6 1995 1 2000 5The Korea Development Bank 4 1996 1 12 2004 9Korea Exchange Bank 10 2003 1 12 2004 9Kredietbank 5 1993 1 6 1998 6Krung Thai Bank 1 1997 1 1 1999 5Landesbank Baden-Wurttemberg 1 1999 2 12 2004 9Liu Chong Hing Bank 1988 1 12 2004 9Long-Term Credit Bank of Japan 1986 1 1999 5Manufacturers Hanover Trust Co. 1988 1 6 1992 6Maybank 12 2000 1 12 2004 9MeesPierson 10 1994 1 2003 6Mercantile Bank of India, London and China 11 1854 1 12 1941 5Mercantile Bank of India, London and China 1945 1 1952 5Metropolitan Bank and Trust 1994 1 12 2004 9Mitsubishi Bank 11 1917 1 1945 6

146
132 APPENDIX
Mitsubishi Bank 6 1984 1 4 1996 6The Mitsubishi Trust and Banking Corporation 7 1987 1 12 2004 9Mitsui Bank 10 1917 1 4 1943 6Mitsui Bank 1983 1 4 1990 6Mitsui Taiyo Kobe Bank 4 1990 2 4 2001 6Mizuho Bank 4 2002 2 12 2004 9Monte dei Paschi di Siena 1994 1 12 2004 9JP Morgan and Co. 3 1994 1 10 2001 6JP Morgan Chase Bank 10 2001 2 12 2004 9Moscow Narodny Bank 1934 1 5 1950 5Natexis Banque 6 1997 2 6 2000 6Natexis Banques Populaires 6 2000 2 12 2004 9National Bank of Egypt 5 1999 1 12 2004 9National City Bank of New York 1 1927 1 12 1941 5National City Bank of New York 12 1945 1 8 1950 5National Westminster Bank 10 1994 1 3 2000 6Nederlandsche Handel-Maatschappij 2 1903 1 12 1941 5Nederlandsche Handel-Maatschappij 1945 1 1950 5Nederlands Indische Handelsbank 9 1920 1 12 1941 5Nederlands Indische Handelsbank 1945 1 11 1949 5New Oriental Banking Corp. 1885 1 6 1892 5The Nippon Credit Bank 7 1995 1 1997 5The Nishi Nippon Bank 11 1993 1 12 2004 9Norddeutsche Landesbank 4 2004 1 12 2004 9NORDEA Bank 11 2001 1 8 2003 5Ogaki Kyoritsu Bank 12 2002 1 12 2004 9Oriental Banking Corporation 1847 1 1884 5Overseas Chinese Banking Corp. 1927 1 12 2004 9Overseas Union Bank 12 1999 1 1 2002 6Pacific Banking Corporation 1934 1 1935 5P. and O. Banking Corporation 3 1922 1 2 1939 6Park Union Foreign Bank. Corp. 1919 1 1922 6Philippine National Bank 1919 1 1921 5Po Sang Bank 3 1994 1 10 2001 6Rabobank Nederland 1994 1 12 2004 9N. M. Rothschild and Sons 3 1994 1 12 2004 9Royal Bank of Canada 10 1988 1 5 1999 5The Royal Bank of Scotland 3 2000 2 12 2004 9Russo-Asiatic Bank 1 1910 2 9 1926 5Russo-Chinese Bank 2 1896 3 1 1910 6

147
133
Sanpaolo IMI 6 1999 2 12 2004 9The Sanwa Bank 4 1983 1 1 2002 6Sassoon, E.D. Banking Company 1931 1 12 1941 5Sassoon, E.D. Banking Company 1945 1 7 1949 5Schroder, J. Henry, Wagg and Co 12 1994 1 12 2004 9Seiryu Bank 1906 1 1937 5Shanghai Bank 10 1918 1 8 1945 5Shinhan Bank 10 2003 1 12 2004 9The Shizuoka Bank 11 1995 1 12 2004 9Sino-Belgian Bank 12 1902 1 12 1941 5Sino-Scandinavian Bank 9 1921 3 1926 5Societa Coloniale Italiano 1903 1 1912 5Societe d’Epargne Franco-Chinoise 1918 1 1926 5Societe Francaise de Gerance* 7 1922 1 1925 5Societe Generale 8 1983 1 12 2004 9Standard Bank London 1999 1 12 2004 9Standard Chartered 1 1970 2 12 2004 9State Bank of India 8 1997 1 12 2004 9Sudwestdeutsche Landesbank Girozentrale 1998 1 1 1999 6Sumitomo Bank 11 1916 1 1945 6Sumitomo Bank 1985 1 4 2001 6Sumitomo Mitsui Banking Corp. 4 2001 2 12 2004 9The Sumitomo Trust and Banking Corporation 8 1994 1 12 2004 9Svenska Handelsbanken 12 2002 1 12 2004 9Swiss Banking Corporation (SBC) 10 1993 1 6 1998 6Thai Farmers Bank 9 1995 1 12 2004 9Thrift and Investment Finance and Trust Corporation 1927 1 1930 5The Tokai Bank 1985 1 1 2002 6TM International Bank 6 1996 1 12 2004 9Toyo Trust and Banking 9 1983 1 1 2002 6Turkiye Garanti Bankasi 1999 1 12 2004 9UBS 6 1998 2 12 2004 9UFJ Bank 1 2002 2 12 2004 9Underwriters Savings Bank for the Far East 1930 1 12 1941 5Underwriters Savings Bank for the Far East 1945 1 4 1951 5UniCredito Italiano 8 1998 1 12 2004 9Union Bank of California 7 1999 1 12 2004 9Union Mobiliere* 2 1926 1 1941 5United Overseas Bank 8 1998 1 12 2004 9Vereins- und Westbank 5 1996 1 9 1998 6

148
134 APPENDIX
Vseobecna Uverova Banka 7 1998 1 11 2001 6Wachovia Bank 4 2002 2 12 2004 9Westdeutsche Landesbank Girozentrale 11 1994 1 12 2004 9Wing Hang Bank 2000 1 12 2004 9Wing Lung Bank 9 1999 1 12 2004 9The Yasuda Trust and Banking Corporation 6 1987 1 1999 5Yokohama Specie Bank 5 1893 1 1945 5
Full names of foreign banks that are marked with an asterisk(*): Banque Franco-Chinoise pour le Commerce et l’Industrie; Cassa di Risparmio delle Provincie Lom-barde (CARIPLO); Societe Francaise de Gerance de la Banque Industrielle de Chine;Union Mobiliere Societe Francaise de Banque et de Placement.

149
References
Akaike, Hirotugu. 1974. “A New Look at the Statistical Model Identification.” IEEETransaction and Automatic Control 19:716–23.
Aldrich, Howard. E. 1999. Organizations Evolving. London: Sage Publications.
Allison, Paul D. 1984. Event History Analysis: Regression for Longitudinal EventData. Sage University Paper Series on Quantitative Applications in the SocialSciences, series no. 07-046. Beverly Hills, Calif.: Sage.
Banaszak-Holl, Jane C. 1991. “Incorporating Organizational Growth into Models ofOrganizational Dynamics: Manhattan Banks, 1791-1980.” Ph.D. dissertation,Cornell University.
Barnett, William P., and Terry L. Amburgey. 1990. “Do Larger Organizations Gen-erate Stronger Competition?” Pp. 79-102 in Organizational Evolution: NewDirections, edited by J. Singh. Newbury Park, Calif.: Sage.
Barnett, William P., Henrich R. Greve, and Douglas Y. Park. 1994. “An Evolu-tionary Model of Organizational Performance.” Strategic Management Journal15:11-28.
Barnett, William P., and Morton T. Hansen. 1996. “The Red Queen in Organiza-tional Evolution.” Strategic Management Journal 17:139–58.
Barron, David N. 1992. “The Analysis of Count Data: Overdispersion and Autocor-relation.” Pp. 179–220 in Sociological Methodology 1992, edited by P. Marsden.Oxford: Basil Blackwell.
Barron, David N., Elizabeth West, and Michael T. Hannan. 1994. “A Time to Growand a Time to Die: Growth and Mortality of Credit Unions in New York City,1914-1990.” American Journal of Sociology 100:381–421.
135

150
136 REFERENCES
1998. “Deregulation and Competition in the Financial Industry.” Industrialand Corporate Change 7:1–32.
Baster, Albert S. J. 1929. The Imperial Banks. London: P. S. King and Son.
Baum, Joel A. C., and Stephen J. Mezias. 1992. “Localized Competition and Organi-zational Failure in the Manhattan Hotel Industry, 1898-1990.” AdministrativeScience Quarterly 37:580–604.
Beamish, Paul W., and Andrew Delios. 2005. “Selling China: Looking Back andLooking Forward.” Management and Organization Review 1:309–13.
Becker, Howard S. 1982. Art Worlds. Berkeley, Calif.: University of California Press.
Bergere, Marie-Claire. 1996. “The Geography of Finance in a Semi-Colonial Metropo-lis: The Shanghai Bund (1842-1943).” Pp. 303–17 in Cities of Finance editedby H. Diederiks and D. Reeder. Amsterdam: North-Holland.
Bigelow, Lyda S., Glenn R. Carroll, Marc-David L. Seidel, and Lucia B. Tsai. 1997.“Legitimation, Geographical Scale, and Organizational Density: Regional Pat-terns of Foundings of American Automobile Producers, 1885–1981.” Social Sci-ence Research 26:377–98.
Boone, Christophe, Glenn R. Carroll, and Arjen van Witteloostuijn. 2002. “Re-source Distributions and Market Partitioning: Dutch Daily Newspapers, 1968to 1994.” American Sociological Review 67:408–31.
Boone, Christophe, and Arjen van Witteloostuijn. 2004. “A Unified Theory of Mar-ket Partitioning: An Integration of Resource-Partitioning and Sunk Cost The-ories.” Industrial and Corporate Change 13:701–25.
Carroll, Glenn R. 1985. “Concentration and Specialization: Dynamics of Niche Widthin Populations of Organizations.” American Journal of Sociology 90:1262–83.
Carroll, Glenn R., Lyda S. Bigelow, Marc-David L. Seidel, and Lucia B. Tsai. 1996.“The Fates of De Novo and De Alio Producers in the American AutomobileIndustry, 1885-1982.” Strategic Management Journal 17:117–37.
Carroll, Glenn R., and Jacques Delacroix. 1982. “Organizational Mortality in theNewspaper Industries of Argentina and Ireland: An Ecological Approach.” Ad-ministrative Science Quarterly 27:169–98.

151
137
Carroll, Glenn R., Stanislav D. Dobrev, and A. Swaminathan. 2002. “OrganizationalProcesses of Resource Partitioning.” Research in Organizational Behavior 24:1–40.
Carroll, Glenn R., and Michael T. Hannan. 1989. “Density Delay in the Evolutionof Organizational Populations: A Model and Five Empirical Tests.” Adminis-trative Science Quarterly 34:411–30.
2000. The Demography of Corporations and Industries. Princeton: PrincetonUniversity Press.
Carroll, Glenn R., Michael T. Hannan, and Arjen van Witteloostuijn. 2001. “Markt-werking is Selectiewerk: van Populatie-Ecologie naar Organisatiedemografie.”Bedrijfskunde 4:31–7.
Carroll, Glenn R., and Yangchung Paul Huo. 1988. “Organizational and ElectoralParadoxes of the Knights of Labor.” Pp. 175–94 in Ecological Models of Orga-nizations, edited by G. Carroll. Cambridge, Mass.: Ballinger.
Carroll, Glenn R., and Olga M. Khessina. 2005. “The Ecology of Entrepreneurship”Pp. 145–77 in Handbook of Entrepreneurship: Disciplinary Perspectives, editedby R. Agarwal, S. Alvarez, and O. Sorenson. New York: Kluwer.
Carroll, Glenn R., and Anand Swaminathan. 1991. “Density Dependent Organiza-tional Evolution in the American Brewing Industry from 1633 to 1988.” ActaSociologica 34:155–75.
2000. “Why the Microbrewery Movement? Organizational Dynamics of Re-source Partitioning in the U.S. Brewing Industry.” American Journal of Soci-ology 106:715–62.
Carroll, Glenn R., and Albert C.Y. Teo. 1998. “How Regulation and Globalization af-fected Organizational Legitimation and Competition among Commercial Banksin Singapore, 1840-1994.” Presented at the Annual Meeting of the Academy ofManagement.
Carroll, Glenn R., and James B. Wade. 1991. “Density Dependence in the Organiza-tional Evolution of the American Brewing Industry across Levels of Analysis.”Social Science Research 20:271–302.

152
138 REFERENCES
Chang, Kia-Ngau. 1958. The Inflationary Spiral: The Experience in China, 1939–1950. Cambridge, Mass.: The Technology Press of Massachusetts Institute ofTechnology.
Chang, Sea-Jin. 1995. “International Expansion Strategy of Japanese Firms: Capa-bility Building through Sequential Entry.” Academy of Management Journal38:383-407.
Cheng, Linsun. 2003. Banking in Modern China: Entrepreneurs, Professional Man-agers, and the Development of Chinese Banks, 1897-1937. Cambridge: Cam-bridge University Press.
Collis, Maurice. 1965. Wayfoong: The Hong Kong and Shanghai Banking Corpora-tion. London: Faber and Faber.
Cooper, Donald R., and Pamela S. Schindler. 1998. Business Research Methods.Boston: McGraw-Hill.
Delacroix, Jacques. 2004. “Another Monkey on our Backs: Falsehoods and Truthabout Globalization.” Strategic Organization 2:313–22.
Delacroix, Jacques, and Glenn R. Carroll. 1983. “Organizational Foundings: AnEcological Study of the Newspaper Industries of Argentina and Ireland.” Ad-ministrative Science Quarterly 28:274–91.
Delacroix, Jacques, and Michael E. Solt. 1988. “Niche Formation and Foundings inthe California Wine Industry.” Pp. 53–70 in Ecological Models of Organizations,edited by G. R. Carroll. Cambridge, Mass.: Ballinger.
Delacroix, Jacques, Anand Swaminathan, Michael E. Solt. 1989. “Density Depen-dence versus Population Dynamics: An Ecological Study of Failings in theCalifornia Wine Industry.” American Sociological Review 54:245–62.
Dobrev, Stanislav D. 1997. “The Dynamics of the Bulgarian Newspaper Industry ina Period of Transition.” Ph.D. dissertation, Stanford University.
2000. “Decreasing Concentration and Reversibility of the Resource Partition-ing Process: Supply Shortages and Deregulation in the Bulgarian NewspaperIndustry.” Organization Studies 21:383–404.
2001. “Revisiting Organizational Legitimation: Cognitive Diffusion and So-ciopolitical Factors in the Evolution of Bulgarian Newspaper Enterprises, 1846–1992.” Organization Studies 22:419–44.

153
139
Dobrev, Stanislav D., Tai-Young Kim, and Glenn R. Carroll. 2002a. “Niche and Scalein Organizational Evolution: A Unified Empirical Model of Automobile Manu-facturers in the U.S., 1885–1981.” Administrative Science Quarterly 47:233–64.
2002b. “The Ecology of Strategic Positioning: Mutualism, Competition, andInertia.” Presented at the Organizational Ecology Conference, Stanford Uni-versity, December 13-14.
Dobrev, Stanislav D., Tai-Young Kim, and Michael T. Hannan. 2001. “Dynamicsof Niche Width and Resource Partitioning.” American Journal of Sociology106:1299–337.
Feuerwerker, Albert. 1975. Rebellion in Nineteenth-Century China. Ann Arbor: Cen-ter for Chinese Studies, University of Michigan.
Flannery, Huei-Chen. 1997. “Shanghai Booms as Center of Advertising Influence.”Advertising Age 68, Oct. 27 (sup.): 24.
Freeman, John H., Pino G. Audia, and Nydia MacGregor. 2005. “Entrepreneurshipin Local Context: Banks and Retail Firms in the United States.” Presented atthe Annual Meeting of the Academy of Management.
Freeman, John H., and Michael T. Hannan. 1983. “Niche Width and the Dynamicsof Organizational Populations.” American Journal of Sociology 88:1116–45.
Freeman, John H., and Alessandro Lomi. 1994. “Resource Partitioning among Bank-ing Cooperatives in Italy.” Pp. 269–93 in Evolutionary Dynamics of Organiza-tions, edited by J. Baum and J. Singh. New York: Oxford University Press.
Fu, Peter C. 1998. “The Choice of Market-Servicing Mode for European Banks inChina.” Pp. 207–27 in Trade and Investment in China, edited by R. Strange,J. Slater, and L. Wang. London: Routledge.
Gamble, Jos. 2003. Shanghai in Transition: Changing Perspectives and Social Con-tours of a Chinese Metropolis. London: Routledge.
Gause, Georgii F. 1934. The Struggle for Existence. Baltimore: Williams and Wilkins.
Geroski, Paul A. 2001. “Exploring the Niche Overlaps between Organizational Ecol-ogy and Industrial Economics.” Industrial and Corporate Change 10:507–40.
Ghoshal, Sumantra, and Christopher A. Bartlett. 1990. “The Multinational Corpo-ration as an Interorganizational Network.” Academy of Management Review15:603–25.

154
140 REFERENCES
Gold, Thomas B. 1991. “Can Pudong Deliver?” The China Business Review 18(6):22–29.
Gort, Michael, and Steven Klepper. 1982. “Time Paths in the Diffusion of ProductInnovations.” Economic Journal 92:630–53.
Grabher, Gernot, and David Stark. 1997. “Organizing Diversity: Evolutionary The-ory, Network Analysis, and Post-Socialism.” Pp. 1-32 in Restructuring Net-works in Post-Socialism, edited by G. Grabher and D. Stark. New York: OxfordUniversity Press.
Graham, Mark. 2000. “Industry Burgeons, Skyline Soars: Shanghai is Set to RiseEven Higher as a Global Center”, Industry Week 249(7), Apr. 3: 36–37.
Greve, Henrich R. 1995. “Jumping Ship: The Diffusion of Strategy Abandonment.”Administrative Science Quarterly 40:444–73.
2000. “Market Niche Entry Decisions: Competition, Learning, and Strategy inTokyo Banking, 1894-1936.” Academy of Management Journal 43: 816–36.
2002. “An Ecological Theory of Spatial Evolution: Local Density Dependencein Tokyo Banking, 1894-1936.” Social Forces 80:847–79.
Grosse, Robert, and Lawrence G. Goldberg. 1991. “Foreign Bank Activity in theUnited States: An Analysis by Country of Origin.” Journal of Banking andFinance 15:1093–112.
Guillen, Mauro F. 2002. “Structural Inertia, Imitation, and Foreign Expansion:South Korean Firms and Business Groups in China, 1987-95.” Academy ofManagement Journal 45:509–25.
Haberman, Shelby J. 1977. “Log-Linear Models and Frequency Tables with SmallExpected Cell Counts.” Annals of Statistics 5:1148–69.
Han, Joon. 1998. “The Evolution of the Japanese Banking Industry: An EcologicalAnalysis.” Ph.D. dissertation, Stanford University.
Hannan, Michael T. 1997. “Inertia, Density, and the Structure of OrganizationalPopulations: Entries in European Automobile Industries, 1886–1981.” Organi-zation Studies 18:193–228.
Hannan, Michael T., and Glenn R. Carroll. 1992. The Dynamics of OrganizationalPopulations: Density, Legitimation, and Competition. New York: Oxford Uni-versity Press.

155
141
Hannan, Michael T., Glenn R. Carroll, Elizabeth A. Dundon, and John C. Torres.1995. “Organizational Evolution in Multinational Context: Entries of Automo-bile Manufacturers in Belgium, Britain, France, Germany, and Italy.” AmericanSociological Review 60:509–28.
Hannan, Michael T., Glenn R. Carroll, and Laszlo Polos. 2003. “The OrganizationalNiche.” Sociological Theory 21:309–40.
Hannan, Michael T., and John H. Freeman. 1977. “The Population Ecology of Or-ganizations.” American Journal of Sociology 82:929–64.
1984. “Structural Inertia and Organizational Change.” American SociologicalReview 49:149–64.
1989. Organizational Ecology. Cambridge: Harvard University Press.
Hannan, Michael T., Laszlo Polos, and Glenn R. Carroll. 2005. Social Codes andEcologies: A Treatise on Organizations. Unpublished manuscript.
Hannan, Michael T., James Ranger-Moore, and Jane C. Banaszak-Holl. 1990. “Com-petition and the Evolution of Organizational Size Distributions.” Pp. 78-102in Organizational Evolution: New Directions, edited by J. Singh. Beverly Hills,Calif.: Sage.
Haveman, Heather A. 1993a. “Follow the Leader: Mimetic Isomorphism and Entryinto New Markets.” Administrative Science Quarterly 38:564–92.
1993b. “Organizational Size and Change: Diversification in the Savings andLoan Industry after Deregulation.” Administrative Science Quarterly 38:20–50.
Haveman, Heather A., and L. Nonnemaker. 2000. “Competition in Multiple Geo-graphic Markets: The Impact on Growth and Entry.” Administrative ScienceQuarterly 45:232–67.
Haveman, Heather A., Hayagreeva Rao, and Srikanth Paruchuri. 2004. “The Windsof Change: Political Culture and the Diversity of Organizational Forms in theEarly California Thrift Industry.” Unpublished paper. Columbia University.
He, Liping, and Xiaohang Fan. 2004. “Foreign Banks in Post-WTO China: An In-termediate Assessment.” China and World Economy 12(5):3–16.

156
142 REFERENCES
Helfat, Constance E., and Marvin B. Lieberman. 2002. “The Birth of Capabilities:Market Entry and the Importance of Pre-Entry.” Industrial and CorporateChange 11:725–60.
Hong Kong Banking. 1985. Hong Kong: Database Asia Ltd.
Hong, Xiaguan, Xinxin Wang, and Anding Li. 2003. The History of Shanghai Fi-nance. Shanghai: Shanghai Academy of Social Sciences Press.
Hsiao, Liang-Lin. 1974. China’s Foreign Trade Statistics, 1864-1949. Cambridge,Mass.: Harvard University Press.
Hsu, Greta, and Michael T. Hannan. 2005. “Identities, Genres, and OrganizationalForms.” Organization Science, forthcoming.
Jao, Yu-Ching. 1973. Banking and Currency in Hong Kong. London: The MacMillanPress.
1997. Hong Kong as an International Financial Centre: Evolution, Prospects,and Policies. Hong Kong: City University of Hong Kong Press.
1998. Money and Finance in Hong Kong: Retrospect and Prospect. EAI Oc-cassional Paper, Singapore University Press.
2004. “Shanghai and Hong Kong as International Financial Centres: HistoricalPerspective and Contemporary Analysis.” HIEBS working paper, University ofHong Kong.
Ji, Zhaojin. 2003. A History of Modern Shanghai Banking: The Rise and Decline ofChina’s Finance Capitalism. Armonk, NY: M. E. Sharpe.
Jones, Geoffrey. 1992. “International Financial Centres in Asia, the Middle East, andAustralia: A Historical Perspective.” Pp. 405–28 in Finance and Financiersin European History, 1880-1960, edited by Y. Cassis. Cambridge: CambridgeUniversity Press.
1993. British Multinational Banking, 1830-1990. Oxford: Clarendon Press.
Jones, P. H. M. 1965a. “Asian banks abroad.” Far Eastern Economic Review, April22, 165–8.
1965b. “Foreign banks in Asia.” Far Eastern Economic Review, April 22, 171–3.

157
143
Johanson, Jan, and Jan-Erik Vahlne. 1977. “The Internationalization Process ofthe Firm: A Model of Knowledge Development and Increasing Foreign MarketCommitment.” Journal of International Business Studies 8:23–32.
Jovanovic, Boyan. 2004. “The Pre-producers.” Paper presented at the OrganizationalEcology Workshop, University of Washington at St. Louis, April 23-24.
Keister, Lisa A. 2002. “Financial Markets, Money, and Banking.” Annual Review ofSociology 28:39–61.
Kim, Tai-Young, and Andrew Delios. 2003. “Duality of Experiential Learning andOrganizational Geography: Japanese Multinational Corporations in the Peo-ple’s Republic of China.” Presented at the Annual Meeting of the Academy ofManagement.
Kim, Tai-Young, Stanislav D. Dobrev, and Luca Solari. 2003. “Festina Lente: Learn-ing and Inertia among Italian Automobile Producers, 1896–1981.” Industrialand Corporate Change 12:1279–1301.
Klepper, Steven. 2002. “The Capabilities of New Firms and the Evolution of the USAutomobile Industry.” Industrial and Corporate Change 11:645–666.
Klepper, Steven, and Elizabeth Graddy. 1990. “The Evolution of New Industries andthe Determinants of Market Structure.” RAND Journal of Economics 21:27–44.
Klepper, Steven, and Kenneth L. Simons. 2000. “Dominance by Birthright: Entry ofPrior Radio Producers and Competitive Ramifications in the U.S. TelevisionReceiver Industry.” Strategic Management Journal 21:997-1016.
Krug, Barbara. 2004. “Introduction: New Opportunities, New Sector, New Firms.”Pp. 1–20 in China’s Rational Entrepreneurs: The Development of the NewPrivate Business Sector, edited by B. Krug. London: RoutledgeCurzon.
Krug, Barbara, and Laszlo Polos. 2004. “Emerging Markets, Entrepreneurship, andUncertainty: The Emergence of a Private Sector in China.” Pp. 72–96 inChina’s Rational Entrepreneurs: The Development of the New Private Busi-ness Sector, edited by B. Krug. London: RoutledgeCurzon.
Kuhn, Philip A. 1978. “The Taiping Rebellion.” Pp. 264–316 in The Cambridge His-tory of China, edited by D. Twitchett, and J. Fairbank. Volume 10. Cambridge:Cambridge University Press.

158
144 REFERENCES
Lardy, Nicholas N. 1998. China’s Unfinished Economic Revolution. Washington:Brookings Institution Press.
Lee, Kyunmook, and Johannes M. Pennings. 2002. “Mimicry and the Market: Adop-tion of a New Organizational Form.” Academy of Management Journal 45:144–62.
Lees, Francis A., and K. Thomas Liaw. 1996. Foreign Participation in China’s Bank-ing and Securities Markets. Westport, Conn.: Quorum Books.
Leung, Man-Kwong, Trevor Young, and Dan Rigby. 2003. “Explaining the Prof-itability of Foreign Banks in Shanghai.” Managerial and Decision Economics24:15–24.
Levins, Richard. 1968. Evolution in Changing Environments. Princeton: PrincetonUniversity Press.
Li, Jiatao. 2002. “Asymmetric Interactions between Foreign and Domestic Banks: Ef-fects on Organizational Entry.” Presented at the Organizational Ecology Con-ference, Stanford University, December 13-14.
Li, Jiatao, Ying Yu Yang, and Deborah R. Yue. 2005. “Gaining Legitimacy in HostMarkets: The Case of Wholly Owned Foreign Subsidiaries in China.” HongKong University of Science and Technology.
Lomi, Alessandro. 1995. “The Population Ecology of Organizational Founding: Lo-cation Dependence and Unobserved Heterogeneity.” Administrative ScienceQuarterly 40:111–45.
2000. “Density Dependence and Spatial Duality in Organizational FoundingRates: Danish Commercial Banks, 1846-1989.” Organization Studies 21:433–61.
Lotka, Alfred J. 1932. “The Growth of Mixed Populations.” Washington Academyof Sciences Journal 22:461–9.
MacArthur, Robert H. 1972. Geographical Ecology: Patterns in the Distribution ofSpecies. Princeton: Princeton University Press.
MacArthur, Robert H., and Richard Levins. 1967. “The Limiting Similarity, Conver-gence, and Divergence of Coexisting Species.” American Naturalist 101:377–85.
MacCormac, Susan H. 1993. “Foreign Banking in China: Opportunities for U.S.Investors in the 1990s.” Journal of Chinese Law 7:225–75.

159
145
Manion, Melanie. 1994. “Survey Research in the Study of Contemporary China:Learning from Local Samples.” China Quarterly 139:741–65.
Martin, Xavier, Will Mitchell, and Anand Swaminathan. 1995. “Recreating and Ex-tending Japanese Automobile Buyer-Supplier Links in North America.” Strate-gic Management Journal 16:589–619.
Martin, Xavier, Anand Swaminathan, and Will Mitchell. 1998. “Organizational Evo-lution in the Interorganizational Environment: Incentives and Constraints onInternational Expansion Strategy.” Administrative Science Quarterly 43:556–601.
Marx, Karl. 1964 [1844]. “The Power of Money in Bourgeois Society.” In The Eco-nomic and Philosophic Manuscripts of 1844. New York: Int. Publ.
McElderry, Andrea L. 1976. Shanghai Old-style Banks (Ch’ien Chuang), 1800-1935.Ann Arbor: Center for Chinese Studies, University of Michigan.
McKendrick, David G. 2001. “Global Strategy and Population-Level Learning: TheCase of Hard Disk Drives.” Strategic Management Journal 22:307–34.
McKendrick, David G., and Glenn R. Carroll. 2001. “On the Genesis of Organiza-tional Forms: Evidence from the Market for Disk Drive Arrays.” OrganizationScience 12:661–83.
McKendrick, David G., Jonathan W. Jaffee, Glenn R. Carroll, and Olga M. Khessina.2003. “In the Bud? Disk Array Producers as a (Possibly) Emergent Organiza-tional Form.” Administrative Science Quarterly 48:60–93.
McPherson, J. Miller. 1983. “An Ecology of Affiliation.” American Sociological Re-view 48:519–35.
Meyer, David R. 2004. “Hong Kong and Shanghai as China’s Window to GlobalCapital.” Presented at the City Futures Conference, Chicago, July 8-10.
Meyer, John W. 1992. “Centralization of Funding and Control in Educational Gov-ernance.” Pp. 179–98 in Organizational Environments: Ritual and Rationality,edited by J. Meyer and R. Scott. Beverly Hills, Calif.: Sage.
Meyer, John W., and W. Richard Scott. 1992a. “Centralization and the LegitimacyProblems of Local Government.” Pp. 199–216 in Organizational Environments:
160
146 REFERENCES
Ritual and Rationality, edited by J. Meyer and R. Scott. Updated edition.Beverly Hills, Calif.: Sage.
1992b. Organizational Environments: Ritual and Rationality. Updated edition.Newbury Park, Calif.: Sage.
Mezias, John M., and Stephen J. Mezias. 2000. “Resource Partitioning, the Foundingof Specialist Firms, and Innovation: The American Feature Film Industry, 1912-1929.” Organization Science 11:306–22.
Nee, Victor. 2005. “Organizational Dynamics of Institutional Change: China’s Mar-ket Economy.” In The Economic Sociology of Capitalism, edited by V. Nee andR. Swedberg. Princeton: Princeton University Press.
Nee, Victor, and Brett de Bary Nee. 1973. Longtime California: A DocumentaryStudy of an American Chinatown. New York: Pantheon.
Nee, Victor, and James Peck. 1975. “Introduction: Why Uninterrupted Revolution?”Pp. 3–56 in China’s Uninterrupted Revolution: From 1840 to the Present, editedby V. Nee and J. Peck. New York: Pantheon Books.
Nigh, Douglas, Kang Rae Cho, and Suresh Krishnan. 1986. “The Role of Location-Related Factors in U.S. Banking Involvement Abroad.” Journal of Interna-tional Business Studies 17(3):59–72.
Park, Douglas Y., and Joel M. Podolny. 2000. “The Competitive Dynamics of Sta-tus and Niche Width: U.S. Investment Banking, 1920-1949.” Industrial andCorporate Change 9:377–414.
Peli, Gabor L. 1997. “The Niche Hiker’s Guide to Population Ecology: A Recon-struction of Niche Theory using Logic.” Pp. 1–46 in Sociological Methodology1997, edited by A. Raftery. Cambridge: Blackwell.
1999. “Political Niches in Voters’ Space: A Resource Partitioning Approach toParty Structuration in Hungary (1989-1999).” Presented at the Conference onCollective Decision and Policy Making. Groningen, 21-22 June.
Peli, Gabor L., and Bart Nooteboom. 1999. “Market Partitioning and the Geometryof the Resource Space.” American Journal of Sociology 104:1132–53.
Perry, Elizabeth J. 1994. “Trends in the Study of Chinese Politics: State-SocietyRelations.” China Quarterly 139:704–13.

161
147
Philips, Damon J., and Ezra Z. Zuckerman. 2001. “Middle-Status Conformity: Theo-retical Restatement and Empirical Demonstration in Two Markets.” AmericanJournal of Sociology 107:379–429.
Polos, Laszlo, Michael T. Hannan, and Glenn R. Carroll. 2000. “Forms and Popu-lations.” Pp. 59–81 in The Demography of Corporations and Industries, by G.R. Carroll and M. T. Hannan. Princeton, NJ: Princeton University Press.
2002. “Foundations of a Theory of Social Forms.” Industrial and CorporateChange 11:85–115.
Porac, Joseph F., and Howard Thomas. 1990. “Taxonomic Mental Models in Com-petitor Definition.” Academy of Management Review 15:224–40.
Portes, Alejandro, and Julia Sensenbrenner. 1993. “Embeddedness and Immigration:Notes on the Social Determinants of Economic Action.” American Journal ofSociology 98:1320–50.
Qian, Yingyi. 2000. “The Process of China’s Market Transition (1978-1998): TheEvolutionary, Historical, and Comparative Perspective.” Journal of Institu-tional and Theoretical Economics 156:151–71.
Ranger-Moore, James, Jane C. Banaszak-Holl, and Michael T. Hannan. 1991. “Den-sity Dependence in Regulated Industries: Founding Rates of Banks and LifeInsurance Companies.” Administrative Science Quarterly 36:36–65.
Ranger-Moore, James, Robert S. Beckenridge, and Daniel L. Jones. 1995. “Patternsof Growth and Size-Localized Competition in the New York State Life Insur-ance Industry, 1860–1985.” Social Forces 73:1027–49.
Romanelli, Elaine, and Olga M. Khessina. 2005. “Regional Industrial Identity: Clus-ter Configurations and Economic Development.” Organization Science, forth-coming.
Ruef, Martin. 2000. “The Emergence of Organizational Forms: A Community Ecol-ogy Approach.” American Journal of Sociology 106:658–714.
2004a. “The Demise of an Organizational Form: Emancipation and PlantationAgriculture in the American South, 1860-1880.” American Journal of Sociology109:1365–410.
2004b. “For Whom the Bell Tolls: Ecological Perspectives on Industrial Declineand Resurgence.” Industrial and Corporate Change 13:61-89.

162
148 REFERENCES
2006. “Boom and Bust: The Effect of Entrepreneurial Inertia on OrganizationalPopulations.” Advances in Strategic Management, forthcoming.
Schenk, Catherine R. 2001. Hong Kong as an International Financial Centre: Emer-gence and Development 1945-65. London: Routledge.
2003. “Review of Zhaojin Ji’s A History of Modern Shanghai Banking: TheRise and Decline of China’s Finance Capitalism.” Economic History ServicesOct. 9, Available at: http://www.eh.net/bookreviews/library/0693.shtml
Schoonhoven, Claudia B., Kathleen M. Eisenhardt, and Katherine Lyman. 1990.“Speeding Products to Market: Waiting Time to First Product Introduction inNew Firms.” Administrative Science Quarterly 35:177–207.
Simmel, Georg. 1978 [1907]. The Philosophy of Money. Second edition. Boston,Mass.: Routledge and Kegan Paul.
Shirk, Susan. 1994. How China opened its Door: The Political Success of the PRC’sForeign Trade and Investment Reforms. Washington: The Brookings Institu-tion.
Sorenson, Olav, and Pino G. Audia. 2000. “The Social Structure of Entrepreneur-ial Activity: Geographic Concentration of Footwear Production in the UnitedStates, 1940–1989.” American Journal of Sociology 106:424–62.
Sorenson, Olav, Sue McEvily, Charlotte Ren, and Raja Roy. 2005. “Niche WidthRevisited: Organizational Scope, Behavior and Performance.” University ofCalifornia, Los Angeles.
Sørensen, Jesper B. 1999. “Program to estimate Piecewise-Constant ExponentialModels using various Stata Routines.” Unpublished ado-file. Graduate Schoolof Business, University of Chicago.
Sørensen, Jesper B., and Olav Sorenson. 2003. “From Conception to Birth: Oppor-tunity Perception and Resource Mobilization in Entrepreneurship.” Advancesin Strategic Management 20:89–117.
Stephan, John, and Warren Boeker. 2002 “Getting to Multimarket Competition:How Multimarket Contact affects Firms’ Market Entry Decisions.” Advancesin Strategic Management 18:229–61.
Stinchcombe, Arthur L. 1965. “Social Structure and Organizations.” Pp. 142–93 inHandbook of Organizations, edited by J. March. Chicago: Rand McNally.

163
149
Stuart, Toby E., and Olav Sorenson. 2003. “The Geography of Opportunity: Spa-tial Heterogeneity in Founding Rates and the Performance of BiotechnologyFirms.” Research Policy 32:229–53.
Suhomlinova, Olga O. 1999. “Constructive Destruction: Transformation of RussianState-Owned Construction Enterprises during Market Transition.” Organiza-tion Studies 20:451–84.
Swaminathan, Anand, and Glenn R. Carroll. 1995. “Beer Brewers.” Pp. 223–43 inOrganizations in Industries, edited by G. Carroll and M. Hannan. New York:Oxford University Press.
Tamagna, Frank M. 1942. Banking and Finance in China. New York: Institute ofPacific Relations.
The China Annual. 1943. Tokyo: The Asia Statistics Co.
Tian, Gang. 1996. Shanghai’s Role in the Economic Development of China: Reformof Foreign Trade and Investment. Westport, Conn.: Praeger.
Tuma, Nancy B., Michael T. Hannan. 1984. Social Dynamics: Models and Methods.Orlando, Fl.: Academic Press.
Uzzi, Brian. 1999. “Embeddedness in the Making of Financial Capital: How SocialRelations and Networks benefit Firms seeking Financing.” American Sociolog-ical Review 64:481–505.
Vermeulen, Ivar, and Jeroen Bruggeman. 2001. “The Logic of Organizational Mar-kets: Thinking Through Resource Partitioning Theory.” Computational andMathematical Organization Theory 7:87–111.
Volterra, Vito. 1926. “Variations and Fluctuations of the Number of Individuals inAnimal Species Living Together.” Reprinted in R. N. Chapman. 1931. AnimalEcology. New York: McGraw-Hill.
Wade, James B. 1996.“A Community-Level Analysis of Sources and Rates of Tech-nological Variation in the Microprocessor Market.” Academy of ManagementJournal 39:1218-44.
Weber, Max. 1978 [1922]. Economy and Society: An Outline of Interpretive Sociology.Berkeley, Calif.: University of California Press.

164
150 REFERENCES
Weick, Karl E. 1979. The Social Psychology of Organizing. Second edition. Reading,Mass.: Addison Wesley.
Weingast, Barry, Yingyi Qian, and Gabriella Montinola. 1995. “Federalism, Chi-nese Style: The Political Basis for Economic Success in China.” World Politics48(1):50–81.
Windzio, Michael. 2003. Organisation, Strukturwandel und Arbeitsmarktmobilitat:Untersuchungen zum Evolutionaren Wandel der Sozialstruktur. Wiesbaden:Westdeutscher Verlag.
Witteloostuijn, Arjen van, and Marc van Wegberg. 1992. “Multimarket Competi-tion: Theory and Evidence.” Journal of Economic Behavior and Organization18:273–82.
Wong, Siu-Lin. 1988. Emigrant Entrepreneurs: Shanghai Industrialists in Hong Kong.Hong Kong: Oxford University Press.
Wong, Y. C. Richard, and M. L. Sonia Wong. 2001. “Competition in China’s Do-mestic Banking Industry.” Cato Journal 21:19–41.
Yamaguchi, Kazuo. 1991. Event History Analysis. Applied Social Research MethodsSeries, Volume 28. Beverly Hills, Calif.: Sage.
Yeh, Anthony G. O. 1996. “Pudong: Remaking Shanghai as a World City.” Pp.273–98 in Shanghai: Transformation and Modernization Under China’s OpenPolicy, edited by Y. Yeung and Y. Sung. Hong Kong: Chinese University Press.
Yiu, Daphne, and Shige Makino. 2002. “The Choice between Joint Venture andWholly Owned Subsidiary: An Institutional Perspective.” Organization Science13:667–83.
Youssef, Samir M. 1975. “Contextual Factors Influencing Control Strategy of Multi-national Corporations.” Academy of Management Journal 18:136–45.
Zuckerman, Ezra W. 1999. “The Categorical Imperative: Securities Analysts andthe Illegitimacy Discount.” American Journal of Sociology 104:1398–438.
Zuckerman, Ezra W., Tai-Young Kim, Kalinda Ukanwa, and James von Rittmann.2003. “Robust Identities or Nonentities? Typecasting in the Feature-Film LaborMarket.” American Journal of Sociology 108:1018–74.

165
Samenvatting
(Summary in Dutch)
Het doel van dit proefschrift is om inzicht te verschaffen in enkele belangrijkevraagstukken op het gebied van de organisatie-ecologie (zie Carroll, Hannan en vanWitteloostuijn 2001), te weten: 1) de her-opkomst van populaties van organisaties,2) ecologische interacties gedurende de eerste stadia van bedrijvigheid en 3) het mo-delleren van concurrentie tussen populaties. Deze worden onderzocht door gebruikte maken van informatie over de vestigingen van buitenlandse banken in Shanghai.
Ten eerste is aldus geprobeerd een beter inzicht te krijgen in hoe populaties vanorganisaties in staat zijn om opnieuw op te komen na een periode van inactiviteit.Een beter begrip is van theoretisch belang omdat van veel van de processen dieten grondslag liggen aan her-opkomst verwacht wordt dat ze ook van belang zijnvoor de algehele evolutie van organisatievormen en gevallen van her-opkomst biedeneen unieke mogelijkheid om deze processen onder ongebruikelijke omstandigheden tebestuderen. Hier valt te denken aan de mate van legitimiteit van de organisatievormen de constructie van de sociale identiteit van de organisatievorm. Maar, zoals ditproefschrift laat zien, deze kunnen niet volledig begrepen worden wanneer het so-ciale systeem, waarin de periode van inactiviteit en de daaropvolgende her-opkomstplaatsvindt, beschouwd wordt in afzondering van andere systemen. Het blijkt dat eenbreder perspectief dat rekening houdt met de organisatiedynamiek buiten het des-betreffende sociale systeem een completer beeld geeft van de verschillende aspectenvan her-opkomst. Dit wordt analytisch aangetoond door het modelleren van de ves-tigingsvoet van buitenlandse banken in Shanghai, die substantieel is toegenomennadat de periode van inactiviteit van deze populatie eindigde in het begin van dejaren tachtig. Wanneer alleen de populatie van buitenlandse banken in Shanghaiin ogenschouw wordt genomen en de periode voorafgaand en volgend op de fase
151

166
152 SUMMARY IN DUTCH
van inactiviteit in de analyse betrokken wordt, komt men tot de conclusie dat deher-opkomst van buitenlandse banken niet gepaard ging met een hernieuwde toe-name in legitimiteit (zoals in het geval van Dobrev (2001)) en dat dit proces dusniet volledig het patroon in de toegenomen vestigingsvoet van buitenlandse bankenkan verklaren. Een dergelijke verklaring kan wel worden gegeven na het bestuderenvan de dynamiek in een alternatief financieel centrum dat relatief dichtbij Shang-hai gesitueerd is, namelijk dat van Hong Kong. De grootte van de populatie vanbanken in Hong Kong, substantieel toegenomen gedurende de fase waarin het in-ternationale bankwezen inactief was in Shanghai, had een significante invloed op deher-opkomst van buitenlandse banken in Shanghai, hetgeen suggereert dat brederebewegingen van de organisatievorm bestudeerd moeten worden in de analyse vangevallen van her-opkomst. Er moet echter wel opgemerkt worden dat, theoretischgezien, de verklaring zoals die gegeven wordt door Dobrev (2001) met betrekkingtot ’her-legitimering’ niet noodzakelijkerwijs in tegenstelling staat tot de verklaringzoals die hier gegeven wordt, zoals eerder ook aangegeven werd door Carroll enTeo (1998). Het onderzoek in dit proefschrift maakt de weg vrij voor een simul-tane bestudering van deze processen, hetgeen een waardevolle inspanning kan zijngegeven de centraliteit van deze processen in het onderzoek naar organisatievormenen hun identiteit.
Het tweede theoretische vraagstuk dat aan bod komt in dit proefschrift is op or-ganisatieniveau en betreft het vroege stadium van bedrijvigheid (met andere woor-den het stadium dat voorafgaat aan de toetreding van een organisatie tot een po-pulatie) en hoe deze bedrijvigheid wordt beınvloed door ecologische interacties. Hetbelang van dit vraagstuk ligt in het feit dat de manier waarop deze initiele fase door-lopen wordt, blijvende consequenties heeft voor de latere groei- en overlevingskansenvan de organisatie (bijv. Carroll e.a. 1996), maar ook consequenties heeft voor dealgehele evolutie van de bedrijfstak (Ruef 2006). Om inzicht te krijgen in de ecolo-gische processen tijdens de pre-toetreding fase wordt de overgang van bankvertegen-woordiging naar volledig operationeel bankkantoor gemodelleerd in de empirischeanalyse. Bankvertegenwoordigingen worden gezien als organisaties-in-opbouw, van-wege de aard van hun activiteiten en het feit dat het de vertegenwoordigingen nogniet is toegestaan inkomsten te genereren. Buitenlandse banken zijn verplicht huneerste schreden in China te zetten met een vertegenwoordiging, maar na verloopvan tijd (nadat de bank een licentie voor een bankkantoor heeft ontvangen) kanmen financiele diensten aan gaan bieden. Het moment waarop dit gebeurd wordt

167
153
gedefinieerd als de feitelijke markttoetreding, omdat de bank vanaf dit punt onder-worpen wordt aan marktwerking en prijsconcurrentie. De overgang van vertegen-woordiging naar operationeel bankkantoor wordt gemodelleerd met kenmerken vande vertegenwoordiging en haar moederorganisatie, de tijd die de vertegenwoordigingheeft doorgebracht in de pre-toetreding fase, alsmede omgevingskenmerken. In degeest van de fundamentele aanname van de organisatie-ecologie dat de omgevingvan een organisatie voornamelijk bestaat uit andere organisaties, wordt specialeaandacht geschonken aan de effecten van de aanwezigheid van andere vertegenwoor-digingen en van de al operationele bankkantoren. Een belangrijke bevinding is datde overgang van vertegenwoordigend kantoor naar de toetreding tot de populatiesvan operationele bankkantoren sterk afhangt van de vertegenwoordigingen van con-currenten in de dichte nabijheid (binnen hetzelfde stadsdistrict), maar niet van devertegenwoordigingen in andere delen van de stad. De sterkte van de identiteit vaneen organisatie-in-opbouw neemt dus snel af als de geografische afstand toeneemt.Dit staat in contrast met de identiteit van de operationele organisatie (het bankkan-toor) die duidelijk aanwezig was op een grotere geografische schaal.
Het derde theoretische vraagstuk dat aandacht krijgt in dit proefschrift heeft be-trekking op de mechanismen die ten grondslag liggen aan concurrentie tussen popu-laties van organisaties. Een perspectief op concurrentie tussen populaties stelt dat demate van concurrentie tussen populaties afhangt van de concentratie in de markt. Insterk geconcentreerde markten waar een (generalistische) populatie gepositioneerdis in het marktcentrum en de andere (specialistische) populatie in de periferie van demarkt, kan de concurrentie beperkt zijn. In dergelijke situaties is de markt feitelijkverdeeld tussen twee populaties (Carroll 1985). Concurrentie kan echter toenemenals de markt minder geconcentreerd wordt (bijvoorbeeld door deregulering). De ge-neralistische populatie zal zich dan bewegen naar de periferie van de markt waar deconcurrentie aangegaan wordt met de specialistische populatie. In dit proefschriftwordt in dit verband gerefereerd aan het terugdraaien van de middelenverdeling inde markt oftewel een ’de-partitionering’ (Dobrev 2000). Een ander perspectief opde concurrentie tussen populaties maakt daarentegen geen aannames over de strate-gische orientatie van elk van deze populaties of veranderingen in de verdeling vanmiddelen (zoals gesuggereerd wordt door de mate van concurrentie). Dit perspec-tief bestudeert simpelweg de concurrentiedruk van de ene populatie op de andere,doorgaans gemeten in termen van het aantal organisaties in de concurrerende popu-latie (de dichtheid) of de gesommeerde grootte van deze organisaties (de massa van

168
154 SUMMARY IN DUTCH
de populatie). Wanneer beide populaties in dezelfde omgeving actief zijn zal in hetuiterste geval de populatie die de meeste concurrentiedruk kan uitoefenen de anderde markt doen verlaten. Dit wordt ook wel het ’principe van concurrentie-uitsluiting’genoemd (Gause 1934). In minder extreme situaties (bijvoorbeeld wanneer de omge-ving voldoende heterogeen is) kunnen populaties manieren vinden om samen voortte bestaan, maar individuele organisaties kunnen mogelijk nog steeds de nadelen on-dervinden van de aanwezigheid van de concurrerende populatie in termen van hunbedrijfsresultaat. Het bestuderen van de concurrentie tussen populaties vanuit beideperspectieven is van belang omdat we zo kunnen achterhalen welke variabelen onderwelke condities het beste de mate van concurrentie weer kunnen geven. Zelfs in situ-aties waarin een toenemende marktconcentratie aan de orde is in de evolutie van eenbedrijfstak (zoals beschreven in veel studies naar middelenverdeling) zou men kun-nen onderzoeken in welke mate eenvoudige principes van concurrentie-uitsluiting(of anders geformuleerd: concurrentie-insluiting) ook niet de proliferatie van spe-cialisten zou kunnen verklaren. In deze studie bleken beide verklaringen in gelijkemate toepasbaar, mogelijk omdat beiden zelf het product zijn van een onderliggendederegulering. Als gevolg van de deregulering in China die ingezet werd in het beginvan de jaren tachtig is het aantal lokale banken toegenomen en is de concentratie inde markt afgenomen. Deze ontwikkelingen hebben geleid tot een toegenomen drukop de buitenlandse banken, die tot nu toe slechts een marginaal deel van de Chinesemarkt hebben veroverd.

169
Biographical Sketch
Jeroen Kuilman was born in Hoogezand-Sappemeer on May 8, 1979. He attendedCollegium Marianum in Venlo, from which he received his Atheneum diploma in1997. After high school, Jeroen went on to study International Business at the Uni-versity of Maastricht. He worked at Hewlett-Packard in Germany in 2000 and wasan exchange student at Keimyung University, South Korea, in 2001. In October2001, Jeroen received his Master’s degree with a thesis on headquarter-subsidiaryrelationships within multinational corporations.
In November 2001, Jeroen became a Ph.D. student in the Department of Orga-nization and Personnel Management at Erasmus University Rotterdam. He traveledto Shanghai at the end of his second year as a doctoral student, to collect data onthe history of the local banking industry during three months of field research. In thespring semester of 2004, Jeroen studied at Stanford University where he was trainedin ecological theory and methods of analysis. During his time as a doctoral student,he presented papers at several major international conferences and seminars, such asthe Annual Meeting of the Academy of Management and the Organizational EcologyConference at the University of Durham.
Jeroen will be working as a post-doctoral researcher at RSM Erasmus Universityas of November 1, 2005. His main research interests include organizational ecology,industry evolution, and international business.
155

170
156
Erasmus Research Institute of Management
ERIM Ph.D. Series Resesearch in Management
Appelman, J.H., Governance of Global Interorganizational Tourism Networks; ChangingForms of Co-ordination between the Travel Agency and Aviation Sector, Promotors: Prof. dr.F.M. Go & Prof. dr. B. Nooteboom, EPS-2004-036-MKT, ISBN 90-5892-060-7, http://hdl-.handle.net/1765/1199.
Assen, M.F. van, Empirical Studies in Discrete Parts Manufacturing Management, Pro-motors: Prof. dr. S.L. van de Velde & Prof. dr. W.H.M. Zijm, EPS-2005-056-LIS, ISBN90-5892-085-2, http://hdl.handle.net/1765/6767.
Berens, G., Corporate Branding: The Development of Corporate Associations and their In-fluence on Stakeholder Reactions, Promotor: Prof. dr. C.B.M. van Riel, EPS-2004-039-ORG,ISBN 90-5892-065-8, http://hdl.handle.net/1765/1273.
Berghe, D.A.F., Working Across Borders: Multinational Enterprises and the International-ization of Employment, Promotors: Prof. dr. R.J.M. van Tulder & Prof. dr. E.J.J. Schenk,EPS-2003-029-ORG, ISBN 90-5892-05-34, http://hdl.handle.net/1765/1041.
Bijman, W.J.J., Essays on Agricultural Co-operatives; Governance Structure in Fruit andVegetable Chains, Promotor: Prof. dr. G.W.J. Hendrikse, EPS-2002-015-ORG, ISBN 90-5892-024-0, http://hdl.handle.net/1765/867.
Boer, N.I., Knowledge Sharing within Organizations: A Situated and Relational Perspective,Promotor: Prof. dr. K. Kumar, EPS-2005-060-LIS, ISBN 90-5892-086-0, http://hdl.handle-.net/1765/6770.
Brito, M.P. de, Managing Reverse Logistics or Reversing Logistics Management?, Promotors:Prof. dr. ir. R. Dekker & Prof. dr. M.B.M. de Koster, EPS-2004-035-LIS, ISBN 90-5892-058-5, http://hdl.handle.net/1765/1132.
Campbell, R.A.J., Rethinking Risk in International Financial Markets, Promotor: Prof. dr.C.G. Koedijk, EPS-2001-005-F&A, ISBN 90-5892-008-9, http://hdl.handle.net/1765/306.
Chen, Y., Labour Flexibility in China’s Companies: An Empirical Study, Promotors: Prof.

171
157
dr. A. Buitendam & Prof. dr. B. Krug, EPS-2001-006-ORG, ISBN 90-5892-012-7, http://hdl-.handle.net/1765/307.
Danisevska, P., Empirical Studies on Financial Intermediation and Corporate Policies, Pro-motor: Prof. dr. C.G. Koedijk, EPS-2004-044-F&A, ISBN 90-5892-070-4, http://hdl.handle-.net/1765/1518.
Delporte-Vermeiren, D.J.E., Improving the Flexibility and Profitability of ICT-enabled Busi-ness Networks: An Assessment Method and Tool, Promotors: Prof. dr. mr. P.H.M. Vervest &Prof. dr. ir. H.W.G.M. van Heck, EPS-2003-020-LIS, ISBN 90-5892-040-2, http://hdl.handle-.net/1765/359.
Dijksterhuis, M., Organizational Dynamics of Cognition and Action in the Changing Dutchand US Banking Industries, Promotors: Prof. dr. ing. F.A.J. van den Bosch & Prof. dr. H.W.Volberda, EPS-2003-026-STR, ISBN 90-5892-048-8, http://hdl.handle.net/1765/1037.
Fenema, P.C. van, Coordination and Control of Globally Distributed Software Projects, Pro-motor: Prof. dr. K. Kumar, EPS-2002-019-LIS, ISBN 90-5892-030-5, http://hdl.handle.net-/1765/360.
Fleischmann, M., Quantitative Models for Reverse Logistics, Promotors: Prof. dr. ir. J.A.E.E.van Nunen & Prof. dr. ir. R. Dekker, EPS-2000-002-LIS, ISBN 3540 417 117, http://hdl.han-dle.net/1765/1044.
Flier, B., Strategic Renewal of European Financial Incumbents: Co-evolution of Environmen-tal Selection, Institutional Effects, and Managerial Intentionality, Promotors: Prof. dr. ing.F.A.J. van den Bosch & Prof. dr. H.W. Volberda, EPS-2003-033-STR, ISBN 90-5892-055-0,http://hdl.handle.net/1765/1071.
Fok, D., Advanced Econometric Marketing Models, Promotor: Prof. dr. P.H.B.F. Franses,EPS-2003-027-MKT, ISBN 90-5892-049-6, http://hdl.handle.net/1765/1035.
Ganzaroli , A., Creating Trust between Local and Global Systems, Promotors: Prof. dr. K. Ku-mar & Prof. dr. R.M. Lee, EPS-2002-018-LIS, ISBN 90-5892-031-3, http://hdl.handle.net-/1765/361.
Gilsing, V.A., Exploration, Exploitation and Co-evolution in Innovation Networks, Promo-tors: Prof. dr. B. Nooteboom & Prof. dr. J.P.M. Groenewegen, EPS-2003-032-ORG, ISBN90-5892-05-42, http://hdl.handle.net/1765/1040.
Graaf, G. de, Tractable Morality: Customer Discourses of Bankers, Veterinarians and Char-ity Workers, Promotors: Prof. dr. F. Leijnse & Prof. dr. T. van Willigenburg, EPS-2003-031-ORG, ISBN 90-5892-051-8, http://hdl.handle.net/1765/1038.
172
158
Hermans. J.M., ICT in Information Services, Use and Deployment of the Dutch SecuritiesTrade, 1860-1970, Promotor: Prof. dr. F.H.A. Janszen, EPS-2004-046-ORG, ISBN 90-5892-072-0, http://hdl.handle.net/1765/1793.
Heugens, P.M.A.R., Strategic Issues Management: Implications for Corporate Performance,Promotors: Prof. dr. ing. F.A.J. van den Bosch & Prof. dr. C.B.M. van Riel, EPS-2001-007-STR, ISBN 90-5892-009-7, http://hdl.handle.net/1765/358.
Hooghiemstra, R., The Construction of Reality, Promotors: Prof. dr. L.G. van der Tas RA &Prof. dr. A.Th.H. Pruyn, EPS-2003-025-F&A, ISBN 90-5892-047-X, http://hdl.handle.net-/1765/871.
Jansen, J.J.P., Ambidextrous Organizations: A Multiple-Level Study of Absorptive Capacity,Exploratory and Exploitative Innovation and Performance, Promotors: Prof.dr.ing. F.A.J.Van den Bosch & Prof.dr. H.W. Volberda, EPS-2005-055-STR, ISBN 90-5892-081-X, http://-hdl.handle.net/1765/6774.
Jong, C. de, Dealing with Derivatives: Studies on the Role, Informational Content and Pric-ing of Financial Derivatives, Promotor: Prof. dr. C.G. Koedijk, EPS-2003-023-F&A, ISBN90-5892-043-7, http://hdl.handle.net/1765/1043.
Keizer, A.B., The Changing Logic of Japanese Employment Practices: A Firm-Level Analy-sis of Four Industries, Promotors: Prof.dr. J.A. Stam & Prof.dr. J.P.M. Groenewegen, EPS-2005-057-X, ISBN 90-5892-087-9, http://hdl.handle.net/1765/6667.
Kippers, J., Empirical Studies on Cash Payments, Promotor: Prof.dr. Ph.H.B.F. Franses,EPS-2004-043-F&A, ISBN 90-5892-069-0, http://hdl.handle.net/1765/1520.
Koppius, O.R., Information Architecture and Electronic Market Performance, Promotors:Prof. dr. P.H.M. Vervest & Prof. dr. ir. H.W.G.M. van Heck, EPS-2002-013-LIS, ISBN 90-5892-023-2, http://hdl.handle.net/1765/921.
Kotlarsky, J., Management of Globally Distributed Component-Based Software DevelopmentProjects, Promotor: Prof.dr. K. Kumar, EPS-2005-059-LIS, ISBN 90-5892-088-7, http://hdl-.handle.net/1765/6772.
Langen, P.W. de, The Performance of Seaport Clusters; A Framework to Analyze Clus-ter Performance and an Application to the Seaport Clusters of Durban, Rotterdam and theLower Mississippi, Promotors: Prof. dr. B. Nooteboom & Prof. drs. H.W.H. Welters, EPS-2004-034-LIS, ISBN 90-5892-056-9, http://hdl.handle.net/1765/1133.
Le Anh, T., Intelligent Control of Vehicle-Based Internal Transport Systems, Promotors:
173
159
Prof. dr. M.B.M. de Koster & Prof. dr. ir. R. Dekker, EPS-2005-051-LIS, ISBN 90-5892-079-8, http://hdl.handle.net/1765/6554.
Liang, G., New Competition; Foreign Direct Investment and Industrial Development inChina, Promotor: Prof. dr. R.J.M. van Tulder, EPS-2004-047-ORG, ISBN 90-5892-073-9,http://hdl.handle.net/1765/1795.
Loef, J., Incongruity between Ads and Consumer Expectations of Advertising, Promotors:Prof. dr. W.F. van Raaij & Prof. dr. G. Antonides, EPS-2002-017-MKT, ISBN 90-5892-028-3, http://hdl.handle.net/1765/869.
Maeseneire, W. de, Essays on Firm Valuation and Value Appropriation, Promotor: Prof. dr.J.T.J. Smit, EPS-2005-053-F&A, ISBN 90-5892-082-8, http://hdl.handle.net/1765/6768.
Mandele, L.M. van der, Leadership and the Inflection Point: A Longitudinal Perspective,Promotors: Prof. dr. H.W. Volberda & Prof. dr. H.R. Commandeur, EPS-2004-042-STR,ISBN 90-5892-067-4, http://hdl.handle.net/1765/1302.
Meer, J.R. van der, Operational Control of Internal Transport, Promotors: Prof. dr. M.B.M.de Koster & Prof. dr. ir. R. Dekker, EPS-2000-001-LIS, ISBN 90-5892-004-6, http://hdl-.handle.net/1765/859.
Miltenburg, P.R., Effects of Modular Sourcing on Manufacturing Flexibility in the Automo-tive Industry: A Study among German OEMs, Promotors: Prof. dr. J. Paauwe & Prof. dr.H.R. Commandeur, EPS-2003-030-ORG, ISBN 90-5892-052-6, http://hdl.handle.net/1765-/1039.
Moerman, G.A., Empirical Asset Pricing and Banking in the Euro Area, Promotor: Prof. dr.C.G. Koedijk, EPS-2005-058-F&A, ISBN 90-5892-090-9, http://hdl.handle.net/1765/6666.
Mol, M.M., Outsourcing, Supplier-relations and Internationalisation: Global Sourcing Strat-egy as a Chinese Puzzle, Promotor: Prof. dr. R.J.M. van Tulder, EPS-2001-010-ORG, ISBN90-5892- 014-3, http://hdl.handle.net/1765/355.
Mulder, A., Government Dilemmas in the Private Provision of Public Goods, Promotor:Prof. dr. R.J.M. van Tulder, EPS-2004-045-ORG, ISBN 90-5892-071-2, http://hdl.handle-.net/1765/1790.
Muller, A.R., The Rise of Regionalism: Core Company Strategies under the Second Waveof Integration, Promotor: Prof. dr. R.J.M. van Tulder, EPS-2004-038-ORG, ISBN 90-5892-062-3, http://hdl.handle.net/1765/1272.
174
160
Oosterhout, J. van, The Quest for Legitimacy: On Authority and Responsibility in Gover-nance, Promotors: Prof. dr. T. van Willigenburg & Prof. mr. H.R. van Gunsteren, EPS-2002-012-ORG, ISBN 90-5892-022-4, http://hdl.handle.net/1765/362.
Pak, K., Revenue Management: New Features and Models, Promotor: Prof. dr. ir. R. Dekker,EPS-2005-061-LIS, ISBN 90-5892-092-5, http://hdl.handle.net/1765/6771.
Peeters, L.W.P., Cyclic Railway Timetable Optimization, Promotors: Prof. dr. L.G. Kroon &Prof. dr. ir. J.A.E.E. van Nunen, EPS-2003-022-LIS, ISBN 90-5892-042-9, http://hdl.handle-.net/1765/429.
Popova, V., Knowledge Discovery and Monotonicity, Promotor: Prof. dr. A. de Bruin, EPS-2004-037-LIS, ISBN 90-5892-061-5, http://hdl.handle.net/1765/1201.
Pouchkarev, I., Performance Evaluation of Constrained Portfolios, Promotors: Prof. dr. J.Spronk & Dr. W.G.P.M. Hallerbach, EPS-2005-052-F&A, ISBN 90-5892-083-6, http://hdl-.handle.net/1765/6731.
Ratnasingam, P., Interorganizational Trust in Business to Business E-Commerce, Promo-tors: Prof. dr. K. Kumar & Prof. dr. H.G. van Dissel, EPS-2001-009-LIS, ISBN 90-5892-017-8, http://hdl.handle.net/1765/356.
Romero Morales, D., Optimization Problems in Supply Chain Management, Promotors: Prof.dr. ir. J.A.E.E. van Nunen & Dr. H.E. Romeijn, EPS-2000-003-LIS, ISBN 90-9014078-6,http://hdl.handle.net/1765/865.
Roodbergen , K.J., Layout and Routing Methods for Warehouses, Promotors: Prof. dr.M.B.M. de Koster & Prof. dr. ir. J.A.E.E. van Nunen, EPS-2001-004-LIS, ISBN 90-5892-005-4, http://hdl.handle.net/1765/861.
Schweizer, T.S., An Individual Psychology of Novelty-Seeking, Creativity and Innovation,Promotor: Prof. dr. R.J.M. van Tulder, EPS-2004-048-ORG, ISBN 90-5892-07-71, http://hdl-.handle.net/1765/1818.
Six, F.E., Trust and Trouble: Building Interpersonal Trust within Organizations, Promotors:Prof. dr. B. Nooteboom & Prof. dr. A.M. Sorge, EPS-2004-040-ORG, ISBN 90-5892-064-X,http://hdl.handle.net/1765/1271.
Slager, A.M.H., Banking across Borders, Promotors: Prof. dr. D.M.N. van Wensveen & Prof.dr. R.J.M. van Tulder, EPS-2004-041-ORG, ISBN 90-5892-066-6, http://hdl.handle.net/1765-

175
161
/1301.
Spekle, R.F., Beyond Generics: A Closer Look at Hybrid and Hierarchical Governance, Pro-motor: Prof. dr. M.A. van Hoepen RA, EPS-2001-008-F&A, ISBN 90-5892-011-9, http://hdl-.handle.net/1765/357.
Teunter, L.H., Analysis of Sales Promotion Effects on Household Purchase Behavior, Pro-motors: Prof. dr. ir. B. Wierenga & Prof. dr. T. Kloek, EPS-2002-016-ORG, ISBN 90-5892-029-1, http://hdl.handle.net/1765/868.
Valck, K. de, Virtual Communities of Consumption: Networks of Consumer Knowledge andCompanionship, Promotors: Prof. dr. ir. G.H. van Bruggen & Prof. dr. ir. B. Wierenga,EPS-2005-050-MKT, ISBN 90-5892-078-X, http://hdl.handle.net/1765/6663.
Verheul, I., Is there a (Fe)male Approach? Understanding Gender Differences in Entre-preneurship, Promotor: Prof. dr. A.R. Thurik, EPS-2005-054-ORG, ISBN 90-5892-080-1,http://hdl.handle.net/1765/2005.
Vis, I.F.A., Planning and Control Concepts for Material Handling Systems, Promotors: Prof.dr. M.B.M. de Koster & Prof. dr. ir. R. Dekker, EPS-2002-014-LIS, ISBN 90-5892-021-6,http://hdl.handle.net/1765/866.
Vliet, P. van, Downside Risk and Empirical Asset Pricing, Promotor: Prof. dr. G.T. Post,EPS-2004-049-F&A ISBN 90-5892-07-55, http://hdl.handle.net/1765/1819.
Vromans, M.J.C.M., Reliability of Railway Systems, Promotors: Prof. dr. L.G. Kroon, Prof.dr. ir. R. Dekker & Prof. dr. ir. J.A.E.E. van Nunen, EPS-2005-062-LIS, ISBN 90-5892-089-5, http://hdl.handle.net/1765/6773.
Waal, T. de, Processing of Erroneous and Unsafe Data, Promotor: Prof. dr. ir. R. Dekker,EPS-2003-024-LIS, ISBN 90-5892-045-3, http://hdl.handle.net/1765/870.
Wielemaker, M.W., Managing Initiatives: A Synthesis of the Conditioning and Knowledge-Creating View, Promotors: Prof. dr. H.W. Volberda & Prof. dr. C.W.F. Baden-Fuller, EPS-2003-28-STR, ISBN 90-5892-050-X, http://hdl.handle.net/1765/1036.
Wijk, R.A.J.L. van, Organizing Knowledge in Internal Networks: A Multilevel Study, Promo-tor: Prof. dr. ing. F.A.J. van den Bosch, EPS-2003-021-STR, ISBN 90-5892-039-9, http://hdl-.handle.net/1765/347.
Wolters, M.J.J., The Business of Modularity and the Modularity of Business, Promotors:Prof. mr. dr. P.H.M. Vervest & Prof. dr. ir. H.W.G.M. van Heck, EPS-2002-011-LIS, ISBN90-5892-020-8, http://hdl.handle.net/1765/920.

The Re-Emergence of Foreign Banks in Shanghai
An Ecological Analysis
Is China, with one of the world’s fastest growing economies, indeed
the market of high returns and quick profits as the popular press and
communis opinio seem to suggest? This book offers a more moderated
perspective. It shows, by employing theories and methods from the
field of organizational ecology, that the intricacies of the local market
might frequently have been underestimated. Based on a detailed
analysis of the re-emerging population of foreign banks in Shanghai,
it points out that as more and more foreign banks set up operations
in Shanghai, competition among them is intensifying to the extent
that it is deterring the founding of new foreign banks in Shanghai.
Foreign banks furthermore face long waiting times before they can
start providing banking services and, in addition, their profitability is
affected by the growing number of domestic banks. From a theoretical
perspective, the findings in this book add significantly to the study of
re-emerging organizational forms, the study of ecological dynamics
prior to entry into a population, and theories concerning inter-
population competition such as resource partitioning.
ERIM
The Erasmus Research Institute of Management (ERIM) is the
Research School (Onderzoekschool) in the field of management of
the Erasmus University Rotterdam. The founding participants of
ERIM are RSM Erasmus University and the Erasmus School of Econo-
mics. ERIM was founded in 1999 and is officially accredited by the
Royal Netherlands Academy of Arts and Sciences (KNAW). The
research undertaken by ERIM is focussed on the management of the
firm in its environment, its intra- and inter-firm relations, and its
business processes in their interdependent connections.
The objective of ERIM is to carry out first rate research in manage-
ment, and to offer an advanced graduate program in Research in
Management. Within ERIM, over two hundred senior researchers and
Ph.D. candidates are active in the different research programs. From
a variety of academic backgrounds and expertises, the ERIM commu-
nity is united in striving for excellence and working at the forefront
of creating new business knowledge.
www.erim.eur.nl ISBN 90-5892-096-8
JEROEN KUILMAN
The Re-Emergenceof Foreign Banksin ShanghaiAn Ecological Analysis
Desig
n: B
&T O
ntw
erp en
advies w
ww
.b-en
-t.nl
Print:H
aveka ww
w.h
aveka.nl
66
JER
OE
N K
UIL
MA
NT
he
Re
-Em
erg
en
ce o
f Fore
ign
Ba
nk
s in S
ha
ng
ha
iIBA - 05 omslag 06-07 Scale: 100%