IB Biology Lab Report Guide · 1 Modified from: Mr. Todd McGee, IB Biology, Brooke Point High...
23
1 Modified from: Mr. Todd McGee, IB Biology, Brooke Point High School, Stafford, VA Internal Assessment (IA) Lab Report Guide Robin Ford-Ballis, CCCHS Your internal assessment (IA) lab report is a professional document based on your accumulation of knowledge and abilities to act and function as a scientist. I know it is time consuming, but you are the scientist and we are excited to see your results! Have fun as you partake in the joy of being an independent scientist. You will produce a single typed document (typically 6-12 pages long) that will be assessed by myself as well as a random “external moderator,” usually from a foreign country, during the summer months. Our scores will be compared and averaged for your final score. You will also receive a lab grade for the project my class. Remember, the IA lab reports constitutes 20% of your final IB score (80% is from papers 1, 2 & 3 which will be taken in May) and constitutes a large part of your overall Q2 grade in this classroom. The lab report is graded by merits of the five aspects and will be worth a total of 48 points. Personal Engagement Show evidence of your commitment and dedication to solving your research question. +2 Points (8%) Exploration Provide a well-designed lab complete with background research and focus on controls. +6 Points (25%) Analysis Processing data in a table(s) and graph(s) as well as use of appropriate statistics to support a conclusion. +6 Points (25%) Evaluation Concluding and discussing your data based on your research question and its implications to the world. +6 Points (25%) Communication The focus of your lab to the research question and your ability to clearly convey data, ideas and thoughts to readers. +4 Points (17%) Total +24 Points (100%) *Everything will be doubled for your 3 rd quarter grade, making 48 points total. Requirements of the IA Lab Report: i. Must be typed in 12 point font in a legible, professional font (no comic-sans!). a. Graphs and data tables need to be created on a computer, preferably Microsoft Excel®. b. A free alternative to Microsoft Excel® is Openoffice.org of which you can download. ii. Lab report needs to be organized in the proper format of a formal lab report. iii. All factual information must be cited and properly sourced on a separate works cited page. iv. If human volunteer subjects are used, the lab must have their signed consent sheets attached. v. Research question should be emailed to: [email protected] Draft and Final version of IA turned in via www.turnitin.com Class ID: 13549859 Enrollment password: seniors Responsibilities: Make sure you develop a lab that is within your abilities and time to complete. Every year some hot shot tries to go above and beyond in what they see as the “ultimate lab”, only to find that the deadline approaches and they ran out of test subjects, don’t have enough trials, ran out of money, etc. Just keep it simple and you can succeed. It is your responsibility to appreciate the meaning of academic honesty, especially authenticity and intellectual property. You are also responsible for initiating your research question on your own and developing a method to test it. Seeking help when in doubt, demonstrating independence of thought, initiative in the design and implantation of your investigation are important for you to demonstrate as a scientist and as a student. The IA is your responsibility and it is your work. Plagiarism and copying other’s work is not permissible. You must clearly distinguish between your own words and thoughts and those of others. It is preferred that you use MLA format for citing (although research biologists tend to use CSE or CMS formats). Key Due Dates: Monday, September 26 th Research Question Due (emailed) Friday, October 21st Draft Due (must bring submitted via turnitin) Thursday, November 10th Final IA Lab Report Due (hardcopy and turnitin)
Transcript of IB Biology Lab Report Guide · 1 Modified from: Mr. Todd McGee, IB Biology, Brooke Point High...
1
Modified from: Mr. Todd McGee, IB Biology, Brooke Point High School, Stafford, VA
Internal Assessment (IA) Lab Report Guide Robin Ford-Ballis, CCCHS
Your internal assessment (IA) lab report is a professional document based on your accumulation of
knowledge and abilities to act and function as a scientist. I know it is time consuming, but you are the scientist and we are excited to see your results! Have fun as you partake in the joy of being an independent scientist.
You will produce a single typed document (typically 6-12 pages long) that will be assessed by myself as well as a random “external moderator,” usually from a foreign country, during the summer months. Our scores will be compared and averaged for your final score. You will also receive a lab grade for the project my class.
Remember, the IA lab reports constitutes 20% of your final IB score (80% is from papers 1, 2 & 3 which will be taken in May) and constitutes a large part of your overall Q2 grade in this classroom.
The lab report is graded by merits of the five aspects and will be worth a total of 48 points.
Personal Engagement Show evidence of your commitment and dedication to solving your research question.
+2 Points (8%)
Exploration Provide a well-designed lab complete with background research and focus on controls.
+6 Points (25%)
Analysis Processing data in a table(s) and graph(s) as well as use of appropriate statistics to support a conclusion.
+6 Points (25%)
Evaluation Concluding and discussing your data based on your research question and its implications to the world.
+6 Points (25%)
Communication The focus of your lab to the research question and your ability to clearly convey data, ideas and thoughts to readers.
+4 Points (17%)
Total +24 Points (100%) *Everything will be doubled for your 3rd quarter grade, making 48 points total.
Requirements of the IA Lab Report:
i. Must be typed in 12 point font in a legible, professional font (no comic-sans!). a. Graphs and data tables need to be created on a computer, preferably Microsoft Excel®. b. A free alternative to Microsoft Excel® is Openoffice.org of which you can download.
ii. Lab report needs to be organized in the proper format of a formal lab report. iii. All factual information must be cited and properly sourced on a separate works cited page. iv. If human volunteer subjects are used, the lab must have their signed consent sheets attached. v. Research question should be emailed to: [email protected]
Draft and Final version of IA turned in via www.turnitin.com Class ID: 13549859 Enrollment password: seniors
Responsibilities: Make sure you develop a lab that is within your abilities and time to complete. Every year some hot shot tries to go above and beyond in what they see as the “ultimate lab”, only to find that the deadline approaches and they ran out of test subjects, don’t have enough trials, ran out of money, etc. Just keep it simple and you can succeed. It is your responsibility to appreciate the meaning of academic honesty, especially authenticity and intellectual property. You are also responsible for initiating your research question on your own and developing a method to test it. Seeking help when in doubt, demonstrating independence of thought, initiative in the design and implantation of your investigation are important for you to demonstrate as a scientist and as a student. The IA is your responsibility and it is your work. Plagiarism and copying other’s work is not permissible. You must clearly distinguish between your own words and thoughts and those of others. It is preferred that you use MLA format for citing (although research biologists tend to use CSE or CMS formats).
Key Due Dates: Monday, September 26th Research Question Due (emailed) Friday, October 21st Draft Due (must bring submitted via turnitin) Thursday, November 10th Final IA Lab Report Due (hardcopy and turnitin)

2
Video tutorials on table making, graphing and statistical analysis with Microsoft Excel®
are found on my class’ YouTube Channel, McGEEmc²
https://www.youtube.com/channel/UC0Myr5ilGtyaemlZfpX1SuA
(Once I reach 1,000 subscribers, I can make it a custom URL link. Until then… I’m sorry.)
Not copyrighted. Feel free to distribute and modify. Dedicated to the success of the IB Biology Programme. –Todd McGee, Spring 2016
“It is the long history of humankind (and animal kind, too) those who learned to collaborate
and improvise most effectively have prevailed.” –Charles Darwin, 1859
3
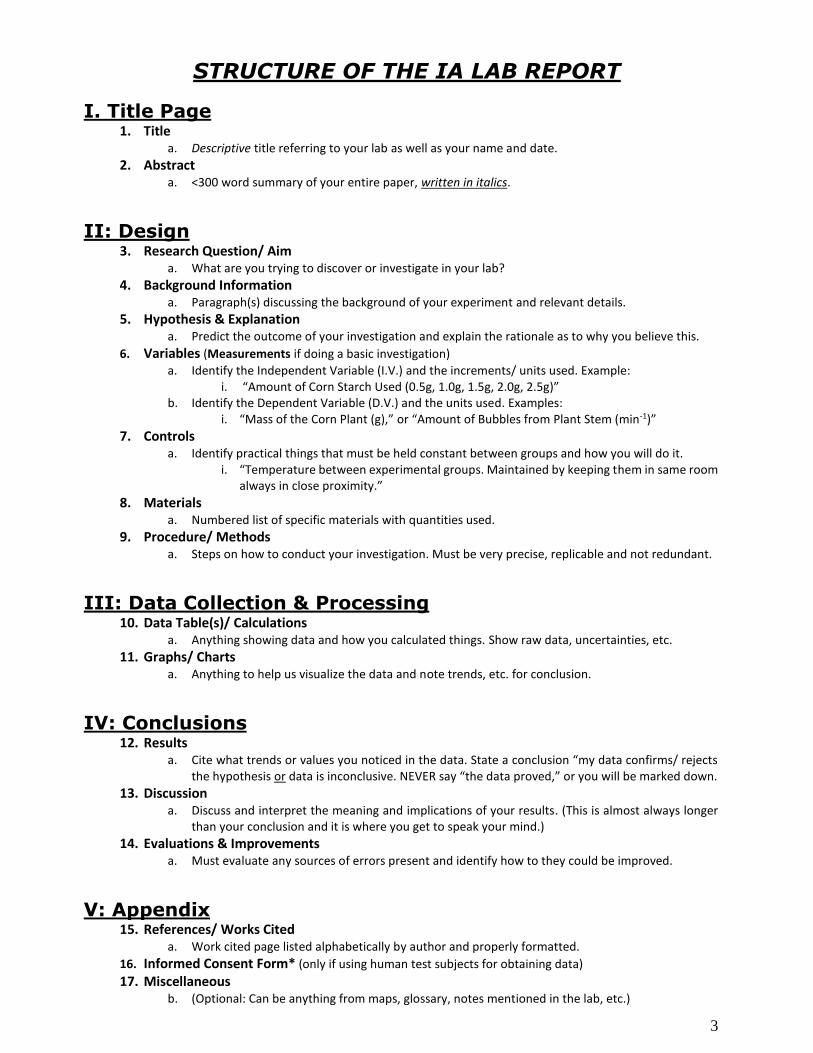
STRUCTURE OF THE IA LAB REPORT
I. Title Page 1. Title
a. Descriptive title referring to your lab as well as your name and date.
2. Abstract a. <300 word summary of your entire paper, written in italics.
II: Design
3. Research Question/ Aim a. What are you trying to discover or investigate in your lab?
4. Background Information a. Paragraph(s) discussing the background of your experiment and relevant details.
5. Hypothesis & Explanation a. Predict the outcome of your investigation and explain the rationale as to why you believe this.
6. Variables (Measurements if doing a basic investigation)
a. Identify the Independent Variable (I.V.) and the increments/ units used. Example: i. “Amount of Corn Starch Used (0.5g, 1.0g, 1.5g, 2.0g, 2.5g)”
b. Identify the Dependent Variable (D.V.) and the units used. Examples: i. “Mass of the Corn Plant (g),” or “Amount of Bubbles from Plant Stem (min-1)”
7. Controls a. Identify practical things that must be held constant between groups and how you will do it.
i. “Temperature between experimental groups. Maintained by keeping them in same room always in close proximity.”
8. Materials a. Numbered list of specific materials with quantities used.
9. Procedure/ Methods a. Steps on how to conduct your investigation. Must be very precise, replicable and not redundant.
III: Data Collection & Processing
10. Data Table(s)/ Calculations a. Anything showing data and how you calculated things. Show raw data, uncertainties, etc.
11. Graphs/ Charts a. Anything to help us visualize the data and note trends, etc. for conclusion.
IV: Conclusions
12. Results a. Cite what trends or values you noticed in the data. State a conclusion “my data confirms/ rejects
the hypothesis or data is inconclusive. NEVER say “the data proved,” or you will be marked down.
13. Discussion a. Discuss and interpret the meaning and implications of your results. (This is almost always longer
than your conclusion and it is where you get to speak your mind.)
14. Evaluations & Improvements a. Must evaluate any sources of errors present and identify how to they could be improved.
V: Appendix
15. References/ Works Cited a. Work cited page listed alphabetically by author and properly formatted.
16. Informed Consent Form* (only if using human test subjects for obtaining data)
17. Miscellaneous b. (Optional: Can be anything from maps, glossary, notes mentioned in the lab, etc.)

4
5
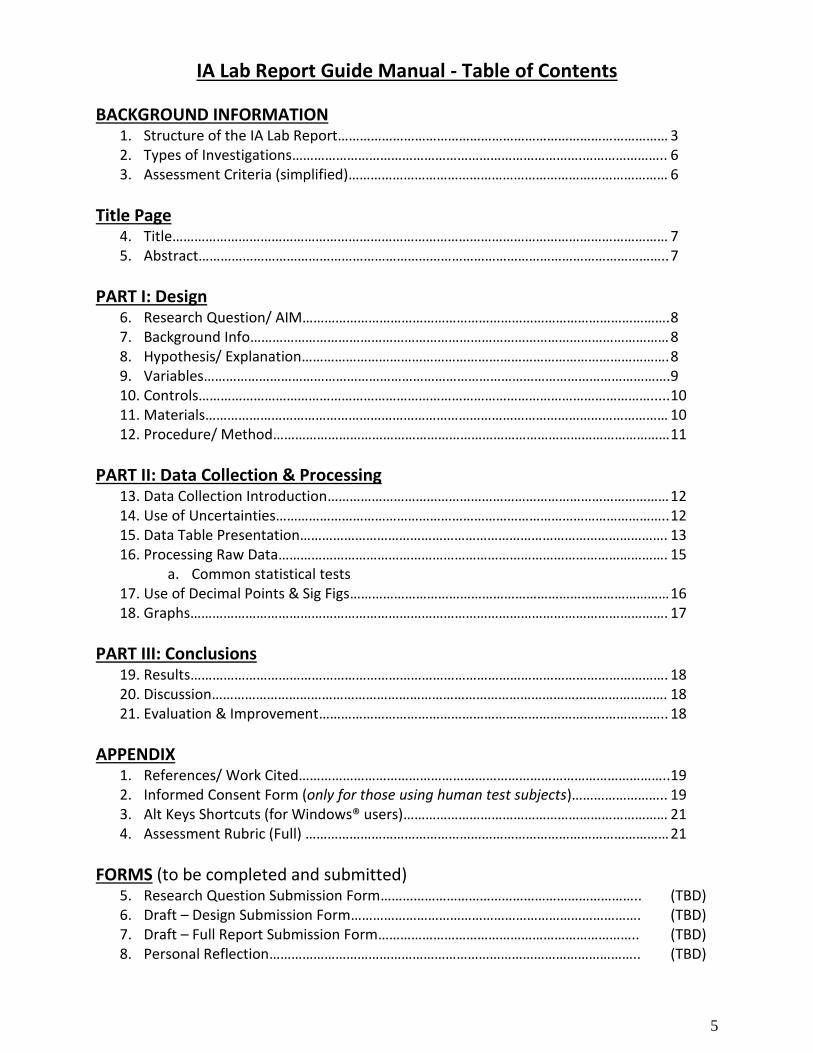
IA Lab Report Guide Manual - Table of Contents
BACKGROUND INFORMATION 1. Structure of the IA Lab Report……………………………………………………………………………… 3 2. Types of Investigations…………………………………………………………………….………………….. 6 3. Assessment Criteria (simplified)…………………………………………………………………………… 6
Title Page 4. Title……………………………………………………………………………………………………………………… 7 5. Abstract……………………………………………………………………………………………………………….. 7
PART I: Design 6. Research Question/ AIM………………………………………………………………………………………. 8 7. Background Info…………………………………………………………………………………………………… 8 8. Hypothesis/ Explanation………………………………………………………………………………………. 8 9. Variables……………………………………………………………………………………………………………….9 10. Controls……………………………………………………………………………………………………………..... 10 11. Materials……………………………………………………………………………………………………………… 10 12. Procedure/ Method……………………………………………………………………………………………… 11
PART II: Data Collection & Processing 13. Data Collection Introduction………………………………………………………………………………… 12 14. Use of Uncertainties…………………………………………………………………………………………….. 12 15. Data Table Presentation………………………………………………………………………………………. 13 16. Processing Raw Data……………………………………………………………………………………………. 15
a. Common statistical tests 17. Use of Decimal Points & Sig Figs…………………………………………………………………………… 16 18. Graphs…………………………………………………………………………………………………………………. 17
PART III: Conclusions 19. Results…………………………………………………………………………………………………………………. 18 20. Discussion……………………………………………………………………………………………………………. 18 21. Evaluation & Improvement………………………………………………………………………………….. 18
APPENDIX 1. References/ Work Cited………………………………………………………………………………………..19 2. Informed Consent Form (only for those using human test subjects)…………………….. 19 3. Alt Keys Shortcuts (for Windows® users)……………………………………………………………… 21 4. Assessment Rubric (Full) ……………………………………………………………………………………… 21
FORMS (to be completed and submitted) 5. Research Question Submission Form…………………………………………………………….. (TBD) 6. Draft – Design Submission Form……………………………………………………………………. (TBD) 7. Draft – Full Report Submission Form…………………………………………………………….. (TBD) 8. Personal Reflection……………………………………………………………………………………….. (TBD)
6
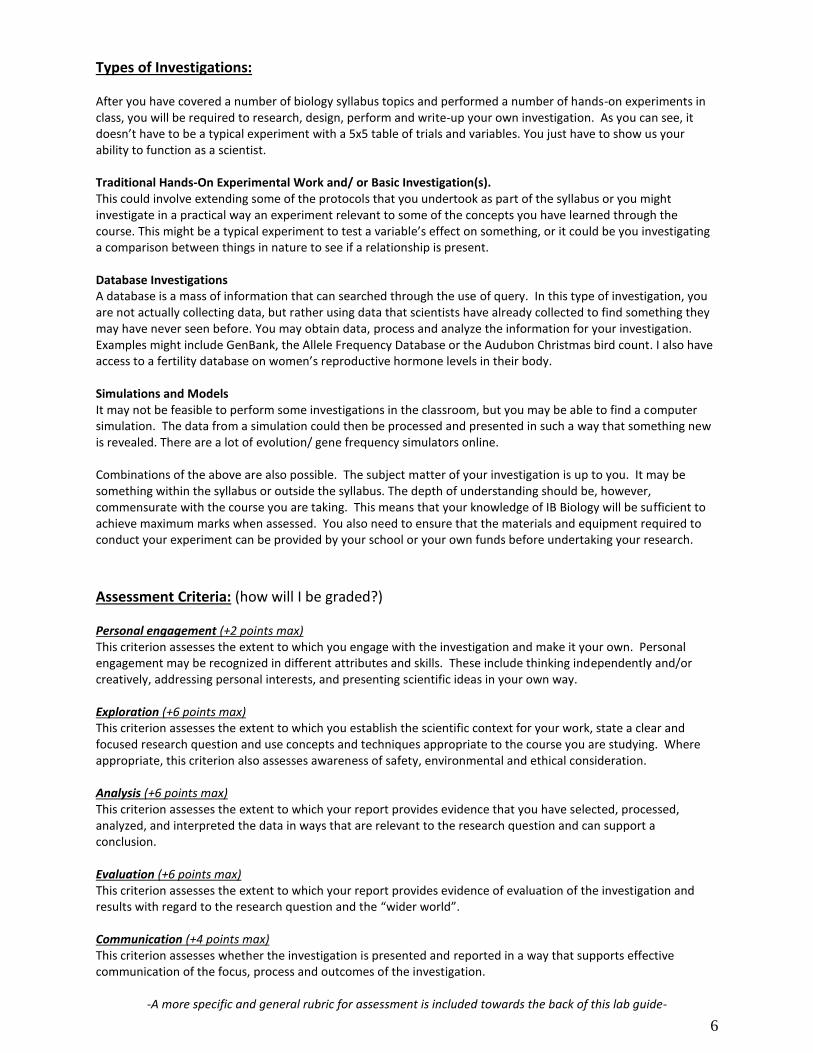
Types of Investigations: After you have covered a number of biology syllabus topics and performed a number of hands-on experiments in class, you will be required to research, design, perform and write-up your own investigation. As you can see, it doesn’t have to be a typical experiment with a 5x5 table of trials and variables. You just have to show us your ability to function as a scientist. Traditional Hands-On Experimental Work and/ or Basic Investigation(s). This could involve extending some of the protocols that you undertook as part of the syllabus or you might investigate in a practical way an experiment relevant to some of the concepts you have learned through the course. This might be a typical experiment to test a variable’s effect on something, or it could be you investigating a comparison between things in nature to see if a relationship is present. Database Investigations A database is a mass of information that can searched through the use of query. In this type of investigation, you are not actually collecting data, but rather using data that scientists have already collected to find something they may have never seen before. You may obtain data, process and analyze the information for your investigation. Examples might include GenBank, the Allele Frequency Database or the Audubon Christmas bird count. I also have access to a fertility database on women’s reproductive hormone levels in their body. Simulations and Models It may not be feasible to perform some investigations in the classroom, but you may be able to find a computer simulation. The data from a simulation could then be processed and presented in such a way that something new is revealed. There are a lot of evolution/ gene frequency simulators online. Combinations of the above are also possible. The subject matter of your investigation is up to you. It may be something within the syllabus or outside the syllabus. The depth of understanding should be, however, commensurate with the course you are taking. This means that your knowledge of IB Biology will be sufficient to achieve maximum marks when assessed. You also need to ensure that the materials and equipment required to conduct your experiment can be provided by your school or your own funds before undertaking your research.
Assessment Criteria: (how will I be graded?) Personal engagement (+2 points max) This criterion assesses the extent to which you engage with the investigation and make it your own. Personal engagement may be recognized in different attributes and skills. These include thinking independently and/or creatively, addressing personal interests, and presenting scientific ideas in your own way. Exploration (+6 points max) This criterion assesses the extent to which you establish the scientific context for your work, state a clear and focused research question and use concepts and techniques appropriate to the course you are studying. Where appropriate, this criterion also assesses awareness of safety, environmental and ethical consideration. Analysis (+6 points max) This criterion assesses the extent to which your report provides evidence that you have selected, processed, analyzed, and interpreted the data in ways that are relevant to the research question and can support a conclusion. Evaluation (+6 points max) This criterion assesses the extent to which your report provides evidence of evaluation of the investigation and results with regard to the research question and the “wider world”. Communication (+4 points max) This criterion assesses whether the investigation is presented and reported in a way that supports effective communication of the focus, process and outcomes of the investigation.
-A more specific and general rubric for assessment is included towards the back of this lab guide-

7
_______________I. Title Page_______________
Create a catchy title page to generate interest. If you are going to use a graphing, make sure it is nice, professional and presentable. Examine some sample scholarly research articles on my website or online to see how their title pages appear. They usually appear very simplistic.
Title: Make sure you develop a title for your lab that represents what is being studied. The title must be descriptive and informative as to the purpose of the study.
a. GOOD IDEA: (These are informative titles) i. “An Investigation into the Movements of Drosophila melanogaster as a Function
of Temperature in its Environment.” ii. The Effect of Heart Rate on Blood Pressure in Homo sapiens.
b. BAD IDEA: (These are NOT descriptive titles!) i. “My Corn Lab”
ii. “A Study of Microorganisms”
Abstract: An abstract is simply a short essay of less than 300 words that summarizes your entire paper. An abstract is ALWAYS at the front of a research paper. Professional journals always publish an abstract of a scholarly lab report, even if they don’t allow you to view the actual lab if you are not a subscriber. Don’t overthink this; just summarize your lab report. Think of it as something that one could view if they didn’t have the time to read your entire lab. The abstract must be written in italics and printed at the bottom of the title page. It must FIT the title page! You may adjust the font between 10-12 to make it fit but keep the abstract single-spaced!
8
_______________II: DESIGN_______________
I. Research Question/ Aim State a question which summarizes the objective of your research. This section can be vague as its goal is simply to identify the overall problem, but make sure it clearly identifies your independent variable and dependent variable!
a. Example: “This investigation is to find out how (IV) affects the (DV).” b. Example: “What is the effect of (IV) on the (DV)?” c. Example: “What is the effect of a changing glucose concentration on cell respiration in yeast?” d. Example: “How do different solvents compare in their ability to dissolve organic plant pigments?”
II. Background Information Here is where you want to discuss and summarize your experiment before doing it as well as provide any relevant information pertaining to your study. This page will provide much evidence for your depth in personal engagement and exploration into your topic (two aspects of your grade). This should ideally be detailed, but concise. It doesn’t necessarily have to be over a page unless you have a lot of background to report. The more the better, as long as it is relevant to your topic and research question. Do not just carry on about irrelevant stuff to make it look full, otherwise, it doesn’t show your ability to stay on topic to solve a problem. Some things the experimenter should consider but not limit themselves to when writing up their background info:
The name of the species being used, including its binomial/ scientific name.
Background information on the species being experimented.
Consideration of the ethics of your experiment (tolerances of the species, use of consent forms, etc.)
Prior research into the possible outcomes of the experiment possibly derived from scholarly studies in journals.
If a measurement of a dependent variable is indirect or unclear, explain the connection. o (Measuring dissolved O2 in water as a result of light intensity on plants.)
Make sure all external information which is not your own ideas or knowledge is cited properly and recorded in a works cited page. Information that is not your own which isn’t cited is considered plagiarism, per IB policy.
III. Hypothesis & Explanation A hypothesis is simply a phrase for the expected outcome of an experiment. What do you think will happen? Make sure your hypothesis is clear in describing a trend expected. For example, a good, specific hypothesis which clearly identifies the IV and DV should be phrased, “Increasing the amount of glucose in the water should cause an increase in dissolved oxygen in the water”. Also, if you believe there to be a limit to growth, then state that as well in your hypothesis. An example: “Increasing light intensity on Acer acae will cause it to increase in rates of photosynthesis, but only to a certain point to which it would be expected to remain relatively stable.”
9
A hypothesis should NOT be phrased, “putting sugar in the water will cause there to be oxygen.” Notice this does not specify what kind of sugar is being used, does not specify that we are measuring dissolved oxygen in water and does not identify that increasing one should increase/ decrease the amount of the other. Remember, a hypothesis is just a guess to see if your ideas have predictive power. That is the strength that science gives us. Therefore, your hypothesis must have a basis; there is a reason for thinking that a certain IV will have an impact on the DV. Your hypothesis should have a written explanation as to why you believe it to be true, and it should have some connection to your background knowledge on the topic.
Do not just make up something bizarre in which you have no basis for thinking there is a link! (ex. putting nail polish on toes causes hemorrhoids.)
A good example of a hypothesis & explanation: “Increasing the amount of the glucose should cause and increase in the amount of CO2 produced, but only to a certain point at which the rate should level off. This is because glucose is used by yeast to make ATP through cellular respiration. The more glucose that is available, the faster the rate of cell respiration, and the more C02 that should be measurably produced. C02 is a product of cell respiration in yeast, so the more C02 the faster the rate of cell respiration. However, since the rate of cell respiration is proportional to the amount of factors such as enzyme and mitochondrial availability, which has a limit, one would expect the rate of CO2 production to level off.”
IV. Variables (FOR CLASSIC EXPERIMENTS ONLY! See notes below) Identify the correct independent and dependent variable, as well as variables that need to be controlled. For the independent variable, you need to include units and the size/ amount of increments being utilized. For example: Independent Variable (IV): The variable that you are adding to the test subjects.
Glucose (0.0g, 2.0g, 4.0g, 6.0g)
Dependent Variable (DV): The variable that changes as a result of the IV – basically, it’s what you are measuring.
CO2 concentration (ppm)
Rate of movement (cm/min) NOTE: Identifying an IV and DV is only possible if you are doing a typical experiment (where you are adding a variable and measuring the outcome, such as adding salt to measure plant height). If you are doing a basic investigation, especially if you are investigating relationships between collected data (usually a correlation study), you will have no variables! In this case, this section should be titled something like “Measurements” instead of “Variables.” Identify all things being measured. An example is if a study was conducted comparing leaf size to different aspects of a tree size, such as circumference and canopy spread; there would be no IV or DV possible as it is not an experiment you are conducting. Instead, you would need to identify here all things being measured and in what units measured. Example: Leaf Width (cm), Leaf Length (cm), Trunk Circumference (cm), Canopy Spread (m).
10
V. Controls You also must identify controlled variables (things that must be stable between experimental groups). Then, you must explicitly indicate how each controlled variable is going to be controlled. If you can’t actively control a variable then your method/ procedure should include a means of monitoring it. You must identify as many controlled variables as are necessary to eliminate as many sources of systematic errors as possible! Examples: Controlled Variables:
Temperature of the air – Plants will be held at room temperature, which is set to 22˚C.
Salinity of the water – All fish will be given water from the same faucet, which will have the same salinity concentration as it is homogenous.
Probe calibration – The same probe between measurements to ensure that the measurements are all consistent.
This is just a short list. Controls are one of the most important aspects of your lab report. A good scientist is aware of things that may affect his/ her results and makes every effort to control them. If you find some things are impossible to fully control, then you are in good company. Not all things are PRACTICAL. Your task is to identify all things that are practical to control and to develop a method to control them. If something is not practical due to budget constraints, etc., then you still need to at least be aware of them and discuss them in your evaluation section at the end of your lab report.
An example is that of Dr. Clare Patterson, who first calculated the age of the earth in the 1950’s. To do this, he needed to know the ratio of uranium-to-lead in meteorite rocks. However, he found his measurements of lead to be wildly inconsistent, due to lead contamination in the atmosphere by leaded gasoline used by cars of the time. His measurements were giving him estimated dates no better than 10 ± 10 billion years. It took him two years and millions of dollars to develop the world’s first ultra-clean room. Only then, with space-age suits and filtered air could he measure the true amount of lead in rocks. He finally was able to get consistent numbers in all the rocks he measured, giving earth an age of 4.5 billion years old with a precision of ± 0.5 billion years. However, without millions of dollars and facilities for him to use, he would’ve never been able to improve his measurements.
Do what you can within your abilities. If you can’t get the best precision due to practicality, at least identify things inhibiting you and declare what it would take for future scientists with more funding (maybe someone will like your work enough and give you a large grant so you can continue; that is what Patterson did).
VI. Materials You are to include a NUMBERED, specific list of materials needed for your experiment. This shows the essence of a well-planned design. If you need something extra that you didn’t put on your list you won’t receive full credit. Make sure when writing up your equipment list that you include:
• The amount of anything requiring more than one (ex. “Scissors, x2” or “Glue sick, x5”) • The concentration and/ or amount of chemicals (ex. “hydrochloric acid, 2.0 M” or “magnesium, 0.50g”). • The amount of each solution needed total (ex. “Coca-Cola®, 200mL”)
For all measuring equipment/ probes, you must include the precision/ uncertainty of the device! Example: Electronic balance (±0.01g); 300ml Beaker (±2ml); Analogue thermometer (±0.5°C)
Trivial things such as small plastic cups can just be called such if their capacity isn’t as important. It won’t be necessary to measure their capacity as long as it isn’t vital to the precision of the lab.
11
VII. Procedure/ Methods Think about how to make a peanut butter and jelly sandwich. It is simple, but if you want to standardize and want others to make it almost exactly the same, it could be 1,000 steps long. The more steps, the more replicable it will be and the more precise. However, keep in mind many things are redundant and some steps can be combined. Do not include redundant steps in your methods such as “collect and put on safety equipment,” or “clean up bench and return apparatus to the trolley.” You want the shortest procedure possible, yet having enough detail to control enough aspects for replicability and precision. Example:
1. “In a 300ml beaker, add 0.5g Mg to 200ml of 2M HCl.
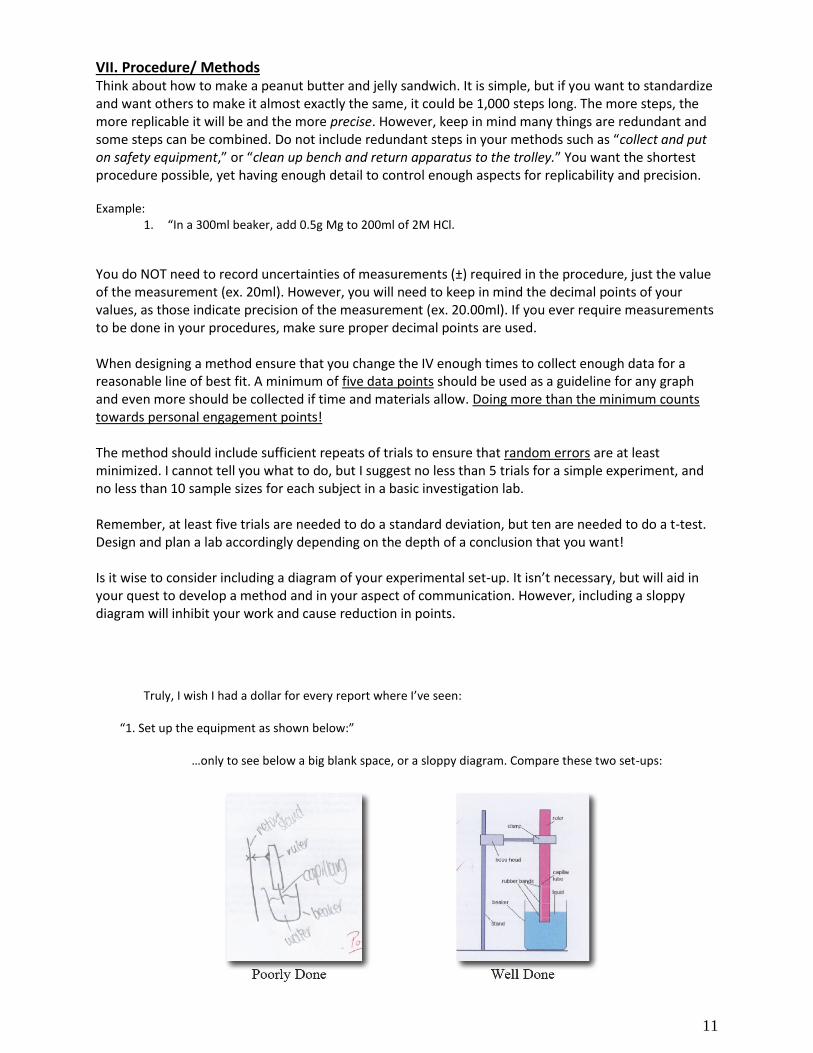
You do NOT need to record uncertainties of measurements (±) required in the procedure, just the value of the measurement (ex. 20ml). However, you will need to keep in mind the decimal points of your values, as those indicate precision of the measurement (ex. 20.00ml). If you ever require measurements to be done in your procedures, make sure proper decimal points are used. When designing a method ensure that you change the IV enough times to collect enough data for a reasonable line of best fit. A minimum of five data points should be used as a guideline for any graph and even more should be collected if time and materials allow. Doing more than the minimum counts towards personal engagement points! The method should include sufficient repeats of trials to ensure that random errors are at least minimized. I cannot tell you what to do, but I suggest no less than 5 trials for a simple experiment, and no less than 10 sample sizes for each subject in a basic investigation lab. Remember, at least five trials are needed to do a standard deviation, but ten are needed to do a t-test. Design and plan a lab accordingly depending on the depth of a conclusion that you want! Is it wise to consider including a diagram of your experimental set-up. It isn’t necessary, but will aid in your quest to develop a method and in your aspect of communication. However, including a sloppy diagram will inhibit your work and cause reduction in points.
Truly, I wish I had a dollar for every report where I’ve seen: “1. Set up the equipment as shown below:”
…only to see below a big blank space, or a sloppy diagram. Compare these two set-ups:

12
__________ III: DATA COLLECTION & PROCESSING_________ I. Data Table(s) & Calculations Make sure you record all of your raw data collected from subjects. Raw data and processed data can be in the same table, but make sure you have them titled appropriately. Qualitative data should also be included in this region. Make sure to include proper units of measurement, uncertainties of measurements and proper use of decimal points/ significant figures. Video manuals on table making, statistics and graphing on Microsoft Excel® are found on my class’ YouTube Channel, McGEEmc²
https://www.youtube.com/channel/UC0Myr5ilGtyaemlZfpX1SuA
Use of Uncertainties: The uncertainty for a measuring device (ex. ±0.5g) determines the precision in its measuring capability. You could always look at the apparatus’ instructions or on the device, as often they have it printed somewhere. If not, you can still determine the uncertainty. There are specific rules to follow:
Analogue Instruments:
1. Find the increments of measurement used for lowest resolution (ex. each tiny line on a ruler is 1mm).
2. Generally, on an analogue device, your uncertainty is HALF your lowest resolution (ex. 0.5mm).
3. An exception (used often): If the resolution lines are far enough apart that you can ACCURATELY estimate between the lines, then you can to determine the uncertainty. You simply choose the lowest resolution that you think most people would also agree with. In this case, don’t half the estimated uncertainty value as we did above.
a. Ex. This ruler is the same as above, but with increments of resolution of 0.5cm, far less precise than before. The new uncertainty would normally be ±0.25cm as it is half the lowest resolution. However, because our resolution is so low that we can easily estimate between the lines down to 0.1cm (1mm), we can therefore use that as the resolution; we do not use half of it as before.
Digital Instruments: 1. Examine the device itself or the manual for a printed uncertainty. 2. If you can’t find anything printed, then examine how the numbers move when the device is
used. Assume the lowest values are the uncertainty. a. (Ex. A digital thermometer moves in increments of 1°C. Therefore, assume uncertainty is ±1°C.)
The lowest resolution of this ruler is in increments of 0.1cm. Therefore, our uncertainty, being half of that is ±0.05mm.
If this thermometer skipped by units of 2°C, then we’d assume the uncertainty is ±2°C. In most cases, digital instruments are ±1.
The lowest resolution of this ruler is poor; we can however estimate the resolution accurately to ±0.1cm.
13
Ultimately, the scientist gets the final say as to the uncertainty of the measuring device. Think about it! If you have a stopwatch, regardless of the precision, you may not be able to accurately rely on your reaction for a person crossing a finishing line as it occurs too fast. A stopwatch with a precision of ±0.000001s does you no good without high-speed cameras. In certain situations when the published uncertainty is untrustworthy, use your best judgement as a scientist. Determine an uncertainty to which you are most certain, even if it is a large uncertainty.
Often when I do breath-holding labs, I have students record to uncertainties of ±3, as it is impossible to determine the exact moment a student inhaled and began holding their breath.
Another example is when students watch colored dye diffusing in a beaker of water. It may be hard to easily visualize the colored dye reaching equilibrium, so if students time it they may determine they are comfortable with lower uncertainty of ±30s.
My class CO2 probes have an uncertainty printed on the package as ±2ppm. However, they seem to fluctuate wildly in values even in a stable climate jar. Therefore, I tell students that I don’t trust the printed number and to estimate an uncertainty of ±50ppm, which is based on observed random fluctuations. It’s not exactly precise, but it’s honest science.
Remember, as a scientist, you get the final say as to the uncertainty. Except in rare circumstances, all measurements taken must have uncertainties indicated!!!
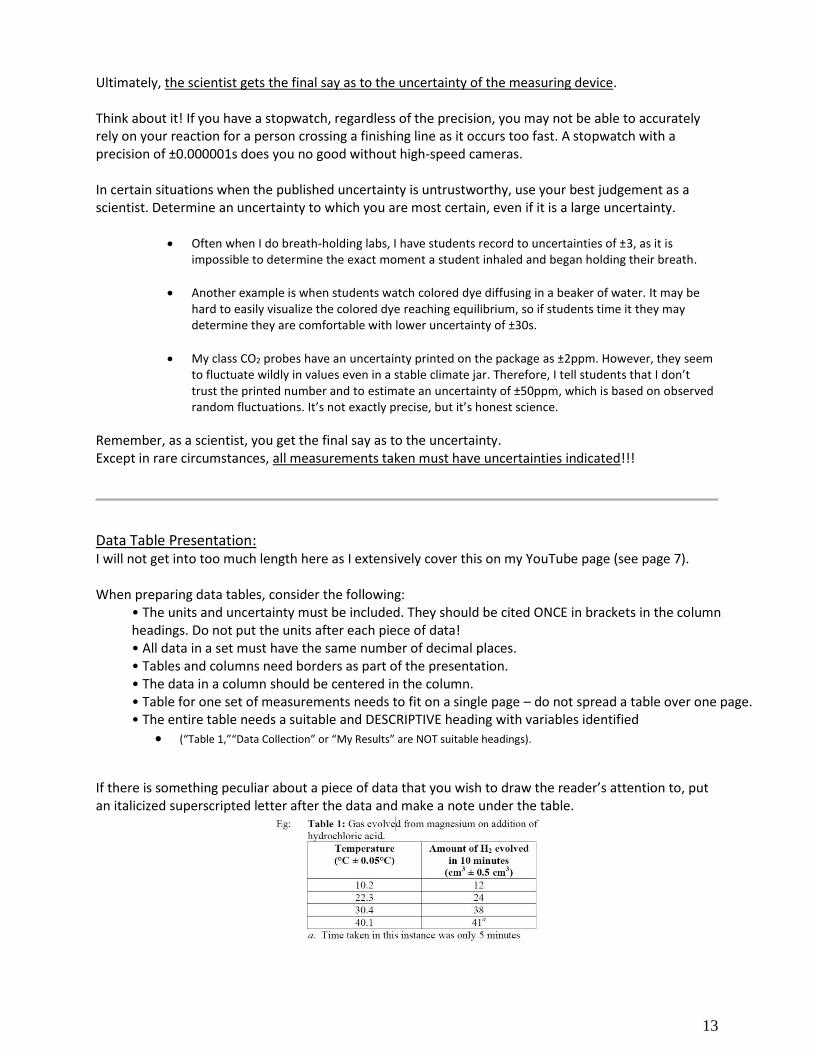
Data Table Presentation: I will not get into too much length here as I extensively cover this on my YouTube page (see page 7). When preparing data tables, consider the following:
• The units and uncertainty must be included. They should be cited ONCE in brackets in the column headings. Do not put the units after each piece of data! • All data in a set must have the same number of decimal places. • Tables and columns need borders as part of the presentation. • The data in a column should be centered in the column. • Table for one set of measurements needs to fit on a single page – do not spread a table over one page. • The entire table needs a suitable and DESCRIPTIVE heading with variables identified
(“Table 1,”“Data Collection” or “My Results” are NOT suitable headings).
If there is something peculiar about a piece of data that you wish to draw the reader’s attention to, put an italicized superscripted letter after the data and make a note under the table.
14
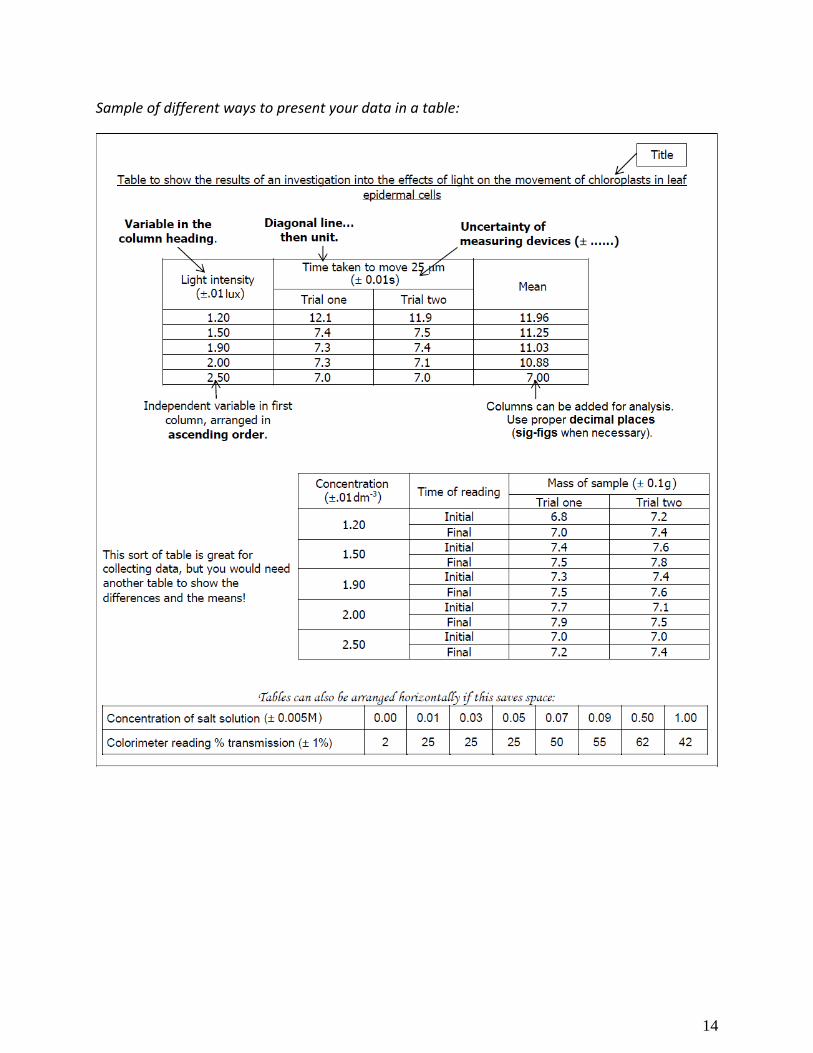
Sample of different ways to present your data in a table:
15
Processing of Raw Data: Processing is often included with the tables, but many times you may find it better to put some analysis off to the side. Make sure you have it presented nicely regardless of what you do as nobody likes having to hunt through tons of calculations to find final results. Presentation is important as well as how you process your data. Processing involves taking raw data and trying to squeeze information out of it to tell us something. No book could ever tell you what to do; you instead need to be familiar with the types of statistics available and need to know when to appropriately use them.
Common Processing Tools to Analyze Data:
MEAN (almost always included in table): Average of a group of numbers
MEDIAN and/ or MODE: The middle value in data and the most frequently occurring value in a group.
STANDARD DEVIATION (σ) (likewise, usually in table): Represents the spread of data from the mean. Used to identify outliers and “normal” groups. Generally requires no less than five sets of data to calculate.
DELTA (Δ): Indicating a measurement from an initial-final value; a way to measure change or difference.
STUDENT’s T-TEST: Use to determine significance between two sets of data in the form of a p-value. Anything below p=0.05 indicates a significant difference, that there is a 5% probability of randomness and 95% chance the difference isn’t random and that something is taking place. T-tests usually require no less than 10 sets of data in a group to be accurate.
COEFFICIENT OF DETERMINATION (r²): Can be used to calculate correlations between two sets of data. Determines how well data fits into your model and is great in determining the viability of a hypothesis. r²=1 is a perfect model (never happens) where all data fits perfectly on a trendline. r²=0 is complete randomness and no predictability is possible. Negative values with r² indicate the trend is downward. Generally, it is accepted that r²=0.7 is a strong correlation, r²=0.5 is a weak correlation, and anything below r²=0.3 indicates almost no correlation.
CHI-SQUARED (X²) TEST: Used to measure randomness between a set of data’s observed and expected outcomes. A calculation is made, and that is compared to the table of critical values. Like a t-test, a p-value will be given and tell you if your data is most likely random, or significant. Chi-Square Tests are handy in genetics, when you can predict the expected outcome of a test cross and compare that value to your actual test cross to see if your outcome fit your expected model.
TRENDLINE & SLOPE EQUATION: Unlike the previous tools, trendline are created on graphs and represent a line-of-best-fit for the data. The slope of the line can be presented in an equation (such as y=ax+b). Microsoft Excel® can automatically do this for you if you select “equation” while making a trendline. Regardless, having a slope equation shows data processing. You can use this equation later in your results/ discussion to talk about your scientific model and compare it with your r² value to demonstrate the precision of your model.
All experiments between students will be different. Some labs may require all of these processing tools to make a viable conclusion, some only a few. It is up to you to determine which processing tools may be needed and to calculate them correctly. The more processing you do (if it can be used), the better explanation you can give with your conclusion later.
When calculating by hand, do not use rounded off values in further calculations. Carry through all the decimal places on your calculator and round off decimal places only on the final number. Using rounded off values can lead to final answers that are out by a decimal place or more.
16
Use headings where possible to explain what section or step of the calculation you are doing.
If preparing your reports on a word processor make sure you subscript (A2) and superscript (A2) characters where necessary.
Make sure that when you process some data that you make an attempt to cite the value when writing and discussing your conclusion later! What good are statistics if you don’t use them to support your claims?
Use of Decimal Points/ Sig-Figs: Both are used to indicate the level of precision in measurement. Decimal points are kept when you calculate something and the numbers are relatively the same number in a different form and can be compared to the raw data, such as when adding, subtracting, multiplying or dividing. When calculating something, add one more decimal point than the raw data with the least precision. When the number completely converts and can’t be compared to raw data, such as when using standard deviation, t-testing, chi-square testing, etc., then it is necessary to use sig-figs. Keep the number of sig-figs the same as the number of sig figs in the raw data with the lowest precision.
II. Graphs Graphing is an important aspect in communication as well as analysis. Be sure to make your graph precise enough to cite example data in your results and discussion section. IB does not require graphs to be made via computer, but does require them to exhibit precision and detail. That being said, if you hand draw them, they must be clean and exact. Use a ruler where necessary. Make sure your pencil tip is sharpened and the data points are small. I will not explain here how to make a graph – see page 7 for my YouTube channel link where I cover this extensively. The design of your graphs will be different depending on the type of lab you do. It is your responsibility to understand different graphing options and to which type is appropriate for which situation.
• Bar graphs ONLY for simple, categorical data (boys vs girls; age 10-15, age 15-20, etc.) • Scatterplots for showing a trend in the data, usually for data where the X axis is increasing in value. • Pie charts are good as a complimentary, not primary graph. Good for showing simple comparisons.
Ensure the following are in your graph (if necessary, as some graphs might not require all):
• Graph needs descriptive title which identifies what is being measured. • Both the X and Y-axis need to be labeled (descriptive title or heading). • Both the X and Y-axis include units of measurements and uncertainties where necessary. • Both the X and Y-axis are scaled appropriately so the data fills the graph well. -If your data ranges from 600 to 800, don’t start your graph at 0.
-If data is spread from 0-1,000 units, increasing labeled increments by 1 would be inappropriate; units of 100 is much better. -Consider a logarithmic scale for one axis if the data accelerates too quickly (bacterial colony size after 20 days in sugar broth).
• Data points are small and precisely located. • When necessary, include error bars indicating the standard deviation for each data point. • A trendline (line-of-best-fit) is included to show the trend in data. (NEVER “connect the dots!”) -Determine if a linear or curved/ polynomial trendline is necessary.
• Calculate the slope of the trendline to get an equation. Microsoft Excel® does this automatically • Calculate the r²-value of the data to the trendline. Again, Microsoft Excel® does this automatically • Make sure a graph is sized and fits on one page! (You’d be surprised how much I’ve dealt with this.)
17
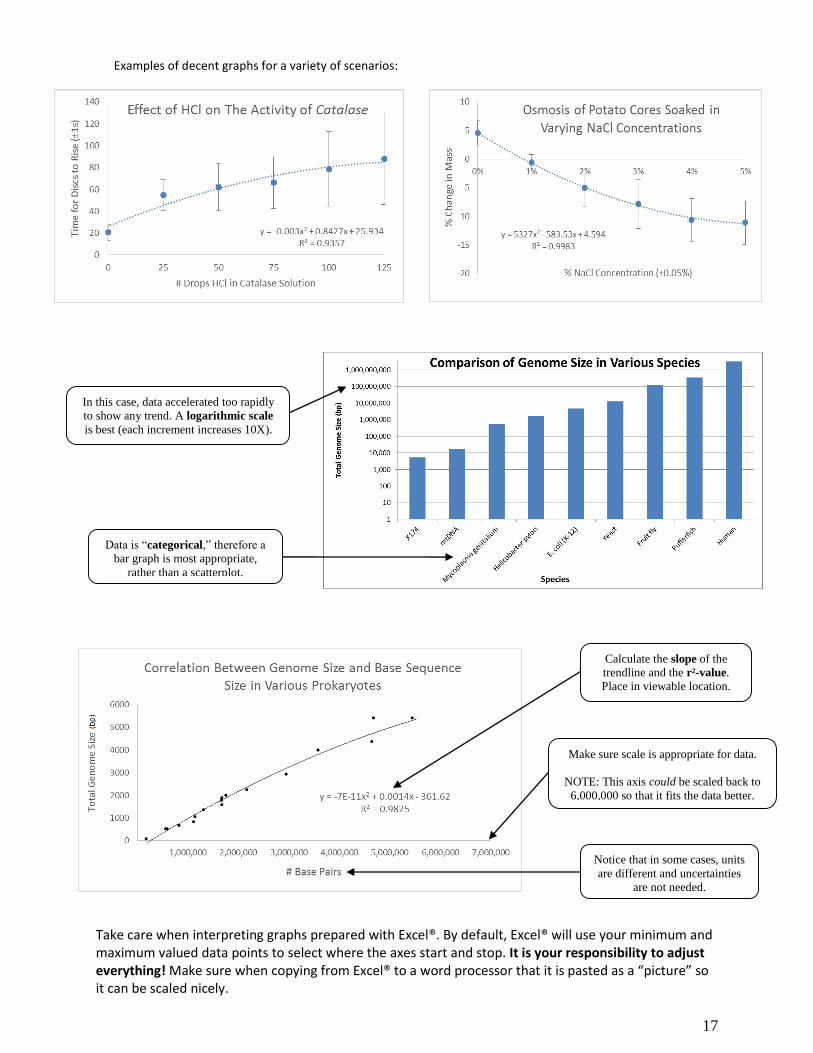
Examples of decent graphs for a variety of scenarios:
Take care when interpreting graphs prepared with Excel®. By default, Excel® will use your minimum and maximum valued data points to select where the axes start and stop. It is your responsibility to adjust everything! Make sure when copying from Excel® to a word processor that it is pasted as a “picture” so it can be scaled nicely.
Notice that in some cases, units
are different and uncertainties
are not needed.
Calculate the slope of the
trendline and the r²-value.
Place in viewable location.
In this case, data accelerated too rapidly
to show any trend. A logarithmic scale
is best (each increment increases 10X).
Data is “categorical,” therefore a
bar graph is most appropriate,
rather than a scatterplot.
Make sure scale is appropriate for data.
NOTE: This axis could be scaled back to
6,000,000 so that it fits the data better.
18
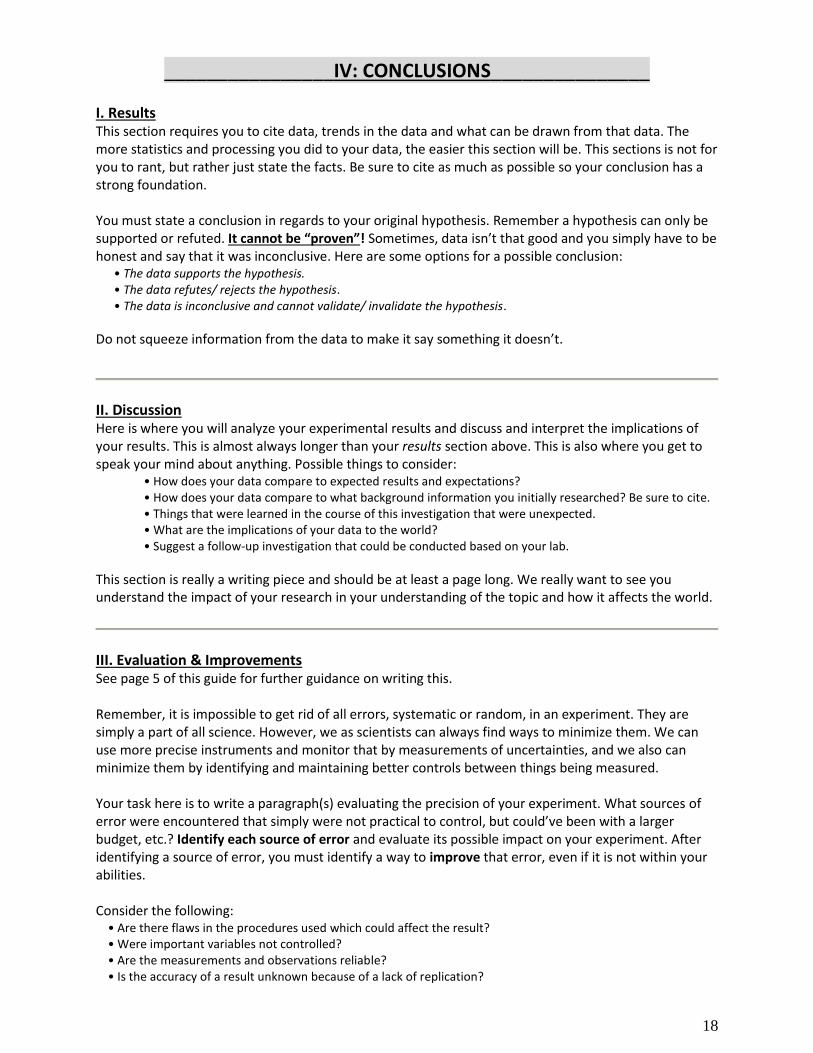
________________IV: CONCLUSIONS_______________
I. Results This section requires you to cite data, trends in the data and what can be drawn from that data. The more statistics and processing you did to your data, the easier this section will be. This sections is not for you to rant, but rather just state the facts. Be sure to cite as much as possible so your conclusion has a strong foundation. You must state a conclusion in regards to your original hypothesis. Remember a hypothesis can only be supported or refuted. It cannot be “proven”! Sometimes, data isn’t that good and you simply have to be honest and say that it was inconclusive. Here are some options for a possible conclusion:
• The data supports the hypothesis. • The data refutes/ rejects the hypothesis. • The data is inconclusive and cannot validate/ invalidate the hypothesis.
Do not squeeze information from the data to make it say something it doesn’t.
II. Discussion Here is where you will analyze your experimental results and discuss and interpret the implications of your results. This is almost always longer than your results section above. This is also where you get to speak your mind about anything. Possible things to consider:
• How does your data compare to expected results and expectations? • How does your data compare to what background information you initially researched? Be sure to cite. • Things that were learned in the course of this investigation that were unexpected. • What are the implications of your data to the world? • Suggest a follow-up investigation that could be conducted based on your lab.
This section is really a writing piece and should be at least a page long. We really want to see you understand the impact of your research in your understanding of the topic and how it affects the world.
III. Evaluation & Improvements See page 5 of this guide for further guidance on writing this. Remember, it is impossible to get rid of all errors, systematic or random, in an experiment. They are simply a part of all science. However, we as scientists can always find ways to minimize them. We can use more precise instruments and monitor that by measurements of uncertainties, and we also can minimize them by identifying and maintaining better controls between things being measured. Your task here is to write a paragraph(s) evaluating the precision of your experiment. What sources of error were encountered that simply were not practical to control, but could’ve been with a larger budget, etc.? Identify each source of error and evaluate its possible impact on your experiment. After identifying a source of error, you must identify a way to improve that error, even if it is not within your abilities. Consider the following:
• Are there flaws in the procedures used which could affect the result? • Were important variables not controlled? • Are the measurements and observations reliable? • Is the accuracy of a result unknown because of a lack of replication?

19
• What assumptions are being made?
Some of the biggest issues I find when grading IA’s are students who simply write “do more trials,” or “take more time to collect data,” and even “be more careful when measuring.” These are not sources of error as much as they are issues with your design and planning. They will not count for credit as they do not show me that you have a fundamental understanding of experimental error and controlling it. If it helps, you can use the following table to help you organize writing this section:
1. Weaknesses/ sources of error. 2. Impact of the error on the experiment. 3. Suggestions for improvements to reduce or get rid of the impact of the error.
________________V: Appendix_______________
References/ Works Cited Page If you use someone else's ideas in your report, you need to acknowledge them. This includes use of in-text references and a works citied page. All cited information needs to be alphabetized when listed in works cited page. Websites, such as easybib.com (there are many others) make this very easy to do.
In-Text Referencing Your Experiments: Any information you use in your essay to support your ideas must be referenced within your actual writing. To do this, simply insert appropriate information (usually the author - page number or year) in parentheses after the words or ideas taken from another source. Place them where a pause would naturally occur to avoid disrupting the flow of your writing (usually at the end of a sentence).This then links to the full details of these sources found in the works cited/ bibliography section at the end of your essay. There are two methods on how to do this:
1. USING PARENTHESES: You need to provide the author’s name (if known) and year in parenthesis at the end of your sentence if you do not identify the author in your text: e.g. It is recommended that the U.S. government develop a new foreign policy to help Third World Countries overcome poverty and hunger (Spitzer 2002) If you do not know the author, use the title (shortened if necessary): e.g. It is recommended that the U.S. government develop a new foreign policy to help Third World Countries overcome poverty and hunger (‘No Need for Hunger’ 2002)
2. No Use of Parentheses: You do not need a parenthetical reference if you identify the author in your text. (See the first entry below.)
WITH AUTHOR IN TEXT (This is the preferred way of citing a complete work.) e.g. In ‘No Need for Hunger’, Robert Spitzer recommends that the U.S. government develop a new foreign policy to help Third World countries overcome poverty and hunger. WITHOUT AUTHOR IN TEXT e.g. ‘No Need for Hunger’ recommends that the U.S. government develop a new foreign policy to help Third World countries overcome poverty and hunger (Spitzer).
Informed Consent Form* This is only necessary if using human test subjects for collecting your data. This counts towards the aspect of exploration and shows that you are aware and understand the implications of ethical issues in conducting an experiment. You must have each human subject complete a consent form. However, a sample consent form must be completed and attached in the appendix of your completed IA lab report. The template is attached on the next page. My website has a .docx (Word®) file with this template that can be edited. Complete it and attach to the appendix of your lab report.

20
INFORMED CONSENT FORM FOR PARTICIPATION IN A SCIENTIFIC INVESTIGATION
IB Biology Internal Assessment, ___(your name)____ Brooke Point High School
You have been asked to take part in a research project described below. The researcher will explain the project to you in detail. You should feel free to ask questions. *Description of the project:
______________________________________________________________________________ ______________________________________________________________________________ *Procedures:
______________________________________________________________________________ ______________________________________________________________________________ ______________________________________________________________________________ ______________________________________________________________________________ *Risks or discomfort:
______________________________________________________________________________ ______________________________________________________________________________ *Benefits of this study:
______________________________________________________________________________
______________________________________________________________________________ ______________________________________________________________________________ Confidentiality: Your part in this study is confidential and anonymous. In no way will the name of the subject be recorded or be attached to any data. All data will kept only as evidence that the study was conducted.
Voluntary participation and withdrawal: Participation in research is voluntary. You have the right to refuse to be in this study. If you decide to be in the study and change your mind, you have the right to drop out at any time.
Questions, Rights and Complaints: If you have any questions about this research project, please contact Mr. Todd McGee, IB Biology teacher at (540)658-6080 ex. 1783 or by email at [email protected].
Consent of the Subject: I have read the above and understand my rights in volunteering for this experiment; I hereby acknowledge that I am a willing participant in this anonymous study and am aware of this implication.
________________________________________________________ Volunteer Name (printed) _________________________________________________________ Volunteer Name (signed) Date _________________________________________________________ Acknowledgement of Lead Scientist Date
21
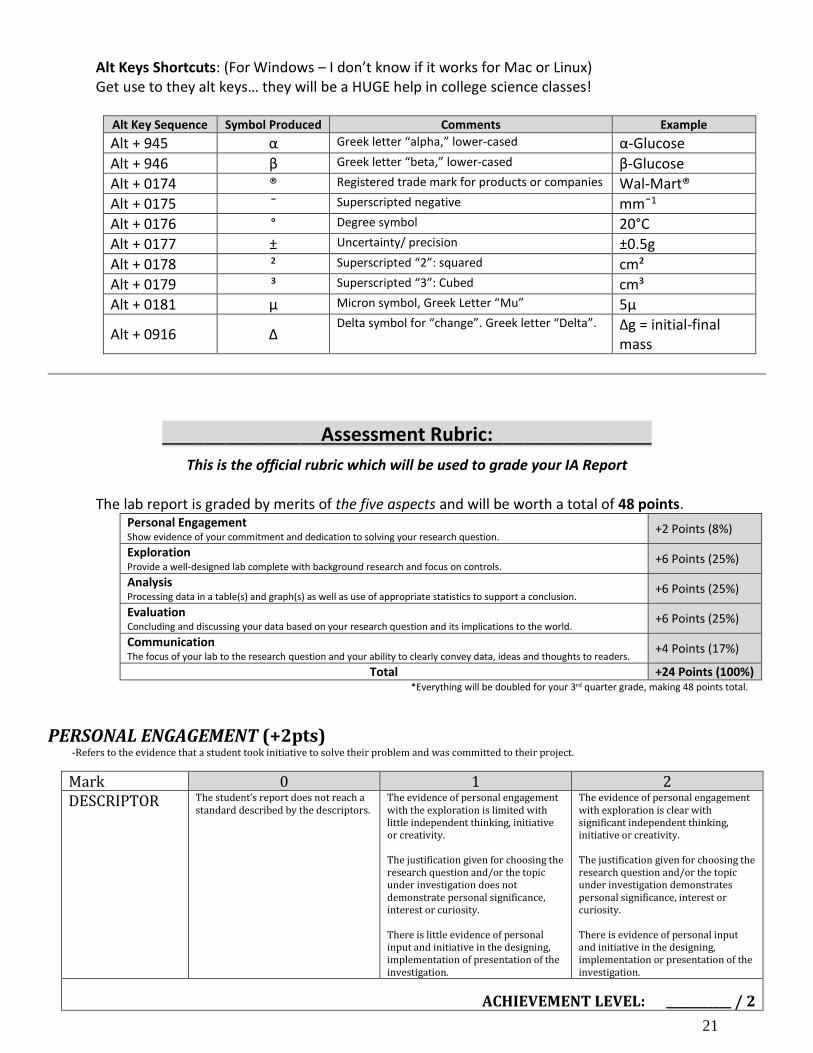
Alt Keys Shortcuts: (For Windows – I don’t know if it works for Mac or Linux) Get use to they alt keys… they will be a HUGE help in college science classes!
Alt Key Sequence Symbol Produced Comments Example
Alt + 945 α Greek letter “alpha,” lower-cased α-Glucose
Alt + 946 β Greek letter “beta,” lower-cased β-Glucose
Alt + 0174 ® Registered trade mark for products or companies Wal-Mart®
Alt + 0175 ¯ Superscripted negative mm¯1
Alt + 0176 ° Degree symbol 20°C
Alt + 0177 ± Uncertainty/ precision ±0.5g
Alt + 0178 ² Superscripted “2”: squared cm²
Alt + 0179 ³ Superscripted “3”: Cubed cm³
Alt + 0181 µ Micron symbol, Greek Letter “Mu” 5µ
Alt + 0916 Δ Delta symbol for “change”. Greek letter “Delta”. Δg = initial-final
mass
_______________Assessment Rubric:_______________
This is the official rubric which will be used to grade your IA Report The lab report is graded by merits of the five aspects and will be worth a total of 48 points.
Personal Engagement Show evidence of your commitment and dedication to solving your research question.
+2 Points (8%)
Exploration Provide a well-designed lab complete with background research and focus on controls.
+6 Points (25%)
Analysis Processing data in a table(s) and graph(s) as well as use of appropriate statistics to support a conclusion.
+6 Points (25%)
Evaluation Concluding and discussing your data based on your research question and its implications to the world.
+6 Points (25%)
Communication The focus of your lab to the research question and your ability to clearly convey data, ideas and thoughts to readers.
+4 Points (17%)
Total +24 Points (100%) *Everything will be doubled for your 3rd quarter grade, making 48 points total.
PERSONAL ENGAGEMENT (+2pts) -Refers to the evidence that a student took initiative to solve their problem and was committed to their project.
Mark 0 1 2 DESCRIPTOR The student’s report does not reach a
standard described by the descriptors. The evidence of personal engagement with the exploration is limited with little independent thinking, initiative or creativity. The justification given for choosing the research question and/or the topic under investigation does not demonstrate personal significance, interest or curiosity. There is little evidence of personal input and initiative in the designing, implementation of presentation of the investigation.
The evidence of personal engagement with exploration is clear with significant independent thinking, initiative or creativity. The justification given for choosing the research question and/or the topic under investigation demonstrates personal significance, interest or curiosity. There is evidence of personal input and initiative in the designing, implementation or presentation of the investigation.
ACHIEVEMENT LEVEL: ___________ / 2
22
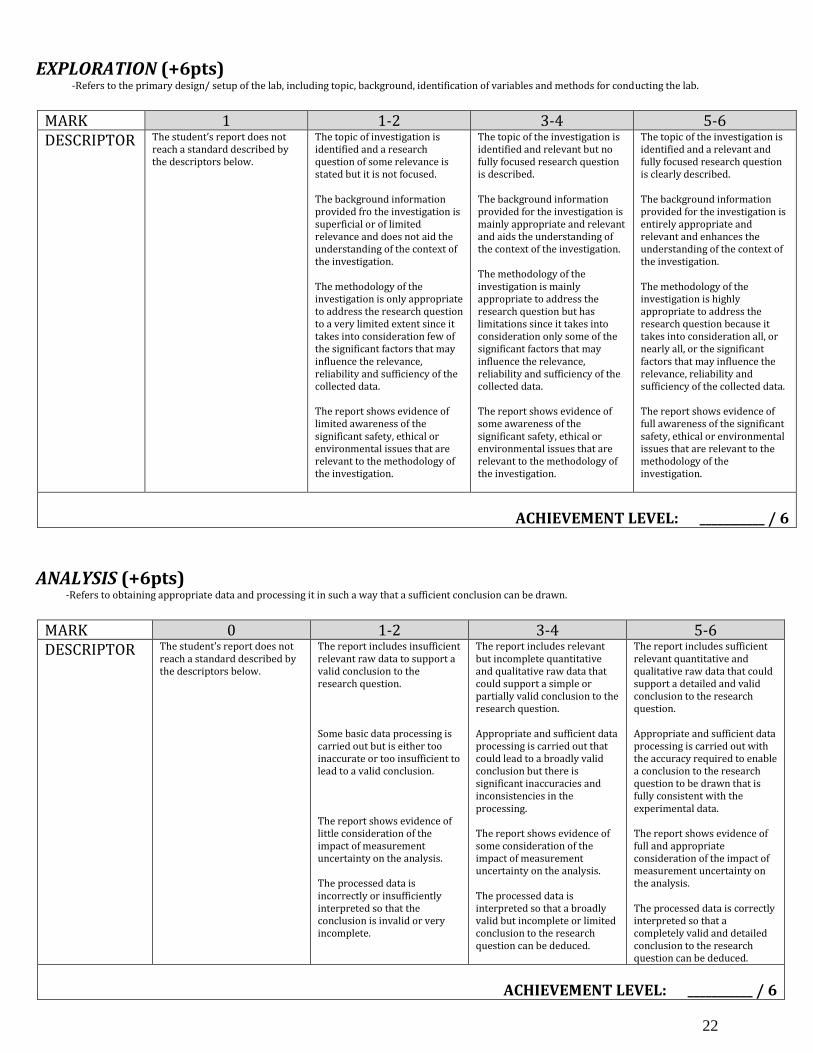
EXPLORATION (+6pts) -Refers to the primary design/ setup of the lab, including topic, background, identification of variables and methods for conducting the lab.
MARK 1 1-2 3-4 5-6 DESCRIPTOR The student’s report does not
reach a standard described by the descriptors below.
The topic of investigation is identified and a research question of some relevance is stated but it is not focused. The background information provided fro the investigation is superficial or of limited relevance and does not aid the understanding of the context of the investigation. The methodology of the investigation is only appropriate to address the research question to a very limited extent since it takes into consideration few of the significant factors that may influence the relevance, reliability and sufficiency of the collected data. The report shows evidence of limited awareness of the significant safety, ethical or environmental issues that are relevant to the methodology of the investigation.
The topic of the investigation is identified and relevant but no fully focused research question is described. The background information provided for the investigation is mainly appropriate and relevant and aids the understanding of the context of the investigation. The methodology of the investigation is mainly appropriate to address the research question but has limitations since it takes into consideration only some of the significant factors that may influence the relevance, reliability and sufficiency of the collected data. The report shows evidence of some awareness of the significant safety, ethical or environmental issues that are relevant to the methodology of the investigation.
The topic of the investigation is identified and a relevant and fully focused research question is clearly described. The background information provided for the investigation is entirely appropriate and relevant and enhances the understanding of the context of the investigation. The methodology of the investigation is highly appropriate to address the research question because it takes into consideration all, or nearly all, or the significant factors that may influence the relevance, reliability and sufficiency of the collected data. The report shows evidence of full awareness of the significant safety, ethical or environmental issues that are relevant to the methodology of the investigation.
ACHIEVEMENT LEVEL: ___________ / 6
ANALYSIS (+6pts) -Refers to obtaining appropriate data and processing it in such a way that a sufficient conclusion can be drawn.
MARK 0 1-2 3-4 5-6 DESCRIPTOR The student’s report does not
reach a standard described by the descriptors below.
The report includes insufficient relevant raw data to support a valid conclusion to the research question. Some basic data processing is carried out but is either too inaccurate or too insufficient to lead to a valid conclusion. The report shows evidence of little consideration of the impact of measurement uncertainty on the analysis. The processed data is incorrectly or insufficiently interpreted so that the conclusion is invalid or very incomplete.
The report includes relevant but incomplete quantitative and qualitative raw data that could support a simple or partially valid conclusion to the research question. Appropriate and sufficient data processing is carried out that could lead to a broadly valid conclusion but there is significant inaccuracies and inconsistencies in the processing. The report shows evidence of some consideration of the impact of measurement uncertainty on the analysis. The processed data is interpreted so that a broadly valid but incomplete or limited conclusion to the research question can be deduced.
The report includes sufficient relevant quantitative and qualitative raw data that could support a detailed and valid conclusion to the research question. Appropriate and sufficient data processing is carried out with the accuracy required to enable a conclusion to the research question to be drawn that is fully consistent with the experimental data. The report shows evidence of full and appropriate consideration of the impact of measurement uncertainty on the analysis. The processed data is correctly interpreted so that a completely valid and detailed conclusion to the research question can be deduced.
ACHIEVEMENT LEVEL: ___________ / 6

23
EVALUATION (+6pts) -Refers to the conclusions made and their justification, as well as discussion of results and evaluation of your lab’s limitations and how they can be improved.
MARK 0 1-2 3-4 5-6 DESCRIPTOR The student’s report does not
reach a standard described by the descriptors below.
A conclusion is outlined which is not relevant to the research question or it is not supported by the data presented. The conclusion makes superficial comparison to the accepted scientific context. Strengths and weaknesses of the investigation, such as limitations of the data and sources of error, are outlined but are restricted to an account of the practical or procedural issues faced. The student has outlined very few realistic and relevant suggestions for the improvement and extension of the investigation.
A conclusion is described which is relevant to the research question and supported by the data presented. A conclusion is described which makes some relevant comparison to accepted scientific context. Strengths and weaknesses of the investigation, such as limitations of the data and sources of error are described and provided evidence of some awareness of methodological issues involved in establishing the conclusion. The student has described some realistic and relevant suggestions for the improvement and extension of the investigation.
A detailed conclusion is described and justified which is entirely relevant to the research question and fully supported by the data presented. A conclusion is correctly described and justified through relevant comparison to the accepted scientific context. Strengths and weaknesses of the investigation, such as limitations of the data and sources of error are discussed and provide evidence of a clear understanding of the methodological issues involved in establishing the conclusion. The student has discussed realistic and relevant suggestions for the improvement and extension of the investigation.
ACHIEVEMENT LEVEL: ___________ / 6
COMMUNICATION (+4pts) -Refers to your ability to convey a clear and accurate ideas to the general public in the presentation of your findings. This is where good writing skills come in handy, especially in writing the procedure. Having a picture/ diagram of your experimental setup isn’t a bad idea either.
Mark 0 1-2 3-4 Descriptor The student’s report does not reach a
standard described by the descriptors below.
The presentation of the investigation is unclear, making it difficult to understand the focus, process and outcomes. The report is not well structured and is unclear; the necessary information on focus, process and outcomes is missing or is presented in an incoherent or disorganized way. There are many errors in the use of subject-specific terminology and conventions.
The presentation of the investigation is clear. Any errors do not hamper understanding of the focus, process and outcomes. The report is well structured and clear; the necessary information on focus, process and outcomes is present and presented in a coherent way. The report is relevant and concise thereby facilitating a ready understanding of the focus, process and outcomes of the investigation. The use of subject-specific terminology and conventions is appropriate and correct. Any errors do not hamper understanding.
ACHIEVEMENT LEVEL: ___________ / 4