IAS Financial results 2002. Efficiency increase in 2002.
29
IAS Financial results 2002 IAS Financial results 2002
-
Upload
scarlett-potter -
Category
Documents
-
view
217 -
download
1
Transcript of IAS Financial results 2002. Efficiency increase in 2002.
IAS Financial results 2002IAS Financial results 2002

Efficiency increase in 2002Efficiency increase in 2002

Major directions of activity in 2002
•Still network optimization
- In 2002 Company continued to develop it’s rout network and the priority was given to the routs with a high profitability
•Raising of fleet usage effectiveness
- In 2002 the Company substantially decreased usage of fuel ineffective aircrafts such as: Il 76, Il 86, Il 62
•Foreign made fleet replacement program
- In 2002 it was taken decision on replacement of 27 foreign made aircrafts of the Company on the 27 new foreign made aircrafts with aim to optimize operating costs.
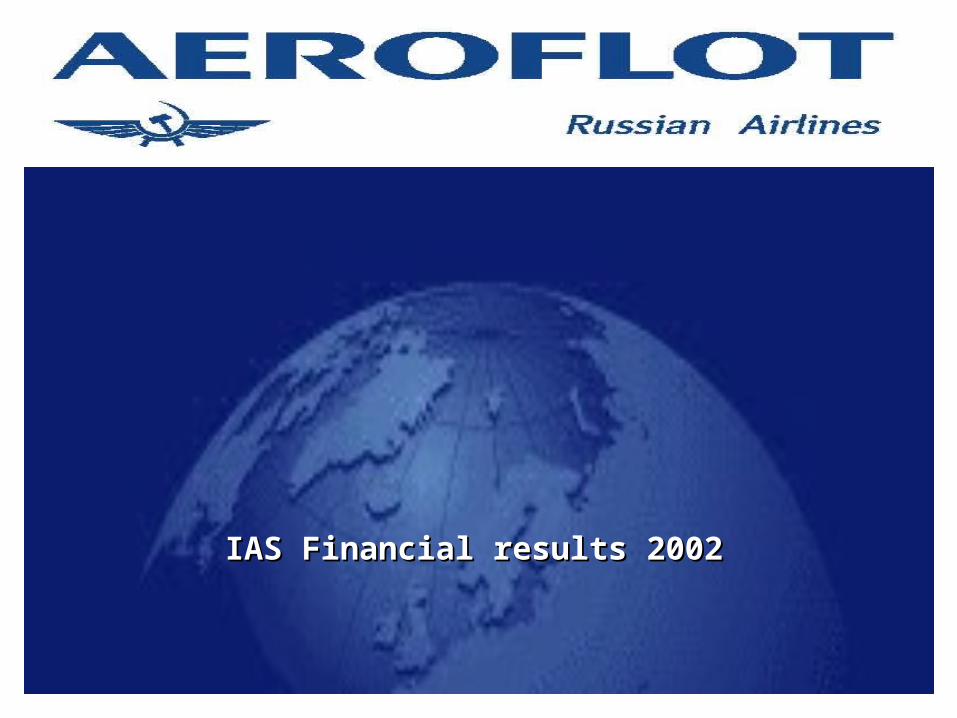
Market environmentMarket environment
Russian airline industry growth in 1999-2002
64,71
53,42 53,41
60,56
26,5225,0721,8321,47
0
10
20
30
40
50
60
70
1999 2000 2001 2002
RPK bn.Pax mm.
Market growth by segments, 2002
3,9%
23,9%
6,8%
-6,1%-10%
-5%
0%
5%
10%
15%
20%
25%
30%
Int.regular Int.chart. Domest.reg. Domest.chart.
•Shortage of adequate capacity•Noise & emission restrictions introduced by European countries•Strict regulation•Still high degree of fragmentation•Low purchasing power – low yield – major constraint•Higher growth rates in the charter segment
6,9%
5,8%

Competitive positionCompetitive positionAeroflot position in Russian Civil Aviation
10,3% 12,2% 12,3% 11,8%
30,7% 32,6% 31,3%27,3%
42,9%
58,6%54,4% 51,6%
0%
10%
20%
30%
40%
50%
60%
70%
1999 2000 2001 2002
InternationalDomesticTotal
• Still an ultimate leader in the industry
• Recent decrease of the market share is due to:
– radical reduction of old Soviet-built aircraft capacities
– concentration of the market growth in the non-core segment
Share of Aeroflot 2002 (International)
7,10%9,60%
42,90%
2,9%3,4%
0%5%
10%15%20%25%30%35%40%45%50%
Aeroflot Sibir Pulkovo Krasair Ural
Share of Aeroflot 2002 (Domestic)
8,5%
13,5%11,7%
6,2%8,3%
0%
2%
4%
6%
8%
10%
12%
14%
16%
Aeroflot Sibir Krasair Domo-dedovo Utair
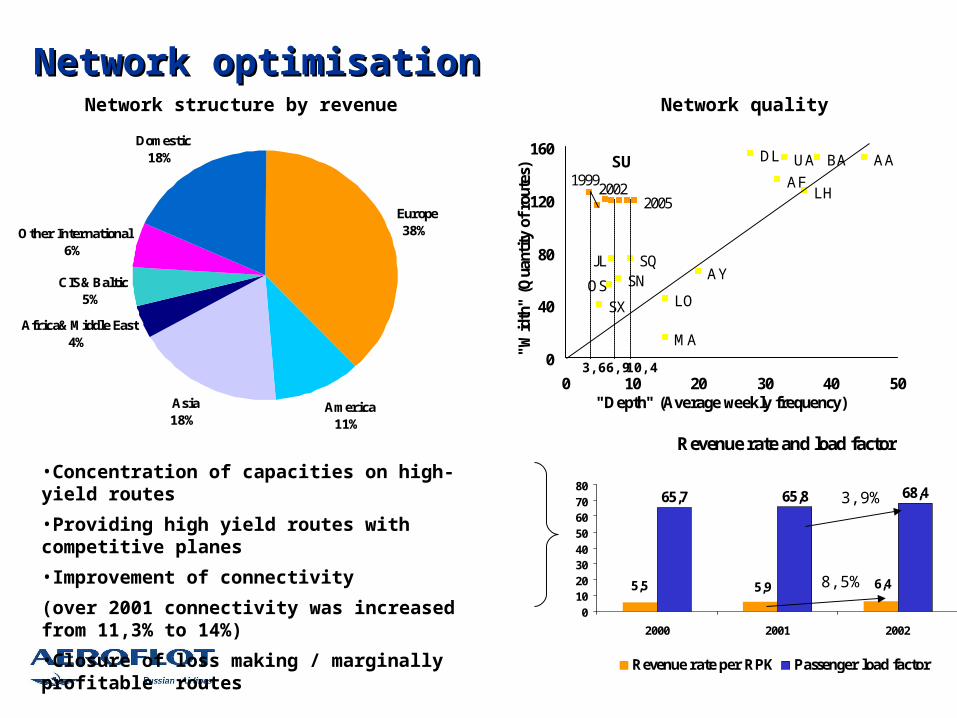
Network optimisationNetwork optimisation
Europe38%
America11%
Asia18%
Africa&Middle East4%
CIS&Baltic5%
Other International6%
Domestic18%
•Concentration of capacities on high-yield routes
•Providing high yield routes with competitive planes
•Improvement of connectivity
(over 2001 connectivity was increased from 11,3% to 14%)
•Closure of loss making / marginally profitable routes
LH
AABAUA
AF
DL
AY
LO
MA
SQSN
JL
OS
SX
20022005
1999
0
40
80
120
160
0 10 20 30 40 50"Depth" (Average weekly frequency)
"W
idth
" (
Qua
ntit
y of
rou
tes) SU
3,6 6,9 10,4
Network qualityNetwork structure by revenue
Revenue rate and load factor
65,7 65,8 68,4
5,5 5,9 6,4
01020304050607080
2000 2001 2002
Revenue rate per RPK Passenger load factor
3,9%
8,5%
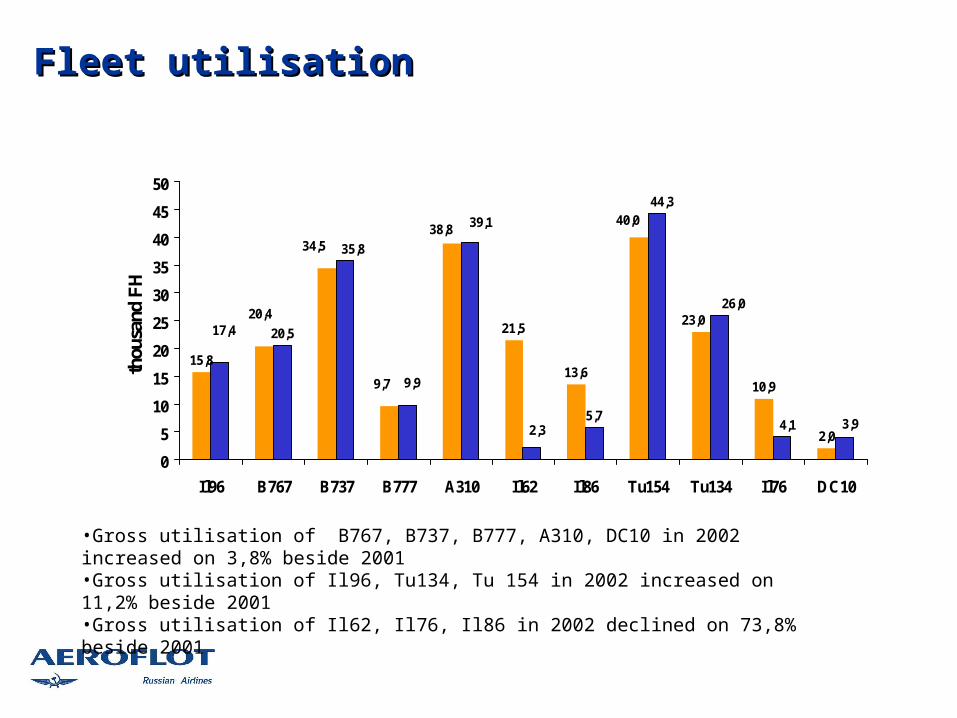
Fleet utilisationFleet utilisation
21,5
13,610,9
2,0
20,5
5,7
23,0
40,0
9,7
38,8
15,8
20,4
34,5
3,94,1
26,0
44,3
2,3
39,1
9,9
35,8
17,4
0
5
10
15
20
25
30
35
40
45
50
Il96 B767 B737 B777 A310 Il62 Il86 Tu154 Tu134 Il76 DC10
thou
sand
FH
•Gross utilisation of B767, B737, B777, A310, DC10 in 2002 increased on 3,8% beside 2001•Gross utilisation of Il96, Tu134, Tu 154 in 2002 increased on 11,2% beside 2001•Gross utilisation of Il62, Il76, Il86 in 2002 declined on 73,8% beside 2001
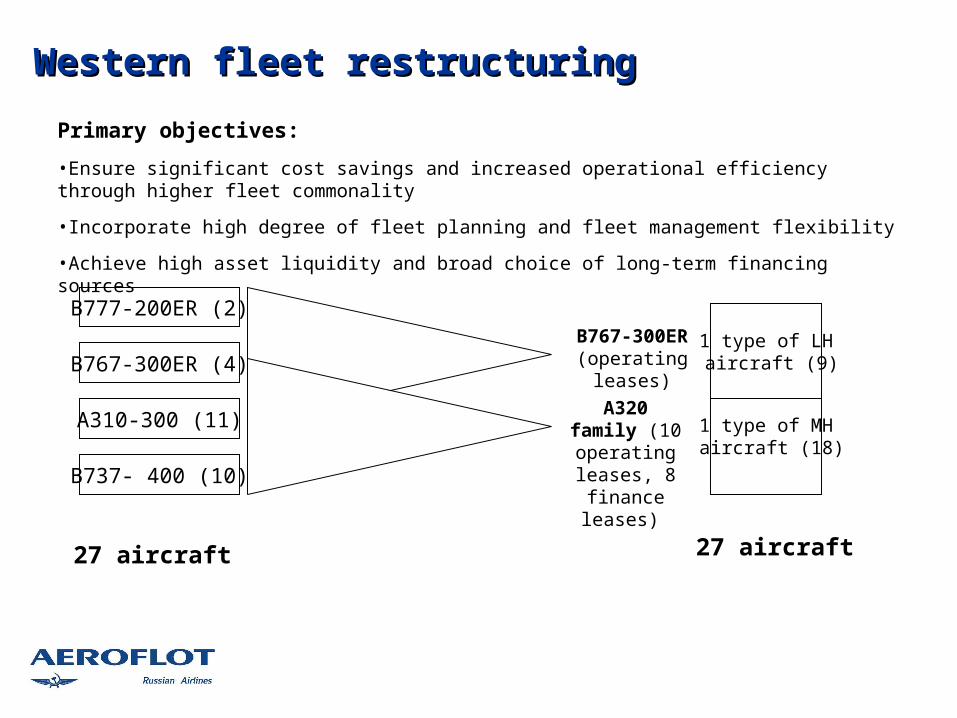
Western fleet restructuringWestern fleet restructuring
B777-200ER (2)
B767-300ER (4)
A310-300 (11)
B737- 400 (10)
B767-300ER (operating leases)
А320 family (10 operating
leases, 8 finance leases)
1 type of LH aircraft (9)
1 type of MH aircraft (18)
27 aircraft 27 aircraft
Primary objectives:
•Ensure significant cost savings and increased operational efficiency through higher fleet commonality
•Incorporate high degree of fleet planning and fleet management flexibility
•Achieve high asset liquidity and broad choice of long-term financing sources

Russian and cargo fleet restructuringRussian and cargo fleet restructuring
Il96-300(6)
Il62 (10)
Il86 (14)
Tu154M (20)
Tu134 (15)
Medium-term target - provide further commonality of the whole fleet
Il76(10)
DC10F(2)
1 type of LH aircraft 6 Il96 + 6 on order
1 type of MH aircraft 20 Tu154M
1 type of SH aircraft 11 Tu134M
65 aircraft 52 aircraft
1 type of freighter4 DC10F

Operating profit and net profit dynamics Operating profit and net profit dynamics
158,8
40,182,1
7,3-6,2
-59,6
-210,9
89,3
20,18,6
-250
-200
-150
-100
-50
0
50
100
150
200
1998 1999 2000 2001 2002
USD
mln
Operating profit Net profit

Operating Results 2002Operating Results 2002
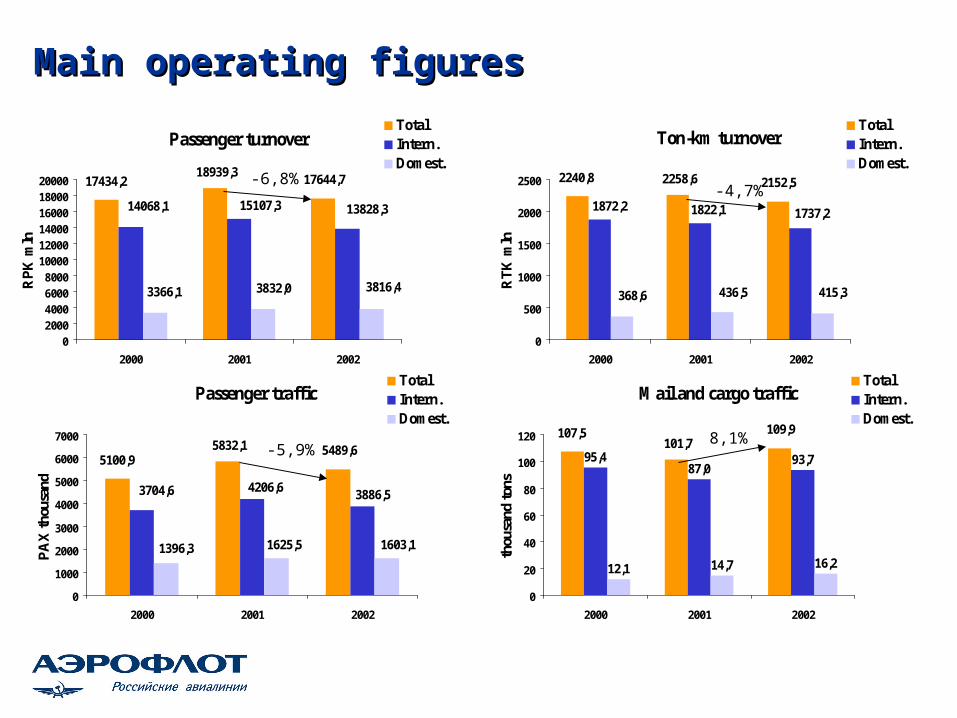
Main operating figuresMain operating figures
Passenger turnover
17434,218939,3
17644,7
13828,315107,314068,1
3816,43832,03366,1
02000400060008000
100001200014000160001800020000
2000 2001 2002
RP
K m
ln
TotalIntern.Domest.
Ton-km turnover
2240,8 2258,6 2152,5
1737,21822,11872,2
415,3436,5368,6
0
500
1000
1500
2000
2500
2000 2001 2002
RT
K m
ln
TotalIntern.Domest.
Mail and cargo traffic
95,487,0
93,7
12,1 14,7 16,2
107,5101,7
109,9
0
20
40
60
80
100
120
2000 2001 2002
thou
sand
ton
s
TotalIntern.Domest.
Passenger traffic
5100,95832,1 5489,6
3886,54206,63704,6
1603,11625,51396,3
0
1000
2000
3000
4000
5000
6000
7000
2000 2001 2002
PA
X t
hous
and
TotalIntern.Domest.
-6,8%
-5,9%
-4,7%
8,1%

Load factors and fuel consumptionLoad factors and fuel consumption
Passenger load factor
64,2 64,2
67,3
72,7 72,7 72,7
65,7 65,8
68,4
58
60
62
64
66
68
70
72
74
2000 2001 2002
%
ВсегоМВЛВВЛ
Commercial load factor
52,6 51,555,5
65,2 63,2 60,756,453,554,5
0
10
20
30
40
50
60
70
2000 2001 2002
%
ВсегоМВЛВВЛ
Specific fuel consumption
558,0567,0
492,0
440
460
480
500
520
540
560
580
2000 2001 2002
гм/т
км
1% of passenger load factor increase - USD16,5 mln of additional revenue
1% of commercial load factor increase - USD27 mln of additional revenue
Financial Results 2002Financial Results 2002

Profit and loss statementProfit and loss statement
31.12.01(USD mln)
31.12.02(USD mln)
Revenue 1 558,0 1563,0
Operatig costs 1 517,9 1404,2
Operating profit 40,1 158,8
Profit before taxes anminority interest
10,7 132,9
Profit after taxes 21,8 91,3
Minority interest 1,7 2,0
Net profit 20,1 89,3
Net profit per share $0,018 $0,080

Revenue and traffic revenue Revenue and traffic revenue
Revenue in 2000-2002
1406,9
1558,0 1563,0
1300
1350
1400
1450
1500
1550
1600
2000 2001 2002
USD
mil
lion
Traffic revenue in 2000-2002
1074,0
1221,01244,3
950
1000
1050
1100
1150
1200
1250
1300
2000 2001 2002
USD
mil
lion
Passenger revenue in 2000-2002
956,4
1115,7 1120,5
850
900
950
1000
1050
1100
1150
2000 2001 2002
USD
mil
lion
0,3% 1,9%
0,4
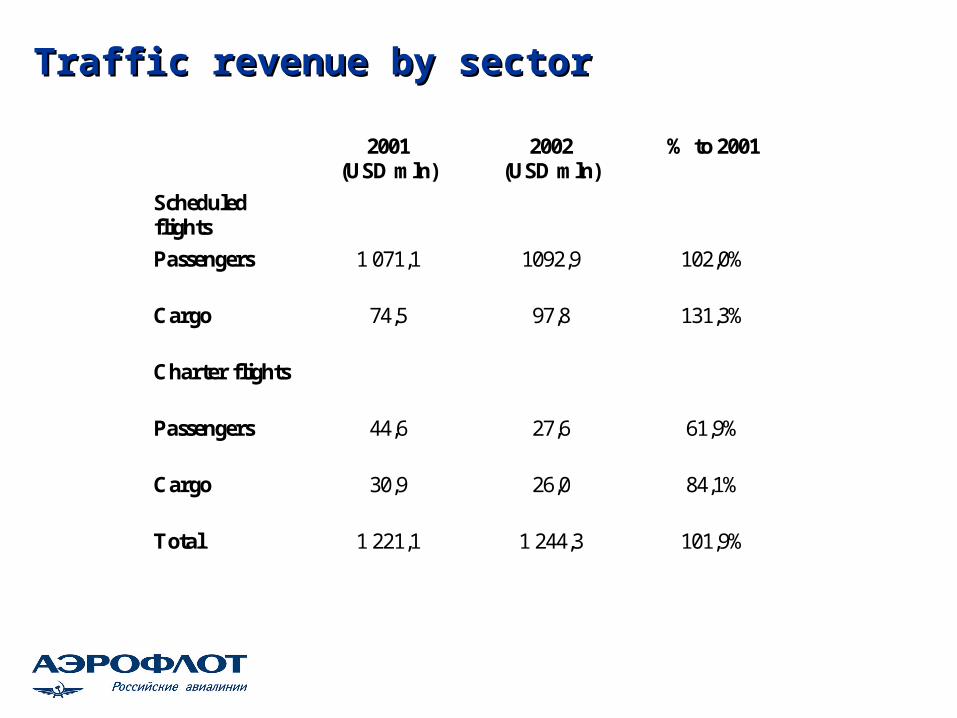
Traffic revenue by sector Traffic revenue by sector
2001(USD mln)
2002(USD mln)
% to 2001
Scheduledflights
Passengers 1 071,1 1092,9 102,0%
Cargo 74,5 97,8 131,3%
Charter flights
Passengers 44,6 27,6 61,9%
Cargo 30,9 26,0 84,1%
Total 1 221,1 1 244,3 101,9%
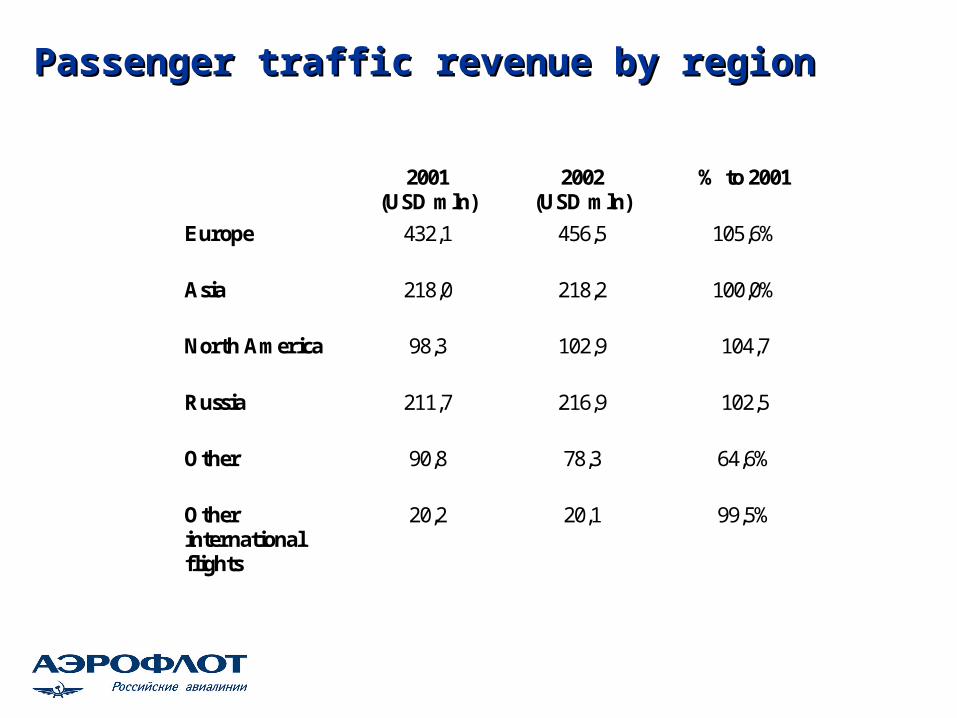
Passenger traffic revenue by region Passenger traffic revenue by region
2001(USD mln)
2002(USD mln)
% to 2001
Europe 432,1 456,5 105,6%
Asia 218,0 218,2 100,0%
North America 98,3 102,9 104,7
Russia 211,7 216,9 102,5
Other 90,8 78,3 64,6%
Otherinternationalflights
20,2 20,1 99,5%
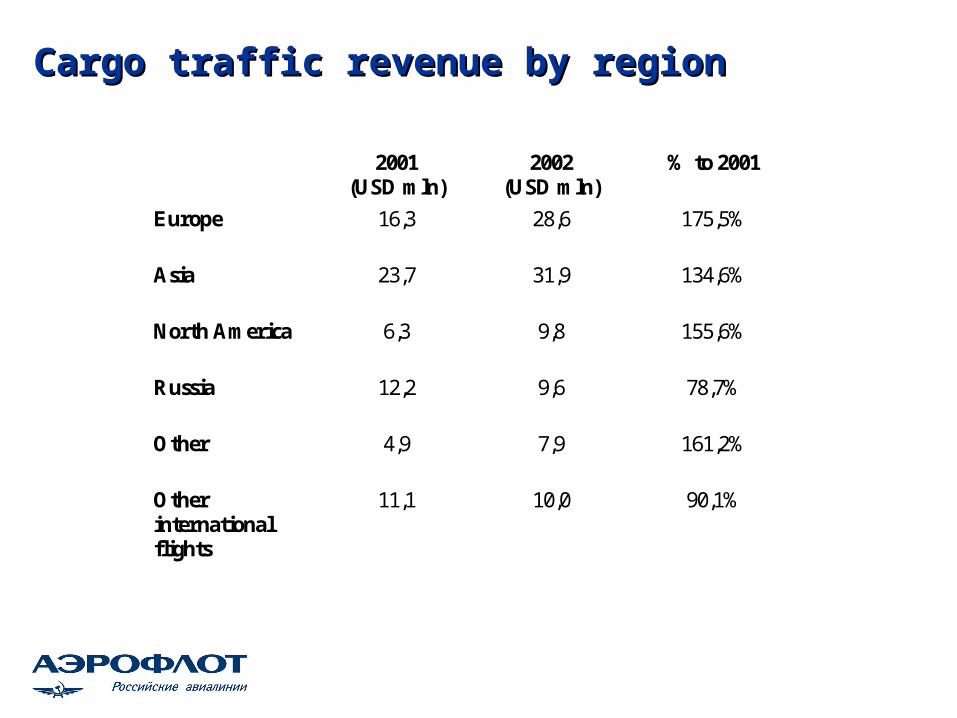
Cargo traffic revenue by region Cargo traffic revenue by region
2001(USD mln)
2002(USD mln)
% to 2001
Europe 16,3 28,6 175,5%
Asia 23,7 31,9 134,6%
North America 6,3 9,8 155,6%
Russia 12,2 9,6 78,7%
Other 4,9 7,9 161,2%
Otherinternationalflights
11,1 10,0 90,1%
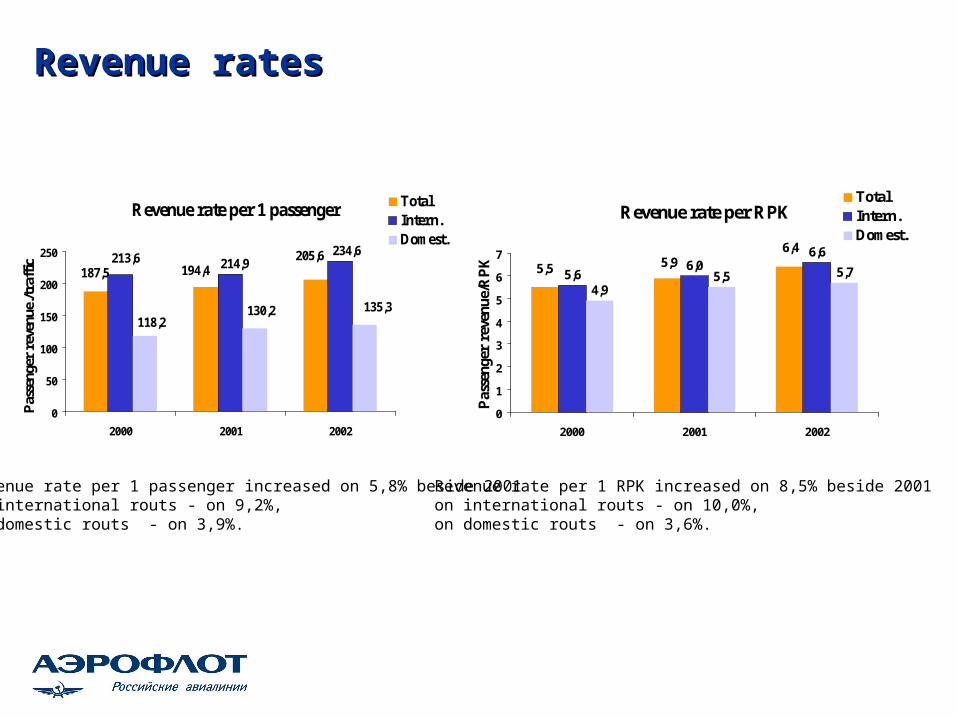
Revenue ratesRevenue rates
Revenue rate per 1 passenger
205,6194,4187,5
234,6214,9213,6
135,3130,2118,2
0
50
100
150
200
250
2000 2001 2002
Pas
seng
er r
even
ue./t
raffi
c
TotalIntern.Domest.
Revenue rate per RPK
5,66,0
6,6
4,95,5 5,75,5 5,9
6,4
0
1
2
3
4
5
6
7
2000 2001 2002
Pas
seng
er r
even
ue/R
PK
TotalIntern.Domest.
Revenue rate per 1 passenger increased on 5,8% beside 2001on international routs - on 9,2%,on domestic routs - on 3,9%.
Revenue rate per 1 RPK increased on 8,5% beside 2001on international routs - on 10,0%,on domestic routs - on 3,6%.
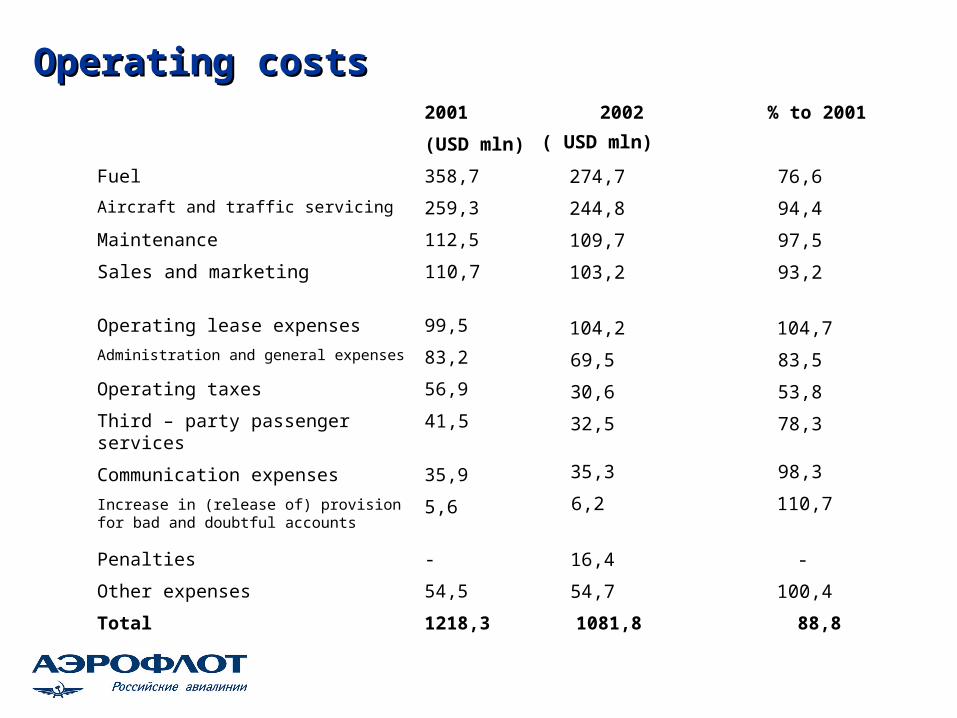
Operating costsOperating costs
1218,3Total
54,5Other expenses
5,6Increase in (release of) provision for bad and doubtful accounts
35,9Communication expenses
41,5Third – party passenger services
56,9Operating taxes
83,2Administration and general expenses
99,5Operating lease expenses
110,7Sales and marketing
112,5Maintenance
259,3Aircraft and traffic servicing
358,7Fuel
(USD mln)
% to 200120022001
( USD mln)
274,7
244,8
109,7
103,2
104,2
69,5
30,6
32,5
35,3
6,2
Penalties - 16,4
54,7
1081,8
76,6
94,4
97,5
93,2
104,7
83,5
53,8
78,3
98,3
110,7
-
100,4
88,8

Operating costs structureOperating costs structure
100 Total
4,5Other expenses
0,5Increase in (release of) provision for bad and doubtful accounts
2,9Communication expenses
3,4Third – party passenger services
4,7Operating taxes
6,8Administration and general expenses
8,2Operating lease expenses
9,1Sales and marketing
9,2Maintenance
21,3Aircraft and traffic servicing
29,4Fuel
20022001
25,422,6
Penalties
10,2 9,5 9,6 6,4 2,8
3,03,3
0,6
- 1,55,1
100

Key factors of operating profit changeKey factors of operating profit change
143 8 14 9 5
-20-3
96
-7340
84
-18
159
-100
-50
0
50
100
150
200
US
D m
ln
Operating profit2001
Traffic decrease
Fairs increase
Decrease of other revenue
Fuel costs decrease
Aircraft and traffic servicing costs decrease
Maintenance costs decrease
Sales and marketing costs decrease
Third party passenger servicing costs decrease
Salary increase
Operating profit 2002
Administration and general expenses decrease
Depreciation increase
Other decreased costs
Aircraft and traf. serv. costs decrease

Operating costs and production costOperating costs and production cost
Operating costs
1324,0
1517,0
1404,2
1200
1250
1300
1350
1400
1450
1500
1550
2000 2001 2002
USD
mln
Production cost of 1 tkm
59,1
67,2
65,2
54
56
58
60
62
64
66
68
2000 2001 2002
USc
-7,4%
-3,0%

Operating activity resultsOperating activity results
59,167,2 65,2
3,7 1,77,4
62,868,9 72,6
0
10
20
30
40
50
60
70
80
2000 2001 2002
Revenue rate for 1 ton-km Production cost of 1 ton-km Operating result
In 4,5 times

Balance sheetsBalance sheets 31.12.01
(USD mln)31.12.02
(USD mln)Change to 2001
Current assets 292,6 320,4 27,8
Long – term assets 819,6 565,0 -254,6
Total assets 1 112,2 885,4 -226,8
Short – term liabilities 562,6 461,9 -100,7
Long – term liabilities 464,3 250,8 -213,5
Minority interest 7,6 7,9 0,3
Shareholders’ equity 77,7 164,8 87,1
Total liabilities andShareholders equity
1 112,2 885,4 -226,8

Cash flowsCash flows
EBITDAR
288,0
244,0
370,0
0
50
100
150
200
250
300
350
400
2000 2001 2002
USD
mln
Capex
28,827,2
21,9
0
5
10
15
20
25
30
35
2000 2001 2002
USD
mln
Net CF
261,1
216,8
341,2
0
50
100
150
200
250
300
350
400
2000 2001 2002
USD
mln

Capital StructureCapital Structure
Debt/EBITDAR
4,10
5,044,67
2,56
4,93
0
1
2
3
4
5
6
1998 1999 2000 2001 2002
Debt composition
82 773 3 3
441 435 391339
113
602 602707 700 729
65469
110131
0
100
200
300
400
500
600
700
800
1998 1999 2000 2001 2002
ST debt LT debt LT leases Off BS debt
Long-term strategic focusLong-term strategic focus
• Profitable market growth
• Increase of operating and financial effectiveness
• Product upgrade and brand development
• Leadership in national industry consolidation
• Building strategy-focused organisation
• World alliance membership
• Strategic projects:
– New hub
– Group restructuring