IARC TECHNICAL PUBLICATIONS - IARC - … · iarc technical publications planning and developing...
51
PLANNING AND DEVELOPING POPULATION-BASED CANCER REGISTRATION IN LOW- AND MIDDLE-INCOME SETTINGS FREDDIE BRAY, ARIANA ZNAOR, PATRICIA CUEVA, ANNE KORIR, RAJARAMAN SWAMINATHAN, ANDREAS ULLRICH, SUSAN A. WANG, AND DONALD MAXWELL PARKIN IARC TECHNICAL PUBLICATIONS IARC TECHNICAL PUBLICATION NO. 43
Transcript of IARC TECHNICAL PUBLICATIONS - IARC - … · iarc technical publications planning and developing...

PLANNING AND DEVELOPING POPULATION-BASED CANCER
REGISTRATION IN LOW- AND MIDDLE-INCOME SETTINGS
FREDDIE BRAY, ARIANA ZNAOR, PATRICIA CUEVA, ANNE KORIR, RAJARAMAN SWAMINATHAN, ANDREAS ULLRICH,
SUSAN A. WANG, AND DONALD MAXWELL PARKIN
IARC
TEC
HNIC
ALPU
BLIC
ATIO
NS
IARC TECHNICAL PUBLICATION NO. 43

IARC
TEC
HNIC
ALPU
BLIC
ATIO
NS
PLANNING AND DEVELOPING POPULATION-BASED CANCER
REGISTRATION IN LOW- AND MIDDLE-INCOME SETTINGS
FREDDIE BRAY, ARIANA ZNAOR, PATRICIA CUEVA, ANNE KORIR, RAJARAMAN SWAMINATHAN, ANDREAS ULLRICH,
SUSAN A. WANG, AND DONALD MAXWELL PARKIN
IARC TECHNICAL PUBLICATION NO. 43

Published by the International Agency for Research on Cancer,150 cours Albert Thomas, 69372 Lyon Cedex 08, France
©International Agency for Research on Cancer, 2014Revised and corrected, 2015
Distributed byWHO Press, World Health Organization, 20 Avenue Appia, 1211 Geneva 27, Switzerland
(tel: +41 22 791 3264; fax: +41 22 791 4857; email: [email protected]).
Publications of the World Health Organization enjoy copyright protection in accordance with the provisions of Protocol 2 of the Universal Copyright Convention. All rights reserved.
The designations employed and the presentation of the material in this publication do not imply the expression of any opinion whatsoever on the part of the Secretariat of the World Health Organization concerning the legal status of any country, territory, city, or area or of its authorities, or concerning the delimitation of its frontiers or boundaries.
The mention of specific companies or of certain manufacturers’ products does not imply that they are endorsed or recommended by the World Health Organization in preference to others of a similar nature that are not mentioned.
Errors and omissions excepted, the names of proprietary products are distinguished by initial capital letters.
The authors alone are responsible for the views expressed in this publication.
The International Agency for Research on Cancer welcomes requests for permission to reproduce or translate its publications, in part or in full. Requests for permission to reproduce or translate IARC publications – whether for sale or for non-commercial distribution – should be addressed to the IARC Communications Group, at: [email protected].
Cover image: Photo taken by Max Parkin at the Nairobi Hospital, Kenya, in June 2010. The photo shows the Medical Records Department of the hospital and the supervisor, Mr Desmond Ogwang (left, seated at computer).
This book is available in electronic format fromhttp://www.iarc.fr/en/publications/pdfs-online/treport-pub/treport-pub43/index.php.
IARC Library Cataloguing in Publication Data
Planning and developing population-based cancer registration in low- and middle-income settings / Freddie Bray, Ariana Znaor, Patricia Cueva … [et al.]
(IARC Technical Publications; 43)
1. Registries – standards 2. Neoplasms – epidemiology 3. Neoplasms – prevention & control 4. Data Collection – methods 5. Quality Indicators, Health Care 6. Developing CountriesI. Bray, Freddie II. Series
ISBN 978-92-832-0436-7 (NLM Classification: W1) ISSN 1012-7348

Contributors ................................................................................................................................................................ vAcknowledgements ................................................................................................................................................... viForeword .................................................................................................................................................................. viiPreface .................................................................................................................................................................... viiiExecutive summary ................................................................................................................................................... ixAbbreviations ............................................................................................................................................................. x
Chapter 1 .................................................................................................................................................................... 1Introduction
Chapter 2 .................................................................................................................................................................... 3The role and status of population-based cancer registration
Chapter 3 .................................................................................................................................................................... 9Planning and developing a population-based cancer registry
Chapter 4 .................................................................................................................................................................. 15Sources of information for the population-based cancer registry
Chapter 5 .................................................................................................................................................................. 21Quality control at the population-based cancer registry
Chapter 6 .................................................................................................................................................................. 27Making the population-based cancer registry heard – reporting the results
References ............................................................................................................................................................... 31
Annex 1 .................................................................................................................................................................... 32CanReg5
Annex 2 ................................................................................................................................................................... 33Selected data quality indicators by country or region
Table of contents


Contributors v
Authors
Dr Freddie BraySection of Cancer InformationInternational Agency for Research on Cancer (IARC)150 cours Albert Thomas69372 Lyon Cedex 08France
Dr Patricia CuevaSociedad de Lucha Contra el CáncerSOLCA, Núcleo de QuitoAv. Eloy Alfaro 53-94 y Los PinosCasilla 1711 4965 CCIQuitoEcuador
Dr Anne KorirNairobi Cancer RegistryKenya Medical Research InstituteCentre for Clinical ResearchP.O. Box 20778, 00202NairobiKenya
Dr Donald Maxwell ParkinThe African Cancer Registry Network (AFCRN)Prama House267 Banbury Road, OxfordOX2 7HTUnited Kingdom
Dr Rajaraman SwaminathanHead, Department of Biostatistics and Cancer RegistryCancer Institute (WIA)38 Sardar Patel RoadChennai 600036India
Dr Andreas UllrichFocal point cancer control/Liaison IARC Management of Noncommunicable Diseases DepartmentWorld Health Organization20 Avenue Appia1211 Geneva 27Switzerland
Dr Susan A. WangDepartment of Immunization, Vaccines and BiologicalsWorld Health Organization20 Avenue Appia1211 Geneva 27Switzerland
Dr Ariana ZnaorSection of Cancer InformationInternational Agency for Research on Cancer (IARC)150 cours Albert Thomas69372 Lyon Cedex 08France
Production Team
Karen MüllerEnglish Editor
Sylvia LesagePublishing Assistant
Contributors

Acknowledgementsvi
The authors would like to express their gratitude to Professor David Roder, Cancer Epidemiology and Population Health, School of Population Health, University of South Australia and Senior Principal Research Scientist, South Australian Health and Medical Research Institute, and to Professor Rajesh Dikshit, Tata Memorial Hospital and the Principal Investigator of the IARC Regional Hub for Cancer Registration, Mumbai, for their insightful comments and suggestions on an earlier draft of this document.
IARC and WHO thank the GAVI Alliance, whose unrestricted financial support has made the production of this document possible.
Acknowledgements

Foreword vii
Foreword
Cancer control planning without reliable data from cancer registries is prone to misplaced emphasis and wasted investment. This is exactly the position many countries still find themselves in at the beginning of the 21st century. Particularly in low- and middle-income countries, this situation reflects a lack of ad-vocacy for the value of registries, a lack of trained staff and other re-sources, and a lack of prioritization for “counting cancers” in among the many demands on limited health care services.
Nevertheless, there are posi-tive signs that the position may be changing. First, the emphasis on noncommunicable diseases (NCDs) at the highest political level and recognition of their role in hamper-ing human development are chang-ing priorities within countries and among donors. Second, the World Health Organization Member States agreed that among the indica-tors of progress in the fight against NCDs is the need to record “cancer incidence, by type of cancer, per 100 000 population”, thus placing an onus on countries to establish pop-ulation-based cancer registries and to report on progress. At the same time, several technical and fund-ing organizations are working in a cooperative and coordinated man-ner to improve the quality and cov-
erage of cancer registration under the auspices of the Global Initiative for Cancer Registry Development (GICR). This is leading to noticeable improvements in training, advocacy, and data collection and analysis. This dual approach – top-down and bottom-up – will translate into a step change in the availability of reliable data on cancer occurrence globally. This, in turn, would be a cornerstone of cancer control in the coming decades.
Accepting the value of cancer registration, what should be mea-sured? Certainly in addition to inci-dence, there is enormous value in estimating cancer survival by follow-ing up cancer patients with respect to their vital status so as to obtain information on the quality of cancer services at the population level. As cancer information systems devel-op, there are further opportunities to link cancer registry databases with other data sets on, for exam-ple, cancer screening, treatment, co-morbidities, and so on. Registry data can also catalyse research into causes of the disease and the ef-fectiveness of national or regional intervention strategies.
Knowing what to measure is fundamental, but how should it be done? This is where the cur-rent publication fulfils an important
function, providing practical guid-ance on gathering, processing, and checking the quality of information collected, within the context of a population-based cancer registry situated within a low- or middle- income country.
As Director of the International Agency for Research on Cancer, this book has particular resonance for me. Upon its inception 50 years ago, the Agency had a prime goal of studying the geographical varia-tions in cancer occurrence to learn about the causes and prevention of the disease. This led to five decades of work alongside an uncountable number of impressively dedicated colleagues, determined to develop cancer registries under the most demanding of circumstances; theirs has frequently been a labour of love. It is my firm conviction that the con-tents of this book, developed within an enduring partnership with the International Association of Cancer Registries, represent another impor-tant step in supporting cancer reg-istrars as they seek to provide the figures needed to ensure that the best possible cancer control mea-sures are available for all popula-tions worldwide.
Dr Christopher P. WildDirector, International Agency
for Research on Cancer

Prefaceviii
Preface
Population-based cancer regis-tries have provided decisive contri-butions to cancer epidemiology and cancer control, spanning three quar-ters of a century. Cancer registration began in earnest in the 1930s and 1940s, at the same time that mod-ern epidemiology began to seek the causes of chronic diseases. Cancer registration progressively expanded during the subsequent decades, and cancer registries have now become definitive and unique resources for measuring the cancer burden in the community (still today, no compa-rable data system is available for other major diseases). Registries have contributed in a number of im-portant ways across the spectrum of cancer control, from determining the burden and geographical variation in cancer, and thereby aiding under-standing of its causes, through to population-based survival analyses and assessments of the quality of diagnosis and care received by can-cer patients.
The accumulation and expan-sion of registry data have enabled geographical and time trends of incidence, mortality, survival, and prevalence to flourish. The indi-vidual data sets collected have also fed into a very large number of analytical epidemiological stud-
ies. More recent developments in-clude research based on registry linkages with clinical databanks and biological sample repositories. Although these achievements are becoming standard practice in reg-istries in industrialized countries, much work still remains to ensure a similar development in low- and middle-income countries (LMICs). Registry coverage with high-quality data remains well below 10% in Af-rica, Asia, and Latin America, and there is an urgent need to support the initiation, expansion, and devel-opment of registries in many LMICs. The approach relies upon the syn-ergy between local resources and willingness on the one hand, and in-ternational cooperation on the other. It is in this context that the Interna-tional Association of Cancer Regis-tries, an organization with member registries across all continents, will be pleased to link activities and fu-ture plans with the ongoing develop-ment of the IARC Regional Hubs for Cancer Registration, as part of the Global Initiative for Cancer Registry Development (GICR).
A key requirement for the devel-opment of population-based cancer registries is resources to support the delivery of training. Needs vary,
from detailed how-to guides for can-cer registrars to instruction in statis-tical methodologies for the analysis of registry data sets. This guidance document provides an overview of the key concepts in cancer registra-tion, covering the steps involved in planning a registry, the sources of information a registry will need to access, methods for ensuring data quality, and how registry results should be reported. As such, it will be of value to those who are seeking to establish a registry or are in the early stages of developing a regis-try. It covers the major components that need to be thought about when setting up a registry and ensuring that it provides the necessary infor-mation for its main stakeholders – especially those involved in cancer control planning.
Roberto Zanetti, MD, PhD President, International
Association of Cancer Registries
David Forman, PhD Head, Section of Cancer
Information, International Agency for Research on Cancer
Executive Secretary,International Association
of Cancer Registries

Executive summary. Planning and developing population-based cancer registration in low- and middle-income settings ix
More than 20 million new cases of cancer are predicted worldwide in 2025, with four fifths of the burden falling on low- and middle-income countries (LMICs). To understand the local cancer situation and tackle the increasing incidence, there is a pressing need for planners to have relevant and unbiased data on the cancer burden in their communities. Population-based cancer registries (PBCRs) provide such information and are a standard requirement for cancer control planning and evalu-ation in every country of the world. They are especially valuable in LMICs, where few other population-based data on cancer occurrence and outcome are available.
In planning a PBCR, there are many elements to consider, includ-ing the definition of the population, the personnel required, the physical location of the registry, the neces-sary equipment and office space, adequate financing, ensuring that legal aspects and confidentiality are appropriately addressed, and – last but not least – the appointment of an advisory committee to oversee the activities of the registry. Most of the requirements for planning and monitoring can be achieved through registration of a subset (sample) of
Executive summary
the national population, using one regional PBCR or a series of region-al PBCRs. The political will and sup-port of the key stakeholders are very important at the outset to ensure the sustainability of the PBCR. Success also depends on the collaboration of clinicians, pathologists, and staff in administration in ensuring access to their data.
PBCRs rely on the use of mul-tiple sources of information on can-cer cases in the target population. These sources can be grouped into three broad categories: hospitals, laboratories, and death certificates. Registry procedures allow identifi-cation of the same cancer case from different sources (while avoiding du-plicate registrations). The minimum data set is the list of variables for a given case that is essential for any cancer registry to collect. Several of the variables require coding, to fa-cilitate analysis. Standard, interna-tional coding schemes are available for some variables, and cancer reg-istries should use them so that com-parison of results between registries is possible. The most important are the coding of the tumour (site, histol-ogy, behaviour, basis of diagnosis), using the International Classification of Diseases for Oncology (ICD-O), and the coding of stage, using the
tumour–node–metastasis (TNM) staging system.
As well as collating the data, PBCRs are responsible for analys-ing and reporting. Cancer incidence reports contain information on all re-portable cancers and represent the main deliverable of a cancer regis-try, providing feedback to the stake-holders and the data providers. The main components of the report are background information, evalua-tion and presentation of the results, and the tabular section. All PBCRs should be able to provide some ob-jective indication of the quality of the reported data. The methods avail-able are described in the context of lower-income settings and cover the four dimensions of data quality: comparability, validity, timeliness, and completeness.
To support the local planning and development of PBCRs in coun-tries within defined regions, a series of IARC Regional Hubs for Cancer Registration in Africa, Asia, and Lat-in America have been established. A tailored set of recommended local activities involving training, techni-cal guidance, research capacity-building, and advocacy are provided to increase the data quality, cover-age, and utility of PBCRs in serving cancer control purposes.

Abbreviationsx
ASR age-standardized rate (World Standard) per 100 000CDC Centers for Disease Control and PreventionCI5 Cancer Incidence in Five Continents
CT computed tomographyDCO death certificate onlyDCO% percentage of cases for which the only information came from a death certificateENCR European Network of Cancer RegistriesGICR Global Initiative for Cancer Registry DevelopmentHBCRs hospital-based cancer registriesHDI Human Development IndexHPV human papillomavirusIACR International Association of Cancer RegistriesIARC International Agency for Research on CancerIARCcrgTools IARC–IACR Cancer Registry ToolsICD-10 International Statistical Classification of Diseases and Related Health Problems, 10th RevisionICD-O International Classification of Diseases for OncologyICD-O-3 International Classification of Diseases for Oncology, 3rd EditionLMICs low- and middle-income countriesM:I mortality-to-incidence ratioM:I% percentage mortality-to-incidence ratioMRI magnetic resonance imagingMV% percentage of cases with a morphologically verified diagnosisNCDs noncommunicable diseasesNCRP National Cancer Registry ProgramPBCRs population-based cancer registriesSEER Surveillance, Epidemiology, and End ResultsTNM tumour–node–metastasisUICC Union for International Cancer ControlWHO World Health Organization
Abbreviations

Chapter 1. Introduction 1
CH
AP
TER
1
chap te r 1.
Introduction
Changing fertility rates, increas-ing longevity, and changing lifestyles have led to an increasing burden from noncommunicable diseases (NCDs) worldwide: of the estimated 57 mil-lion deaths occurring globally in 2011, almost two thirds were deaths from NCDs (WHO, 2011). The morbidi-ty and mortality from NCDs are set to further increase over the next few decades, and for cancer, more than 20 million new cases are anticipated worldwide in 2025, with four fifths of the burden falling on low- and mid-dle-income countries (LMICs) (Bray, 2014). According to World Health Or-ganization (WHO) estimates in 2011, cancer is now the leading cause of death worldwide (Fig. 1.1).
In recognition of the rising bur-den, WHO Member States during the 65th World Health Assembly agreed to adopt a global target of a 25% re-duction in premature mortality from
Fig. 1.1. The 10 leading causes of death worldwide in 2011, for all ages and both sexes. COPD, chronic obstructive pulmonary disease. Source: Data compiled from the Global Health Observatory Data Repository (http://apps.who.int/gho/data/).
2
cancer and the other major NCDs (cardiovascular diseases, respiratory diseases, and diabetes) by 2025. An action plan and its monitoring frame-work have subsequently been adopt-ed to achieve the target (WHO, 2013).
NCD surveillance is critical to providing the information needed for policy and programme development, and to support the monitoring and evaluation of the progress made in implementing NCD policies and pro-grammes. Cancer registries are the only disease-specific registries that are in use for NCDs and are there-fore of pivotal importance not only in assessing the cancer burden but also in measuring the impact of interven-tions in cancer prevention and control. Population-based cancer registries (PBCRs) are thus a unique source of information for research and pub-lic health programme monitoring. In implementing the NCD action plan, WHO is mandated to report back on progress towards achieving the nine global targets in 2015, 2020, and 2025. The monitoring of indicators in the WHO Medium-Term Strategic Plan is linked directly to the indicators and targets agreed by Member States at the 66th World Health Assembly
(http://apps.who.int/gb/ebwha/pdf_files/WHA66/A66_9-en.pdf).
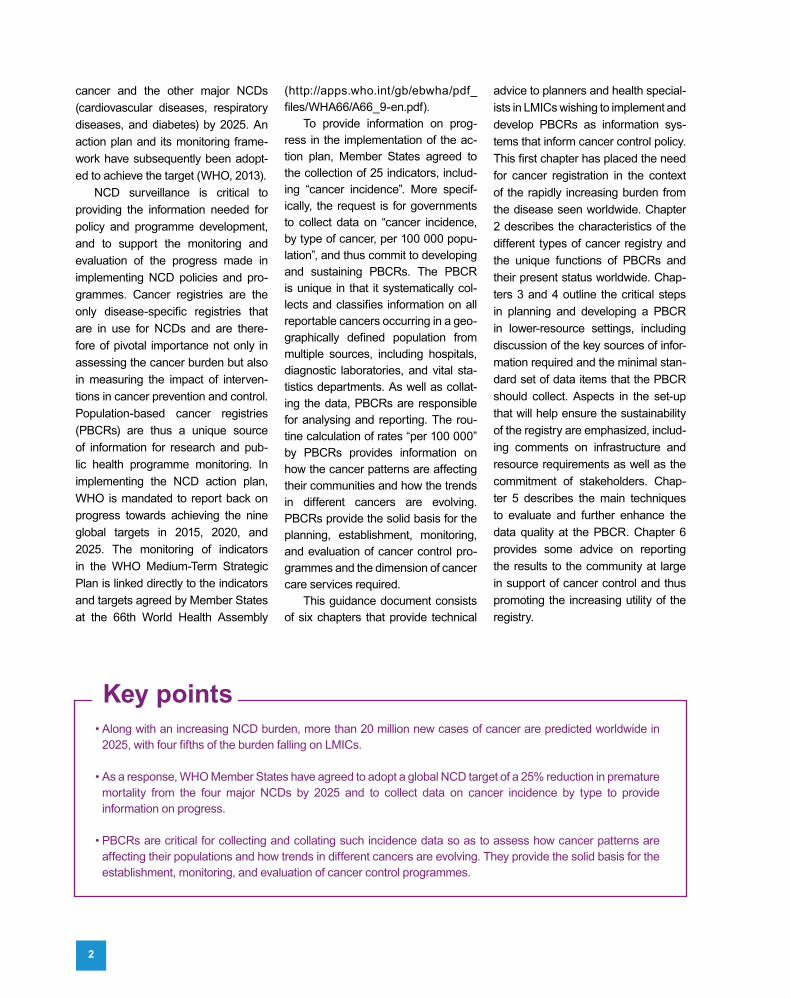
To provide information on prog-ress in the implementation of the ac-tion plan, Member States agreed to the collection of 25 indicators, includ-ing “cancer incidence”. More specif-ically, the request is for governments to collect data on “cancer incidence, by type of cancer, per 100 000 popu-lation”, and thus commit to developing and sustaining PBCRs. The PBCR is unique in that it systematically col-lects and classifies information on all reportable cancers occurring in a geo-graphically defined population from multiple sources, including hospitals, diagnostic laboratories, and vital sta-tistics departments. As well as collat-ing the data, PBCRs are responsible for analysing and reporting. The rou-tine calculation of rates “per 100 000” by PBCRs provides information on how the cancer patterns are affecting their communities and how the trends in different cancers are evolving. PBCRs provide the solid basis for the planning, establishment, monitoring, and evaluation of cancer control pro-grammes and the dimension of cancer care services required.
This guidance document consists of six chapters that provide technical
advice to planners and health special-ists in LMICs wishing to implement and develop PBCRs as information sys-tems that inform cancer control policy. This first chapter has placed the need for cancer registration in the context of the rapidly increasing burden from the disease seen worldwide. Chapter 2 describes the characteristics of the different types of cancer registry and the unique functions of PBCRs and their present status worldwide. Chap-ters 3 and 4 outline the critical steps in planning and developing a PBCR in lower-resource settings, including discussion of the key sources of infor-mation required and the minimal stan-dard set of data items that the PBCR should collect. Aspects in the set-up that will help ensure the sustainability of the registry are emphasized, includ-ing comments on infrastructure and resource requirements as well as the commitment of stakeholders. Chap-ter 5 describes the main techniques to evaluate and further enhance the data quality at the PBCR. Chapter 6 provides some advice on reporting the results to the community at large in support of cancer control and thus promoting the increasing utility of the registry.
• Along with an increasing NCD burden, more than 20 million new cases of cancer are predicted worldwide in 2025, with four fifths of the burden falling on LMICs.
• As a response, WHO Member States have agreed to adopt a global NCD target of a 25% reduction in premature mortality from the four major NCDs by 2025 and to collect data on cancer incidence by type to provide information on progress.
• PBCRs are critical for collecting and collating such incidence data so as to assess how cancer patterns are affecting their populations and how trends in different cancers are evolving. They provide the solid basis for the establishment, monitoring, and evaluation of cancer control programmes.
Key points

Chapter 2. The role and status of population-based cancer registration 3
Population-based cancer registra-tion represents the gold standard for the provision of information on can-cer incidence in a defined population; PBCRs can serve to identify possible causes of cancer in the community and to assess the impact of cancer control activities. A functioning health care system is, however, of critical im-portance to achieve full case ascer-tainment and an unbiased picture of the true cancer burden.
Fig. 2.1 compares present levels of the national Human Development Index (HDI) (Fig. 2.1A) versus avail-able sources of cancer incidence (Fig. 2.1B) and mortality (Fig. 2.1C) data. Cancer incidence and mortal-ity data are more commonly avail-able in countries that have attained high or very high levels of HDI; such countries have a longer history of rea-sonably complete national mortality statistics, and many have developed
either a national PBCR or one or more regional PBCRs over the past de-cades, notably during the 1970s and 1980s. In such settings, the activities of PBCRs have developed far beyond the basic role of estimating rates and comparing cancer profiles in different populations (Parkin, 2006). Registries expand their range of activities as they develop, undertaking studies of cancer causes and prevention, and providing the information required in planning and evaluating cancer con-trol programmes (see Box 2.1).
The situation is different for coun-tries presently categorized as having low or medium HDI. In many of these areas of the world, most notably in sub-Saharan Africa and South Asia, both vital registration and PBCR sys-tems of reasonable quality have been slower to emerge.
1. What is the status of population-based cancer registration worldwide?
The concept of population-based cancer registration has been in ex-istence for well over half a century, with the first PBCR founded in the 1930s. Currently, there are more than 700 PBCRs worldwide, although their pace of development has been much slower in LMICs than in high-income countries. This reflects a shortage of human and financial resources in LMICs, rather than a lack of awareness of need. The Cancer Incidence in Five Continents (CI5) series (http://ci5.iarc.fr) published by IARC and the International Associ-ation of Cancer Registries (IACR) is regarded as the definitive source of high-quality cancer incidence data, and in Volume X published incidence data for the period circa 2003–2007.
chap te r 2.
The role and status of population-based
cancer registration
CH
AP
TER
2

4
Although there is a substantial dis-parity between high-HDI countries and low- or middle-HDI countries in coverage in CI5 (e.g. almost complete coverage in North America com-pared with < 10% in South America, Asia, and Africa), the circumstances are less bleak when it is considered whether cancer information is avail-able and can be built upon in a given country in these regions.
A series of IARC Regional Hubs for Cancer Registration in Africa, Asia, and Latin America have been established and will be the first point of call for countries within the respec-tive regions. The Hubs in liaison with IARC develop specific tools in support of registries to:• assess cancer registry quality, publi-
cation, and presentation of data• assess capacity for registry devel-
opment and evaluate the quality of existing registries
• monitor overall progress in expanding coverage of cancer registration
• coordinate the development, fol-low-up, and evaluation of formal agreements between individual can-cer registries and IARC, covering specific activities consistent with the needs and recommendations and a time-limited plan
• coordinate research projects, includ-ing the development of monographs in collaboration with IARC, includ-ing continental reports based on all available registry data in the Hub region.
Currently, the registration status of the 138 countries within the six Hubs can be placed into one of five catego-ries, as indicated in Fig. 2.1B:
Grade I. High-quality PBCRs (in-cluded in CI5 Volume X) and nation-ally representative (registries withcoverage of ≥ 50% of the country’s population)
Grade II. High-quality PBCRs (included in CI5 Volume X) and re-gionally representative (< 50% cover-age)
Grade III. National or regional registries that are, or are close to be-coming, population-based (rates can be calculated)
A
C
B
Fig. 2.1. Global maps depicting (A) the development level of individual coun-tries, according to the four-level Human Development Index (HDI), based on quartiles, for 2012; (B) status of population-based cancer registries (PBCRs), as of mid-2013; (C) status of vital registration systems, as of mid-2013. Source for A, B: Data compiled from the United Nations Development Programme.
Low HDIMedium HDIHigh HDIVery high HDI
I High-quality PBCR (national)II High-quality PBCR (regional)III PBCR (national or regional)
1 High-quality complete vital registration2 Medium-quality complete vital registration3 Low-quality complete vital registration4 Incomplete or sample vital registration5 Other sources (cancer registries, verbal autopsy surveys, etc.)6 No data
IV Registration activityV No data/status unknown

Chapter 2. The role and status of population-based cancer registration 5
Box 2.1. Examples of the use of population-based cancer registries in cancer control. Source: Adapted from Parkin (2006), by permission from MacMillan Publishers Ltd, copyright 2006.
The World Health Organization (WHO) notes that population-based cancer registries (PBCRs) are a core component of cancer control strategy (WHO, 2011). There are important roles for PBCRs in esti-mating the current cancer burden, examining recent trends, and pre-dicting their probable future evolu-tion. The scale and profile of can-cer can be evaluated in terms of incidence and mortality, but other dimensions are often considered, including prevalence, person-years of life lost, and quality- or disabili-ty-adjusted life years. An appraisal of the current situation provides a framework for action, and cancer control planning should include the setting of explicit targets, which per-mits the success (or otherwise) of interventions to be monitored.
Primary preventionThe effectiveness of preventive interventions against cancer has rarely been evaluated by random-ized controlled trials; more usually,
success has to be inferred from observations after the introduction of programmes. This can involve comparing observed versus ex-pected incidence rates (allowing for a time lag for the effects to emerge), with the expected rates based on a prediction model of some kind. This approach can be used, for example, to evaluate the success of interven-tions against tobacco smoking, and to assess the observed and expect-ed impact of national implementa-tion of the hepatitis B and human papillomavirus (HPV) vaccines.
Early detection and screeningCancer registry data have been used widely in the evaluation and moni-toring of screening programmes. Where there is no information on the screening status of individuals, time trends can be examined, in terms of incidence, for cancers for which screening should prevent inva-sive disease (e.g. cervical cancer), or mortality, for programmes that
are designed to detect early inva-sive cancers (e.g. breast, colon, and prostate cancer). No reduction in incidence should occur in pro-grammes detecting early invasive cancers; indeed, the introduction of screening should bring about a rise in incidence (as prevalent, asymptomatic cases are detected), followed by a fall, with cumulative incidence unchanged over what it would have been without screening.
Evaluating cancer careAlthough essential as a measure of the success of cancer control activities in different populations, trends in mortality rates are not ide-al, as they are influenced by both incidence and survival. The objec-tive of measuring population-level survival is to give an indication of the possible role of the process of diagnosis and care, and not simply the effectiveness of a specific treat-ment, as a determinant of survival differences.
Grade IV. Registration activity: hospital- and/or pathology-based systems (rates cannot be calculated), or documented evidence of efforts to establish a PBCR
Grade V. No data available, or status of registration unknown.
1.1 Countries graded as I or II
Countries with high-quality PBCRs (graded as I or II) may appear to need less support from IARC and the Hubs, yet empirically, several flagship regis-tries in LMICs deemed of high quality (e.g. included in a CI5 volume) have subsequently languished, and sus-tainability of high-quality data from well-functioning registries is an obvious concern. There is a need to develop within-country and regional networks
in support of the development of stan-dards of quality and comparability, and to foster collaborations between regis-tries. Staff from PBCRs graded as I or II in LMICs have unique experience and expertise to offer in support of the Hub activities, having successfully devel-oped PBCRs under similarly challeng-ing circumstances. Such experts are crucial in developing a roster of regional experts who collaborate with IARC and the Hubs as mentors and trainers, tak-ing part in site visits to registries in tar-geted countries, and joining the teach-ing faculty of regional courses.
1.2 Countries graded as III or IV
A particular aim of the Hubs is to raise registration quality standards in those countries where registration systems
are in place, or where there are local actions under way to develop these.The target for direct support is then those countries graded as III (national or regional PBCRs, including those close to becoming population-based) or IV (countries where hospital- and/or pathology-based systems are in place, or local efforts are under way to establish a PBCR). The focus is on building upon, enhancing, and extending existing registry activities and resources to invoke a significant change in the status of such cancer registries towards high-quality regis-tration. Actions include:• developing clearly defined opera-
tional procedures for registration• ensuring that a suitably trained and
appropriately skilled workforce is in place
CH
AP
TER
2

6
Table 2.1. Characteristics, purposes, and uses of different types of cancer registries
Hospital-based cancer registry Collects information on all cases of cancer treated in one or more hospitals
Useful for administrative purposes and for reviewing clinical performance
NO. An incomplete and biased sample of the population. Data set is based on patient attendance at given hospital or hospitals. Cancer profile is determined by referrals, in part based on the facilities and expertise within key institutions.
Pathology-based cancer registry Collects information from one or more laboratories on histologically diagnosed cancers
Supports the need for laboratory-based services and serves as a quick “snapshot” of the cancer profile
NO. An incomplete and biased sample of the population. Data set is constructed from laboratory-based surveillance only. Cancer profile determined by cancers for which tumour tissue investigations were undertaken.
Population-based cancer registry Systematically collects information on all reportable neoplasms occurring in a geographically defined population from multiple sources
The comparison and interpretation of population-based cancer incidence data support population-based actions aimed at reducing the cancer burden in the community.
YES. The systematic ascertainment of cancer incidence from multiple sources can provide an unbiased profile of the cancer burden in the population and how it is changing over time. These registries have a unique role in planning and evaluating cancer control programmes.
Registry type Characteristics PurposeCan this type of registry be used in formulating cancer plans?
• establishing robust links with all the clinical services where cancer pa-tients are diagnosed and treated
• ensuring that relevant ministries and other officials commit to a sus-tained support of registry activities and build population-based cancer registration into their cancer control strategies.
1.3 Countries graded as V
In large countries with ambitious plans but no cancer registration systems in place at present (graded as V), there may be opportunities for high-level negotiations to enable an internation-al task force of surveillance experts to participate in a timetabled set of ini-tial and follow-up visits, as a means of accelerating the development of a registry programme.
2. Essential differences between population-based cancer registries and other types of cancer registry
PBCRs systematically collect infor-mation on all reportable neoplasms occurring in a geographically defined population from multiple sources. There are two other important types of cancer registry with different func-tions than PBCRs: hospital-based cancer registries (HBCRs) compile data on cancer cases diagnosed and/or treated in a defined institution or institutions, and pathology-based cancer registries record cancer cases diagnosed in pathology laboratories, mostly based on histopathology or cy-tology reports. Depending on how the care system is organized, data on a more or less biased subgroup of can-cer patients are thus collected.
HBCRs have been developed in many LMICs, particularly in Asia and Latin America, often at the initiative of dedicated clinicians. They serve a range of purposes, providing, for ex-ample, information about the diagno-sis and treatment of patients in rela-tion to specific tumour characteristics and their clinical outcome. The data from HBCRs and pathology-based systems are an integral part of hos-pital and laboratory management, respectively, by serving administra-tive purposes and aiding the review of performance.
The purposes of and fundamental differences between hospital-based, pathology-based, and population- based cancer registries are summa-rized in Table 2.1. Perhaps owing to their relative ease of establishment, a misconception has been perpetuated that HBCRs and pathology-based

7
• The roles of hospital-based, pathology-based, and population-based cancer registries are different and com-plementary. The first two types of registry serve important administrative and clinical functions, but only PBCRs provide an unbiased profile of the present cancer burden and how it changes over time. PBCRs have a unique role in planning and evaluating population-based cancer control actions aimed at reducing the cancer burden in the community.
• Although there is a lack of high-quality data in LMICs, as witnessed by the present lack of coverage in Cancer Incidence in Five Continents, the circumstances are more positive when one considers the cancer informa-tion available in many LMICs. Many countries have national or regional registries that aim to become popula-tion-based, and serve as a starting point from which the registration systems can be further developed.
• To support the local planning and development of PBCRs in countries within defined regions, a series of IARC Regional Hubs for Cancer Registration in Africa, Asia, and Latin America have been established. A tailored set of local activities in a given country are provided to increase the data quality, coverage, and utility of PBCRs in serving cancer control purposes.
Key points
Chapter 2. The role and status of population-based cancer registration
registries can function beyond their clinical, managerial, and administra-tive roles. Both types of system are of great value in providing a quality assessment of the services rendered, but they can deliver no clear picture as to the underlying local, regional,
or national epidemiology of cancer. As the collected data derive from either patient attendance at a giv-en hospital (HBCRs) or the number of cancers that have been biopsied (pathology-based systems), inclusion as a case is determined by the extent
of facilities and expertise available within the respective institutions. The aggregated cases recorded therefore comprise a subset of the total case load, and thus such systems have little utility in planning, monitoring, or evaluating cancer programmes.
CH
AP
TER
2


Chapter 3. Planning and developing a population-based cancer registry 9
chap te r 3.
Planning and developing a population-based
cancer registry
Establishing a new cancer registry requires collective agreement on the need for, or at the least the desirability of, the enterprise. As the cancer regis-try responds to the requirements of a community and its health system, the key players in cancer control should be involved in backing the progress and ensuring the sustainability of the registry. The success of the opera-tion depends on the collaboration of clinicians, pathologists, and staff in administration in ensuring access to their data. There are many things to consider when planning a registry, as discussed in this chapter. But some components are absolutely essential () or highly desirable (✔) in ensuring the success of the venture.• In the institutional/professional do-
main:
a director: the individual who will take professional responsibility
for the registry, working together
with other stakeholders and su- pervising the staff
the medical specialists concerned with the diagnosis and treatment
of cancer: pathologists and on-cologists (radiation, medical, and surgical)
✔ the directors of the major hospi-tals in the area served by the reg-istry
✔ departments dealing with reg-istration of deaths in the area served by the registry.
• As part of the political/administrative framework:✔ the health department of national
or local government concerned with planning and managing ser-vices for cancer treatment and prevention
✔ inclusion of the cancer registry as part of the health information sys-tem of these departments.
At the outset, it is very important that all of the key stakeholders, who will be concerned with the registry as data providers or users, are aware of, and agree with, the concept of a PBCR, as it has been described in Chapters 1 and 2. Briefly:• The cancer registry must collect in-
formation on every case of cancer identified within an agreed popula-tion (of a defined geographical area).
• Within the defined geographical area, the registry will be able to dis-tinguish between residents of the area and those who have come from outside the area.
• The registry will register cases of cancer in residents treated outside the area.
• The registry must have sufficient in-formation on each case to avoid reg-istering the same case twice (which implies including personal informa-tion, including names).
CH
AP
TER
3

10
• The registry must have access to all sources within the area where cancer patients are diagnosed and cared for.
The precise requirements for a cancer registry depend to a large extent on the local circumstances with respect to the level of develop-ment of medical services (diagnostic, therapeutic, and palliative) for cancer patients, the size and geographical dispersion of the population, and the resources – material and financial – available. Some basic principles were summarized in Cancer Registration: Principles and Methods (Jensen and Whelan, 1991; see Box 3.1).
1. The population
1.1 The population covered (“target population”)
The most basic decision to be made is to define the population covered by the registry: the “target” population in which cancer cases are occurring that the registry will enumerate. The issue of choosing a local or regional popu-lation, rather than the entire national population, for countries with a popu-lation of more than 4 or 5 million is an important issue to decide upon at the outset. The population covered by the registry may be the entire population of the country (or province), but more often it is just part of it – a “sample”, or one or more “sentinel sites” from which inferences (estimates) of what is going on in the whole population can be made.
The ideal solution to cancer sur-veillance might seem to be to develop a national PBCR with a catchment population comprising the entire country, yet in practice this is usual-ly an unrealistic prospect. Either it is technically unfeasible, or the cost in-volved greatly outweighs the benefits
Box 3.1. Requirements for a cancer registry.
Fig. 3.1. Benefits of increasing population coverage by cancer registration.
Conditions necessary to de-velop a cancer registry include generally available medical care and ready access to medical fa-cilities, so that the great majority of cancer cases will come into contact with the health care sys-tem at some point in their illness. There must also be a system for reporting clinical and pathologi-cal data, and reliable population data should be available. The cooperation of the medical com-munity is vital to the successful functioning of a registry. Plan-ning must allow for an adequate budget, since expenses tend to increase as time goes by, as well as the necessary personnel and equipment.
Zero
Con
side
rabl
e
Ben
efit
for c
ance
r con
trol p
urpo
ses
0 20 40 60 80 100
Percentage registration coverage
Opt
imal
additional to those obtained from reg-istration of a sample of the population.
In Fig. 3.1, the benefits of registra-tion (and associated representative-ness of the national profile) in support of cancer control and cancer research activities increase as registration cov-erage (and associated cost) increase. The benefits are immediate after the introduction of a regional PBCR, and ideally the registry area will be select-ed to ensure that statistics generated can be extrapolated beyond the con-fines of the catchment population. With further increments in coverage, the benefits increase only minimally. However, at the point of national cov-erage and heavy financial investment the benefits of registration are maxi-mized, enabling, as an example, an assessment of health service perfor-mance by local geographical area.
In summary, given the prohibitive costs involved, most of the require-ments for planning and monitoring can be achieved through registration of a subset (sample) of the national population, using one or more region-al PBCRs. The rolling out of a series
of PBCRs is becoming increasing-ly common in LMICs, as a means to have representative cancer data that account for the underlying inter-re-gional and urban–rural demographic and epidemiological differences.

Chapter 3. Planning and developing a population-based cancer registry 11
etc.) for which information on the size and composition of the population is available – the denominator for calculation of incidence rates.
1.2 Population denominators
“Population at risk” figures are used as denominators in the formulae for the calculation of incidence rates. The registry must have available estimates of the size of the popula-tion covered, by sex and 5-year age group, and, where there are impor- tant subgroups within the popula-tion (e.g. by race/ethnicity), for these strata also. Such data come from censuses, which are held at infre-quent intervals (usually no more of-ten than every 10 years). Between censuses, the population is estimat-ed (intercensal estimates), as it is for the years following the most recent census (postcensal estimates). The latter are likely to be more specula-tive. Some of the issues involved in preparing such estimates have been described elsewhere (Pottier, 1992). However, the registry may find it preferable to rely on estimates pre-pared by official bodies, presumably staffed by appropriate experts, such as national or local government sta-tistics offices.
It is important to remember that the accuracy of the incidence rates reported by the registry depends not only on the completeness and validity of the data it collects on cancer cases (see Chapter 5) but also on the accu-racy of the “population at risk” data. Also, population estimates are likely to change over time; in particular, es-timates that were based on postcen-sal projections often undergo quite drastic revisions when new census counts become available. This means that that some published incidence rates will have to be revised in later publications.
The choice of which local or re-gional population to register is dic-tated by practical considerations, rather than the ideal of an area (or areas) likely to be “representative” of the whole country. Thus, the area covered should have well-developed (by local standards) diagnostic and treatment services for cancer. Thus, it will attract cancer patients from outside the area (for diagnosis or care), and only few of its residents are likely to go outside the area for such services. For the cancer regis-try, it is very much easier to identify (and exclude from some calculations) non-residents diagnosed and treated in local hospitals than it is to try to find residents who have gone outside the area for their cancer care. Normally, then, the registry will be in an area where there are teaching hospitals, specialist oncology services, and pathology laboratories – that is, a major urban centre (usually including the capital city).
This major practical constraint on the choice of registration area will dictate the size of the population to be registered, as well as any theory as to what size is “ideal”. Thus, some cancer registries must cover much bigger populations than might be thought reasonable (the Mumbai Cancer Registry covers a population of about 13 million), while others might be very small, and so record rather few cases each year (the Seychelles National Registry covers a population of only 90 000;http://afcrn.org/membership/mem bers/96-seychelles).
How much of the rural hinterland of the urban area to include depends upon the nature of the administrative divisions in the country, and on prac-tical considerations, such as the size of the population and the distances involved. In any case, the registry area should conform to an admin-istrative unit (city, district, province,
2. Personnel
2.1 Director
In establishing the cancer registry, the most important element is the leadership of a motivated and re-spected director. A director will com-monly (but not always) be medically trained, and will need to provide spe-cialist advice on, for example, pathol-ogy, clinical oncology, epidemiology, and statistics (either personally or through colleagues).
2.2 Technical staff
Adequate staffing of the registry must be ensured from the outset and is dependent on the number of new cases expected annually, the data sources, and data collection proce-dures. In a large registry covering a population of several million, staff can be allocated to perform specific tasks, such as case finding and ab-stracting, coding and data entry, data analysis, software maintenance, and presentation of the results, whereas in a small registry the staff (some-times only one person) will perform multiple functions. Staff skills are not limited to the technical aspects of registration but involve considerable personal and communication skills in liaising with staff and colleagues from medical institutions and other sources.
2.3 Training of staff
In particular in LMICs, the quality of the cancer registry data will be high-ly dependent on the qualifications of the registry staff and their technical competence. Cancer registration de-mands specific training, mostly on the job. Formal training courses and use of standard manuals for cancer registrars are recommended to avoid the establishment of individualized practices by single staff members,
CH
AP
TER
3

12
as well as individualized practices by single registries deviating from stan-dard procedures (see links below).
There are a few training resourc-es for staff of registries in LMICs:• The IARC–IACR Manual for Can-
cer Registry Personnel (Esteban et al., 1995) is available from the IARC website (http://www.iarc.fr/en/publications/pdfs-online/treport-pub/treport-pub10/index.php).
• A useful training manual, Patholo-gy of Tumours for Cancer Registry Personnel (Buemi, 2008), is avail-able from the IACR website (http://www.iacr.com.fr/PathologyManual Apr08.pdf). It explains in simple terms the genesis of tumours and the techniques used for pathological diagnosis, and contributes to the un-derstanding of the terminology used.
• The Surveillance, Epidemiology, and End Results (SEER) Program of the USA provides many training materials, including some interactive training opportunities via the Internet (http://seer.cancer.gov/); however, these are not always well adapted to the circumstances of smaller regis-tries in LMICs.
3. Physical location of the registry
The physical location of the cancer registry will generally be determined by its administrative dependency. The precise location, whether in a hospi-tal department, university or research institute, government department, or the offices of a nongovernmental or-ganization, is less important than its functional linkage with government health services and professional groups. In any case, the registry (gen-erally through the director) should have the authority – administrative or professional – to be able to request and obtain detailed clinical informa-tion on cancer cases from medical services in the region. It is therefore advisable that the registry be linked
in some way with government health services (which may also facilitate access to official statistics databas-es, such as mortality and population data) and with professional groups. A location in a hospital (or pathology laboratory) might allow better access to clinical data and input from health professionals. Regardless of the loca-tion of the registry, it should maintain sufficient autonomy to facilitate co-operation with other health agencies and collaboration at both the national and international levels.
4. Equipment and office space
The office space required is obvious-ly related to the size of the registry, in terms of number of staff and the need for storage of paper documents (registration forms, pathology reports, etc.). All registries now require com-puter equipment. Even the smallest registry needs a good-quality desktop computer, with an Internet connec-tion, for running the registry man-agement system (e.g. CanReg5; see Annex 1), as well as other standard software. The number of machines required is dependent on the size of the registry and the number of opera-tors for data entry and analysis. Other essential equipment includes at least one printer/scanner/photocopier, as well as, depending on local electricity supplies, a voltage stabilizer or emer-gency power source.
5. Finance
The costs of cancer registration de-pend on the size and population of the registration area, the number and type of different data sources, the number of data items collected, and the data collection methods. These will determine the number of staff required and the costs incurred in data collection, which will be major budget items.
The United States Centers for Dis-
ease Control and Prevention (CDC) has collected cost data and conduct-ed economic analysis and an evalu-ation of the National Cancer Registry Program (NCRP) in the USA (Tang-ka et al., 2010). The true cost of op-erating cancer registries is unknown in LMICs, although the CDC has been validating a registry costing tool based on collaborations with several registries in Kenya, India, and Colom-bia. The aim is to aggregate cost for each registry activity based on staff salaries, consultancies, computers, travel, and training. The cost per case can then be calculated for core and advanced activities, and factors that affect cost can be further explored.
The elements that need to be to be considered when planning the budget for a cancer registry are shown in Box 3.2.
When planning a longer-term bud-get, it should be considered that the costs of the cancer registration pro-cess may increase over time as the registry expands its range of activities (e.g. to include follow-up of registered cases).
6. Legal aspects and confidentiality
It is advisable to ensure the legal basis for the operation of cancer registration in a given jurisdiction. Data confiden-tiality laws vary from country to coun-try and should be taken into account when planning the cancer registry. In the setting of medical research, stor-age of medical data on identifiable individuals usually requires their in-formed consent. It is not possible for cancer registration to function under such a constraint. Cancer registries do not collect information from pa-tients but rely on secondary sources, and thus asking for informed consent is impossible. Individual patients must be identifiable, at the very least to permit notifications of the same can-cer from different sources, or different

Chapter 3. Planning and developing a population-based cancer registry 13
time periods, to be linked in a single record. The value of a cancer regis-try in medical research is enormously enhanced if it can be used to identify cancers occurring in defined groups of subjects (cohorts), a procedure that also requires individual identification.
The cancer registry is an im- portant tool in public health; without it, strategies for cancer control would be greatly hampered. A useful analogy is the notification of infectious diseases, which is so important in their control. As for infectious diseases, provision should be made for cancer to be a reportable disease. While this pro-vides the necessary legal framework and may help with the number of can-cer cases notified to the registry by clinical staff, mandatory reporting does not guarantee data quality or completeness of reporting. It does, however, provide some legal protec-tion for data owners (hospital admin-istrations, records officers, directors of private hospitals) who may be oth-
erwise concerned with the ethics, or legality, or permitting cancer registry staff access to the data they require.
Cancer registries have been concerned about the production of a code of confidentiality for the pur-pose of recording data on cancer. IARC–IACR have published Guide-lines on Confidentiality for Popu-lation-Based Cancer Registration (available from the IACR website; http://www.iacr.com.fr/confidentiality 2004.pdf). The basic principles of confidentiality are presented, as well as a set of measures from which a registry may select those appropriate for their local codes of practice. Al-though the publication is primarily adapted for European registries, it contains useful guidance for LMICs, for example on measures that the registry can use to safeguard con-fidential information, and on the de-velopment of guidelines and proce-dures for the release of registry data.
7. Advisory committee
The importance of involving all rele-vant stakeholders in planning a reg-istry has already been emphasized. Their continued involvement in its operation should be ensured when establishing an advisory committee for the registry. The relevant stake-holders will vary according to local circumstances, but in any case, it is important that the advisory com-mittee consist of members from the public health, clinical, and academic communities, as the major users of the cancer registry data. Coopera-tion and involvement of clinicians, as the main providers of cancer registry data, is particularly important. If other groups such as cancer societies, hos-pice care services, and patient asso-ciations operate within the registration area, representatives of these stake-holders should be involved as well.
The role of the advisory commit-tee is to oversee the activities of the registry, including formulating policies for staff recruitment and training, re-viewing the results of the registry and ensuring that they are available to de-cision-makers as well as researchers, and helping to solve operational prob-lems. The committee members may also provide assistance and contacts in efforts to attract funding to sustain or further develop activities at the registry. The committee may wish to establish subgroups, to deal with, for example, written requests for access to registry data. Working closely with the responsible programme owners in developing the registry programme and enquiring as to their needs can also be important in gaining funding support and obtaining local “buy-in” in the use of the data for cancer control.
Box 3.2. Elements for planning the cancer registry budget.
1. Capital costs (one-off) • Office space and equipment/furnishings • IT equipment (computers, printers, Internet link, etc.)
2. Recurring costs • Salaries o Direct: registry staff (full-time or part-time) o Indirect: allowances for part-time/contract work • Running costs o Travel expenses (in particular for active data collection) o Rental/maintenance (including costs of water,
electricity, etc.) o IT equipment maintenance/replacement o Consumables (office material) o Publishing reports and/or establishing and maintaining the
registry website
3. Training/workshops Funding can be sought on an ad hoc basis once the registry is
established.
CH
AP
TER
3

14
• Given the prohibitive costs involved, most of the requirements for planning and monitoring can be achieved through registration of a subset (sample) of the national population, using one regional PBCR or a series of regional PBCRs.
• At the outset, it is very important that all of the key stakeholders, who will be concerned with the registry as data providers or users, are aware of, and agree with, the concept of a PBCR.
• The key players in cancer control should be involved in backing the progress and ensuring the sustainability of the registry. Success depends on the collaboration of clinicians, pathologists, and staff in administration in ensuring access to their data.
• The cancer registry must collect information on every case of cancer identified within a defined geographical area and be able to distinguish between residents of the area and those who have come from outside the area.
• In planning a PBCR, there are many things to consider, including the definition of the population, the necessary personnel, the physical location of the registry, the equipment and office space required, adequate financing, ensuring that legal aspects and confidentiality are dealt with, and – last but not least – the appointment of an advisory committee to oversee the activities of the registry.
Key points

Chapter 4. Sources of information for the population-based cancer registry 15
chap te r 4.
Sources of information for the population-based
cancer registry
A key feature of the PBCR is the use of multiple sources of information on cancer cases in the target popula-tion. This facilitates the identification of as many as possible of the cases diagnosed among the residents of the registry area. It does not matter if information on the same cases is received from several sources (in-deed, as described in Chapter 5, this feature of a PBCR may be used to evaluate its success in case finding). Registry procedures allow identifica-tion of the same cancer case from different sources (while avoiding du-plicate registrations); this is a built-in feature of the CanReg5 software (see Annex 1).
1. Sources of information on cancer cases
The sources can be grouped into three broad categories, each of
which is discussed below: • hospitals• laboratories• death certificates.
1.1 Hospital sources
The registry should attempt to iden-tify all cancer cases that are di-agnosed or treated in hospitals or clinics in the registry area. The insti-tutions concerned will vary depend-ing on location, but it is important to identify and enumerate them all, and the likely number (and type) of cancer patients seen in each. If there are special cancer treatment facili-ties (medical/surgical oncology, ra-diotherapy), their contribution to the registry is essential. Often, such ser-vices maintain a register of cases di-agnosed, treated, or under follow-up.
Most other hospital services will see cancer patients, although
the proportion of cases that are malignant disease will vary depend-ing on the specialty. If there is a hos-pital information system, from which patients plus their diagnoses can be abstracted, the registry will use this as the primary case-finding mecha-nism. Even without a computerized hospital information system, the medical records department may maintain manual indexes of hospital discharges, which can be sorted by diagnosis. When there is no central information system, the work of the registry is more laborious and may involve visits to individual clinical services.
Private hospitals or clinics tend to be smaller than the larger public hospitals, and may not have spe-cialist treatment facilities for cancer. Nevertheless, they may be important to include among the data sources, if identification of cancer patients
CH
AP
TER
4

16
among their clientele is relatively easy. Confidentiality issues (real or imagined) with respect to collabora-tion with the cancer registry may be raised by the owners.
Hospice and palliative care ser-vices are very important sources. The great majority of their clients are cancer patients, documentation of diagnosis is usually good, and follow-up until death is the norm (in-deed, the purpose).
1.2 Laboratory services
The pathology laboratory is a key – indeed, essential – source of data. For most cancer patients, the defin-itive diagnosis is based on histology (although the proportion of cases for which the tumour is examined by the pathologist depends on the site/type of cancer). Pathology laboratories always keep a record of their work in the form of a register – often as a computerized database, but even paper registers are easy to scan for cancer diagnoses. However, the lab-oratory will often be dependent on the request form, which accompa-nies the specimen, for information on the cancer patient. These, in turn, may contain inadequate information or be badly completed – especially with respect to place of residence. This variable is essential to the PBCR, and special effort is need-ed to find the information for cases found via the laboratory.
Other laboratory services are less fruitful sources, although clini-cal haematologists (rather than pa-thologists) are generally responsi-ble for examination of bone-marrow specimens (and hence for diagnosis of haematological malignancies). Among the medical imaging ser-vices, only magnetic resonance im-aging (MRI) and computed tomogra-phy (CT) scans have a high enough yield of cancer cases to be worth considering as sources of data.
Their utility depends on the ease with which cancer cases can be identified among the lists of patients examined.
1.3 Death certificates
Information on persons dying from (or with) cancer is a very important source of case data for the registry. This information may be from civil registration systems (where “cause of death” is recorded by a medical prac-titioner on a death certificate), even if this process is incomplete (in the sense that not all deaths are certified). The correct assignment and coding of cause of death are often a problem in civil registration systems in LMICs. In many lower-income countries, death registration is confined to deaths in hospital (with no medical certification for deaths occurring at home); even these limited data should be exploited by the registry.
Identifying individuals dying from (or with) cancer serves three purpos-es for the registry:• It allows identification of cancer
cases that had been “missed” by the data collection system.
• It allows the death of registered cancer cases to be recorded (used in calculation of survival).
• Knowledge of the numbers of cases first notified via a death reg-ister provides one method for esti-mating the completeness of cancer registration.
2. Data collection
Traditionally, a distinction is made between “passive” collection of data (relying on health workers to com-plete notification forms and forward them to the registry) and “active” methods, whereby staff of the can-cer registry visit the various sources to identify and abstract the relevant information. Registration that relies entirely on the diligence and goodwill of others to do the work of abstrac-
tion of information on cancer cases is never successful. Nevertheless, most registries use a mixture of methods, and although active case finding remains the norm, the de-velopment of computerized health information systems provides some scope to use electronic databases for case finding.
With an increasing number of computerized data sources avail-able, cancer registries are some-times put under pressure to abandon their traditional modes of operation. Whereas in the long term registries should develop a strategy to move from paper to digital data sources, it is a misconception to believe that cancer registry data can be auto-matically derived from the health information system. Regardless of the data sources and data collection methods used, skilled cancer reg-istry staff are required to produce high-quality incidence data. In some LMICs, the person-time available for cancer registration allows only for routine data processing and produc-tion of incidence data. Making use of data from health information sys-tems could enable such registries to spend less person-time on data en-try and allocate more time to quality control, data analysis, and possibly research.
3. Variables collected by the registry
Cancer registries set out to record data for a set of variables on each cancer case. There is a uniform tendency, when a cancer registry is planned, to aim for too many vari-ables. It must be remembered that the data are being collected from secondary sources (clinical and pa-thology records, hospital discharge abstracts, death certificates) and NOT from the patients themselves. Thus, items of information that are not routinely available in these

Chapter 4. Sources of information for the population-based cancer registry 17
sources should be avoided. This applies especially to items of infor-mation that can be reliably recorded only by interviewing the patient (risk factors such as tobacco and alco-hol use, diet, etc.), as well as those likely to be recorded in only a subset of cases (and not a random subset, at that), such as occupation or HIV status. As a general rule, unless reli-able information can be collected on 80–90% of cases, the item should not be included in the registry data set. Some variables, although easy to capture, are of little relevance and are also best avoided (e.g. marital status). In Cancer Registration: Prin-ciples and Methods, a set of 10–11 essential variables is proposed (Ta-ble 4.1), and it is true that no cancer registry could function with less than this, so that these might be consid-ered the minimum data set.
However, a reasonable list of essential variables is more sub-stantial than this. Table 4.2 is based on the recommendations of the
European Network of Cancer Registries (http://www.encr.eu/ images/docs/recommendations/ recommendations.pdf).
There are many optional vari-ables that might also be included, depending on specific local interests, bearing in mind considerations of the availability of the items of information in the data sources, as described above.
4. Coding
Several of the variables listed require coding, to facilitate analysis. For a number of the variables, standard, international coding schemes are available, and cancer registries should use them so that comparison of results between registries is possible.
The most important are the cod-ing of the tumour (site, histology, behaviour, basis of diagnosis), using the International Classification of Dis-eases for Oncology (ICD-O), and the coding of stage, using the tumour–node–metastasis (TNM) system.
In addition, local coding schemes will be needed for:• place of residence• ethnic group (if recorded)• source of information.
4.1 Classification of cancers – International Classification of Diseases for Oncology
Now in its third edition, ICD-O has been used for more than 35 years as the standard tool for coding diagnoses of neoplasms in cancer registries.
ICD-O is a multi-axial classifi-cation of the site, morphology, be-haviour, and grading of neoplasms (and, in addition, it provides standard codes for the basis of diagnosis).
The topography code describes the site of origin of the neoplasm (the primary site, not the location of any metastasis) and uses the same three-character and four-character categories as in the neoplasm sec-tion of Chapter II of the International
Table 4.1. Basic information for cancer registries
Item Comments
The personPersonal identificationa
Name According to local usage Sex Date of birth or age Estimate if not knownDemographic Address Usual residence Ethnic groupb When population consists of two or more groups
The tumour Incidence date Most valid basis of diagnosis Topography (site) Primary tumour Morphology (histology) Behaviour Source of information For example, hospital record number, name of physician
a The minimum information collected is that which ensures that if the same individuals are reported again to the registry, they will be recognized as being the same person. This could also be a unique personal identification number.b Ethnic group is included here because it is important for most registries, especially in developing countries.Source: MacLennan (1991).
CH
AP
TER
4

18
Statistical Classification of Diseases and Related Health Problems, 10th Revision (ICD-10) classification of malignant neoplasms (except for those categories that relate to sec-ondary neoplasms and to specified morphological types of tumours). ICD-O thus provides greater site de-tail for tumours than is provided in ICD-10. In contrast to ICD-10, ICD-O includes topography for sites of hae-
matopoietic and reticuloendothelial tumours (as well as other cancers that, in ICD-10, are defined by histol-ogy, such as Kaposi sarcoma, mel-anoma, and sarcomas of soft tissue and bone).
The morphology axis pro-vides five-digit codes ranging from M-8000/0 to M-9989/3. The first four digits indicate the specific his-tological term. The fifth digit, after
the slash (/), is the behaviour code, which indicates whether a tumour is malignant, benign, in situ, or uncer-tain (whether benign or malignant).
A separate one-digit code is also provided for histological grading (differentiation).
The International Classification of Diseases for Oncology, 3rd Edi-tion (ICD-O-3) book has five main sections. The first section provides
ENCR, European Network of Cancer Registries; ICD-O, International Classification of Diseases for Oncology; TNM, tumour–node–metastasis.Source: Recommendations for a Standard Dataset for the European Network of Cancer Registries (http://www.encr.eu/images/docs/recommenda tions/recommendations.pdf).
Table 4.2. Essential variables for cancer registries
Item Comments
The person Personal identification
Date of birth Sex Ethnic group Address including postal (or zip) code (and telephone number)
Sources of information Sources of information
Follow-up Last follow-up date Vital status (at last follow-up date)
Date of death
The tumour Incidence date Primary tumour site Laterality
Primary tumour histology Behaviour Basis of diagnosis
Stage – (condensed TNM)
Initial therapy (i.e. initiated within 4 months from incidence date) [A clear manual on what is included should be available from the registry for all treatment items.]
Surgery Radiotherapy Chemotherapy Endocrine (hormones)
In some countries a unique identification number, in others full name combined with date of birth and sexGiven as day, month, and year (dd/mm/yyyy)Male (M) or female (F)According to local situationNeeded for identification purposes and for geographically based studies
It is important to record ALL of the sources of information (hospital/institution) for each diagnosis and treatment modality in order to be able to do quality control, or to collect additional information. The relevant date and hospital/laboratory number are recorded for each.
Needed to study follow-up (dd/mm/yyyy)It may be of value to indicate whether known or assumed (e.g. based on linkages to death certificates) (dd/mm/yyyy)Needed to study survival and follow-up (dd/mm/yyyy)
This date should be given priority, as outlined by the ENCR recommendations.This should as a minimum be according to ICD-O.This should be recorded for all paired organs, but as a minimum for breast, eye, ovary, testis, and kidney (but observe the multiple primary rules).This should as a minimum be according to ICD-O.This should as a minimum be according to ICD-O.Most valid basis is recommended. All relevant methods may be recorded. The basis codes should be according to ICD-O.Stage is needed for international studies and for servicing clinicians. It is rec-ommended to use the ENCR condensed TNM.As a minimum the registries should be able to present on a yes/no basis the treatment modalities used.
Any surgical procedure of curative or palliative natureAny radiotherapy of curative or palliative natureAny cancer chemotherapy of curative or palliative natureExogenous therapy, i.e. medication

Chapter 4. Sources of information for the population-based cancer registry 19
general instructions for using the coding systems and gives rules for their implementation in tumour reg-istries and pathology laboratories. The second section includes the nu-merical list of topography codes, and the third section the numerical list of morphology codes. The combined alphabetical index provided in the fourth section gives codes for both topography and morphology and in-cludes selected tumour-like lesions and conditions. The fifth section pro-vides a guide to differences in mor-phology codes between the second and third editions of ICD-O.
To the greatest extent possible, ICD-O uses the nomenclature pub-lished in the World Health Organi-zation Classification of Tumours se-ries (“WHO Blue Books”). As these are revised, and new morphological terms introduced, new codes are prepared as updates/addenda to ICD-O, pending a fourth edition.
ICD-O has been published in a wide variety of languages (Chinese, Czech, English, Finnish, Flemish/Dutch, French, German, Japanese, Korean, Portuguese, Romanian, Span-ish, and Turkish). It can be purchased from WHO (http://www.who.int/clas sifications/icd/adaptations/oncology/en/) or from the International Associa-tion of Cancer Registries, for members of that organization. A CSV file can be downloaded from the WHO web-site (http://apps.who.int/classifications/apps/icd/ClassificationDownloadNR/login.aspx?ReturnUrl=%2fclassifi cations%2fapps%2ficd%2fClassi f icationDownload%2fDLArea%2f Download.aspx).
The IARC–IACR Cancer Reg-istry Tools (IARCcrgTools) package includes batch programs for con-version from ICD-O to ICD-10. The conversion and check programs can only process text files having a fixed field format, although a File Transfer option allows conversion of a text file from delimited to fixed field for-
mat. The IARCcrgTools package is available from the website of IACR or IARC (http://www.iacr.com.fr/iacr_iarccrgtools.htm).
4.2 TNM coding system
The Union for International Can-cer Control (UICC) TNM classifica-tion is the internationally accepted standard for cancer staging. It is an anatomically based system that re-cords the primary and regional nodal extent of the tumour and the absence or presence of metastases.
Each individual aspect of TNM is termed a category:• The T category describes the pri-
mary tumour site.• The N category describes the re-
gional lymph node involvement.• The M category describes the pres-
ence or otherwise of distant meta-static spread.
Cancer staging is important not only for clinical practice; it also pro-vides vital information for policy-mak-ers developing or implementing can-cer control and prevention plans, and it is therefore important to include the TNM classification as part of cancer registration.
The TNM classification is regu-larly updated and is now in its sev-enth revision.
The UICC website gives an ex-planation of the use of the TNM clas-sification system and how to obtain the relevant coding manuals (http://www.uicc.org/resources/tnm).
Cancer registrars in LMICs may have difficulty in abstracting the full TNM code from clinical records, if this has not been explicitly record-ed by the clinicians or pathologists. For this reason, a simplified version has been created by the European Network of Cancer Registries: the condensed TNM, available in En-glish and French (http://www.encr.eu/images/docs/recommendations/extentofdisease.pdf).
This version allows for recording of T and/or N and/or M when they have not been explicitly recorded in the clinical or pathological records. The cancer registry then attempts to score extent of disease according to the condensed TNM scheme:T: L A X N: 0 + XM: 0 + X(A, advanced; L, localized; X, can-not be assessed), where T and N are extracted, if possible, from the pathology report, or, in its absence, from the clinical record (endoscopy, X-ray, etc.). M is based on the best available information, whether clin-ical, instrumental, or pathological. For M, clinical signs and findings are enough to justify M+ in the absence of pathological confirmation of meta-static deposits.
Both the full TNM and the con-densed TNM allow tumour extent to be expressed according to the famil-iar numerical staging scheme:I Tumour localized (TL/N0/M0)II Tumour with local spread
(TA/N0/M0)III Tumour with regional spread
(any T/N+/M0)IV Advanced cancer (metastatic)
(any T/any N/M+).
4.3 Local coding schemes
4.3.1 Place of residence
“Place of residence” codes should correspond to national subdivisions of the population as they appear in national statistical publications and for which there is information avail-able on the size and composition of the population. It may be possi-ble to develop a hierarchical coding scheme, where there are several lev-els of population subdivision (region, province, district, city ward, etc.).
4.3.2 Ethnic group
“Ethnic group” codes should cor-respond, if possible, to any official
CH
AP
TER
4

20
• A key feature of the PBCR is the use of multiple sources of information on cancer cases in the target population. Registry procedures allow identification of the same cancer case from different sources (while avoiding dupli-cate registrations). The sources can be grouped into three broad categories: hospitals, laboratories, and death certificates.
• Most registries use a mixture of active and passive methods of case finding.
• The development of computerized health information systems may provide some scope to use electronic data-bases for case finding.
• Cancer registries set out to record data for a set of variables on each cancer case. There is a uniform tendency, when a cancer registry is planned, to aim for too many variables.
• There are some 17–20 variables that it is essential for a registry to collect on each case registered. Additional, “optional” variables should be kept to a minimum. Several of the variables listed require coding, to facilitate anal-ysis. Standard, international coding schemes are available for some variables, and cancer registries should use them so that comparison of results between registries is possible.
• The most important are the coding of the tumour (site, histology, behaviour, basis of diagnosis), using ICD-O, and the coding of stage, using the TNM system.
Key points
categories recognized in national statistical publications, especially if there is information available on the size and composition of the popula-tion, by ethnic group.
4.3.3 Source of information
The codes for “source of informa-tion” will almost always be specific to the cancer registry, and will have to be developed by the registry it-self. Careful thought should be given to developing a hierarchical coding scheme that will facilitate extraction of information (e.g. lists of cases) from the registry database, and trac-ing the records of lists of cases.
Thus, a coding scheme might aim to have different levels, such as:1. Type of source (hospital, diag-
nostic laboratory, death certifi-cate)
1.1. List of hospitals – public1.2. List of hospitals – private1.3. Hospices1.1.1. Clinical services (medicine,
surgery, radiotherapy, etc.).It is important, when develop-
ing the coding scheme, to allow for its expansion in the future, as new sources of case data are included, while respecting the structure of the coding scheme.
As noted above (Table 4.2), the registry will record the case record number, but unless it is clear to which hospital/service or laborato-ry this number refers, it will be very
difficult to trace the record if it is re-quired for extracting additional infor-mation, for correcting errors in the registry database, or for research purposes.
5. Information on the population at risk
As described in Chapter 3, the reg-istry should maintain a population file, which, for each calendar year, contains the population estimate for every combination of:• ethnic group (if applicable)• sex• age (standard 5-year age groups,
IF possible, separating infants [age, 0 years] from children [age, 1–4 years]) and including the numbers of persons of unknown age.

Chapter 5. Quality control at the population-based cancer registry 21
chap te r 5.
Quality control at the population-based
cancer registry
All cancer registries should be able to give some objective indica-tion of the quality of the data that they have collected. The methods available were described in an ear-ly IARC Technical Report (Parkin et al., 1994) and updated in a pair of papers in 2009 (Parkin and Bray, 2009; Bray and Parkin, 2009). They describe four dimensions of quality: comparability, validity, timeliness, and completeness.
1. Comparability
Comparability of the statistics gen-erated for populations and over time requires the standardization of practices concerning classification and coding of new cases, and con-sistency in definitions of incidence, such as rules for the recording and reporting of multiple primary cancers occurring in the same individual. The
standard for classification and cod-ing of cancer is ICD-O, published by WHO, which provides the standards for coding topography (location of the tumour in the body), morpholo-gy (microscopic appearance of the tumour), behaviour (whether the tumour is malignant, benign, or in situ), and grade (the extent of differ-entiation of the tumour). In addition to that, ICD-O-3 also provides a standard coding scheme for record-ing the basis of diagnosis and the IARC rules for coding multiple pri-mary cancers. As carcinogenesis is a process that can sometimes take decades, the definition of incidence date is arbitrary, and therefore it is of particular importance to follow the agreed standards. Rules for the defi-nition of incidence date have been given by the European Network of Cancer Registries (http://www.encr.
eu/images/docs/recommendations/recommendations.pdf).
In low- and middle-income set-tings, some objective obstacles might impede following the interna-tional standards. For example, the lack of coverage by pathology labo-ratories, or difficult access to diag-nosis, will reduce the percentage of morphologically verified cases, as well as result in postponement of the incidence date according to the stan-dard European Network of Cancer Registries recommendations, prior-itizing the date of the first histologi-cal or cytological confirmation of the malignancy as the date of incidence.
2. Validity
Accuracy of recorded data is great-ly enhanced by consistency checks carried out at the time of data en-try, such as those incorporated
CH
AP
TER
5

22
into CanReg (see Annex 1). Most registries will also, formally or infor-mally, check on the accuracy of the work of staff by carrying out some sort of re-abstraction (going back to one or more sources, to check on accuracy of recording) or recoding exercises, and acting to correct any obvious deficiencies.
Most registries will report on three statistics that have a bearing on the accuracy of the recoded data. They are:• the proportion (or percentage) of
cases with missing data• the percentage of cases with a
morphologically verified diagnosis (MV%)
• the percentage of cases for which the only information came from a death certificate (DCO%).
2.1 Proportion (or percentage) of cases with missing data
The proportion of cases with un-known values of different data items, such as age or stage, is also an in-dicator of data quality. An important element to assess here is the pro-portion of cases with primary site uncertain (PSU%). In addition to the ICD-O code for unknown primary site (C80.9), this category should also include other ill-defined sites.
Some data items can be very dif-ficult to collect in low- and middle-in-come settings. This can apply, for example, to personal identification number, which then results in more demanding and less accurate linkage procedures. Many LMICs share the problem of unavailability or low qual-ity of mortality data. This can pose numerous problems for a cancer registry, such as under-registration because of the lack of “death certif-icate only” (DCO) cases contributing to incidence, and inability to calculate the standard data quality indicators (apart from the percentage of cases
with a morphologically verified diag-nosis [MV%]). The only insight into completeness of cancer registration in the absence of mortality data can be provided by the independent case ascertainment or capture–recapture methods (described below).
2.2 Percentage of cases with a morphologically verified diagnosis (MV%)
Morphological verification refers to cases for which the diagnosis is based on histology or cytology. This is traditionally considered as a sort of “gold standard”, with suspicion fall-ing upon the accuracy of diagnosis by other means (although it is ques-tionable whether exfoliative cytology is always more accurate than MRI or CT scan). A high MV% is taken to mean accuracy of diagnosis, where-as a low MV% casts doubt on the va-lidity of the data.
The editorial checks of CI5 in-clude a formal comparison of the MV% (by sex, for the major cancer sites) with a “standard”, based on values observed in the same region 5 years earlier. Annex 2 provides the tables with “standard” values of se-lected data quality indicators, includ-ing MV% by country or region, which are used in the CI5 editorial process. Whereas a MV% significantly lower than the expected value may give rise to concern about a lack of valid-ity, it is generally not the cancer reg-istry that can influence the availabil-ity of, or use of, pathology services within its area. Usually, in LMICs, the opposite situation – a relatively high MV% – is cause for concern. Collecting data on cancer cases from pathology departments is much simpler than trawling through clinical services or ill-organized hospital archives. A large proportion of cases diagnosed via the pathology department may well suggest de-
fects in case finding and, hence, in- complete registration. Worse, the incompleteness will be biased, with the database containing a deficit of cancers that are not easy to biopsy (e.g. lung, liver, brain, and pancreatic cancer).
2.3 Percentage of cases for which the only information came from a death certificate (DCO%)
DCO cases are those registered on the basis of information on a death certificate, and for which no other information could be traced. As de-scribed earlier, the nature of death certificates in LMICs varies widely, from those issued as part of a civil registration of vital events to those generated in a hospital mortuary. However, almost always the accu-racy of the diagnostic information is questionable, since the person writ-ing out the certificate may have had little contact with the patient before death and may be ill-informed about how to record cause of death. Thus, if no other clinical record for persons who apparently died of (or with) can-cer can be found, there is a reason-able suspicion that the diagnosis was simply wrong. Nevertheless, registry practice demands that such cases are included, but when they comprise a large proportion of cas-es, the validity of the data is suspect.
Establishing objective criteria of an acceptable DCO% is difficult – it is sensitive to local circumstances, for example availability of death cer-tificates, success in record linkage to the registry database, quality of cause-of-death statements, and fa-cility to trace back cases.
2.4 Internal consistency
Data checks and edits should be applied to newly submitted records to check for item validity, internal
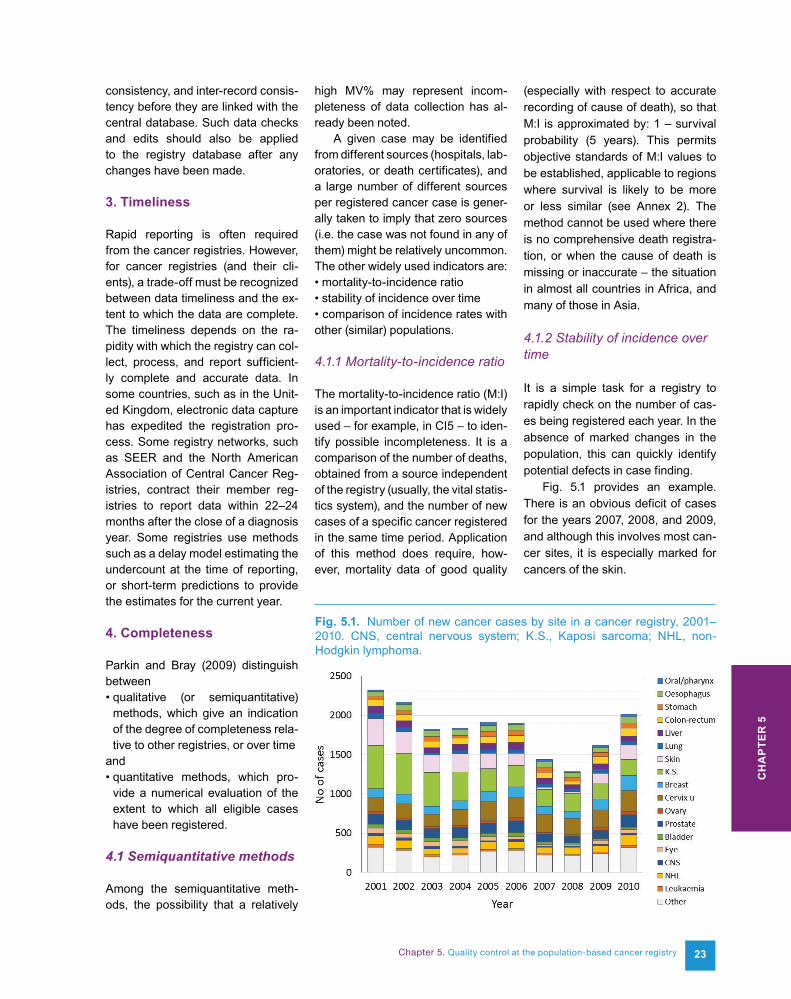
Chapter 5. Quality control at the population-based cancer registry 23
consistency, and inter-record consis-tency before they are linked with the central database. Such data checks and edits should also be applied to the registry database after any changes have been made.
3. Timeliness
Rapid reporting is often required from the cancer registries. However, for cancer registries (and their cli-ents), a trade-off must be recognized between data timeliness and the ex-tent to which the data are complete. The timeliness depends on the ra-pidity with which the registry can col-lect, process, and report sufficient-ly complete and accurate data. In some countries, such as in the Unit-ed Kingdom, electronic data capture has expedited the registration pro-cess. Some registry networks, such as SEER and the North American Association of Central Cancer Reg-istries, contract their member reg-istries to report data within 22–24 months after the close of a diagnosis year. Some registries use methods such as a delay model estimating the undercount at the time of reporting, or short-term predictions to provide the estimates for the current year.
4. Completeness
Parkin and Bray (2009) distinguish between• qualitative (or semiquantitative)
methods, which give an indication of the degree of completeness rela-tive to other registries, or over time
and• quantitative methods, which pro-
vide a numerical evaluation of the extent to which all eligible cases have been registered.
4.1 Semiquantitative methods
Among the semiquantitative meth-ods, the possibility that a relatively
high MV% may represent incom-pleteness of data collection has al-ready been noted.
A given case may be identified from different sources (hospitals, lab-oratories, or death certificates), and a large number of different sources per registered cancer case is gener-ally taken to imply that zero sources (i.e. the case was not found in any of them) might be relatively uncommon. The other widely used indicators are:• mortality-to-incidence ratio• stability of incidence over time• comparison of incidence rates with other (similar) populations.
4.1.1 Mortality-to-incidence ratio
The mortality-to-incidence ratio (M:I) is an important indicator that is widely used – for example, in CI5 – to iden-tify possible incompleteness. It is a comparison of the number of deaths, obtained from a source independent of the registry (usually, the vital statis-tics system), and the number of new cases of a specific cancer registered in the same time period. Application of this method does require, how-ever, mortality data of good quality
(especially with respect to accurate recording of cause of death), so that M:I is approximated by: 1 – survival probability (5 years). This permits objective standards of M:I values to be established, applicable to regions where survival is likely to be more or less similar (see Annex 2). The method cannot be used where there is no comprehensive death registra-tion, or when the cause of death is missing or inaccurate – the situation in almost all countries in Africa, and many of those in Asia.
4.1.2 Stability of incidence over time
It is a simple task for a registry to rapidly check on the number of cas-es being registered each year. In the absence of marked changes in the population, this can quickly identify potential defects in case finding.
Fig. 5.1 provides an example. There is an obvious deficit of cases for the years 2007, 2008, and 2009, and although this involves most can-cer sites, it is especially marked for cancers of the skin.
Fig. 5.1. Number of new cancer cases by site in a cancer registry, 2001–2010. CNS, central nervous system; K.S., Kaposi sarcoma; NHL, non-Hodgkin lymphoma.
CH
AP
TER
5

24
4.1.3 Comparison of incidence rates with other (similar) populations
Of course, not all populations will have the same pattern of incidence rates; observing differences is one of the objectives of cancer registration. Nevertheless, it is worth comparing results with those of registries serv-ing a similar population (similar geo-graphically, or of similar ethnic com-position) – provided the data from other registries are of good quality themselves – to look for differences. Some variation is to be expected, or may be explicable on the basis of exposure to known risk factors, but a systematic difference (many rates lower than expected) may lead to a suspicion of under-registration.
This method is used by the editors of CI5, where results from each registry are compared with those from a group of registries in the same country (or geographical region) (Annex 2).
4.2 Quantitative methods
Three methods are available to obtain a quantitative evaluation of the degree of completeness of registration:• independent case ascertainment• capture–recapture methods• death certificate methods.
4.2.1 Independent case ascertainment
Comparison of the registry data-base with sets of cancer cases that have been compiled independently of the cancer registry’s case-finding procedures is a particularly useful and objective method of evaluating completeness. It requires record linkage between the cancer registry database and the independent case series, to estimate the numbers of cases in the latter “missed” by the registry. The proportion of eligible
patients who are already registered is a direct and quantitative estimate of completeness.
The existence of such files of cancer patients from the registration area – for example, from research studies or surveys – provides an opportunity to evaluate registry com-pleteness that should not be missed.
4.2.2 Capture–recapture methods
Like the numbers of sources per case, this method exploits the fact that cancer registries receive noti-fications of the same cancer cases from multiple sources. Usually, for this method, sources are grouped into hospital, laboratory (patholo-gy), and death certificate, which are, more or less, independent of each other. The basic idea is that if we know how many cases are noti-fied by one source, a pair of sourc-es, or all three sources, we can estimate how many are notified by none (i.e. were missed). Practically, capture–recapture analysis of com-pleteness requires that record link-age is successfully carried out (so that cases identified by each of the multiple sources are correctly clas-sified). This is no problem for users of CanReg, where the sources of in-formation for each cancer case are brought together. Because of the linked-file structure of CanReg5, this sort of analysis should be particularly straightforward.
4.2.3 Death certificate methods
The death certificate methods de-pend on the availability of relatively high-quality (complete and accurate) certification of cause of death in the area covered by the cancer registry, and will not be readily applicable in many settings in LMICs. The other two methods can, however, readily be applied.
5. Data quality indices for population-based cancer survival
Unlike incidence data, estimating cancer survival requires a high qual-ity of follow-up information. This is optimally achieved if all-cause mor-tality data are available as a data source for the registry, and efficient linkage procedures (optimally based on unique identification number) are in place. As in LMICs vital registra-tion systems are often absent, un-reliable, or unavailable to the regis-tries, many registries in LMICs have resorted to active follow-up methods. The indices for cancer survival data quality due to exclusion from analy-sis are frequency of DCO cases and frequency of cases excluded from the study due to lack of any follow-up (Swaminathan et al., 2011). Loss to follow-up is a cause of bias even in registries in high-income countries, as even a small underestimation of deaths can result in overestimation of long-term survival (Brenner and Hakulinen, 2009). In LMICs, with poorly functioning routine health sta-tistics data systems and unavailable mortality data, cancer survival esti-mates from PBCRs can sometimes provide the only insight into the sta-tus of cancer care in the country.
As Skeet noted in Cancer Reg-istration: Principles and Methods (Skeet, 1991), “all registries should be able to quote some objective mea-sure of this [ascertainment] rather than relying on received wisdom and pious hope.” This is sound advice, which is not always heeded. Report-ing of registry results demands some evaluation of their quality, especially as the purpose is almost always to allow a valid comparison of cancer rates and risks, between populations and subgroups and over time, that are not the results of artefacts of the registration process.

• All PBCRs should be able to provide some objective indication of the quality of the data that they have collected.
• The methods available have been described and updated, and cover four dimensions of quality: comparability, validity, timeliness, and completeness.
Key points
Chapter 5. Quality control at the population-based cancer registry 25
CH
AP
TER
5


Chapter 6. Making the population-based cancer registry heard – reporting the results 27
chap te r 6.
Making the population-based cancer registry heard –
reporting the results
A key objective of a cancer reg-istry is to produce statistics on the occurrence of cancer in a defined population. This information can be disseminated by different means, such as cancer incidence reports, cancer registry websites, research articles, and press releases, as well as through direct communication with clinicians, health authorities, the media, and other data users.
The cancer incidence report is the routine and baseline means of presenting registry data. These re-ports contain information on all re-portable cancers and represent the main deliverable of a cancer registry, providing feedback to the stakehold-ers and the data providers. Even though cancer incidence does not vary markedly on an annual basis, most cancer registries are required by their stakeholders to publish new data annually. However, the registries
with smaller populations and low yearly counts of rare cancers might choose to publish more detailed re-ports at longer intervals (e.g. 2 years or 5 years).
1. Basic contents of the report
Even though more and more cancer registries publish their data online, printed reports are still widely used. Therefore, the appearance (cover page) and size of the report should be considered. The initial pages of the report typically contain: name and address of the cancer registry (contact numbers, website, logo, etc.), names and designations of registry staff and members of the advisory committee, funding agen-cy, date of the report, and table of contents. Stakeholders, for exam-ple the ministry of health, might be asked to contribute a foreword to the cancer registry report. Thereafter, a
short executive summary of the re-port should be provided. The main components of the report are back-ground information, evaluation and presentation of the results, and the tabular section.
1.1 Background information
This section should contain a brief description of the registry and reg-istration procedures, in particular concerning classifications, rules, and definitions applied. The area and population covered should be described, and population counts should be presented in tabular or graphical format (e.g. Fig. 6.1). Sources of population estimates or data should be listed, and important demographic characteristics, such as ethnicity or religion, described. This section should also contain a description of data sources and a list of reportable diseases. Statistical
CH
AP
TER
6

28
methods used for calculation of rates should be described and referenced.
1.2 Presentation of the results
Cancer registry tables are usually included as an annex to the report. The basic table is a frequency distri-bution of the number of cases during a specified time period according to the cancer site, age, and sex. The distribution should be given by 5-year age groups and by three-dig-
• column should be clearly and fully defined.
• If the table includes rates, the de-nominator on which they are based should be clearly stated.
• The frequency distributions should be given in full.
• Rates or proportions should not be given alone without any information as to the number of observations upon which they are based.
• Full particulars of any deliberate ex-clusions of registered cases must be given, with the reasons for and the criteria of exclusion being clear-ly defined.
As well as a tabular presenta-tion, the reports should contain well-drawn and clear graphical depictions of selected results. Commonly these include the frequencies of different cancers or the ranking of age-stan-dardized rates of the most common cancer sites (as bar graphs or pie charts) and the rates by age of differ-ent cancers or the trends of a given cancer over a calendar period (as line graphs). Commonly used graphs
it ICD level. This table should be accompanied by a similar table providing the age-, sex-, and site- specific annual rates. In addition to the age-specific information, this table should also contain crude, cumulative, and age-standardized rates. The guidelines for tabular presentation of the data (Hill, 1971) are summarized below:• The contents of the table as a whole
and the items in each separate
Fig. 6.1. Estimated average annual population of Harare City for the period 2010–2012. Source: Harare Cancer Registry Triennial Report, 2010–2012.
Fig. 6.2. Ten most frequent cancers in males (percentages) in Malaysia in 2007. Source: Malaysia Cancer Registry Report, 2007.

Chapter 6. Making the population-based cancer registry heard – reporting the results 29
in presentation of cancer registry data include the following:• Bar graph or histogram: commonly
used for illustrations of frequencies, proportions, and percentages (e.g. Fig. 6.2).
• Component band graph: illustrates the size of components of the whole, using different colours, for example for different histologies (see Fig. 5.1).
• Pie chart: presents the contribution that different components make to the whole, commonly used to present the distribution of the most common cancer sites or age at inci-dence (e.g. Fig. 6.3).
• Line graph: commonly used to plot age-specific incidence rates or time trends (e.g. Fig. 6.4).
Examples of the recommended presentation of tables and graphs in cancer registry reports are also available in the African Cancer Registry Network model report at http://afcrn.org/resources/publica tions/115-model-registry-report.
Fig. 6.3. Number of cases in 3-year period by age group and sex. Source: Kampala Cancer Registry Triennial Report, 2007–2009.
Fig. 6.4. Age-specific incidence rates (black males). N.H.L., non-Hodgkin lymphoma. Source: Harare Cancer Registry Triennial Report, 2010–2012.
2. Evaluation of the results
The aim of this section is to assist the reader in interpreting the results and to facilitate comparison with other registries. It should provide information on any changes in regis-
tration procedures compared with the preceding period. The important elements in evaluating the results are consistency of the number of cases in each calendar year, site distribu-tion, and indices of quality of diagno-sis. The indices generally used are
CH
AP
TER
6

30
• A key objective of a cancer registry is to produce statistics on the occurrence of cancer in a defined population.
• This information can be disseminated via cancer incidence reports, cancer registry websites, research articles, and press releases, and through direct communication with clinicians, health authorities, the media, or other data users.
• Even though cancer incidence does not vary markedly on an annual basis, most cancer registries are required by their stakeholders to publish new data annually. The cancer incidence report is the routine and baseline means of presenting registry data. These reports contain information on all reportable cancers and represent the main deliverable of a cancer registry, providing feedback to the stakeholders and the data providers.
• The main components of the report are background information, evaluation and presentation of the results, and the tabular section.
• The important elements in evaluating the results are consistency of the number of cases in each calendar year, site distribution, and indices of quality of diagnosis.
Key points
Table 6.1. Report checklist
Number Recommended component
1 Executive summary of the report Background information2 Outline of the organization of the cancer registry3 List of the professional staff4 Description of the reporting procedures5 Description of the sources of cases6 List of reportable diseases7 Description of coding procedures8 Clear statement of definitions used in reporting9 Population covered by registration10 Reference for the population denominator data11 Description of statistical terms and methods
Evaluation of findings12 Consistency of the number of cases in each calendar year13 Site distribution14 Indices of validity of diagnosis15 Demographic data16 Differences compared with similar areas
Tabular presentation17 Clearly defined contents of the table and the items18 Denominator for rates19 Frequency distribution in full20 Rate or proportion, with the number of observations21 Particulars and criteria of exclusions22 Number of cases by site, age, and sex23 Annual incidence rates by site, age, and sex24 Age-standardized rates25 Cumulative incidence rates26 Tables for subsets of the population27 Tables for indices of the validity of diagnoses
Graphical presentation28 Limited amount of data per graph29 Tabular information for the graphs must be presented30 Appropriate choice of scale31 Graphs should form self-contained units32 Appropriate use of bar graphs, pie charts, and line graphs
the percentage of cases with mor- phological confirmation (MV%), the percentage of cases registered based on death certificate only (DCO%), and, if data on mortal-ity are available, mortality-to-in-cidence ratio (M:I) (see Chapter 5 for definitions). These indices should also be presented by sex and site in the tabular section. Comparisons with other similar or neighbouring areas are also use-ful, as differences, such as lower incidence rates of major cancers, might point to under-reporting. A checklist of recommended compo-nents to be included in a cancer reg-istry report is given in Table 6.1 (com-piled from Jensen and Storm, 1991).
Upon publishing a report, it is advisable to assemble a stakehold- ers’ committee to provide feed- back to stakeholders, specific policy and research recommendations based on the results, and further plans and budgetary requirements. A response should also be provided to the data contributors, with the aim of improving quality and reporting. The pertinent media outlets should be briefed about the main findings.

References 31
References
Jensen OM, Storm HH (1991). Reporting of
results. In: Jensen OM, Parkin DM, MacLennan
R, Muir CS, Skeet RG, editors. Cancer
Registration: Principles and Methods. Lyon:
International Agency for Research on Cancer
(IARC Scientific Publications, No. 95); pp.
108–125. Available from http://www.iarc.fr/en/
publications/pdfs-online/epi/sp95/index.php.
Jensen OM, Whelan S (1991). Planning a
cancer registry. In: Jensen OM, Parkin DM,
MacLennan R, Muir CS, Skeet RG, edi-
tors. Cancer Registration: Principles and
Methods. Lyon: International Agency for
Research on Cancer (IARC Scientific Pub-
lications, No. 95); pp. 22–28. Available from
http://www.iarc.fr/en/publications/pdfs-online/
epi/sp95/index.php.
MacLennan R (1991). Items of patient informa-
tion which may be collected by registries. In:
Jensen OM, Parkin DM, MacLennan R, Muir CS,
Skeet RG, editors. Cancer Registration: Princi-
ples and Methods. Lyon: International Agency
for Research on Cancer (IARC Scientific Pub-
lications, No. 95); pp. 43–63. Available from
http://www.iarc.fr/en/publications/pdfs-online/
epi/sp95/index.php.
Parkin DM (2006). The evolution of the popu-
lation-based cancer registry. Nat Rev Cancer.
6(8):603–12. http://dx.doi.org/10.1038/nrc1948
PMID:16862191
Parkin DM, Bray F (2009). Evaluation
of data quality in the cancer registry:
principles and methods. Part II: com-
pleteness. Eur J Cancer. 45(5):756–64.
http://dx.doi.org/10.1016/j.ejca.2008.11.033
PMID:19128954
Parkin DM, Chen V, Ferlay J, Galceran J, Storm
HH, Whelan SL (1994). Comparability and
Quality Control in Cancer Registration. Lyon:
International Agency for Research on Cancer
(IARC Technical Reports, No. 19).
Pottier D (1992). Population at risk. In: Par-
kin DM, Muir CS, Whelan SL, Gao YT, Ferlay
J, Powell J, editors. Cancer Incidence in Five
Continents, Volume VI. Lyon: International
Agency for Research on Cancer (IARC Scien-
tific Publications, No. 120); pp. 174–177.
Skeet RG (1991). Quality and quality control. In:
Jensen OM, Parkin DM, MacLennan R, Muir
CS, Skeet RG, editors. Cancer Registration:
Principles and Methods. Lyon: International
Agency for Research on Cancer (IARC Scien-
tific Publications, No. 95); pp. 101–107. Avail-
able from http://www.iarc.fr/en/publications/
pdfs-online/epi/sp95/index.php.
Swaminathan R, Lucas E, Sankaranarayanan
R (2011). Cancer survival in Africa, Asia,
the Caribbean and Central America: data-
base and attributes. In: Sankaranarayanan
R, Swaminathan R, editors. Cancer Surviv-
al in Africa, Asia, the Caribbean and Central
America. Lyon: International Agency for Re-
search on Cancer (IARC Scientific Publica-
tions, No. 162); pp. 23–31. Available from
http://survcan.iarc.fr/survivalchap4.php.
Tangka F, Subramanian S, Beebe MC,
Trebino D, Michaud F (2010). Econom-
ic assessment of central cancer registry
operations, part III: results from 5 pro-
grams. J Registry Manag. 37(4):152–5.
PMID:21688745
WHO (2011). Global Status Report on Non-
communicable Diseases 2010. Geneva: World
Health Organization. Available from http://www.
who.int/chp/ncd_global_status_report/en/.
WHO (2013). Global Action Plan for the Preven-
tion and Control of NCDs 2013–2020. Gene-
va: World Health Organization. Available from
http://www.who.int /nmh/publications/ncd-
action-plan/en/.
Bray F (2014). Transitions in human develop-
ment and the global cancer burden. In: Stew-
art BW, Wild CP, editors. World Cancer Report
2014. Lyon: International Agency for Research
on Cancer; pp. 54–68.
Bray F, Parkin DM (2009). Evaluation of
data quality in the cancer registry: principles
and methods. Part I: comparability, validity
and timeliness. Eur J Cancer. 45(5):747–55.
http://dx.doi.org/10.1016/j.ejca.2008.11.032
PMID:19117750
Brenner H, Hakulinen T (2009). Implications of
incomplete registration of deaths on long-term
survival estimates from population-based can-
cer registries. Int J Cancer. 125(2):432–7. http://
dx.doi.org/10.1002/ijc.24344 PMID:19422045
Buemi A (2008). Pathology of Tumours for
Cancer Registry Personnel. Lyon: Interna-
tional Agency for Research on Cancer and
International Association of Cancer Registries.
Available from http://www.iacr.com.fr/Patholo
gyManualApr08.pdf.
Esteban D, Whelan S, Laudico A, Parkin
DM, editors (1995). Manual for Cancer Reg-
istry Personnel. Lyon: International Agency
for Research on Cancer and Internation-
al Association of Cancer Registries (IARC
Technical Reports, No. 10). Available from
http://www.iarc.fr/en/publications/pdfs-online/
treport-pub/treport-pub10/index.php.
Hill AB (1971). Principles of Medical Statistics.
London: Lancet.
Jensen OM, Parkin DM, MacLennan R, Muir
CS, Skeet RG, editors (1991). Cancer Regis-
tration: Principles and Methods. Lyon: Interna-
tional Agency for Research on Cancer (IARC
Scientific Publications, No. 95). Available from
http://www.iarc.fr/en/publications/pdfs-online/
epi/sp95/index.php.

32
CanReg is an open-source tool developed by the International Agency for Research on Cancer (IARC) spe-cially designed to input, store, check, and analyse population-based cancer registry data. CanReg software is updated with consistency checks ac-cording to the international guidelines: Age/Incidence and birth dates; Age/Site/Histology (International Classifi-cation of Diseases for Oncology, 3rd Edition [ICD-O-3]); Site/Histology (ICD-O-3); Behaviour/Site (ICD-O-3); Behaviour/Histology (ICD-O-3); Ba-sis of diagnosis/Histology (ICD-O-3). The latest version of the software, CanReg5 (Fig. A1), has improved multiuser capacities and enables add-ing new variables, recording multiple data sources, tailoring the data entry forms, and so on. CanReg5 is avail-able in Chinese, English, French, Por-tuguese, Russian, and Spanish, and can be downloaded free of charge from IARC or the International Asso-ciation of Cancer Registries (IACR) (http://www.iacr.com.fr/canreg5.htm).
As mentioned above, CanReg5 incorporates consistency checks. For population-based cancer registries using other software, the IARC–IACR Cancer Registry Tools (IARCcrgTools) program for conversion between ICD editions, consistency checks
between variables, and multiple pri-mary checks can be downloaded from the IACR website (www.iacr.com.fr/iacr_iarccrgtools.htm). The program runs in batch mode, using text files with a fixed-length record, and in-cludes online help in English.
Fig. A1. The CanReg5 welcome window.
Annex 1. CanReg5
anne x 1.
CanReg5

Annex 2. Selected data quality indicators by country or region 33
anne x 2.
Selected data quality indicators by country or region
Table A1. Mean values of data quality indicators for cancer registries in Brazila
ICD-10 code Cancer site Male Female
MV% M:I% ASR MV% M:I% ASRC00–14 Oral cavity and pharynx 86.9 36.4 19.6 81.2 22.9 4.9C15 Oesophagus 79.5 66.1 10.5 77.3 55.6 2.6C16 Stomach 81.2 55.2 24.3 79.8 50.3 11.1C18–21 Large bowel 83.3 38.1 22.5 82.5 36.9 20.2C22 Liver 89.6 181.6 4.2 84.3 205.7 2.5C25 Pancreas 40.1 95.6 4.7 42.0 95.1 3.7C32 Larynx 83.0 46.7 9.4 76.1 27.3 1.4C33–34 Trachea, bronchus, and lung 68.8 75.6 25.6 68.5 68.0 9.9C43 Melanoma of skin 99.2 20.5 4.8 99.5 16.7 4.4C50 Breast 84.7 12.0 0.6 83.6 22.9 61.7C53 Cervix uteri 0.0 0.0 0.0 87.8 23.4 29.3C54–55 Corpus uteri, uterus unspecified 0.0 0.0 0.0 77.9 39.0 10.5C56 Ovary 0.0 0.0 0.0 76.3 39.3 7.7C61 Prostate 85.3 20.8 79.6 0.0 0.0 0.0C62 Testis 78.7 13.7 1.6 0.0 0.0 0.0C64–66 Kidney, renal pelvis, and ureter 76.1 34.5 5.3 77.3 32.5 2.8C67 Bladder 87.3 26.6 12.9 80.8 28.4 3.6C70–72 Brain, central nervous system 61.4 64.6 6.8 56.4 62.9 5.2C73 Thyroid 87.0 8.8 2.4 87.4 4.0 8.8C81–88, C90 Lymphomas 97.9 35.6 13.6 98.0 36.7 9.5C91–95 Leukaemia 95.8 51.2 7.0 95.6 53.1 5.0C76–80 Unspecified 47.8 46.1 12.9 48.0 43.7 10.1C00–96 (excluding C44) All sites (excluding non-melanoma skin) 80.5 42.6 285.7 80.1 34.9 232.3
ASR, age-standardized rate (World Standard) per 100 000; ICD-10, International Statistical Classification of Diseases and Related Health Problems, 10th Revision; M:I%, percentage mortality-to-incidence ratio; MV%, percentage of cases with a morphologically verified diagnosis.a Campinas (1991–1995), Brasilia (1998–2001), Cuiaba (2000–2002), Goiania (1999–2002), São Paulo (1998–2002).
AN
NE
X 2
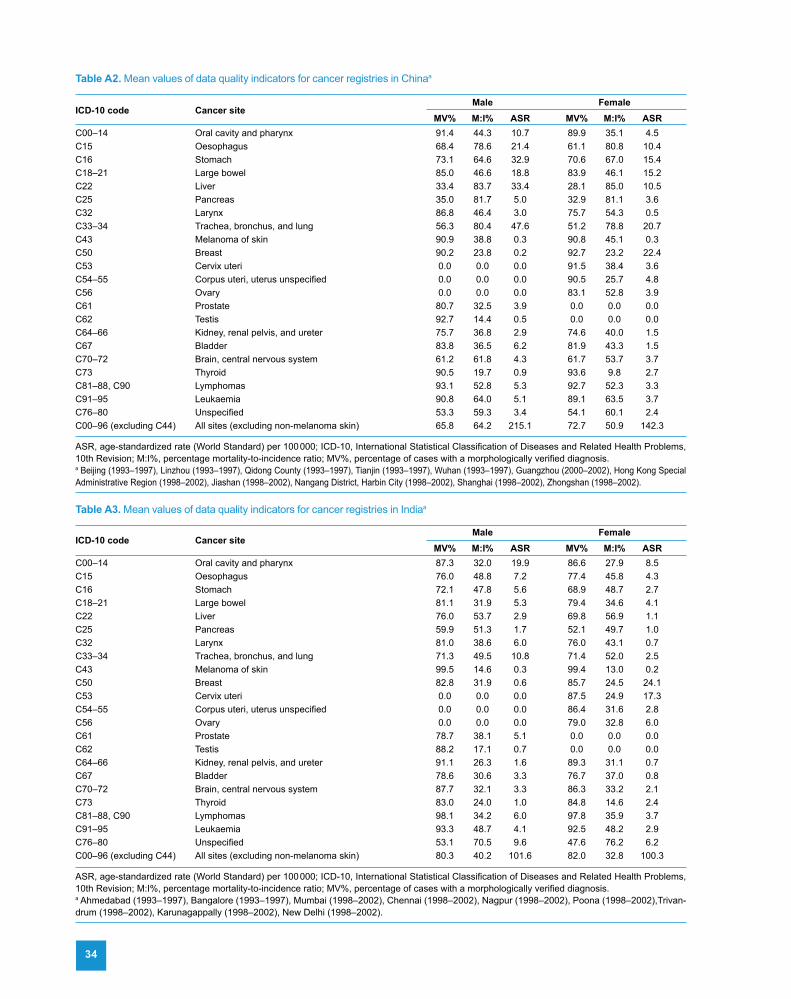
34
Table A3. Mean values of data quality indicators for cancer registries in Indiaa
Table A2. Mean values of data quality indicators for cancer registries in Chinaa
ICD-10 code Cancer site Male Female
MV% M:I% ASR MV% M:I% ASRC00–14 Oral cavity and pharynx 87.3 32.0 19.9 86.6 27.9 8.5C15 Oesophagus 76.0 48.8 7.2 77.4 45.8 4.3C16 Stomach 72.1 47.8 5.6 68.9 48.7 2.7C18–21 Large bowel 81.1 31.9 5.3 79.4 34.6 4.1C22 Liver 76.0 53.7 2.9 69.8 56.9 1.1C25 Pancreas 59.9 51.3 1.7 52.1 49.7 1.0C32 Larynx 81.0 38.6 6.0 76.0 43.1 0.7C33–34 Trachea, bronchus, and lung 71.3 49.5 10.8 71.4 52.0 2.5C43 Melanoma of skin 99.5 14.6 0.3 99.4 13.0 0.2C50 Breast 82.8 31.9 0.6 85.7 24.5 24.1C53 Cervix uteri 0.0 0.0 0.0 87.5 24.9 17.3C54–55 Corpus uteri, uterus unspecified 0.0 0.0 0.0 86.4 31.6 2.8C56 Ovary 0.0 0.0 0.0 79.0 32.8 6.0C61 Prostate 78.7 38.1 5.1 0.0 0.0 0.0C62 Testis 88.2 17.1 0.7 0.0 0.0 0.0C64–66 Kidney, renal pelvis, and ureter 91.1 26.3 1.6 89.3 31.1 0.7C67 Bladder 78.6 30.6 3.3 76.7 37.0 0.8C70–72 Brain, central nervous system 87.7 32.1 3.3 86.3 33.2 2.1C73 Thyroid 83.0 24.0 1.0 84.8 14.6 2.4C81–88, C90 Lymphomas 98.1 34.2 6.0 97.8 35.9 3.7C91–95 Leukaemia 93.3 48.7 4.1 92.5 48.2 2.9C76–80 Unspecified 53.1 70.5 9.6 47.6 76.2 6.2C00–96 (excluding C44) All sites (excluding non-melanoma skin) 80.3 40.2 101.6 82.0 32.8 100.3
ASR, age-standardized rate (World Standard) per 100 000; ICD-10, International Statistical Classification of Diseases and Related Health Problems, 10th Revision; M:I%, percentage mortality-to-incidence ratio; MV%, percentage of cases with a morphologically verified diagnosis.a Ahmedabad (1993–1997), Bangalore (1993–1997), Mumbai (1998–2002), Chennai (1998–2002), Nagpur (1998–2002), Poona (1998–2002),Trivan-drum (1998–2002), Karunagappally (1998–2002), New Delhi (1998–2002).
ICD-10 code Cancer site Male Female
MV% M:I% ASR MV% M:I% ASRC00–14 Oral cavity and pharynx 91.4 44.3 10.7 89.9 35.1 4.5C15 Oesophagus 68.4 78.6 21.4 61.1 80.8 10.4C16 Stomach 73.1 64.6 32.9 70.6 67.0 15.4C18–21 Large bowel 85.0 46.6 18.8 83.9 46.1 15.2C22 Liver 33.4 83.7 33.4 28.1 85.0 10.5C25 Pancreas 35.0 81.7 5.0 32.9 81.1 3.6C32 Larynx 86.8 46.4 3.0 75.7 54.3 0.5C33–34 Trachea, bronchus, and lung 56.3 80.4 47.6 51.2 78.8 20.7C43 Melanoma of skin 90.9 38.8 0.3 90.8 45.1 0.3C50 Breast 90.2 23.8 0.2 92.7 23.2 22.4C53 Cervix uteri 0.0 0.0 0.0 91.5 38.4 3.6C54–55 Corpus uteri, uterus unspecified 0.0 0.0 0.0 90.5 25.7 4.8C56 Ovary 0.0 0.0 0.0 83.1 52.8 3.9C61 Prostate 80.7 32.5 3.9 0.0 0.0 0.0C62 Testis 92.7 14.4 0.5 0.0 0.0 0.0C64–66 Kidney, renal pelvis, and ureter 75.7 36.8 2.9 74.6 40.0 1.5C67 Bladder 83.8 36.5 6.2 81.9 43.3 1.5C70–72 Brain, central nervous system 61.2 61.8 4.3 61.7 53.7 3.7C73 Thyroid 90.5 19.7 0.9 93.6 9.8 2.7C81–88, C90 Lymphomas 93.1 52.8 5.3 92.7 52.3 3.3C91–95 Leukaemia 90.8 64.0 5.1 89.1 63.5 3.7C76–80 Unspecified 53.3 59.3 3.4 54.1 60.1 2.4C00–96 (excluding C44) All sites (excluding non-melanoma skin) 65.8 64.2 215.1 72.7 50.9 142.3
ASR, age-standardized rate (World Standard) per 100 000; ICD-10, International Statistical Classification of Diseases and Related Health Problems, 10th Revision; M:I%, percentage mortality-to-incidence ratio; MV%, percentage of cases with a morphologically verified diagnosis.a Beijing (1993–1997), Linzhou (1993–1997), Qidong County (1993–1997), Tianjin (1993–1997), Wuhan (1993–1997), Guangzhou (2000–2002), Hong Kong Special Administrative Region (1998–2002), Jiashan (1998–2002), Nangang District, Harbin City (1998–2002), Shanghai (1998–2002), Zhongshan (1998–2002).

Annex 2. Selected data quality indicators by country or region 35
Table A5. Mean values of data quality indicators for cancer registries in sub-Saharan Africaa
Table A4. Mean values of data quality indicators for cancer registries in Thailanda
ICD-10 code Cancer site Male Female
MV% M:I% ASR MV% M:I% ASRC00–14 Oral cavity and pharynx 68.6 0 3.3 71.4 0 2.3C15 Oesophagus 46.7 0 8.6 45.9 0 4.4C16 Stomach 53.1 0 9.0 53.4 0 9.9C18–21 Large bowel 62.1 0 5.5 61.3 0 5.6C22 Liver 11.7 0 27.0 12.6 0 13.2C25 Pancreas 16.8 0 2.5 22.2 0 1.9C32 Larynx 66.2 0 1.7 73.3 0 0.4C33–34 Trachea, bronchus, and lung 44.7 0 5.6 64.1 0 2.4C43 Melanoma of skin 76.9 0 0.6 90.0 0 1.3C50 Breast 66.7 0 0.7 66.1 0 18.3C53 Cervix uteri 0.0 0 0.0 62.4 0 41.0C54–55 Corpus uteri, uterus unspecified 0.0 0 0.0 64.6 0 5.1C56 Ovary 0.0 0 0.0 51.3 0 5.0C61 Prostate 59.8 0 22.7 0.0 0 0.0C62 Testis 48.3 0 0.5 0.0 0 0.0C64–66 Kidney, renal pelvis, and ureter 68.8 0 1.0 67.1 0 1.3C67 Bladder 39.7 0 5.6 45.0 0 3.1C70–72 Brain, central nervous system 51.5 0 0.6 41.8 0 1.0C73 Thyroid 65.4 0 0.4 73.8 0 1.9C81–88, C90 Lymphomas 84.5 0 6.9 82.0 0 5.9C91–95 Leukaemia 87.2 0 1.4 88.4 0 1.6C76–80 Unspecified 48.4 0 5.2 39.8 0 5.3C00–96 (excluding C44) All sites (excluding non-melanoma skin) 57.4 0 142.2 61.1 0 151.3
ASR, age-standardized rate (World Standard) per 100 000; ICD-10, International Statistical Classification of Diseases and Related Health Problems, 10th Revision; M:I%, percentage mortality-to-incidence ratio; MV%, percentage of cases with a morphologically verified diagnosis.a The Gambia (1997–1998), Mali, Bamako (1994–1996), Uganda, Kyadondo County (1993–1997), Zimbabwe, Harare: African (1993–1997).
ICD-10 code Cancer site Male Female
MV% M:I% ASR MV% M:I% ASRC00–14 Oral cavity and pharynx 90.7 36.9 10.9 89.6 60.1 5.5C15 Oesophagus 79.0 49.7 3.5 70.4 128.1 0.9C16 Stomach 79.1 40.5 4.4 79.0 39.4 2.9C18–21 Large bowel 79.3 38.3 11.2 78.8 36.8 8.4C22 Liver 21.5 44.0 32.4 19.6 66.9 12.6C25 Pancreas 39.7 53.7 1.6 43.8 65.5 1.1C32 Larynx 87.4 34.2 2.8 83.8 84.9 0.4C33–34 Trachea, bronchus, and lung 62.3 45.8 28.8 66.5 44.6 14.1C43 Melanoma of skin 100.0 20.7 0.6 100.0 11.1 0.3C50 Breast 75.9 677.3 0.2 89.6 15.7 19.6C53 Cervix uteri 0.0 0.0 0.0 89.8 17.4 21.4C54–55 Corpus uteri, uterus unspecified 0.0 0.0 0.0 90.0 21.8 3.4C56 Ovary 0.0 0.0 0.0 83.0 20.3 5.7C61 Prostate 86.0 23.2 4.8 0.0 0.0 0.0C62 Testis 80.5 8.8 0.5 0.0 0.0 0.0C64–66 Kidney, renal pelvis, and ureter 82.1 33.1 1.6 78.5 30.1 0.8C67 Bladder 88.0 29.2 5.0 82.8 45.6 1.4C70–72 Brain, central nervous system 46.8 54.1 1.8 55.0 44.4 1.9C73 Thyroid 88.8 45.1 1.2 90.5 12.5 4.3C81–88, C90 Lymphomas 98.7 43.0 6.6 98.5 46.3 4.7C91–95 Leukaemia 90.3 28.0 4.3 87.1 19.8 3.8C76–80 Unspecified 24.2 52.4 14.6 29.0 57.5 9.4C00–96 (excluding C44) All sites (excluding non-melanoma skin) 59.8 47.3 145.6 74.3 35.8 130.0
ASR, age-standardized rate (World Standard) per 100 000; ICD-10, International Statistical Classification of Diseases and Related Health Problems, 10th Revision; M:I%, percentage mortality-to-incidence ratio; MV%, percentage of cases with a morphologically verified diagnosis.a Chiang Mai (1998–2002), Songkhla (1998–2002), Lampang (1998–2002), Bangkok (1995–1997), Khon Kaen (1993–1997).

36
Table A7. Mean values of data quality indicators for cancer registries in South America (excluding Brazil)a
Table A6. Mean values of data quality indicators for cancer registries in Central America and the Caribbeana
ICD-10 code Cancer site Male Female
MV% M:I% ASR MV% M:I% ASRC00–14 Oral cavity and pharynx 86.4 37.4 12.5 82.8 24.9 3.6C15 Oesophagus 78.5 68.7 8.5 76.1 62.3 2.4C16 Stomach 79.2 60.3 24.4 76.3 57.2 11.7C18–21 Large bowel 81.9 42.2 20.8 80.8 41.9 17.5C22 Liver 78.6 169.2 3.7 69.2 182.6 2.4C25 Pancreas 38.4 97.0 5.1 39.0 96.0 4.0C32 Larynx 82.9 48.8 7.4 76.2 32.2 1.0C33–34 Trachea, bronchus, and lung 67.0 78.3 28.2 67.0 72.2 8.3C43 Melanoma of skin 98.7 22.0 3.7 99.2 17.7 3.9C50 Breast 83.0 20.5 0.6 82.3 24.8 58.7C53 Cervix uteri 0.0 0.0 0.0 88.8 24.6 27.2C54–55 Corpus uteri, uterus unspecified 0.0 0.0 0.0 78.3 42.3 9.5C56 Ovary 0.0 0.0 0.0 76.3 43.2 7.9C61 Prostate 84.4 25.0 58.5 0.0 0.0 0.0C62 Testis 84.9 14.2 3.4 0.0 0.0 0.0C64–66 Kidney, renal pelvis, and ureter 76.8 38.9 6.2 77.1 37.1 3.1C67 Bladder 86.6 29.3 11.5 80.5 31.4 3.0C70–72 Brain, central nervous system 64.9 65.1 5.6 60.3 63.1 4.3C73 Thyroid 87.5 11.7 1.9 88.5 5.4 6.9C81–88, C90 Lymphomas 97.1 37.5 13.2 97.3 38.7 9.4C91–95 Leukaemia 95.1 58.2 7.9 95.1 59.9 5.6C76–80 Unspecified 46.6 55.4 12.7 47.9 53.6 9.5C00–96 (excluding C44) All sites (excluding non-melanoma skin) 79.4 46.6 252.2 79.3 38.6 217.9
ASR, age-standardized rate (World Standard) per 100 000; ICD-10, International Statistical Classification of Diseases and Related Health Problems, 10th Revision; M:I%, percentage mortality-to-incidence ratio; MV%, percentage of cases with a morphologically verified diagnosis.a Argentina, Concordia (1993–1997), Argentina, Bahia Blanca (1998–2002), Chile, Valdivia (1998–2002), Colombia, Cali (1998–2002), Ecuador, Quito (1998–2002), Peru, Trujillo (1998–2002), Uruguay, Montevideo (1993–1995).
ICD-10 code Cancer site Male Female
MV% M:I% ASR MV% M:I% ASRC00–14 Oral cavity and pharynx 94.2 44.0 12.2 92.8 42.0 3.4C15 Oesophagus 81.3 99.8 5.3 73.5 89.3 1.1C16 Stomach 77.4 75.9 18.3 73.5 76.8 8.9C18–21 Large bowel 85.3 49.9 17.5 82.7 49.5 17.3C22 Liver 39.7 74.5 4.6 31.5 84.8 2.8C25 Pancreas 39.9 75.3 4.3 34.0 79.1 3.3C32 Larynx 91.9 57.2 6.4 87.4 58.3 0.9C33–34 Trachea, bronchus, and lung 60.0 95.7 21.1 57.3 101.2 8.3C43 Melanoma of skin 98.6 35.7 1.6 100.0 30.2 1.2C50 Breast 92.8 27.9 0.5 95.0 31.6 42.9C53 Cervix uteri 0.0 0.0 0.0 90.5 35.5 13.3C54–55 Corpus uteri, uterus unspecified 0.0 0.0 0.0 89.1 33.4 8.3C56 Ovary 0.0 0.0 0.0 80.9 37.8 5.6C61 Prostate 89.0 32.9 79.9 0.0 0.0 0.0C62 Testis 90.9 11.7 1.6 0.0 0.0 0.0C64–66 Kidney, renal pelvis, and ureter 78.3 32.3 3.6 79.1 30.4 2.3C67 Bladder 88.7 30.0 8.1 83.9 37.1 2.3C70–72 Brain, central nervous system 72.8 53.5 4.3 68.1 55.3 2.9C73 Thyroid 95.9 9.1 1.3 95.2 5.9 6.7C81–88, C90 Lymphomas 95.0 53.6 12.2 94.9 53.2 8.9C91–95 Leukaemia 85.5 77.7 7.1 81.4 71.3 4.9C76–80 Unspecified 47.7 54.4 6.5 48.5 52.2 5.2C00–96 (excluding C44) All sites (excluding non-melanoma skin) 81.1 51.9 226.7 82.3 46.8 159.3
ASR, age-standardized rate (World Standard) per 100 000; ICD-10, International Statistical Classification of Diseases and Related Health Problems, 10th Revision; M:I%, percentage mortality-to-incidence ratio; MV%, percentage of cases with a morphologically verified diagnosis.a Costa Rica (1998–2002), Cuba, Villa Clara (1995–1997), France, Martinique (1998–2002), Puerto Rico (1992–1993).

Annex 2. Selected data quality indicators by country or region 37
Table A9. Mean values of data quality indicators for cancer registries in North Africa and West Asiaa
Table A8. Mean values of data quality indicators for cancer registries in Oceania (excluding Australia/New Zealand)a
ICD-10 code Cancer site Male Female
MV% M:I% ASR MV% M:I% ASRC00–14 Oral cavity and pharynx 96.0 16.0 6.5 95.7 16.5 2.7C15 Oesophagus 87.8 47.5 1.7 89.3 47.0 1.0C16 Stomach 90.0 57.2 7.5 87.6 60.8 4.0C18–21 Large bowel 91.3 37.1 11.2 93.5 32.9 8.6C22 Liver 52.9 37.0 5.7 53.3 47.3 2.0C25 Pancreas 55.7 22.7 3.2 55.5 21.9 2.1C32 Larynx 95.0 25.1 5.0 86.6 54.5 0.4C33–34 Trachea, bronchus, and lung 86.5 69.0 30.2 81.8 95.1 4.4C43 Melanoma of skin 98.6 32.7 0.6 99.0 29.7 0.6C50 Breast 95.2 26.7 0.6 95.4 16.4 31.9C53 Cervix uteri 0.0 0.0 0.0 95.5 15.1 6.3C54–55 Corpus uteri, uterus unspecified 0.0 0.0 0.0 96.5 21.6 5.0C56 Ovary 0.0 0.0 0.0 91.2 15.9 4.5C61 Prostate 87.1 38.4 12.5 0.0 0.0 0.0C62 Testis 94.8 3.6 1.0 0.0 0.0 0.0C64–66 Kidney, renal pelvis, and ureter 89.4 12.2 3.5 88.8 9.8 1.9C67 Bladder 93.2 9.2 14.2 90.2 14.9 2.6C70–72 Brain, central nervous system 82.7 21.6 3.9 77.9 20.7 2.5C73 Thyroid 94.9 5.8 1.6 97.0 2.0 5.0C81–88, C90 Lymphomas 94.7 41.7 11.7 94.1 37.0 8.1C91–95 Leukaemia 85.6 50.8 5.9 86.3 50.7 4.1C76–80 Unspecified 66.7 17.4 5.8 69.3 23.5 4.0C00–96 (excluding C44) All sites (excluding non-melanoma skin) 86.8 45.0 140.3 90.2 31.1 109.9
ASR, age-standardized rate (World Standard) per 100 000; ICD-10, International Statistical Classification of Diseases and Related Health Problems, 10th Revision; M:I%, percentage mortality-to-incidence ratio; MV%, percentage of cases with a morphologically verified diagnosis.a Algeria, Algiers (1993–1997), Algeria, Setif (1998–2002), Bahrain: Bahraini (1998–2002), Egypt, Gharbiah (1999–2002), Israel: non-Jews (1998–2002), Kuwait: Kuwaitis (1998–2002), Oman: Omani (1998–2001), Tunisia, Central (1998–2002), Turkey, Izmir (1998–2002), Turkey, Antalya (1998–2002).
ICD-10 code Cancer site Male Female
MV% M:I% ASR MV% M:I% ASRC00–14 Oral cavity and pharynx 91.9 0 15.5 91.5 0 3.8C15 Oesophagus 91.1 0 6.5 81.8 0 0.9C16 Stomach 81.0 0 6.8 81.5 0 4.5C18–21 Large bowel 88.7 0 20.6 87.9 0 14.7C22 Liver 62.4 0 9.3 53.8 0 3.5C25 Pancreas 68.2 0 3.6 65.6 0 2.7C32 Larynx 93.5 0 3.7 80.0 0 0.4C33–34 Trachea, bronchus, and lung 82.5 0 51.0 82.6 0 20.2C43 Melanoma of skin 95.7 0 4.8 98.1 0 3.6C50 Breast 90.0 0 0.8 92.9 0 58.7C53 Cervix uteri 0.0 0 0.0 96.4 0 13.8C54–55 Corpus uteri, uterus unspecified 0.0 0 0.0 91.3 0 13.6C56 Ovary 0.0 0 0.0 91.4 0 7.4C61 Prostate 93.2 0 46.9 0.0 0 0.0C62 Testis 93.3 0 1.8 0.0 0 0.0C64–66 Kidney, renal pelvis, and ureter 88.7 0 5.0 75.9 0 2.5C67 Bladder 93.2 0 7.2 90.5 0 1.8C70–72 Brain, central nervous system 57.1 0 2.4 68.8 0 2.3C73 Thyroid 100.0 0 4.9 99.1 0 30.9C81–88, C90 Lymphomas 93.9 0 10.0 88.9 0 8.4C91–95 Leukaemia 87.1 0 7.2 91.9 0 4.8C76–80 Unspecified 70.9 0 6.7 69.0 0 5.7C00–96 (excluding C44) All sites (excluding non-melanoma skin) 86.7 0 225.9 90.1 0 215.4
ASR, age-standardized rate (World Standard) per 100 000; ICD-10, International Statistical Classification of Diseases and Related Health Problems, 10th Revision; M:I%, percentage mortality-to-incidence ratio; MV%, percentage of cases with a morphologically verified diagnosis.a French Polynesia (1998–2002), Guam (1998–2002), New Caledonia (1998–2002).

38
Table A10. Mean values of data quality indicators for cancer registries in Central, East, and South Asiaa
ICD-10 code Cancer site Male Female
MV% M:I% ASR MV% M:I% ASRC00–14 Oral cavity and pharynx 88.9 37.0 17.0 86.0 29.4 9.3C15 Oesophagus 78.5 86.6 3.6 77.3 66.2 2.0C16 Stomach 74.1 60.3 13.9 73.1 57.6 7.4C18–21 Large bowel 86.4 42.9 18.8 86.4 44.2 14.0C22 Liver 29.2 86.7 16.5 28.5 95.1 5.0C25 Pancreas 44.7 85.2 2.9 45.6 82.8 2.2C32 Larynx 90.5 43.1 4.8 83.9 40.7 0.7C33–34 Trachea, bronchus, and lung 68.2 81.0 36.4 69.1 78.5 10.3C43 Melanoma of skin 92.8 28.0 0.6 93.3 36.7 0.3C50 Breast 76.8 44.4 0.6 91.0 23.4 40.2C53 Cervix uteri 0.0 0.0 0.0 89.5 30.0 15.7C54–55 Corpus uteri, uterus unspecified 0.0 0.0 0.0 85.2 17.1 6.6C56 Ovary 0.0 0.0 0.0 82.5 37.1 8.0C61 Prostate 83.1 27.6 11.5 0.0 0.0 0.0C62 Testis 84.8 8.8 0.9 0.0 0.0 0.0C64–66 Kidney, renal pelvis, and ureter 78.3 35.0 3.0 73.8 37.5 1.5C67 Bladder 89.9 32.0 5.4 86.2 34.0 1.3C70–72 Brain, central nervous system 70.7 62.0 2.4 66.6 64.0 1.8C73 Thyroid 88.9 11.2 1.6 92.4 8.6 5.1C81–88, C90 Lymphomas 90.4 38.7 8.3 89.2 41.3 5.3C91–95 Leukaemia 91.0 45.1 5.6 89.6 54.1 4.4C76–80 Unspecified 62.6 58.5 9.0 60.8 55.0 6.4C00–96 (excluding C44) All sites (excluding non-melanoma skin) 73.4 56.5 171.7 82.0 42.1 156.0
ASR, age-standardized rate (World Standard) per 100 000; ICD-10, International Statistical Classification of Diseases and Related Health Problems, 10th Revision; M:I%, percentage mortality-to-incidence ratio; MV%, percentage of cases with a morphologically verified diagnosis.a Malaysia, Sarawak (1998–2002), Malaysia, Penang (1998–2002), Pakistan, South Karachi (1998–2002), Philippines, Manila (1998–2002), Philippines, Rizal (1993–1997), Singapore (1998–2002), Viet Nam, Hanoi (1993–1997), Viet Nam, Ho Chi Minh City (1995–1998).


© Courtesy of Max Parkin
ISBN 978-92-832-0436-7
Des
ign:
cont
act@
apo-
lyon
.com