IAB Internet Advertising Revenue Report - Periodista Digital · IAB Internet Advertising Revenue...
20
IAB Internet Advertising Revenue Report An Industry Survey Conducted by PricewaterhouseCoopers and Sponsored by the Interactive Advertising Bureau (IAB) 2009 Second-Quarter and First Six Months Results
Transcript of IAB Internet Advertising Revenue Report - Periodista Digital · IAB Internet Advertising Revenue...
IAB Internet AdvertisingRevenue ReportAn Industry Survey Conducted by PricewaterhouseCoopersand Sponsored by the Interactive Advertising Bureau (IAB)
2009 Second-Quarter and First Six Months Results
Table of Contents
Background 2
Executive Summary 3
Detailed Findings 4
2009 Second-Quarter and Six Month Results
Annual and Quarterly Trends
Industry Concentration
Advertising Formats
Industry Category Spending
Pricing Models
Appendix 14
Survey Scope and Methodology
IAB Board Officers and Directors
Organization Profiles
PricewaterhouseCoopers LLP 2
Background
About the IAB Internet Advertising Revenue ReportConducted by PricewaterhouseCoopers LLP on an ongoing basis, with results releasedquarterly, the “Internet Advertising Revenue Report” was initiated by the Interactive AdvertisingBureau (IAB) in 1996. This report utilizes data and information reported directly toPricewaterhouseCoopers LLP, publicly available online corporate data and information providedby online ad selling companies.
The results reported are considered the most accurate measurement of Internet/onlineadvertising revenues because the data is compiled directly from information supplied bycompanies selling advertising online. All-inclusive, the report includes data reflecting onlineadvertising revenues from Web sites, commercial online services, ad networks and e-mailproviders, as well as other companies selling online advertising.
The report is conducted independently by PricewaterhouseCoopers LLP on behalf of the IAB.PwC does not audit the information and provides no opinion or other form of assurance withrespect to the information. Only aggregate results are published and individual companyinformation is held in strict confidence with PricewaterhouseCoopers LLP. Further detailsregarding scope and methodology are provided in the appendix to this report.
David SilvermanPricewaterhouseCoopers LLP
PricewaterhouseCoopers LLP 3
Executive Summary
IAB Internet Advertising Revenue Report2009 Second-Quarter and First Six-Month HighlightsInternet advertising revenues (“revenues”) in the United States totaled $10.9 billion for the first six months of2009, with Q2 accounting for approximately $5.4 billion. Internet advertising revenues for the first six months of2009 decreased 5.3 percent from the same period in 2008.
Key trends underlying 2009 year-to-date results Revenues Decreased 5.3% in first half of 2009 —Internet advertising revenue in the U.S. totaled $5.4
billion in the second quarter of 2009, a decrease of 0.7 percent from the 2009 first-quarter total of $5.5 billion,and an decrease of 5.4 percent from the 2008 second-quarter total of $5.7 billion. Year-to-date Internetadvertising revenues through June 2009 totaled $10.9 billion, down 5.3 percent from the $11.5 billionreported for the same six-month period in 2008.
“We are in one of the most difficult economic slumps in decades. Interactive is one of the advertising sectorsthat has been least affected,” said Randall Rothenberg, President and CEO of the IAB. “In recent years thedigital revolution has driven a transformation of how consumers experience advertising and media. As theeconomy improves, we’re confident that brands will devote an even greater share of their budgets toreaching consumers as they make interactive media a larger part of their lives.”
Search Continues to Lead, followed by Display Banners and Classifieds—Search revenue accountedfor 47 percent of 2009 second-quarter revenues, up from the 44 percent reported in the second quarter of2008. Display advertising, the second largest format, accounted for 35 percent, followed by Classifieds (10percent), and Lead Generation (7 percent) of 2009 second-quarter revenues.
“While the overall advertising market has continued to be impacted by current economic conditions,marketers are allocating more of their dollars to digital media for its accountability and because consumersare spending more of their leisure time online.”
—David Silverman, Partner, PricewaterhouseCoopers LLP
PricewaterhouseCoopers LLP 4
Detailed Findings
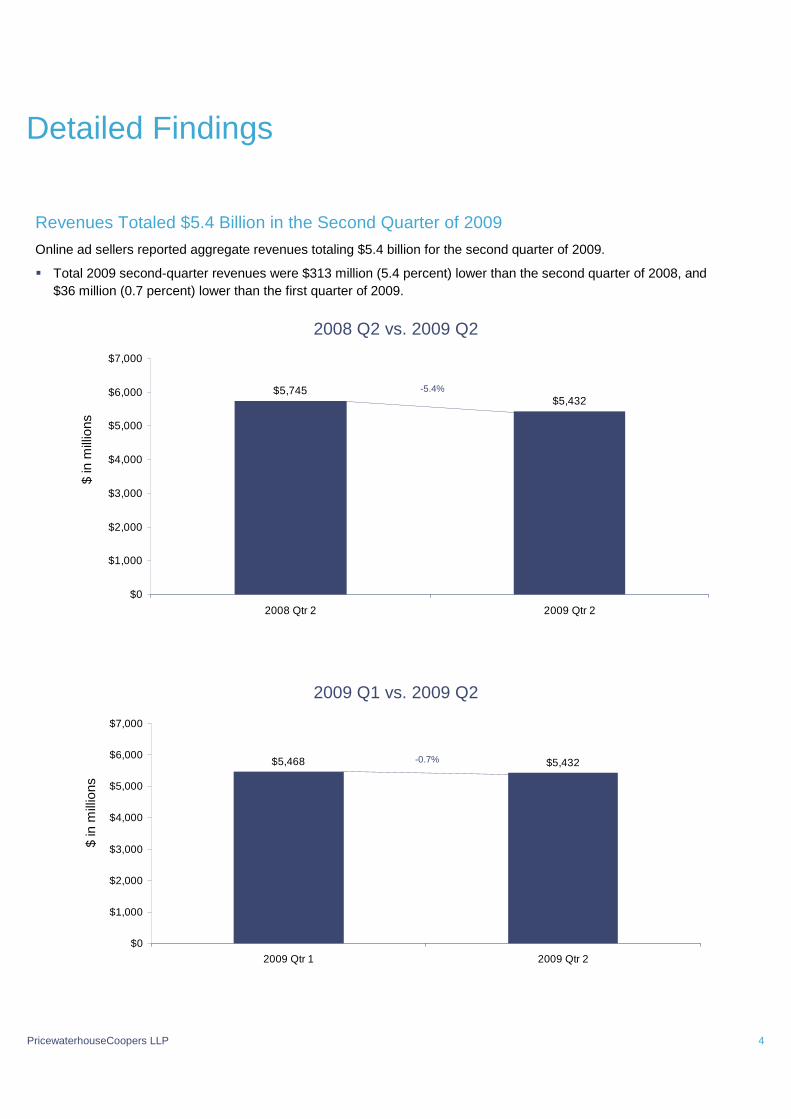
Revenues Totaled $5.4 Billion in the Second Quarter of 2009Online ad sellers reported aggregate revenues totaling $5.4 billion for the second quarter of 2009.
Total 2009 second-quarter revenues were $313 million (5.4 percent) lower than the second quarter of 2008, and$36 million (0.7 percent) lower than the first quarter of 2009.
$5,468 $5,432
$0
$1,000
$2,000
$3,000
$4,000
$5,000
$6,000
$7,000
2009 Qtr 1 2009 Qtr 2
$5,745$5,432
$0
$1,000
$2,000
$3,000
$4,000
$5,000
$6,000
$7,000
2008 Qtr 2 2009 Qtr 2
$in
mill
ions
2008 Q2 vs. 2009 Q2
-5.4%
$in
mill
ions
-0.7%
2009 Q1 vs. 2009 Q2
PricewaterhouseCoopers LLP 5
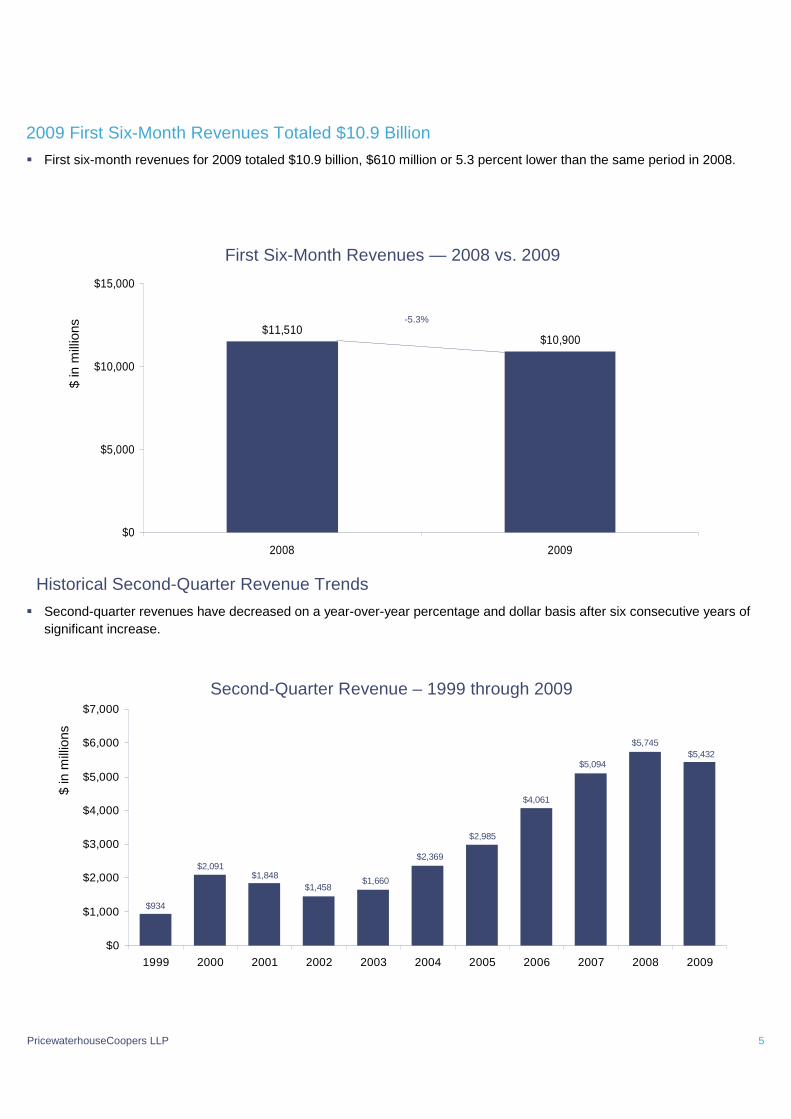
2009 First Six-Month Revenues Totaled $10.9 Billion First six-month revenues for 2009 totaled $10.9 billion, $610 million or 5.3 percent lower than the same period in 2008.
Second-quarter revenues have decreased on a year-over-year percentage and dollar basis after six consecutive years ofsignificant increase.
$5,094
$4,061
$2,985
$2,369
$1,660$1,458
$1,848$2,091
$934
$5,745$5,432
$0
$1,000
$2,000
$3,000
$4,000
$5,000
$6,000
$7,000
1999 2000 2001 2002 2003 2004 2005 2006 2007 2008 2009
$11,510$10,900
$0
$5,000
$10,000
$15,000
2008 2009
$in
mill
ions
First Six-Month Revenues — 2008 vs. 2009
-5.3%
Historical Second-Quarter Revenue Trends
$in
mill
ions
Second-Quarter Revenue – 1999 through 2009
PricewaterhouseCoopers LLP 6
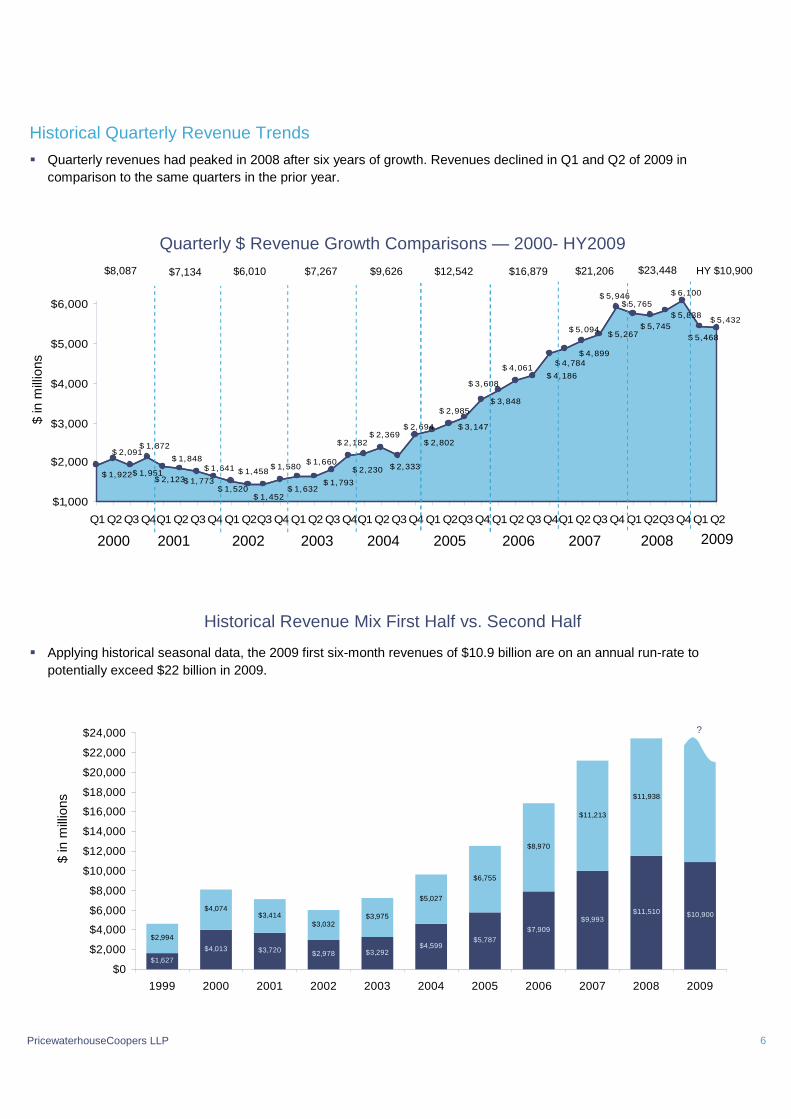
Historical Quarterly Revenue Trends Quarterly revenues had peaked in 2008 after six years of growth. Revenues declined in Q1 and Q2 of 2009 in
comparison to the same quarters in the prior year.
Applying historical seasonal data, the 2009 first six-month revenues of $10.9 billion are on an annual run-rate topotentially exceed $22 billion in 2009.
Quarterly $ Revenue Growth Comparisons — 2000- HY2009
$1,627
$4,013 $3,720 $2,978 $3,292$4,599
$5,787$7,909
$9,993$10,900
$2,994
$4,074$3,414
$3,032$3,975
$5,027
$6,755
$8,970
$11,213
$11,938
$11,510
$0
$2,000
$4,000
$6,000
$8,000
$10,000
$12,000
$14,000
$16,000
$18,000
$20,000
$22,000
$24,000
1999 2000 2001 2002 2003 2004 2005 2006 2007 2008 2009
?
Historical Revenue Mix First Half vs. Second Half
$ 4,186
$ 5,838
$ 6,100
$ 5,267
$ 5,946$ 5,765
$ 5,745
$ 4,061
$ 3,848
$ 3,608
$ 3,147
$ 2,985
$ 2,802
$ 2,694
$ 2,333
$ 2,369
$ 2,230
$ 2,182
$ 1,793
$ 1,660
$ 1,632
$ 1,580
$ 1,452
$ 1,458
$ 1,520
$ 1,641
$ 1,773
$ 1,848
$ 1,872
$ 2,123$ 1,951
$ 2,091
$ 1,922
$ 5,094
$ 4,899$ 4,784
$ 5,432
$ 5,468
$1,000
$2,000
$3,000
$4,000
$5,000
$6,000
Q1 Q2 Q3 Q4Q1 Q2 Q3 Q4 Q1 Q2Q3 Q4 Q1 Q2 Q3 Q4Q1 Q2 Q3 Q4 Q1 Q2Q3 Q4 Q1 Q2 Q3 Q4Q1 Q2 Q3 Q4 Q1 Q2Q3 Q4 Q1 Q2
$9,626 $12,542$7,267$6,010$7,134$8,087 $16,879
2000 2001 2002 2003 2004 2005 2006 2007
$21,206
2008
$23,448
2009
HY $10,900
$in
mill
ions
$in
mill
ions
PricewaterhouseCoopers LLP 7
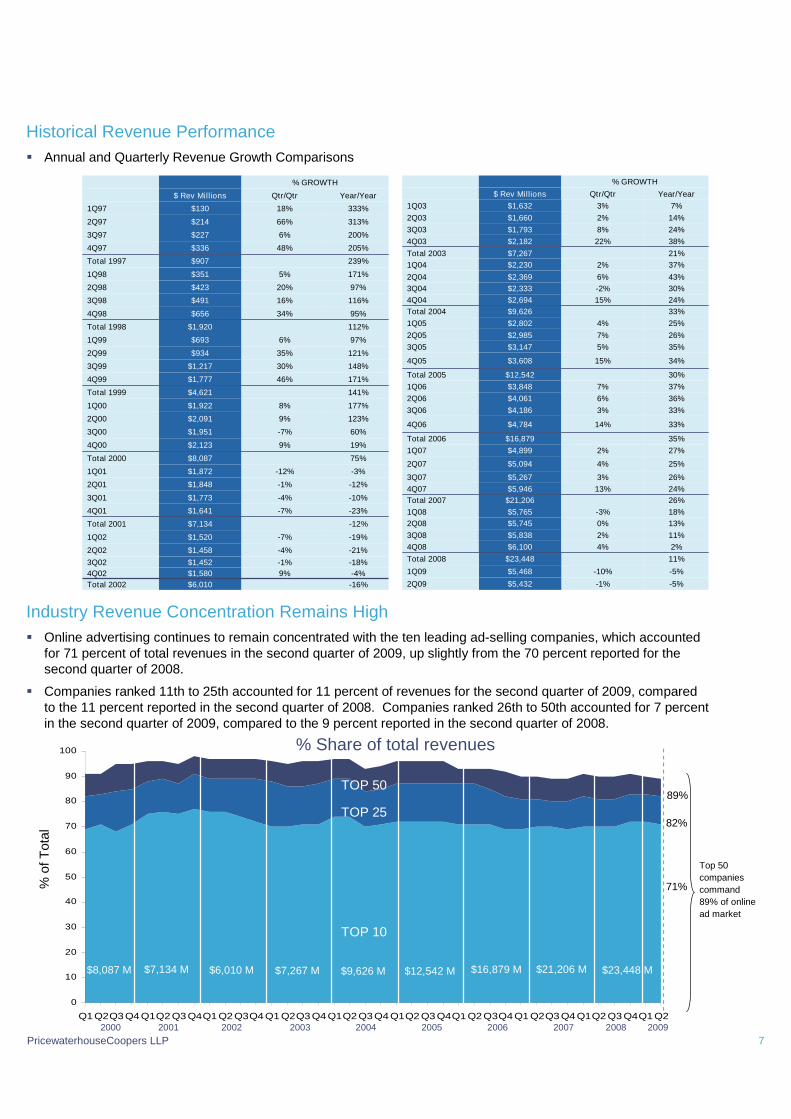
Historical Revenue Performance Annual and Quarterly Revenue Growth Comparisons
Industry Revenue Concentration Remains High Online advertising continues to remain concentrated with the ten leading ad-selling companies, which accounted
for 71 percent of total revenues in the second quarter of 2009, up slightly from the 70 percent reported for thesecond quarter of 2008.
Companies ranked 11th to 25th accounted for 11 percent of revenues for the second quarter of 2009, comparedto the 11 percent reported in the second quarter of 2008. Companies ranked 26th to 50th accounted for 7 percentin the second quarter of 2009, compared to the 9 percent reported in the second quarter of 2008.
% GROWTH
$ Rev Millions Qtr/Qtr Year/Year
1Q97 $130 18% 333%
2Q97 $214 66% 313%
3Q97 $227 6% 200%
4Q97 $336 48% 205%
Total 1997 $907 239%
1Q98 $351 5% 171%
2Q98 $423 20% 97%
3Q98 $491 16% 116%
4Q98 $656 34% 95%
Total 1998 $1,920 112%
1Q99 $693 6% 97%
2Q99 $934 35% 121%
3Q99 $1,217 30% 148%
4Q99 $1,777 46% 171%
Total 1999 $4,621 141%
1Q00 $1,922 8% 177%
2Q00 $2,091 9% 123%
3Q00 $1,951 -7% 60%
4Q00 $2,123 9% 19%
Total 2000 $8,087 75%
1Q01 $1,872 -12% -3%
2Q01 $1,848 -1% -12%
3Q01 $1,773 -4% -10%
4Q01 $1,641 -7% -23%
Total 2001 $7,134 -12%
1Q02 $1,520 -7% -19%
2Q02 $1,458 -4% -21%
3Q02 $1,452 -1% -18%4Q02 $1,580 9% -4%Total 2002 $6,010 -16% -5%-1%$5,4322Q09
7%3%$1,6321Q0314%2%$1,6602Q0324%8%$1,7933Q0338%22%$2,1824Q03
-5%-10%$5,4681Q09
11%$23,448Total 2008
% GROWTH
$ Rev Millions Qtr/Qtr Year/Year
Total 2003 $7,267 21%1Q04 $2,230 2% 37%
2Q04 $2,369 6% 43%3Q04 $2,333 -2% 30%4Q04 $2,694 15% 24%Total 2004 $9,626 33%1Q05 $2,802 4% 25%2Q05 $2,985 7% 26%3Q05 $3,147 5% 35%
4Q05 $3,608 15% 34%
Total 2005 $12,542 30%1Q06 $3,848 7% 37%2Q06 $4,061 6% 36%3Q06 $4,186 3% 33%
4Q06 $4,784 14% 33%
Total 2006 $16,879 35%1Q07 $4,899 2% 27%
2Q07 $5,094 4% 25%
3Q07 $5,267 3% 26%4Q07 $5,946 13% 24%Total 2007 $21,206 26%1Q08 $5,765 -3% 18%2Q08 $5,745 0% 13%3Q08 $5,838 2% 11%4Q08 $6,100 4% 2%
0
10
20
30
40
50
60
70
80
90
100
Q1 Q2Q3 Q4 Q1Q2 Q3 Q4Q1 Q2 Q3Q4 Q1 Q2Q3 Q4 Q1Q2 Q3 Q4 Q1Q2 Q3 Q4Q1 Q2 Q3Q4 Q1 Q2Q3 Q4 Q1Q2 Q3 Q4Q1 Q2
TOP 50
TOP 25
TOP 10
Top 50companiescommand89% of onlinead market
89%
82%
71%%of
Tot
al
$8,087 M $7,134 M $6,010 M $7,267 M $9,626 M $12,542 M $16,879 M
2000 2001 2002 2003 2004 2005 2006 2007 2008 2009
$21,206 M $23,448 M
% Share of total revenues
PricewaterhouseCoopers LLP 8
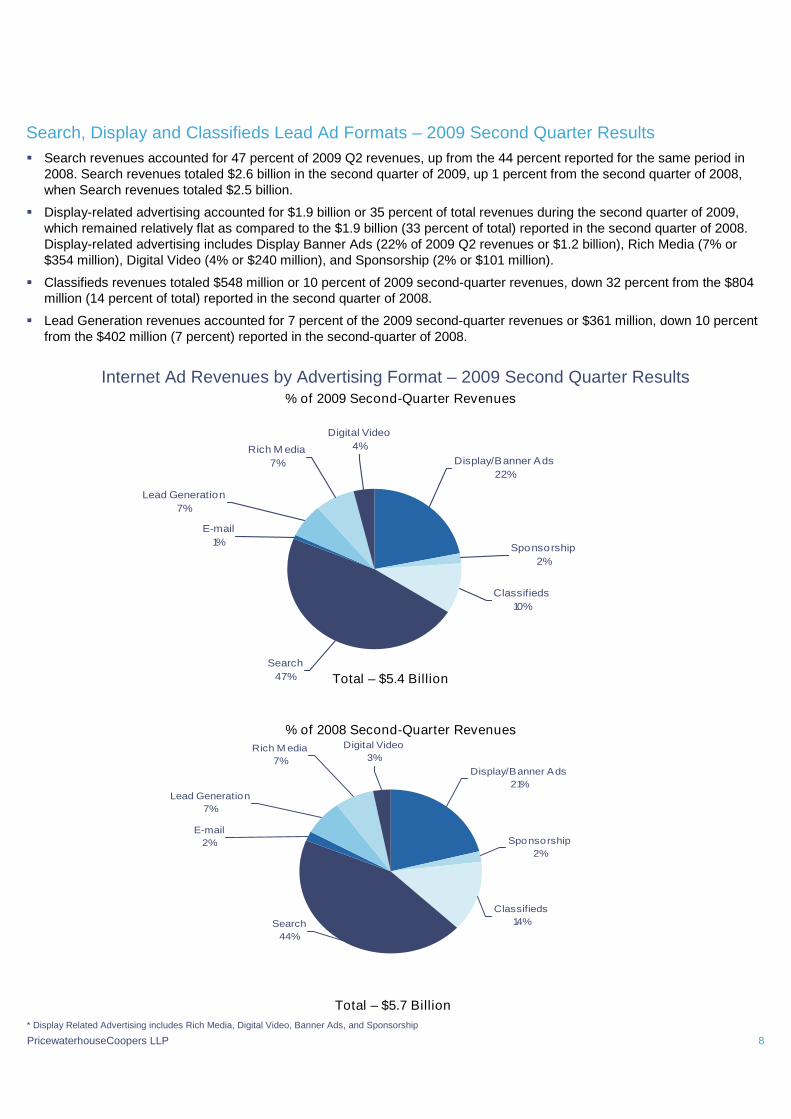
Search, Display and Classifieds Lead Ad Formats – 2009 Second Quarter Results Search revenues accounted for 47 percent of 2009 Q2 revenues, up from the 44 percent reported for the same period in
2008. Search revenues totaled $2.6 billion in the second quarter of 2009, up 1 percent from the second quarter of 2008,when Search revenues totaled $2.5 billion.
Display-related advertising accounted for $1.9 billion or 35 percent of total revenues during the second quarter of 2009,which remained relatively flat as compared to the $1.9 billion (33 percent of total) reported in the second quarter of 2008.Display-related advertising includes Display Banner Ads (22% of 2009 Q2 revenues or $1.2 billion), Rich Media (7% or$354 million), Digital Video (4% or $240 million), and Sponsorship (2% or $101 million).
Classifieds revenues totaled $548 million or 10 percent of 2009 second-quarter revenues, down 32 percent from the $804million (14 percent of total) reported in the second quarter of 2008.
Lead Generation revenues accounted for 7 percent of the 2009 second-quarter revenues or $361 million, down 10 percentfrom the $402 million (7 percent) reported in the second-quarter of 2008.
Internet Ad Revenues by Advertising Format – 2009 Second Quarter Results
Search47%
E-mail1%
Lead Generation7%
Rich M edia7%
Digital Video4%
Display/Banner Ads22%
Sponsorship2%
Classifieds10%
Total – $5.4 Billion
% of 2009 Second-Quarter Revenues
E-mail2%
Lead Generation7%
Rich M edia7%
Digital Video3%
Display/Banner Ads21%
Sponsorship2%
Classifieds14%Search
44%
Total – $5.7 Billion
% of 2008 Second-Quarter Revenues
* Display Related Advertising includes Rich Media, Digital Video, Banner Ads, and Sponsorship
PricewaterhouseCoopers LLP
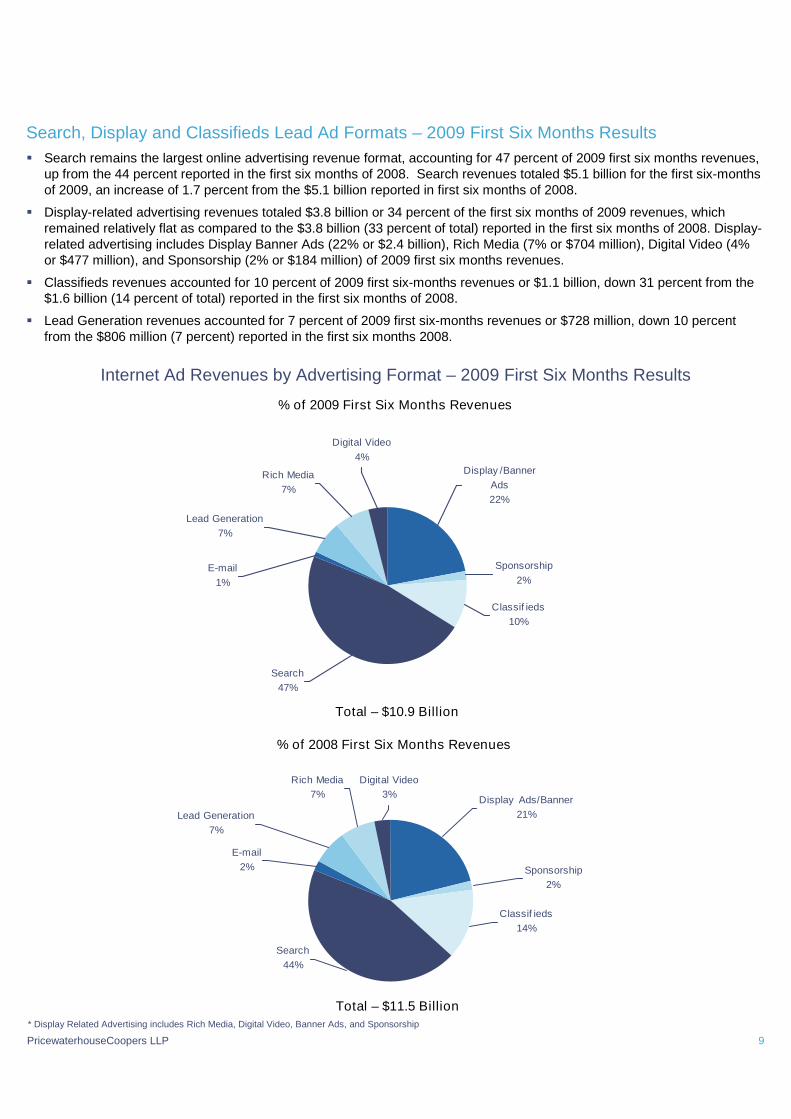
Search, Display and Classifieds Lead Ad Formats – 2009 First Six Months Results Search remains the largest online advertising revenue format, accounting for 47 percent of 2009 first six months revenues,
up from the 44 percent reported in the first six months of 2008. Search revenues totaled $5.1 billion for the first six-monthsof 2009, an increase of 1.7 percent from the $5.1 billion reported in first six months of 2008.
Display-related advertising revenues totaled $3.8 billion or 34 percent of the first six months of 2009 revenues, whichremained relatively flat as compared to the $3.8 billion (33 percent of total) reported in the first six months of 2008. Display-related advertising includes Display Banner Ads (22% or $2.4 billion), Rich Media (7% or $704 million), Digital Video (4%or $477 million), and Sponsorship (2% or $184 million) of 2009 first six months revenues.
Classifieds revenues accounted for 10 percent of 2009 first six-months revenues or $1.1 billion, down 31 percent from the$1.6 billion (14 percent of total) reported in the first six months of 2008.
Lead Generation revenues accounted for 7 percent of 2009 first six-months revenues or $728 million, down 10 percentfrom the $806 million (7 percent) reported in the first six months 2008.
9
Sponsorship2%
Classif ieds14%
Search44%
E-mail2%
Rich Media7%
Lead Generation7%
Digital Video3% Display Ads/Banner
21%
Internet Ad Revenues by Advertising Format – 2009 First Six Months Results
Classif ieds10%
Sponsorship2%
Display /BannerAds22%
Digital Video4%
Rich Media7%
Lead Generation7%
E-mail1%
Search47%
Total – $10.9 Billion
% of 2009 First Six Months Revenues
Total – $11.5 Billion
% of 2008 First Six Months Revenues
* Display Related Advertising includes Rich Media, Digital Video, Banner Ads, and Sponsorship
PricewaterhouseCoopers LLP
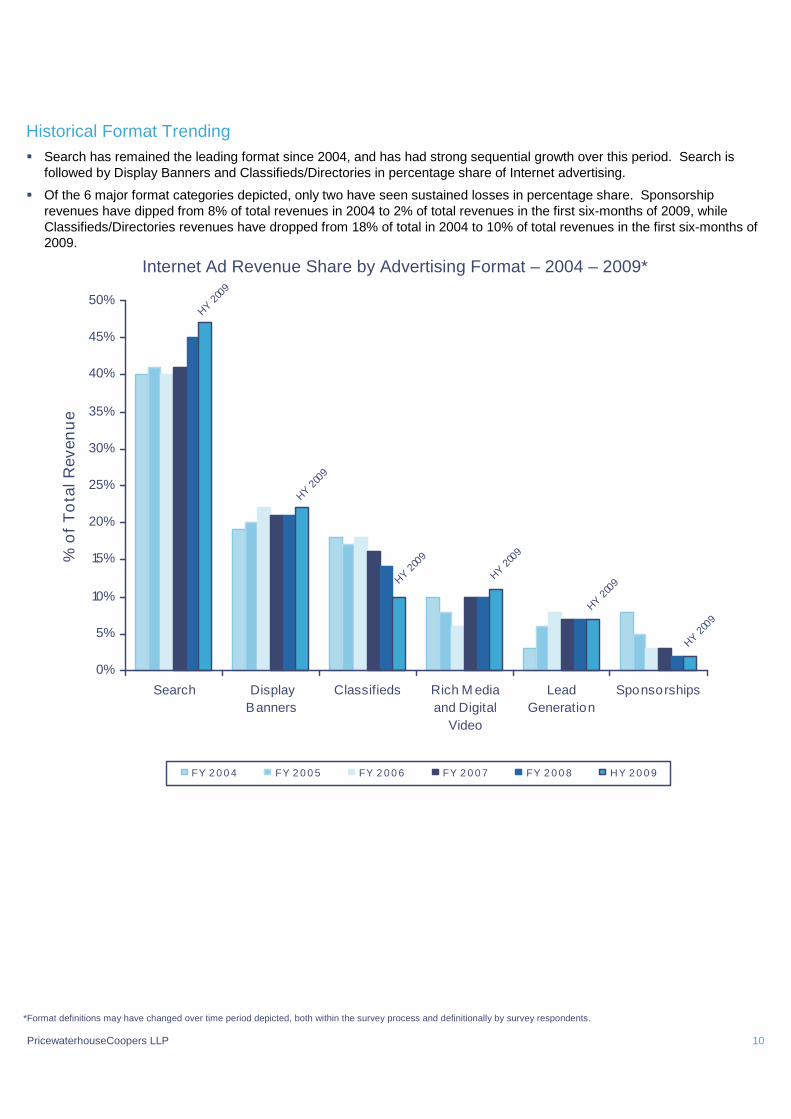
Historical Format Trending Search has remained the leading format since 2004, and has had strong sequential growth over this period. Search is
followed by Display Banners and Classifieds/Directories in percentage share of Internet advertising.
Of the 6 major format categories depicted, only two have seen sustained losses in percentage share. Sponsorshiprevenues have dipped from 8% of total revenues in 2004 to 2% of total revenues in the first six-months of 2009, whileClassifieds/Directories revenues have dropped from 18% of total in 2004 to 10% of total revenues in the first six-months of2009.
10
HY20
09
HY20
09
HY20
09HY
2009
HY20
09
HY20
09
0%
5%
10%
15%
20%
25%
30%
35%
40%
45%
50%
Search DisplayBanners
Classifieds Rich M ediaand Digital
Video
LeadGeneration
Sponsorships
%o
fT
ota
lRev
enu
e
FY 2 0 0 4 FY 2 0 0 5 FY 2 0 0 6 FY 2 0 0 7 FY 2 0 0 8 HY 2 0 0 9
Internet Ad Revenue Share by Advertising Format – 2004 – 2009*
*Format definitions may have changed over time period depicted, both within the survey process and definitionally by survey respondents.
PricewaterhouseCoopers LLP
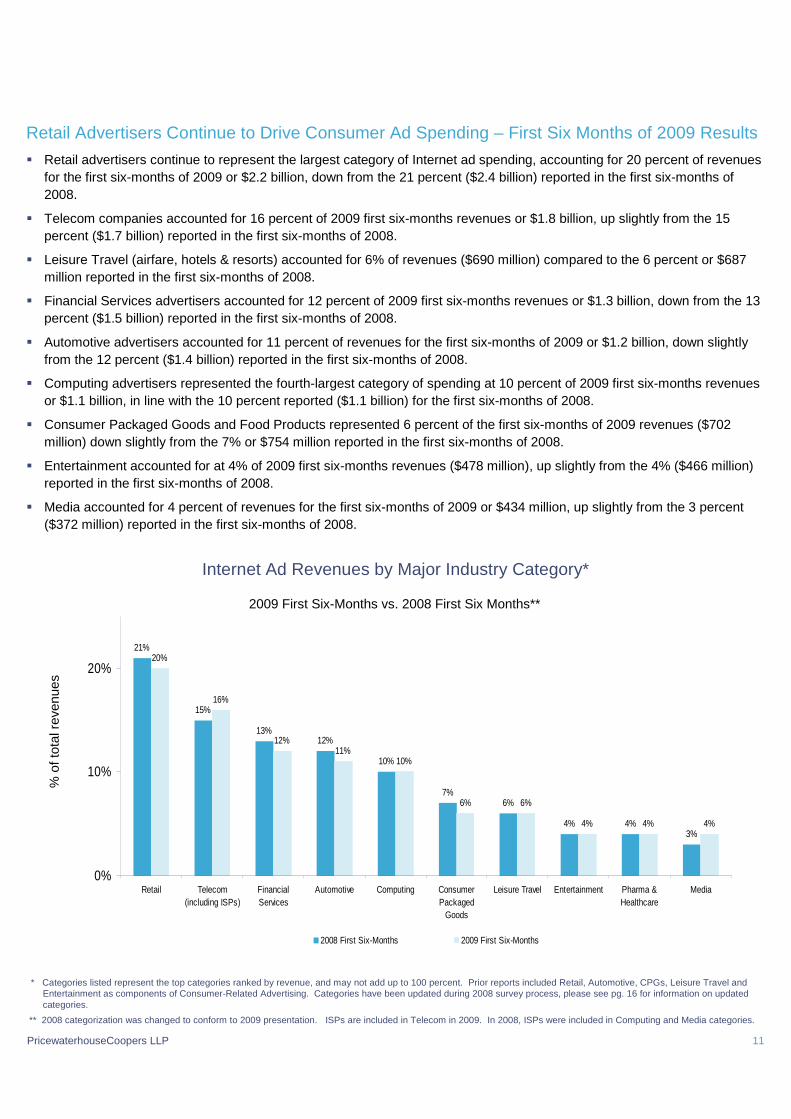
Retail Advertisers Continue to Drive Consumer Ad Spending – First Six Months of 2009 Results Retail advertisers continue to represent the largest category of Internet ad spending, accounting for 20 percent of revenues
for the first six-months of 2009 or $2.2 billion, down from the 21 percent ($2.4 billion) reported in the first six-months of2008.
Telecom companies accounted for 16 percent of 2009 first six-months revenues or $1.8 billion, up slightly from the 15percent ($1.7 billion) reported in the first six-months of 2008.
Leisure Travel (airfare, hotels & resorts) accounted for 6% of revenues ($690 million) compared to the 6 percent or $687million reported in the first six-months of 2008.
Financial Services advertisers accounted for 12 percent of 2009 first six-months revenues or $1.3 billion, down from the 13percent ($1.5 billion) reported in the first six-months of 2008.
Automotive advertisers accounted for 11 percent of revenues for the first six-months of 2009 or $1.2 billion, down slightlyfrom the 12 percent ($1.4 billion) reported in the first six-months of 2008.
Computing advertisers represented the fourth-largest category of spending at 10 percent of 2009 first six-months revenuesor $1.1 billion, in line with the 10 percent reported ($1.1 billion) for the first six-months of 2008.
Consumer Packaged Goods and Food Products represented 6 percent of the first six-months of 2009 revenues ($702million) down slightly from the 7% or $754 million reported in the first six-months of 2008.
Entertainment accounted for at 4% of 2009 first six-months revenues ($478 million), up slightly from the 4% ($466 million)reported in the first six-months of 2008.
Media accounted for 4 percent of revenues for the first six-months of 2009 or $434 million, up slightly from the 3 percent($372 million) reported in the first six-months of 2008.
11
21%
15%
13%12%
10%
7%6%
4% 4%3%
20%
16%
12%11%
10%
6% 6%
4% 4% 4%
0%
10%
20%
Retail Telecom(including ISPs)
FinancialServices
Automotive Computing ConsumerPackaged
Goods
Leisure Travel Entertainment Pharma &Healthcare
Media
2008 First Six-Months 2009 First Six-Months
Internet Ad Revenues by Major Industry Category*
2009 First Six-Months vs. 2008 First Six Months**
%of
tota
lrev
enue
s
** 2008 categorization was changed to conform to 2009 presentation. ISPs are included in Telecom in 2009. In 2008, ISPs were included in Computing and Media categories.
* Categories listed represent the top categories ranked by revenue, and may not add up to 100 percent. Prior reports included Retail, Automotive, CPGs, Leisure Travel andEntertainment as components of Consumer-Related Advertising. Categories have been updated during 2008 survey process, please see pg. 16 for information on updatedcategories.
PricewaterhouseCoopers LLP 12
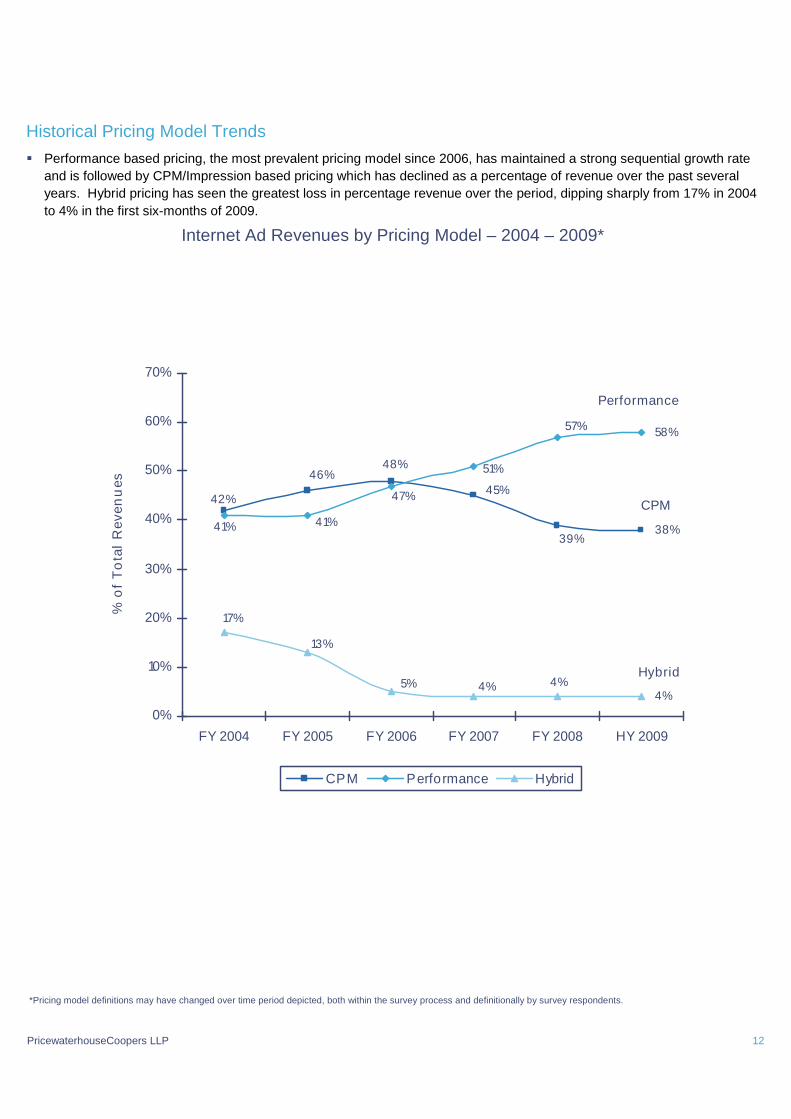
Historical Pricing Model Trends Performance based pricing, the most prevalent pricing model since 2006, has maintained a strong sequential growth rate
and is followed by CPM/Impression based pricing which has declined as a percentage of revenue over the past severalyears. Hybrid pricing has seen the greatest loss in percentage revenue over the period, dipping sharply from 17% in 2004to 4% in the first six-months of 2009.
Internet Ad Revenues by Pricing Model – 2004 – 2009*
*Pricing model definitions may have changed over time period depicted, both within the survey process and definitionally by survey respondents.
38%
4%
45%46%
48%
42%
39%
58%57%
51%
41%
47%
41%
13%
5%
17%
4% 4%
0%
10%
20%
30%
40%
50%
60%
70%
FY 2004 FY 2005 FY 2006 FY 2007 FY 2008 HY 2009
%o
fT
ota
lR
even
ues
CPM Performance Hybrid
Hybrid
Performance
CPM
PricewaterhouseCoopers LLP
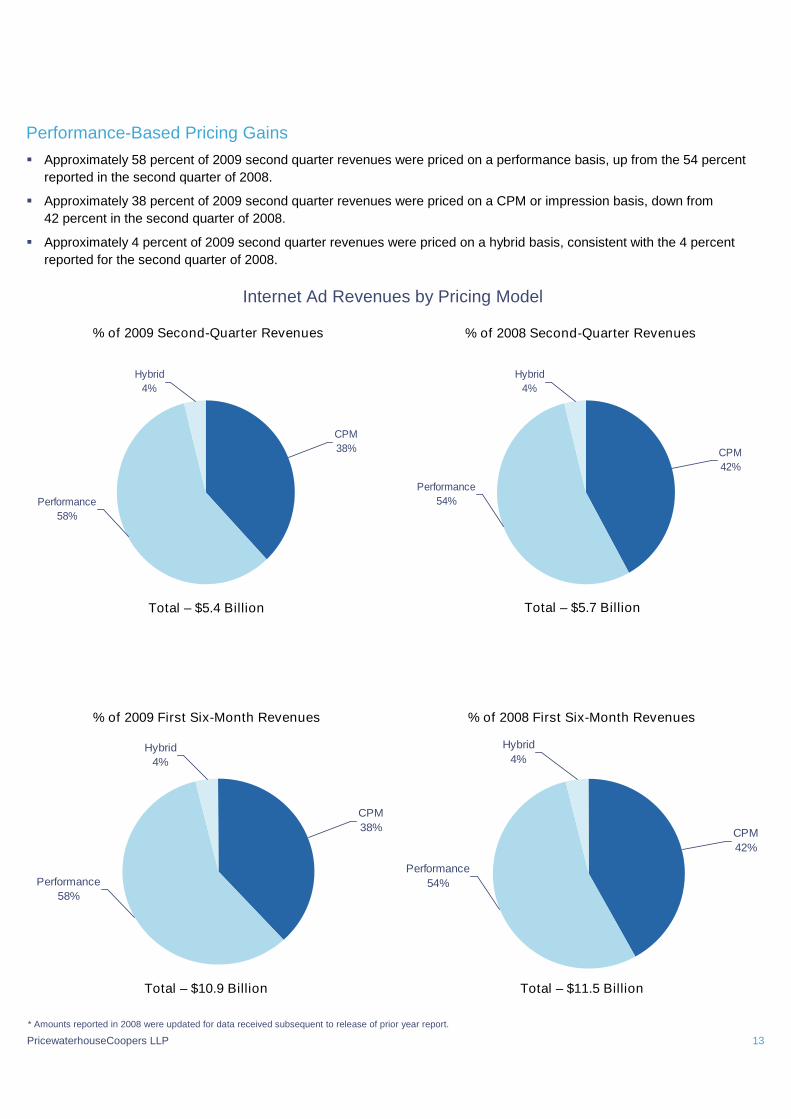
Performance-Based Pricing Gains Approximately 58 percent of 2009 second quarter revenues were priced on a performance basis, up from the 54 percent
reported in the second quarter of 2008.
Approximately 38 percent of 2009 second quarter revenues were priced on a CPM or impression basis, down from42 percent in the second quarter of 2008.
Approximately 4 percent of 2009 second quarter revenues were priced on a hybrid basis, consistent with the 4 percentreported for the second quarter of 2008.
13
CPM42%
Hybrid4%
Performance54%
% of 2008 First Six-Month Revenues
CPM38%
Hybrid4%
Performance58%
Internet Ad Revenues by Pricing Model
CPM38%
Hybrid4%
Performance58%
% of 2008 Second-Quarter Revenues
Total – $5.7 Billion
Total – $11.5 Billion
% of 2009 Second-Quarter Revenues
% of 2009 First Six-Month Revenues
Total – $5.4 Billion
Total – $10.9 Billion
CPM42%
Hybrid4%
Performance54%
* Amounts reported in 2008 were updated for data received subsequent to release of prior year report.
PricewaterhouseCoopers LLP 14
Appendix
Definitions of Leading Industry CategoriesThe industry categories used in the IAB Internet Advertising Revenue Report were sourced fromthe North American Standard Industrial Classification (SIC) Manual.†
Retail—includes mail order/catalog, apparel, restaurants/fast food, home furnishings/textiles,
toys, pet food/supplies, appliances, jewelry, drug stores, retail stores and cosmetics.
Automotive—includes all automotive-related categories including sale/purchase of vehiclesand parts and maintenance.
Entertainment—includes film, music, TV, box office, video games and amusement &recreation.
Consumer Packaged Goods—includes packaged goods, food products, householdproducts and tobacco.
Leisure Travel—includes travel, hotel, airlines and resorts.
Computing Products—includes hardware (computers, computer storage devices, andcomputer peripheral equipment), consumer electronics, prepackaged software (operating, utilityand applications programs), local area network systems and network systems integration,computer processing and data preparation and data processing services.
Financial Services—includes commercial banks, credit agencies, personal credit institutions,consumer finance companies, loan companies, business credit institutions and credit cardagencies. Also includes companies engaged in the underwriting, purchase, sale or brokerage ofsecurities and other financial contracts.
Telecommunications—includes point-to-point communications services, including telephonevoice and data communications, two-way mobile/cellular communications services and othernon-vocal message communications services (e.g., cablegram, electronic mail and facsimile).Includes multi-channel video providers on a subscription fee basis (e.g., cable television,wireless cable television and direct broadcast satellite services).
Media—includes establishments primarily engaged in radio and television broadcasting(network and station) including commercial, religious, educational and other radio or televisionstations. Also includes establishments primarily engaged in publishing newspapers, periodicalsand books.
†Survey participants reported results based on the 21 industry categories listed on page 17, whichwere used specifically for the IAB Internet Advertising Revenue Report. This is consistent with otherrelevant industry categorization sources that measure advertising spending by industry. Forpurposes of this report, PricewaterhouseCoopers classified a number of individual categories under“Retail.”
PricewaterhouseCoopers LLP 15
Definitions of Advertising Formats
Display Advertising (Banner Ads)—advertiser pays an Internet company for space to display a static or hyper-linkedbanner or logo on one or more of the Internet company’s pages.
Sponsorship—represents custom content and/or experiences created for an advertiser which may or may not include adelements such as display advertising, brand logos, advertorial or pre-roll video. Sponsorships fall into several categories:
Spotlights are custom built pages incorporating an advertiser’s brand and housing a collection of content usually around atheme;
Advergaming can range from an advertiser buying all the ad units around a game or a “sponsored by” link to creating acustom branded game experience;
Content & Section Sponsorship is when an advertiser exclusively sponsors a particular section of the site or email (usuallyexisting content) re-skinned with the advertiser’s branding;
Sweepstakes & Contests can range from branded sweepstakes on the site to a full-fledge branded contest withsubmissions and judging
E-mail—banner ads, links or advertiser sponsorships that appear in e-mail newsletters, e-mail marketing campaigns andother commercial e-mail communications. Includes all types of electronic mail (e.g., basic text or HTML-enabled).
Search—fees advertisers pay Internet companies to list and/or link their company site domain name to a specific searchword or phrase (includes paid search revenues). Search categories include:
Paid listings—text links appear at the top or side of search results for specific keywords. The more a marketer pays, thehigher the position it gets. Marketers only pay when a user clicks on the text link.
Contextual search—text links appear in an article based on the context of the content, instead of a user-submittedkeyword. Payment only occurs when the link is clicked.
Paid inclusion—guarantees that a marketer’s URL is indexed by a search engine. The listing is determined by theengine's search algorithms.
Site optimization—modifies a site to make it easier for search engines to automatically index the site and hopefully resultin better placement in results.
Lead Generation—fees advertisers pay to Internet advertising companies that refer qualified purchase inquiries (e.g., autodealers which pay a fee in exchange for receiving a qualified purchase inquiry online) or provide consumer information(demographic, contact, behavioral) where the consumer opts into being contacted by a marketer (email, postal, telephone,fax). These processes are priced on a performance basis (e.g., cost-per-action, -lead or -inquiry), and can include userapplications (e.g., for a credit card), surveys, contests (e.g., sweepstakes) or registrations.
Classifieds and auctions—fees advertisers pay Internet companies to list specific products or services (e.g., online jobboards and employment listings, real estate listings, automotive listings, auction-based listings, yellow pages).
Rich media—advertisements that incorporate animation, sound, and/or interactivity in any format. It can be used eithersingularly or in combination with the following technologies: sound, Flash, and with programming languages such as Java,JavaScript, and DHTML. It is deployed via standard Web and wireless applications including e-mail, static (e.g. .html) anddynamic (e.g. .asp) Web pages, and may appear in ad formats such as banners, buttons and interstitials. Interstitials areincluded in the rich media category and represent full- or partial-page text and image server-push advertisements whichappear in the transition between two pages of content. Forms of interstitials can include splash screens, page takeovers andpop-up windows.
Digital Video Commercials—TV-like advertisements that may appear as in-page video commercials or before, during,and/or after a variety of content in a player environment including but not limited to, streaming video, animation, gaming, andmusic video content. This definition includes digital video commercials that appear in live, archived and downloadablestreaming content.
PricewaterhouseCoopers LLP 16
Survey ScopeThe Interactive Advertising Bureau (IAB) retained PricewaterhouseCoopers to establish a comprehensive standard formeasuring the growth of Internet/online advertising revenues.
The IAB Internet Advertising Revenue Report is part of an ongoing IAB mission to provide an accurate barometer ofInternet advertising growth.
To achieve differentiation from existing estimates and accomplish industry-wide acceptance, key aspects of the surveyinclude:
– Obtaining historical data directly from companies generating Internet/online advertising revenues;
– Making the survey as inclusive as possible, encompassing all forms of Internet/online advertising, including Web sites,consumer online services, ad networks and e-mail providers; and
– Ensuring and maintaining a confidential process, only releasing aggregate data.
Methodology PricewaterhouseCoopers:
– Compiles a database of industry participants selling Internet/online advertising revenues.
– Conducts a quantitative mailing survey with leading industry players, including Web publishers, ad networks,commercial online service providers, e-mail providers and other online media companies.
– Supplemental Data is acquired through the use of publicly disclosed information
– Requests and compiles several specific data items, including monthly gross commissionable advertising revenue byindustry category and transaction.
– Identifies non-participating companies and applies a conservative revenue estimate based on available public sources.
– Analyzes the findings, identifies and reports key trends.
– The 2001 and 2000 full-year revenue data were adjusted to reflect revenue restatements reported in public filings byseveral individual companies. Those reported restatements totaled $77 million in 2001 and $138 million in 2000.Historical industry revenue figures are now adjusted to $7.134 billion in 2001 and $8.087 billion in 2000.
Survey Industry CategoriesAutomotive
Beer/Wine/Liquor
Business Products/Services
Computers (Hardware/Software) andConsumer Electronics
Consumer Packaged Goods, Food, Non-Alcoholic Beverages and Candy
Educational Services
Entertainment (Film, Music, TV, BoxOffice, Video Games,Amusement/Recreational)
Financial Services (Banks, Insurance,Securities, Mortgages)
Personal Care, Toiletries and Cosmetics
Drugs and Remedies
Manufacturing
Media
Professional Sports and Sporting &Athletic Goods
Real Estate
Restaurants/ Fast food
Retail, Mail Order, Catalogs and Apparel
Telecommunications: Telephony,Cable/Satellite TV Services, ISPs
Toys/Games
Leisure Travel (Airfare, Hotels, Resorts)
Business Travel (Airfare, Hotels, Resorts)
PricewaterhouseCoopers LLP 17
Overall Report Guidance Provided by IAB Leadership
About the Interactive Advertising BureauThe Interactive Advertising Bureau (IAB) is comprised of more than 375 leading media and technology companies who are responsible forselling 86% of online advertising in the United States. On behalf of its members, the IAB is dedicated to the growth of the interactiveadvertising marketplace, of interactive’s share of total marketing spend, and of its members’ share of total marketing spend. The IABeducates marketers, agencies, media companies and the wider business community about the value of interactive advertising. Workingwith its member companies, the IAB evaluates and recommends standards and practices and fields critical research on interactiveadvertising. Founded in 1996, the IAB is headquartered in New York City with a Public Policy office in Washington, D.C. For moreinformation, please visit www.iab.net.
Executive CommitteeChairmanDavid Moore24/7 Real Media
Dave MorganSimulmedia Inc.
Dennis WoodsideGoogle
Steve WadsworthDisney Interactive Media Group
PresidentRandall RothenbergIAB
Tim ArmstrongAOL
Jim SpanfellerForbes.com
Vice ChairNeil AsheCBS Interactive
Martin NisenholtzNew York Times Company
Sarah ChubbConde Nast Digital
Board of DirectorsTim ArmstrongAOL
Neil AsheCBS Interactive
John BattelleFederated Media
Jeff BermanFox Interactive Media/MySpace
Bob CarriganIDG Communications
Sarah ChubbCondéNast Digital
Kevin ConroyUnivision
Greg D’AlbaCNN
Mitch Golubcars.com
Jack GriffinMeredith
Peter HoranGoodmail Systems
Scott HoweMicrosoft
Ex-Officio
Randy KilgoreTremor Media
Leon LevittCox Newspapers
Chris MaThe Washington Post Company
Dave MaddenWildTangent
Greg McCastleAT&T Converged Services
Riley McDonoughThomson Reuters
Gordon McLeodWall Street Journal Digital Network
David Moore24/7 Real Media
David MorganSimulmedia Inc.
Peter NaylorNBC Universal
Martin NisenholtzNY Times Company
Randall RothenbergInteractive Advertising Bureau
Warren SchlichtingComcast Spotlight
Vivek ShahTime Inc.
Tina SharkeyBabyCenter
Tad SmithReed Business
Jim SpanfellerForbes.com
Nada StirrattMTV Networks
Bill ToddValueClick
Steve WadsworthDisney Interactive Media Group
Mike WalrathYahoo!
Jeff WebberUSAToday
Ted WestLooksmart, Ltd.
Matt WiseQ Interactive
Dennis WoodsideGoogle
TreasurerBruce GordonDisney Interactive Media Group
SecretaryJoseph RosenbaumReed Smith LLP
Founding ChairmanRich LeFurgyArcher Advisors
PricewaterhouseCoopers LLP 18
PricewaterhouseCoopersNew Media Group
PricewaterhouseCoopers (www.pwc.com) provides industry-focused assurance, tax andadvisory services to build public trust and enhance value for its clients and stakeholders. Morethan 154,000 people in 153 countries share their thinking, experience and solutions to developfresh perspectives and practical advice.
© 2008 PricewaterhouseCoopers LLP. All rights reserved. "PricewaterhouseCoopers" refers toPricewaterhouseCoopers LLP or, as the context requires, the PricewaterhouseCoopers globalnetwork or other member firms of the network, each of which is a separate and independentlegal entity.
PricewaterhouseCoopers’ New Media Group was the first practice of its kind at a Big Four firm.Currently located in New York, Los Angeles, Boston, Seattle and the Bay Area, our New MediaGroup includes accounting, tax and consulting professionals who have broad and deepexperience in the three areas that converge to form new media: advanced telecommunications,enabling software and content development/distribution.
Our services include: Business assurance services
Web audience measurement and advertising delivery auditing and advisory
IAB Measurement Certification Compliance auditing
Privacy policy structuring, attestation and compliance advisory
Mergers & Acquisition assistance
Tax planning and compliance
Capital sourcing and IPO assistance
For information about our New Media Group, contact one of the followingPricewaterhouseCoopers LLP professionals:
New YorkDavid SilvermanPartner, Assurance [email protected]
BostonVic PetriPartner, Assurance [email protected]
Russ SapienzaPartner, Advisory [email protected]
Eric BoldSenior Manager, Assurance [email protected]
San JoseMike PearlPartner, Assurance [email protected]
SeattleSuzanne FaulknerPartner, Assurance [email protected]

pwc.com/e&m
NY-GR-08-0221-A © 2008 PricewaterhouseCoopers LLP. All rights reserved. “PricewaterhouseCoopers” refers to PricewaterhouseCoopers LLP (aDelaware limited liability partnership) or, as the context requires, the PricewaterhouseCoopers global network or other member firms of the network,each of which is a separate and independent legal entity.